refed roadmap v4
TRANSCRIPT

Roadmap to 2030: ReducingU.S. Food Waste by 50% and the ReFED Insights EngineAt-A-Glance
February 2021
Acknowledgements
This effort would not be possible without the generous support of:
Funders
Contributors
Additional funding came from:
ReFED’s Roadmap to 2030 and Insights Engine analysis draws from the input of dozens of experts and practitioners from the food industry, professional trades, solution providers, academia, and more. We have enormous appreciation for the time, expertise, and data that they contributed. Please click here for a full list of all the contributors who have helped to make these resources possible.
About ReFEDReFED is a national nonprofit working to end food loss and waste across the food system by advancing data-driven solutions to the problem. We leverage data and insights to highlight supply chain inefficiencies and economic opportunities; mobilize and connect supporters to take targeted action; and catalyze capital to spur innovation and scale high-impact initiatives. Our goal is a sustainable, resilient, and inclusive food system that optimizes environmental resources, minimizes climate impacts, and makes the best use of the food we grow. To learn more about our solutions to reduce food waste, please visit www.refed.com.
AJANA FOUNDATION
ARJAY R. & FRANCES F. MILLER FAMILY FOUNDATION
ATTICUS TRUST
HARBOURTON FOUNDATION
THE HINDAWI FOUNDATION
KENNETH GOLDMAN DONOR FUND
PETER WELLES
WIANCKO CHARITABLE FOUNDATION
ROBERT W. WILSON CHARITABLE TRUST
ANONYMOUS DONOR
THE CLANEIL FOUNDATION
CROWN FAMILY PHILANTHROPIES
THE FINK FAMILY FOUNDATION
GENERAL MILLS
POSNER FOUNDATION OF PITTSBURGH
SPRING POINT PARTNERS
WALMART FOUNDATION
Anchor Funder
In-Kind Funders
All data in this document comes from the ReFED Insights Engine, unless otherwise noted. To
download our methodologies and other related resources, please click here.
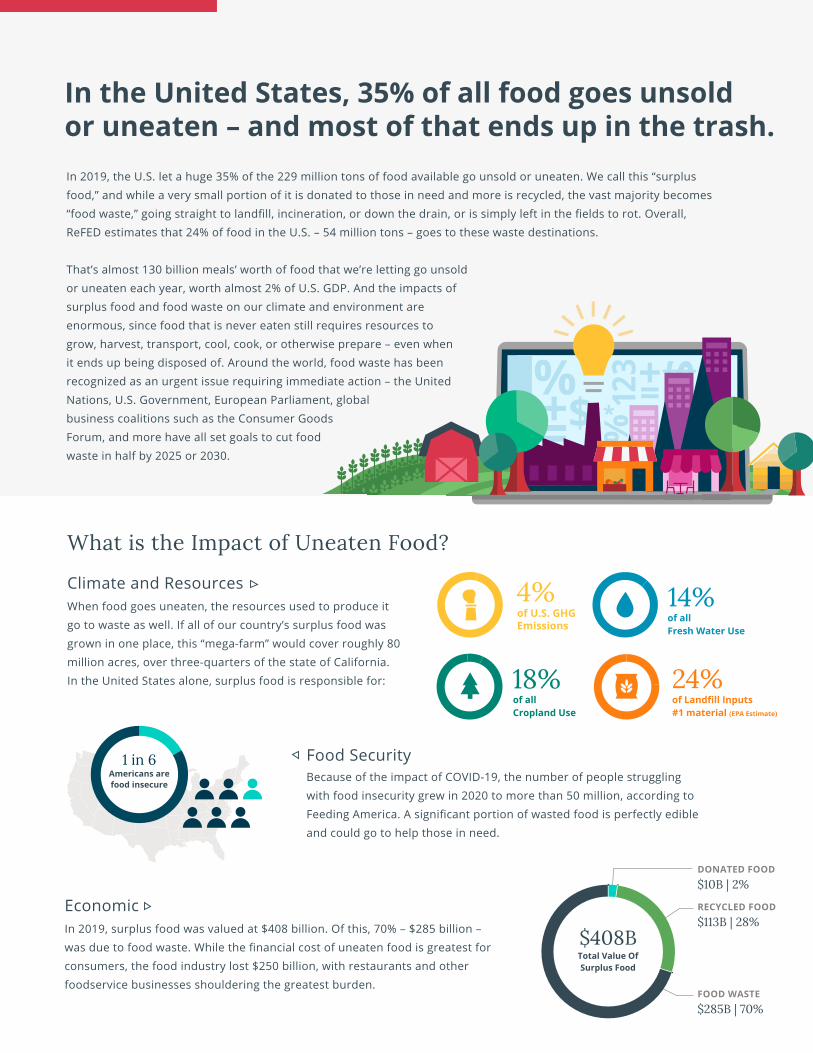
1 in 6Americans arefood insecure
Climate and Resources
In 2019, the U.S. let a huge 35% of the 229 million tons of food available go unsold or uneaten. We call this “surplus food,” and while a very small portion of it is donated to those in need and more is recycled, the vast majority becomes “food waste,” going straight to landfill, incineration, or down the drain, or is simply left in the fields to rot. Overall, ReFED estimates that 24% of food in the U.S. – 54 million tons – goes to these waste destinations.
That’s almost 130 billion meals’ worth of food that we’re letting go unsold or uneaten each year, worth almost 2% of U.S. GDP. And the impacts of surplus food and food waste on our climate and environment are enormous, since food that is never eaten still requires resources to grow, harvest, transport, cool, cook, or otherwise prepare – even when it ends up being disposed of. Around the world, food waste has been recognized as an urgent issue requiring immediate action – the United Nations, U.S. Government, European Parliament, global business coalitions such as the Consumer Goods Forum, and more have all set goals to cut food waste in half by 2025 or 2030.
In the United States, 35% of all food goes unsoldor uneaten – and most of that ends up in the trash.
What is the Impact of Uneaten Food?
When food goes uneaten, the resources used to produce it go to waste as well. If all of our country’s surplus food was grown in one place, this “mega-farm” would cover roughly 80 million acres, over three-quarters of the state of California. In the United States alone, surplus food is responsible for:
EconomicIn 2019, surplus food was valued at $408 billion. Of this, 70% – $285 billion – was due to food waste. While the financial cost of uneaten food is greatest for consumers, the food industry lost $250 billion, with restaurants and other foodservice businesses shouldering the greatest burden.
Food SecurityBecause of the impact of COVID-19, the number of people struggling with food insecurity grew in 2020 to more than 50 million, according to Feeding America. A significant portion of wasted food is perfectly edible and could go to help those in need.
of U.S. GHGEmissions
4%of all Fresh Water Use
of all Cropland Use
14%
18%of Landfill Inputs#1 material (EPA Estimate)
24%
$408BTotal Value OfSurplus Food
DONATED FOOD
$10B | 2%
RECYCLED FOOD
$113B | 28%
FOOD WASTE
$285B | 70%

Where Does Food Waste Occur?Loss and waste occur at each stage of the supply chain, with the majority happening at consumer-facing businesses and in homes. Food waste is systemic in nature, and what happens at one stage is often influenced by something that happens at another stage, either upstream or downstream. Surplus food breaks out across the supply chain as follows:
What Causes Surplus Food?The reasons for surplus food are numerous and complex across the food supply chain. But it’s important to note that the biggest causes have common-sense solutions that are ready to be implemented with the right combination of motivation, stakeholder alignment, and funding.
COVID-19’s Impact on Food WasteCOVID-19 has upended our food system, and its effects have been felt across the entire supply chain. While there are no firm
numbers yet, initial estimates – along with anecdotal evidence – suggest an increase in food waste in 2020. The forced closures of
foodservice businesses and a surge in consumer demand at the retail level in the early days of the pandemic caused barriers and
bottlenecks in the normal flow of products. Suddenly, there were huge quantities of produce and other perishable goods with
nowhere to go, as products meant for wholesale foodservice distribution could not easily be repurposed to grocery.
The meatpacking and food processing sectors were hit especially hard with COVID-19 outbreaks and have had continuously high
disruption levels since. Rapidly changing customer patterns made it difficult for retailers to accurately order the correct amounts of
stock. Foodservice businesses remain among the hardest hit, as mandated lockdowns and ongoing customer apprehension over
safety have led to huge decreases in business, meaning no outlet for the many products, such as gourmet seafood, that tend to be
used more by restaurants than in homes.
NOT HARVESTED 13.9MEXCESS 18.8MTRIMMING & BYPRODUCTS 19.3M
SPOILED 11.4MDATE LABEL CONCERNS 8MMISTAKES & MALFUNCTIONS 3.8MFOOD SAFETY 2.1MOTHER 1.9MBUYER REJECTION 1.4M
Learn More
80.6MSurplus Food
Tons
HOMESMANUFACTURING CONSUMER-FACING BUSINESSESFARMS
37% | $158B14% | $35B 28% | $201B21% | $14B30M Tons11M Tons 23M Tons17M Tons
RETAIL 10M Tons | 43% | $37M
FULL SERVICE RESTAURANTS 5M Tons | 22% | $87MLIMITED SERVICE RESTAURANTS 3M Tons | 13% | $26MOTHER FOODSERVICE* 4M Tons | 17% | $39M
CONSUMER-FACING BUSINESSES INCLUDE:
OTHER 1M Tons | 4% | $12M
*Other Foodservice Includes Healthcare, Assisted Living, Military, and Other
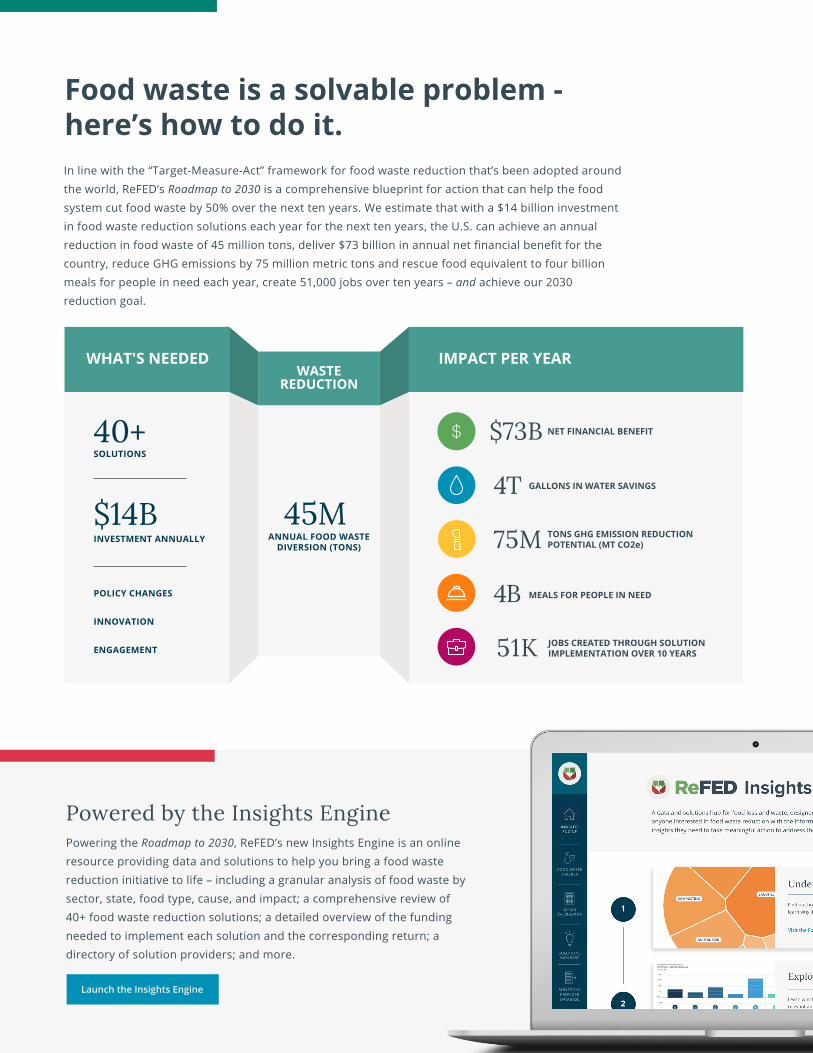
Food waste is a solvable problem - here’s how to do it.In line with the “Target-Measure-Act” framework for food waste reduction that’s been adopted around the world, ReFED’s Roadmap to 2030 is a comprehensive blueprint for action that can help the food system cut food waste by 50% over the next ten years. We estimate that with a $14 billion investment in food waste reduction solutions each year for the next ten years, the U.S. can achieve an annual reduction in food waste of 45 million tons, deliver $73 billion in annual net financial benefit for the country, reduce GHG emissions by 75 million metric tons and rescue food equivalent to four billion meals for people in need each year, create 51,000 jobs over ten years – and achieve our 2030 reduction goal.
Powered by the Insights EnginePowering the Roadmap to 2030, ReFED’s new Insights Engine is an online resource providing data and solutions to help you bring a food waste reduction initiative to life – including a granular analysis of food waste by sector, state, food type, cause, and impact; a comprehensive review of 40+ food waste reduction solutions; a detailed overview of the funding needed to implement each solution and the corresponding return; a directory of solution providers; and more.
GALLONS IN WATER SAVINGS4T
TONS GHG EMISSION REDUCTION POTENTIAL (MT CO2e)75M
JOBS CREATED THROUGH SOLUTION IMPLEMENTATION OVER 10 YEARS51K
MEALS FOR PEOPLE IN NEED4B
NET FINANCIAL BENEFIT$73B
ANNUAL FOOD WASTEDIVERSION (TONS)
45M
40+SOLUTIONS
$14BINVESTMENT ANNUALLY
POLICY CHANGES
INNOVATION
ENGAGEMENT
IMPACT PER YEARWHAT'S NEEDEDWASTE
REDUCTION
Launch the Insights Engine
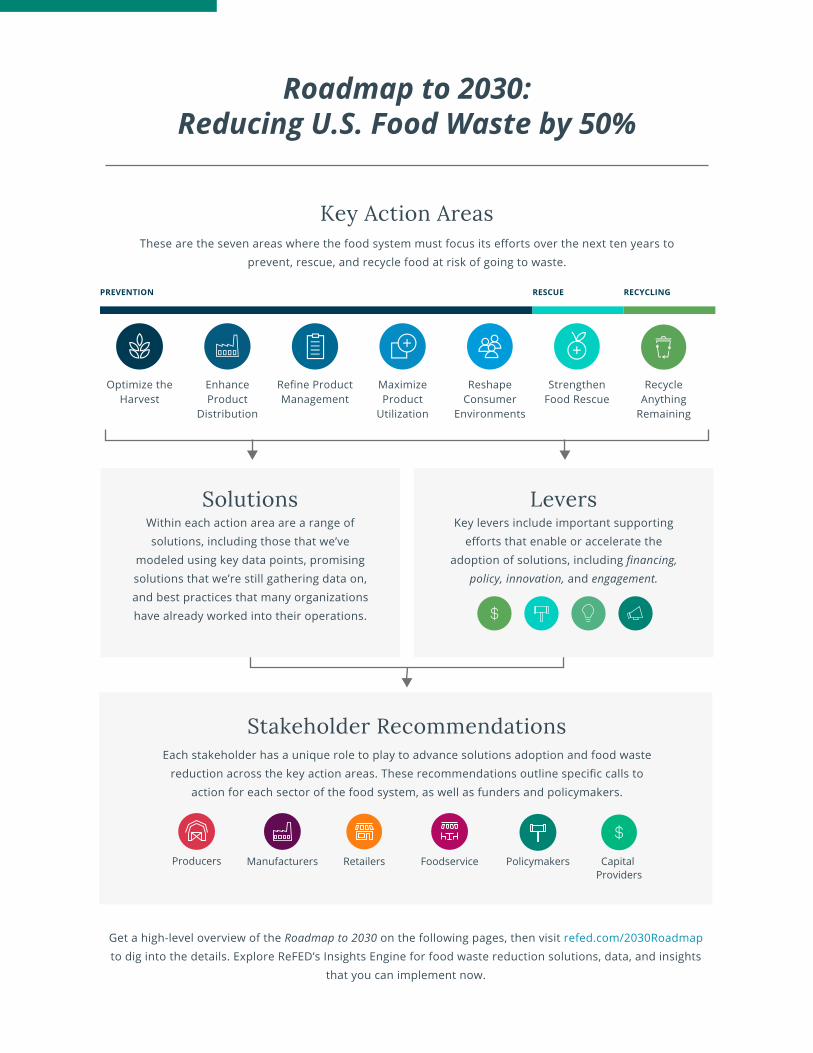
Key Action AreasThese are the seven areas where the food system must focus its efforts over the next ten years to
prevent, rescue, and recycle food at risk of going to waste.
Get a high-level overview of the Roadmap to 2030 on the following pages, then visit refed.com/2030Roadmap to dig into the details. Explore ReFED’s Insights Engine for food waste reduction solutions, data, and insights
that you can implement now.
Optimize the Harvest
Enhance Product
Distribution
Refine Product Management
Maximize Product
Utilization
Reshape Consumer
Environments
Strengthen Food Rescue
Recycle Anything
Remaining
PREVENTION RESCUE RECYCLING
Stakeholder Recommendations
Producers PolicymakersFoodserviceManufacturers Retailers CapitalProviders
Each stakeholder has a unique role to play to advance solutions adoption and food waste reduction across the key action areas. These recommendations outline specific calls to
action for each sector of the food system, as well as funders and policymakers.
Solutions LeversWithin each action area are a range of solutions, including those that we’ve
modeled using key data points, promising solutions that we’re still gathering data on, and best practices that many organizations have already worked into their operations.
Key levers include important supporting efforts that enable or accelerate the
adoption of solutions, including financing,
policy, innovation, and engagement.
Roadmap to 2030:Reducing U.S. Food Waste by 50%

A focus on these seven areas can make a meaningful reduction in the amount of food going to waste across the food supply chain. We’ve placed an emphasis on prevention-related action areas, as they typically have the greatest financial and environmental impact compared to the investment required, yet have received less attention than rescue and recycling in the past.
Key Action Areas
$8B
Optimize the Harvest
Avoid overproduction, then harvest as much as possible. For wild-caught products, source only what is needed.
Imperfect & Surplus Produce Channels
Buyer Specification Expansion
Gleaning
Partial Order Acceptance
$5.1B Net Financial Benefit
$2.7B Net Financial Benefit
$152M Net Financial Benefit
$78.8M Net Financial Benefit
2.9M Food Waste Tons Diverted
667.6K Food Waste Tons Diverted
78.5K Food Waste Tons Diverted
38.6K Food Waste Tons Diverted
NET FINANCIAL BENEFIT
3.7MFOOD WASTE TONS DIVERTED
$699.1MINVESTMENT NEEDED
0MEALS SAVED
466KMTCO2e REDUCTION
111.8BGALLONS WATER SAVED
KEYINDICATORS(ANNUAL)
Dive into this Key Action Area
4 Modeled Solutions
$8.4BNET FINANCIAL BENEFIT
3.3MFOOD WASTE TONS DIVERTED
$2.2BINVESTMENT NEEDED
0MEALS SAVED
7.1MMTCO2e REDUCTION
528.1BGALLONS WATER SAVED
KEYINDICATORS(ANNUAL)
Enhance Product Distribution
Leverage technology to create smart systems that help efficiently move products to maximize freshness and selling time.
Fact Sheet
Fact Sheet
Fact Sheet
Fact Sheet
|
|
|
|
$2.7B Net Financial Benefit
$2.5B Net Financial Benefit
$1.6B Net Financial Benefit
$1.5B Net Financial Benefit
1.1M Food Waste Tons Diverted
617.5K Food Waste Tons Diverted
1.0M Food Waste Tons Diverted
550.6K Food Waste Tons Diverted
5 Modeled Solutions
Fact Sheet
Fact Sheet
Fact Sheet
Fact Sheet
|
|
|
|
$63.4M Net Financial Benefit 22.3K Food Waste Tons Diverted Fact Sheet|
Intelligent Routing
Decreased Transit Time
First Expired First Out
Temperature Monitoring (Pallet Transport)
Reduced Warehouse Handling
Dive into this Key Action Area
Learn more about these modeled solutions and explore unmodeled solutions, best practices, and levers on our website.
Learn more about these modeled solutions and explore unmodeled solutions, best practices, and levers on our website.
PRIVATE
PHILANTHROPIC
PUBLIC
Venture Capital
Non-Government Grants
Government Grants
Private Equity
Impact-First Investments
Government Project Finance
Corporate Finance & SpendingCommercial Project Finance
Government Tax Incentives
$81.9M
$52.1M
$32.2M
$81.9M
$98.6M
$0
$352.4M$0
$0
ANNUALINVESTMENT
NEEDED
$699.1M
Venture Capital
Non-Government Grants
Government Grants
Private Equity
Impact-First Investments
Government Project Finance
Corporate Finance & SpendingCommercial Project Finance
Government Tax Incentives
PRIVATE
PHILANTHROPIC
PUBLIC
$205.2M
$56.6M
$31.0M
$205.2M
$117.7M
$0
$1.6B$0
$0
ANNUALINVESTMENT
NEEDED
$2.2B
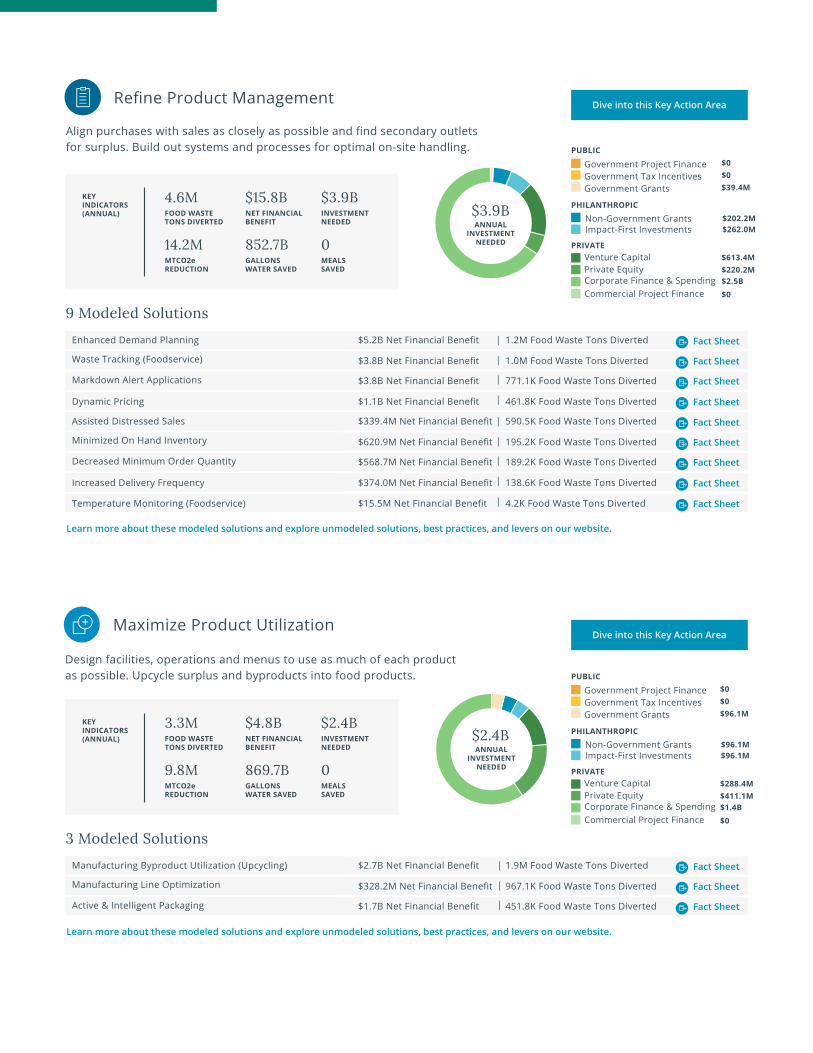
Maximize Product Utilization
Design facilities, operations and menus to use as much of each product as possible. Upcycle surplus and byproducts into food products.
Refine Product Management
Align purchases with sales as closely as possible and find secondary outlets for surplus. Build out systems and processes for optimal on-site handling.
$15.8B
Enhanced Demand Planning
Waste Tracking (Foodservice)
Markdown Alert Applications
Dynamic Pricing
$5.2B Net Financial Benefit
$3.8B Net Financial Benefit
$3.8B Net Financial Benefit
$1.1B Net Financial Benefit
1.2M Food Waste Tons Diverted
1.0M Food Waste Tons Diverted
771.1K Food Waste Tons Diverted
461.8K Food Waste Tons Diverted
NET FINANCIAL BENEFIT
4.6MFOOD WASTE TONS DIVERTED
$3.9BINVESTMENT NEEDED
0MEALS SAVED
14.2MMTCO2e REDUCTION
852.7BGALLONS WATER SAVED
KEYINDICATORS(ANNUAL)
Dive into this Key Action Area
9 Modeled Solutions
Fact Sheet
Fact Sheet
Fact Sheet
Fact Sheet
|
|
|
|
Assisted Distressed Sales
Minimized On Hand Inventory
Decreased Minimum Order Quantity
Increased Delivery Frequency
$339.4M Net Financial Benefit
$620.9M Net Financial Benefit
$568.7M Net Financial Benefit
$374.0M Net Financial Benefit
590.5K Food Waste Tons Diverted
195.2K Food Waste Tons Diverted
189.2K Food Waste Tons Diverted
138.6K Food Waste Tons Diverted
Fact Sheet
Fact Sheet
Fact Sheet
Fact Sheet
|
|
|
|
Temperature Monitoring (Foodservice) $15.5M Net Financial Benefit 4.2K Food Waste Tons Diverted Fact Sheet|
$4.8B
Manufacturing Byproduct Utilization (Upcycling)
Manufacturing Line Optimization
Active & Intelligent Packaging
$2.7B Net Financial Benefit
$328.2M Net Financial Benefit
$1.7B Net Financial Benefit
1.9M Food Waste Tons Diverted
967.1K Food Waste Tons Diverted
451.8K Food Waste Tons Diverted
NET FINANCIAL BENEFIT
3.3MFOOD WASTE TONS DIVERTED
$2.4BINVESTMENT NEEDED
0MEALS SAVED
9.8MMTCO2e REDUCTION
869.7BGALLONS WATER SAVED
KEYINDICATORS(ANNUAL)
Dive into this Key Action Area
3 Modeled Solutions
Fact Sheet
Fact Sheet
Fact Sheet
|
|
|
Learn more about these modeled solutions and explore unmodeled solutions, best practices, and levers on our website.
Learn more about these modeled solutions and explore unmodeled solutions, best practices, and levers on our website.
Venture Capital
Non-Government Grants
Government Grants
Private Equity
Impact-First Investments
Government Project Finance
Corporate Finance & SpendingCommercial Project Finance
Government Tax Incentives
PRIVATE
PHILANTHROPIC
PUBLIC
$613.4M
$202.2M
$39.4M
$220.2M
$262.0M
$0
$2.5B$0
$0
ANNUALINVESTMENT
NEEDED
$3.9B
Venture Capital
Non-Government Grants
Government Grants
Private Equity
Impact-First Investments
Government Project Finance
Corporate Finance & SpendingCommercial Project Finance
Government Tax Incentives
PRIVATE
PHILANTHROPIC
PUBLIC
$288.4M
$96.1M
$96.1M
$411.1M
$96.1M
$0
$1.4B$0
$0
ANNUALINVESTMENT
NEEDED
$2.4B
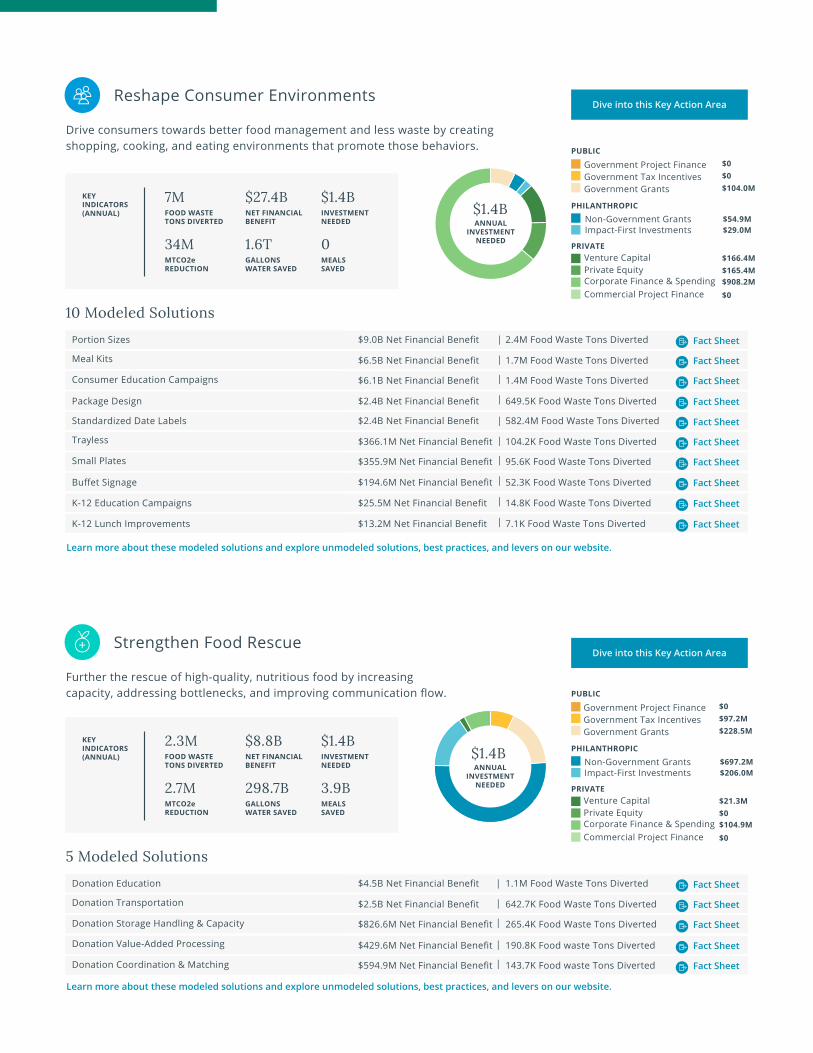
Reshape Consumer Environments
Drive consumers towards better food management and less waste by creating shopping, cooking, and eating environments that promote those behaviors.
Strengthen Food Rescue
Further the rescue of high-quality, nutritious food by increasing capacity, addressing bottlenecks, and improving communication flow.
$27.4B
Portion Sizes
Meal Kits
Consumer Education Campaigns
Package Design
$9.0B Net Financial Benefit
$6.5B Net Financial Benefit
$6.1B Net Financial Benefit
$2.4B Net Financial Benefit
2.4M Food Waste Tons Diverted
1.7M Food Waste Tons Diverted
1.4M Food Waste Tons Diverted
649.5K Food Waste Tons Diverted
NET FINANCIAL BENEFIT
7MFOOD WASTE TONS DIVERTED
$1.4BINVESTMENT NEEDED
0MEALS SAVED
34MMTCO2e REDUCTION
1.6TGALLONS WATER SAVED
KEYINDICATORS(ANNUAL)
Dive into this Key Action Area
10 Modeled Solutions
Fact Sheet
Fact Sheet
Fact Sheet
Fact Sheet
|
|
|
|
Standardized Date Labels
Trayless
Small Plates
Buffet Signage
$2.4B Net Financial Benefit
$366.1M Net Financial Benefit
$355.9M Net Financial Benefit
$194.6M Net Financial Benefit
582.4M Food Waste Tons Diverted
104.2K Food Waste Tons Diverted
95.6K Food Waste Tons Diverted
52.3K Food Waste Tons Diverted
Fact Sheet
Fact Sheet
Fact Sheet
Fact Sheet
|
|
|
|
K-12 Education Campaigns $25.5M Net Financial Benefit 14.8K Food Waste Tons Diverted Fact Sheet|
K-12 Lunch Improvements $13.2M Net Financial Benefit 7.1K Food Waste Tons Diverted Fact Sheet|
$8.8B
Donation Education
Donation Transportation
Donation Storage Handling & Capacity
$4.5B Net Financial Benefit
$2.5B Net Financial Benefit
$826.6M Net Financial Benefit
1.1M Food Waste Tons Diverted
642.7K Food Waste Tons Diverted
265.4K Food Waste Tons Diverted
NET FINANCIAL BENEFIT
2.3MFOOD WASTE TONS DIVERTED
$1.4BINVESTMENT NEEDED
3.9BMEALS SAVED
2.7MMTCO2e REDUCTION
298.7BGALLONS WATER SAVED
KEYINDICATORS(ANNUAL)
Dive into this Key Action Area
5 Modeled Solutions
Fact Sheet
Fact Sheet
Fact Sheet
|
|
|
Donation Value-Added Processing
Donation Coordination & Matching
$429.6M Net Financial Benefit
$594.9M Net Financial Benefit
190.8K Food waste Tons Diverted
143.7K Food waste Tons Diverted
Fact Sheet
Fact Sheet
|
|
Learn more about these modeled solutions and explore unmodeled solutions, best practices, and levers on our website.
Learn more about these modeled solutions and explore unmodeled solutions, best practices, and levers on our website.
PRIVATE
PHILANTHROPIC
PUBLIC
$166.4M
$54.9M
$104.0M
$165.4M
$29.0M
$0
$908.2M$0
$0
Venture Capital
Non-Government Grants
Government Grants
Private Equity
Impact-First Investments
Government Project Finance
Corporate Finance & SpendingCommercial Project Finance
Government Tax Incentives
ANNUALINVESTMENT
NEEDED
$1.4B
INVESTMENTREQUIRED
$1.4B
PRIVATE
PHILANTHROPIC
PUBLIC
$21.3M
$697.2M
$228.5M
$0
$206.0M
$0
$104.9M $0
$97.2M
Venture Capital
Non-Government Grants
Government Grants
Private Equity
Impact-First Investments
Government Project Finance
Corporate Finance & SpendingCommercial Project Finance
Government Tax Incentives
ANNUALINVESTMENT
NEEDED
$1.4B

Recycle Anything Remaining
Find the highest and best use for any remaining food or food scraps in order to capture nutrients, energy, or other residual value.
$293.7M
Centralized Composting
Centralized Anaerobic Digestion
Co-digestion At Wastewater Treatment Plants
Home Composting
$49.4M Net Financial Benefit
$171.4M Net Financial Benefit
$71.0M Net Financial Benefit
$4.9M Net Financial Benefit
13.8M Food Waste Tons Diverted
3.8M Food Waste Tons Diverted
3.0M Food Waste Tons Diverted
93.6K Food Waste Tons Diverted
NET FINANCIAL BENEFIT
20.9MFOOD WASTE TONS DIVERTED
$2.2BINVESTMENT NEEDED
0MEALS SAVED
6.8MMTCO2e REDUCTION
0GALLONS WATER SAVED
KEYINDICATORS(ANNUAL)
Dive into this Key Action Area
6 Modeled Solutions
Fact Sheet
Fact Sheet
Fact Sheet
Fact Sheet
|
|
|
|
Livestock Feed
Community Composting
$-1.5M Net Financial Benefit
$-1.5M Net Financial Benefit
60.4K Food Waste Tons Diverted
57K Food Waste Tons Diverted
Fact Sheet
Fact Sheet
|
|
Learn more about these modeled solutions and explore unmodeled solutions, best practices, and levers on our website.
PRIVATE
PHILANTHROPIC
PUBLIC
$44.1M
$58.2M
$493.2M
$848K
$99.8M
$714.2M
$205.0M$617.3M
$0
Venture Capital
Non-Government Grants
Government Grants
Private Equity
Impact-First Investments
Government Project Finance
Corporate Finance & SpendingCommercial Project Finance
Government Tax Incentives
ANNUALINVESTMENT
NEEDED
$2.2B

The ReFED Insights Engine features a deep-dive analysis of more than 40 food waste reduction solutions spanning our seven key action areas. Some are simple, some are more complex, some are existing best practices, and some are brand new breakthroughs. Many have a strong potential for investment returns, and others are already being implemented successfully by businesses and organizations that are actively seeking funding partners to help scale their efforts.
Solutions
0 2M 4M MTCO2e6M 8M 10M 12M
Top Ten Solutions | GHG EMISSIONS AVOIDED IN MTCO2e
0 2B 4B DOLLARS6B 8B 10B
Top Ten Solutions | NET FINANCIAL BENEFIT
0 3M TONS6M 15M9M 12M
Top Ten Solutions | TONS WASTE DIVERTED
1.1M1.2M1.4M
1.7M1.9M
2.4M2.9M
3M3.8M
13.8M CENTRALIZED COMPOSTINGCENTRALIZED ANAEROBIC DIGESTION
CO-DIGESTION AT WASTEWATER TREATMENT PLANTSIMPERFECT & SURPLUS PRODUCE CHANNELS
PORTION SIZESMANUFACTURING BYPRODUCT UTILIZATION (UPCYCLING)
MEAL KITSCONSUMER EDUCATION CAMPAIGNS
ENHANCED DEMAND PLANNINGDONATION EDUCATION
PORTION SIZESMEAL KITS
CONSUMER EDUCATION CAMPAIGNSCENTRALIZED COMPOSTINGMANUFACTURING BYPRODUCT UTILIZATION (UPCYCLING)
WASTE TRACKING (FOODSERVICE)PACKAGE DESIGN
MARKDOWN ALERT APPLICATIONSENHANCED DEMAND PLANNINGSTANDARDIZED DATE LABELS
PORTION SIZESMEAL KITS
CONSUMER EDUCATION CAMPAIGNSENHANCED DEMAND PLANNING
IMPERFECT & SURPLUS PRODUCE CHANNELSDONATION EDUCATION
WASTE TRACKING (FOODSERVICE)MARKDOWN ALERT APPLICATIONS
BUYER SPECIFICATION EXPANSIONMANUFACTURING BYPRODUCT UTILIZATION (UPCYCLING)$2.7B
$2.7B$3.8B$3.8B
$4.5B$5.1B$5.2B
$6.1B$6.5B
$9B
11.5M7.5M
7.4M4.9M4.8M4.8M
3.6M2.9M2.8M2.7M

These essential tools can facilitate the implementation – and scaling – of food waste reduction solutions:
Levers
Financing
Innovation
Policy
Engagement
In the fight against food waste, capital plays an integral role in funding the development and adoption of food waste solutions – many of which have a strong potential for investment returns. Effective action against food waste requires a smart matching of the correct type of capital with the appropriate opportunity, and in many cases, multiple types of capital are required to fund food waste reduction solutions from conception to adoption.
Policy and regulation are especially effective in overcoming challenges by 1) changing incentive structures, especially when there are misaligned incentives between who is funding a solution and who is receiving the benefit; 2) driving scaled adoption of early-stage technologies; and 3) bringing about changes that market forces alone don’t address. Additionally, federal policy plays an important role when differing state policies can make solutions implementation difficult (e.g., by standardizing conflicting date labeling requirements).
The implementation of existing solutions can reduce a significant amount of food from going to waste across the supply chain. But there is still a need for new innovations to accelerate the adoption of these solutions and to develop new products, technologies, and business models to close the gaps where solutions either don’t exist or are struggling to adequately scale.
Multi-stakeholder or systems-level communication, education, and training can facilitate the adoption of food waste reduction solutions. Because it’s a system-wide problem, reducing food waste often requires collaboration among different sectors; building and using cross-sector relationships can accelerate adoption or even enable solutions to be implemented in the first place.
Learn More About Levers

Food waste is a system-wide problem, and it requires everyone throughout the food system to make changes to the way they’re currently doing business. Many solutions require more than one stakeholder to implement, but the benefits can be experienced broadly as well. Those that are not directly connected to the food system – including Capital Providers and Policymakers – also have an important role to play.
Top Stakeholder RecommendationsHere’s How You Can Reduce Food Waste
ProducersIdentify alternative markets: Build relationships with alternative markets to diversify sales channels and find new markets for crops otherwise left in the field, such as fast-growing “imperfect” product companies and online marketplace platforms.
Propose new buyer arrangements: Propose new arrangements with buyers that 1) expand product specifications in a minimal but impactful way; 2) establish new contract types such as whole crop purchasing; and 3) lead to better upstream communication of demand, including data tools that could facilitate this.
Establish donation channels: Build direct relationships with food recovery organizations and gleaners to have greater options to capture donatable product.
Participate in emerging tools and efforts: Engage with existing and emerging technical tools and collaborative efforts (e.g., harvest data collection platforms, planting schedule coordination, etc.) to better align production with market demand and track harvest and yield patterns over time.
ManufacturersUpcycle byproducts: Dedicate R&D resources to create upcycled product lines for edible byproducts.
Optimize manufacturing lines: Reengineer processes and product design to reduce waste during production and product line changeovers.
Improve package design: Create packaging solutions that enable transferability between supply chains, such as foodservice to retail. Employ packaging solutions that reduce household waste, such as sub-packaging, resealing, active and intelligent packaging, smaller sizes, and usability information. Implement industry-recommended standardized date labeling and extend dates for quality-based date labels where possible.
Recharge distressed sales: Recharge distressed sales through doubled-down internal efforts or external solution providers, as there is often more opportunity there.
Allow donation: Eliminate any mandatory destruction requirements in vendor agreements, allowing for donation instead.

RetailersEnhance demand planning: Optimize forecasting and inventory management systems throughout operations with demand planning informed by machine learning.
Employ dynamic pricing models: Implement dynamic pricing and markdown strategies such as markdown alert apps that increase sales of short-life product.
Implement advanced distribution technologies: Implement technologies that will inform product quality and shelf life, such as early product analysis and detection, and incorporate intelligent routing solutions using dynamic decision-making based on product freshness.
Buy more of what is grown:Strive for stable buyer-grower relationships and innovative purchasing models, such as whole-crop purchasing, to ensure full utilization of product grown.Revise product specifications to accept broader cosmetic variety, using more of what is actually grown; where not feasible, create established “imperfect” product lines.
Assist customers with food management: Educate and assist consumers in better home food management through in-store information, food preparation services (e.g., meal kits, on-demand cutting or butchering), appropriate promotions, and customized product tips.
FoodserviceOffer reduced portion sizes and “à la carte” choices: Discourage plate waste by reducing portion sizes and/or offering customers flexibility in portion sizes, sides, and à la carte options.
Track waste: Implement waste tracking processes to inform production, menu planning, and inventory management.
Design low-waste menus: Implement low-waste menu design solutions, including smaller menus, product repurposing, and whole-product utilization.
Sell end-of-day product: Employ dynamic pricing options for end-of-day sales, such as late happy hours or using markdown alert apps.
Establish donation relationships: Establish relationships for collection of extra food for donation, either directly with organizations or through matching software solutions.

Effective action against food waste requires a smart matching of the correct type of capital with the appropriate opportunity, and in many cases, multiple types of capital are required to fund food waste reduction solutions from conception to adoption. The Roadmap to 2030 reviews the role of nine capital types in supporting food waste reduction.
The Role of Funding
Significant Involvement Is Needed by the Ultimate Solution AdopterAdopting solutions will require food businesses to contribute financial and human capital, as well as overall behavioral change. Many food waste solutions have an expected return on investment that can meet the return thresholds of these entities; they just need to understand the direct, measurable, and tangible benefit to the business in order to devote organizational bandwidth to these opportunities. Corporate investment decisions largely occur because many solutions are simply good business decisions. Many food waste prevention solutions can positively impact corporate operations, thereby requiring the use of Corporate Finance and Spending. Certain solution providers or technology companies whose customers are food businesses may also be viewed as strategic targets for acquisition.
Catalytic Capital can De-Risk Innovation and Adoption
Catalytic Capital tends to be the first money in, thereby having a multiplier effect that stimulates larger amounts of future funding and overcomes system-level barriers. Many food waste solutions with valuable social and environmental benefits are overlooked by more traditional funders due to marginal profitability or the lack of proven, market-based, revenue-generating business models. Catalytic Capital (including Government Grants, Non-Government Grants, and Impact-First Investments) can uniquely shift the economics of these projects above the necessary hurdle rate to attract market-rate financing.
Key Insights
PRIVATE
PHILANTHROPIC
PUBLIC
$1.4B
$1.2B
$1.0B
$1.1B
$909.2M
$714.2M
$7.1B $617.3M
$97.2M
Venture Capital
Non-Government Grants
Government Grants
Private Equity
Impact-First Investments
Government Project Finance
Corporate Finance & SpendingCommercial Project Finance
Government Tax Incentives
ANNUALINVESTMENT
NEEDED
$14B

Plenty of Alpha to Go Around for Private Investors, Including Venture CapitalWith ever-increasing funding round sizes, the first – of possibly many – food waste unicorns (Apeel Sciences), and growing recognition of the significant profit boosting potential for food companies in a tight margin business, private investors, especially venture capitalists, have an important role to play in scaling and firmly establishing food waste as an investment category. Particularly, this form of capital can continue to fund cutting-edge innovation (especially as technology and reducing food waste often go hand-in-hand, including hardware- and software-driven solutions) and disruptive business models with a large potential total addressable market. We have seen new market-based innovations continuing to emerge with no signs of slowing down, as well as several early stage food waste solution providers beginning to become household names, challenging existing later stage and legacy brands and services.
Building Infrastructure with Commercial and Government Project Finance
Project Finance is necessary to cover the sheer size of financial commitment for the build-out of facilities, equipment, and transportation, which are required to collect edible food for donations and sustainably dispose of food that was originally going to landfill. In a low interest rate environment, Project Finance can now be sourced at a historically low cost. Enabling equipment and technologies, such as grinders for centralized composting and depackagers for centralized anaerobic digestion, are not necessarily products that get the most attention but are vital for these processes. Local and regional capital in the form of philanthropy can also be useful in funding gaps in financing or higher-risk opportunities.
Review All Funding Recommendations

The Roadmap to 2030 includes a series of legislative and regulatory recommendations developed in collaboration with the Harvard Food Law & Policy Clinic and arranged by the themes below. The enactment of these and other related policies can be the critical linchpin in driving solutions adoption to help achieve the nation’s 2030 food waste reduction goal.
The Role of Policy
Better Organic Waste ManagementOrganic waste bans are one of the most powerful ways to not only require recycling, but act to incentivize preventative measures and food donations while also enabling measurement. Federal, state, and local governments can disincentivize, limit or ban food from landfills, and eliminate restrictions on food scraps in animal feed.
Funding for InfrastructureGovernment-funded capital investments are critical for donation storage and capacity-building projects, temperature-controlled food distribution, and streamlined development of food waste reduction and waste management infrastructure.
Funding for InnovationGovernment-funded research can support market expansion and product utilization. Recommended projects to fund include farm-level yield and loss research, crop preservation and post-harvest loss prevention technologies, spoilage-inhibition technologies, and upcycled food R&D.
Improvements to Tax LawsLaws can be adjusted to incorporate alternative tax credits for food donations by farmers, expand food donation tax deductions to include non-profit sales and transportation services, allow application of beginning inventory donations to current year losses, and eliminate tax deduction for edible food discards that incentivize waste.
Expanded Food Donation Policies Federal and state governments can work to expand food donation programs, clarify guidance on food safety for donations, strengthen liability protections, and incorporate donation requirements into operational guidelines for government agencies and their contractors.
Consumer EducationFederal, state, and local governments can drive full-scale consumer education campaigns, changes to school lunch programs, and industry changes to address the confusion and lack of awareness that results in waste.
Key Policy Areas
Review All Policy Recommendations
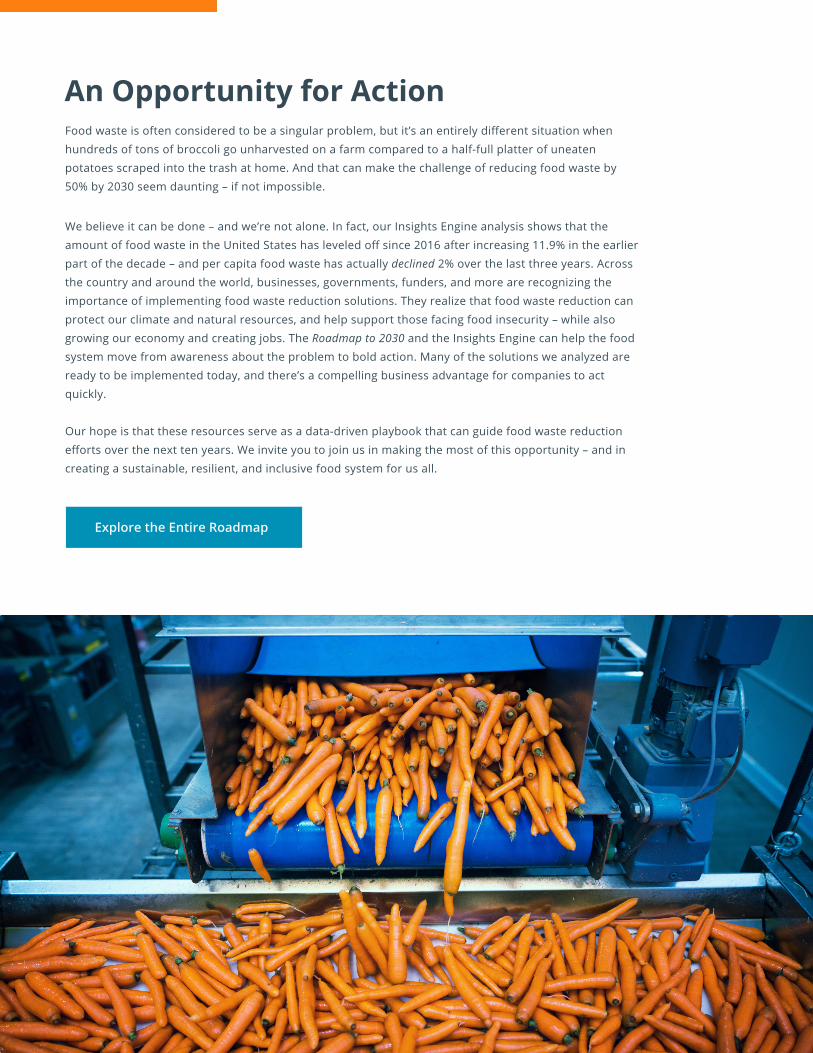
Food waste is often considered to be a singular problem, but it’s an entirely different situation when hundreds of tons of broccoli go unharvested on a farm compared to a half-full platter of uneaten potatoes scraped into the trash at home. And that can make the challenge of reducing food waste by 50% by 2030 seem daunting – if not impossible.
We believe it can be done – and we’re not alone. In fact, our Insights Engine analysis shows that the amount of food waste in the United States has leveled off since 2016 after increasing 11.9% in the earlier part of the decade – and per capita food waste has actually declined 2% over the last three years. Across the country and around the world, businesses, governments, funders, and more are recognizing the importance of implementing food waste reduction solutions. They realize that food waste reduction can protect our climate and natural resources, and help support those facing food insecurity – while also growing our economy and creating jobs. The Roadmap to 2030 and the Insights Engine can help the food system move from awareness about the problem to bold action. Many of the solutions we analyzed are ready to be implemented today, and there’s a compelling business advantage for companies to act quickly.
Our hope is that these resources serve as a data-driven playbook that can guide food waste reduction efforts over the next ten years. We invite you to join us in making the most of this opportunity – and in creating a sustainable, resilient, and inclusive food system for us all.
An Opportunity for Action
Explore the Entire Roadmap

Full ReFED Solutions Analysis
SOLUTIONS
PORTION SIZES
MEAL KITS
CONSUMER EDUCATION CAMPAIGNS
ENHANCED DEMAND PLANNING
IMPERFECT & SURPLUS PRODUCE CHANNELS
DONATION EDUCATION
WASTE TRACKING (FOODSERVICE)
MARKDOWN ALERT APPLICATIONS
BUYER SPECIFICATION EXPANSION
MANUFACTURING BYPRODUCT UTILIZATION
INTELLIGENT ROUTING
DECREASED TRANSIT TIME
DONATION TRANSPORTATION
STANDARDIZED DATE LABELS
PACKAGE DESIGN
ACTIVE & INTELLIGENT PACKAGING
FIRST EXPIRED FIRST OUT
TEMPERATURE MONITORING (PALLET TRANSPORT)
DYNAMIC PRICING
DONATION STORAGE HANDLING & CAPACITY
MINIMIZED ON HAND INVENTORY
DONATION COORDINATION & MATCHING
DECREASED MINIMUM ORDER QUANTITY
DONATION VALUE-ADDED PROCESSING
INCREASED DELIVERY FREQUENCY
TRAYLESS
SMALL PLATES
ASSISTED DISTRESSED SALES
MANUFACTURING LINE OPTIMIZATION
BUFFET SIGNAGE
CENTRALIZED ANAEROBIC DIGESTION
GLEANING
PARTIAL ORDER ACCEPTANCE
CO-DIGESTION AT WASTEWATER TREATMENT
REDUCED WAREHOUSE HANDLING
CENTRALIZED COMPOSTING
K-12 EDUCATION CAMPAIGNS
TEMPERATURE MONITORING (FOODSERVICE)
K-12 LUNCH IMPROVEMENTS
HOME COMPOSTING
COMMUNITY COMPOSTING
LIVESTOCK FEED
NET FINANCIAL BENEFIT GHG EMISSIONSTONS WASTE DIVERTED
Launch Insights Engine
2.4M
1.7M
1.4M
1.2M
2.9M
1.1M
1.0M
771.1K
667.6K
1.9M
1.1M
1.0M
642.7K
582.4K
649.5K
451.8K
617.5K
550.6K
461.8K
265.4K
195.2K
143.7K
189.2K
190.8K
138.6K
104.2K
95.6K
590.5K
967.1K
52.3K
3.8M
78.5K
38.6K
3.0M
22.3K
13.8M
14.8K
4.2K
7.1K
93.6K
57.0K
60.4K
$9.0B
$6.5B
$6.1B
$5.2B
$5.1B
$4.5B
$3.8B
$3.8B
$2.7B
$2.7B
$2.7B
$2.5B
$2.5B
$2.4B
$2.4B
$1.7B
$1.6B
$1.5B
$1.1B
$826.6M
$620.9M
$594.9M
$568.7M
$429.6M
$374.0M
$366.1M
$355.9M
$339.4M
$328.2M
$194.6M
$171.4M
$152.2M
$78.8M
$71.0M
$63.4M
$49.4M
$25.5M
$15.5M
$13.2M
$4.9M
-$1.5M
-$1.5M
11.5M
7.5M
7.4M
2.8M
272.8K
893.8K
4.8M
2.9M
148.8K
4.9M
2.3M
2.2M
1.0M
2.7M
3.6M
2.4M
1.3M
1.2M
1.0M
306.2K
442.2K
552.0K
436.1K
-62.3K
330.3K
493.7K
452.9K
1.5M
2.5M
247.5K
912.4K
-25.7K
70.0K840.8K
44.0K
4.9M
70.2K
21.5K
33.6K
41.0K
25.0K
-0.8K
MTCO2e6M07M05B 12M14M10B0
DOLLARS TONS