reevaluation of turkey's hydropower potential and electric energy demand
TRANSCRIPT

ARTICLE IN PRESS
Energy Policy 36 (2008) 3374– 3382
Contents lists available at ScienceDirect
Energy Policy
0301-42
doi:10.1
� Tel.:
E-m
journal homepage: www.elsevier.com/locate/enpol
Reevaluation of Turkey’s hydropower potential and electric energy demand
Omer Yuksek �
Department of Civil Engineering, Karadeniz Technical University, 61080 Trabzon, Turkey
a r t i c l e i n f o
Article history:
Received 31 January 2008
Accepted 9 May 2008Available online 26 June 2008
Keywords:
Turkey energy sources
Hydroelectric potential
Long-term electric energy demand
15/$ - see front matter & 2008 Elsevier Ltd. A
016/j.enpol.2008.05.004
+90 462 377 26 41; fax: +90 462 377 26 06.
ail addresses: [email protected], kaplaoglu@y
a b s t r a c t
This paper deals with Turkey’s hydropower potential and its long-term electric energy demand
predictions. In the paper, at first, Turkey’s energy sources are briefly reviewed. Then, hydropower
potential is analyzed and it has been concluded that Turkey’s annual economically feasible hydropower
potential is about 188 TWh, nearly 47% greater than the previous estimation figures of 128 TWh. A
review on previous prediction models for Turkey’s long-term electric energy demand is presented. In
order to predict the future demand, new increment ratio scenarios, which depend on both observed
data and future predictions of population, energy consumption per capita and total energy
consumption, are developed. The results of 11 prediction models are compared and analyzed. It is
concluded that Turkey’s annual electric energy demand predictions in 2010, 2015 and 2020 vary
between 222 and 242 (average 233) TWh; 302 and 356 (average 334) TWh; and 440 and 514 (average
476) TWh, respectively. A discussion on the role of hydropower in meeting long-term demand is also
included in the paper and it has been predicted that hydropower can meet 25–35% of Turkey’s electric
energy demand in 2020.
& 2008 Elsevier Ltd. All rights reserved.
1. Introduction
Energy is considered to be a key player in the generationof wealth and also a significant component in economic develop-ment. This makes energy resources extremely significant in theworld. There is an ongoing action for energy market reform inInternational Energy Agency (IEA) countries. So, energy marketreform focused primarily on the electricity sector and to a lesserextent on gas. Reform in both sectors offers strong potential gainsin efficiency through the unbundling of production, transmissionand distribution (Dincer, 1999, 2002).
Turkey is situated at the meeting point of three continents(Asia, Europe and Africa) and stands as a bridge between Asiaand Europe. The country is located in southeastern Europe andsouthwestern Asia. Its size is 779,452 km2. Turkey’s population isnearly 73 million and 60% of the inhabitants of the country live incities. Economic growth in recent years has been associated withthe privatization of public enterprises. The macroeconomicperformance was boosted by a growth in the energy sector(Yuksek et al., 2006). Because of its geopolitical position, Turkeycan be considered as a bridge for energy to connect Europe to Asiaand the Middle East. Turkey has improved its economic situationin recent years, and this has caused more energy needs, whichmeans more consumption and more imports. The economic
ll rights reserved.
ahoo.com.tr (O. Yuksek).
growth rate is the 16th largest in the world and the energy needsof the country are also increasing gradually (Kilic- and Kaya, 2007).
Various studies were performed on Turkey’s energy status andhydropower (HP) capacity (Hepbasli et al., 2001; Kaygusuz,2002a; Bakır, 2007; Yuksek and Kaygusuz, 2006). In these andsimilar studies, the total HP capacity was generally dealt with andno study was carried out to predict the long-term energy demandand the role of HP in meeting this demand. Yuksek et al. (2006)have studied Turkey’s long-term energy demand by Model forAssessment of Energy Demand (MAED) Model, reviewed itshydropower potential (HP) and discussed the role of HP inmeeting long-term energy demand. They have resulted in thatTurkey’s HP can meet nearly 40% of demand.
Turkey’s annual total gross and technically feasible HPs are 435and 215 TWh, respectively. Economically feasible HP has beencalculated by General Directorate of State Hydraulics Works (DSI)as 128 TWh, nearly 60% of technically feasible potential. If theusage of all of the hydropower resources were economicallyfeasible, then the technically and economically feasible potentialvalues would be equal. However, since the use of some part of theresources is not economical for various reasons, these figures aremore or less different.
The estimation of the economically feasible electric energypotential (EFEP) has of vital importance in the future planningof economical development and investment policies on energysources, as well as in various energy policy decisions. Somefeasibility criteria have been used to estimate the EFEP. Here, thekey concept is to determine the criteria used for deciding what is

ARTICLE IN PRESS
O. Yuksek / Energy Policy 36 (2008) 3374–3382 3375
feasible and what is not. Therefore, an analysis about this item isvery important in planning of energy sources.
In this study, Turkey’s hydroelectric energy potential isreevaluated by using the findings of Bakır’s study (2007), inwhich a new criterion was developed related to key conceptof ‘‘the economical feasibility’’, by taking into consideration someundervalued and even ignored benefits of hydro plants and someovervalued benefits of thermal power plants (TPPs); economicallyfeasible hydropower potential goes up to 188 TWh/year, with anincrease ratio of nearly 47% compared to DSI (DSI, 2008) figure.An analysis also is made on Turkey’s hydropower and especiallysmall hydropower potential.
Similar to the estimation of economically feasible potential,the prediction of the future electric energy demand and thepotential of capacity to meet this demand are also very importantissues; because the energy shortage (difference between capacityand demand) must be met by some other energy sources (eitherby discovering new indigenous resources or by importing).Therefore, elaborated analysis on this issue must be made toovercome the shortage.
There have been some new studies to predict Turkey’s long-term electric energy demand (Yumurtacı and Asmaz, 2004; Tunc-et al., 2006; Hamzac-ebi, 2007). In these studies, electric energyconsumption between 2005 and 2020 is predicted by usingprevious consumption data. However, the results of these studiesexhibit much scattering, resulting in uncertainties in demandpredictions. A discussion about these long-term electric energydemand prediction models is given and new prediction scenariosare introduced. Then, by taking into consideration the increaseratios of population, electric energy consumption per capita andtotal electric energy consumption values, both observed in thepast and predicted by DPT (State Planning Organization), new sixpredictions are introduced. Various statistical properties, includingmean, standard deviation, coefficient of variation and confidenceintervals for two confidence levels, are calculated for all of thescenarios.
Depending on the applied scenario and used model, Turkey’sannual electric energy demands in 2010, 2015 and 2020 arepredicted to vary between 222 and 242 (on average 233) TWh;302 and 356 (on average 334) TWh; and 440 and 514 (on average476) TWh, respectively.
A discussion on the role of hydropower in meeting demand isalso included in the paper. It has been concluded that hydropowercan meet 25–35% of Turkey’s electric energy demand in 2020 andnew energy plants should be made as soon as possible.
2. A review on Turkey’s energy sources
Because of social and economic development of the country,the demand for energy and particularly for electricity is growingrapidly in Turkey. Turkey’s natural energy resources are quitemiscellaneous; for example, hard coal, lignite, asphalt, oil, naturalgas, hydro, geothermal, wood, animal and plant wastes, solar andsecondary energy resources, coke, and briquettes. These resourcesare produced and consumed in the country. Turkey does not ownlarge fossil-fuel reserves. In the future, it seems that it will be verydifficult to meet the anticipated demand for oil, natural gas,and even coal. On the other hand, Turkey has huge reserves ofrenewable energy sources (Kilic- and Kaya, 2007). In Turkey, wherethere is no nuclear power, electricity is produced by TPPs,consuming coal, lignite, natural gas, fuel oil and geothermalenergy; and by hydropower plants (HPPs) (Yuksek et al., 2006).
Turkey’s geographic location has several advantages forextensive use of most of the renewable energy sources. It is onthe humid and warm climatic belt, which includes most of
Europe, the near east and western Asia. Demographic projectionsas well as the growing gap between national energy demand andproduction raised concerns on the economical and environmentalimpacts of power generation based on Turkey’s national energysources.
Clean, domestic and renewable energy is commonly acceptedas the key for future life, not only for Turkey but also for the entireworld. This is primarily because renewable energy resources havesome advantages when compared to fossil fuels. Turkey has toadopt new long-term energy strategies to reduce the shareof fossil fuels in the energy consumption (Hepbasli et al., 2001).
Meeting energy demand is of high importance in Turkey. Butexploiting the country’s large energy efficiency potential is alsovital. Air pollution is a significant problem and, as the govern-ment’s projections show, carbon emissions could rise sharply ifcurrent trends continue (Kaygusuz, 2002a). Turkey is striving tomake good use of its geographic location as a transit countrylinking the oil- and gas-rich Caspian area to the Mediterraneanand to the demand centers of the West. Several pipeline projectsare under way. They could have a positive effect on the diversityand security of supply in many consuming countries. They couldalso help avoid further environmental strain on the maritimeroutes through the Bosporus (Kaygusuz, 2001).
Hydropower energy and the surrounding seas are Turkey’smain potential sources of renewable energies. In addition,geothermal energy beneath the surface of the western Anatolia;wind and solar energy available at western, eastern, and middleAnatolia; and nuclear energy by abundant thorium and uraniumores lying throughout Anatolia and hydrogen potential accumu-lated at the submarine of Black Sea are the other potentialrenewable energy sources in Turkey. In this regard, the majorareas of renewable energy research in Turkey are hydropower,solar thermal, wind, geothermal, photovoltaic energy, and newprograms such as hydrogen energy, fuel cells, etc. (Kaygusuz,2002b).
Turkey’s renewable energy sources are plentiful and extensive.Renewable energy production makes up approximately 14.4% ofthe total primary energy supply and renewable sources representthe second-largest domestic energy source after coal (Kilic- andKaya, 2007).
Turkey’s main fossil energy resource is coal, which has beenproduced for years domestically, and its share of the country’stotal energy consumption is about 24%. It is used mainly for powergeneration, cement production, and steel manufacturing. Turkeyis one of the biggest producers of lignite in the world. This comespredominantly from deposits of the Southwest and the South-eastern Afsin-Elbistan Basin, where 7339 million tons lignite iseconomically usable. The government plans to increase the coalsupply from 20.1 Mtoe in 1999 to 118.4 Mtoe in 2020 (Kilic-and Kaya, 2007).
3. Reevaluation of Turkey’s hydroelectric potential
3.1. Hydroelectric power
Hydropower provides unique benefits, rarely found in othersources of energy. These benefits can be attributed to theelectricity itself, or to side-benefits, often associated withreservoir development. Hydro-turbines convert water pressureinto mechanical shaft power, which can be used to drive anelectricity generator, or other machinery. The power available isproportional to the product of pressure head and water discharge.As the most important of the clean, renewable energy options,hydropower is often one of a number of benefits of a multipurposewater resources development project. Hydropower is the largest

ARTICLE IN PRESS
O. Yuksek / Energy Policy 36 (2008) 3374–33823376
renewable resource used for electricity (Frey and Linke, 2002; IHA,2000). It plays an essential role in many regions of the world withmore than 150 countries generating hydroelectric power.
There is vast unexploited potential worldwide for new hydroplants, particularly in the developing countries of Asia, LatinAmerica and Africa, while most of the best sites have alreadybeen developed in Europe and North America. There is alsoupgrading potential at existing schemes though any future hydroprojects will, in general, have to satisfy stricter requirements bothenvironmentally and economically than they have in the past(Bartle, 2002).
It is expected that the world energy demand, and especiallythat for electricity, will increase greatly during the 21st century,not only because of demographic pressures, but also through animprovement in living standards in the less developed countries,which will represent 7 billion inhabitants in 2050 (78% of thetotal) (IEA (International Energy Agency), 2001).
General characteristics of HPPs can be summarized as follows(IHA, 2000):
�
Its resources are widely spread around the world. Potentialexists in about 150 countries, and about 70% of the economic-ally feasible potential remains to be developed. � It is a proven and well advanced technology with modernpower plants providing the most efficient energy conversionprocess (490%), which is also an important environmentalbenefit.
� The production of peak load energy from hydropower allowsfor the best use to be made of base-load power from other lessflexible electricity sources, notably wind and solar power. Itsfast response time enables it to meet sudden fluctuations indemand.
� It has the lowest operating costs and longest plant life,compared with other large scale generating options. Typicallya hydro plant in service for 40–50 years can have its operatinglife doubled.
� The ‘‘fuel’’ (water) is renewable, and is not subject tofluctuations in market. Countries with ample reserves of fossilfuels, such as Iran and Venezuela, have opted for a large scaleprogram of hydro development, recognizing environmentalbenefits. Hydro also represents energy independence for manycountries.
3.2. Turkey’s hydroelectric potential
3.2.1. Current status
The annual average precipitation in Turkey is nearly 643 mm,corresponding to a volume of 500 km3. The average runoffcoefficient is 0.37, and the annual runoff is 186 km3 (2400 m3/ha).The annual depth of precipitation is as high as 250 cm in theEastern Black Sea Region and as low as 30 cm in some parts ofcentral Anatolia. Most of the country’s water potential lies inthe southeast (28%) and the Black Sea region (8%). Some 22% ofthe boundaries between Turkey and the neighboring countries arealong international rivers (Yuksek and Uc- uncu, 1999).
Owing to Turkey’s regions, most of which are hilly, it canbe possible to develop relatively higher heads without expensivecivil engineering works, so that relatively smaller flows arerequired to develop for the desired power. In these cases, itmay be possible to construct a relatively simple diversionstructure and to obtain the highest drop by diverting flows at thetop of a waterfall. There are intensive investigations to improvethe small and large hydropower development in Turkey. Forputting this aim into practice, some of small HPPs are still underconstruction.
Turkey has rigorous plans for the development of itssubstantial hydropower potential. Schemes built on the conceptof build-own-transfer (BOT) are being encouraged strongly, andbilateral agreements have been signed with a number of countriesto further international cooperation in hydropower development(Yuksek and Kaygusuz, 2006).
3.2.2. Hydroelectric potential according to existing economical
feasibility criteria
Turkey’s annual total gross and technically feasible HPsare 435 and 215 TWh, respectively. Economically feasible HP hasbeen calculated by DSI as 128 TWh, nearly 60% of technicallyfeasible potential. The key concept in calculating the economicallyfeasible potential is to determine the criteria used for decidingwhat is feasible and what is not. A brief discussion aboutthis concept is given below. More detail can be found in Bakır(2007).
The feasibility criteria has been calculated by taking intoaccount only internal costs of TPPs, which are considered as thealternative energy sources to HPPs; and external costs aredisregarded. It is well known that, however, external costs(greenhouse gas, acid rains, environmental pollution, etc.) arenearly 30% of internal costs. DSI is using the following criteria forthe feasibility studies of hydroelectric power plants (DSI, 2008):
�
Firm energy benefit: 6.0 cents/KWh, � Secondary energy benefit: 3.3 cents/KWh, � Peak power benefit: 85 $/KW.In comparing the feasibility of hydro and thermo plants,there have been two issues to be discussed. The first issue isconcerning Turkey’s hydropower in general, and it has beenproposed that hydro plants must be evaluated as part of wholesystem of Turkey, instead of being evaluated individually.Because, Turkey has huge storage capacity in dams and it canfunction as the storage and buffer for smaller units withoutstorage. Thus, all electricity produced by hydro plants, small orlarge and with or without storage, should be classified as firmenergy. The whole load temporal variations throughout thecountry during the day can be balanced by hydro plants withstorage. All these must have an additional economical value,which is estimated 1.25 cents/KWh, using weighted average ofelectricity prices at peak loads.
The second issue to be considered is the external costsof TPPs, which is estimated to be at least 1.5 cents/KWh. Takingthese two issues into consideration, the following criteria areproposed instead of the existing ones in the feasibility studiesof HPPs:
�
For HEPP with dams (storage):o Firm energy benefit: 6.0+1.5 ¼ 7.5 cents/KWh,o Secondary energy benefit: 6.0–1.25 ¼ 4.75 cents/KWh,o Peak power benefit: 250 $/KW.�
For HEPP without dams (run of river plants):o Firm energy benefit: 6.0+1.5 ¼ 7.5 cents/KWh,o Secondary energy benefit: 6.0–1.25 ¼ 4.75 cents/KWh.If these criteria are taken into consideration instead of the onesused by DSI, even those hydro plants are 40–45% more expensivethan currently feasible ones will become feasible themselves.Even if the external costs of thermal plants are excluded, theseratios are 20–25%. Turkey’s HP according to DSI and the newdeveloped criteria by Bakır (2007), together with installed powervalues, are given in Table 1.

ARTICLE IN PRESS
Table 1Turkey’s annual HP according to DSI (2008) and Bakır (2007)
Basin Gross potential (GWh) According to DSI According to Bakyr
Econ. feas. pot. (GWh) Inst. power (MW) Econ. feas. pot. (GWh) Inst. power (MW)
Fırat (Euphrates) 84,122 39,375 10,345 46,267 12,176
Dicle (Tigris) 48,706 17,375 5416 24,353 7610
Eastern Black Sea 48,478 11,474 3257 24,239 6925
Eastern Meditt. 27,445 5216 1490 10,978 3137
Antalya 23,079 5355 1537 9232 2638
C- oruh 22,601 10,933 3361 12,431 3825
Ceyhan 22,163 4825 1515 8865 2860
Seyhan 20,875 7853 2146 9394 2609
Kızılırmak 19,552 6555 2245 7821 2697
Yes-ilırmak 18,685 5494 1350 8408 2213
West. Black Sea 17,914 2257 669 7166 2108
Western Meditt. 13,595 2628 723 5438 1511
Aras 13,114 2372 631 5246 1418
Sakarya 11,335 2461 1175 3967 1984
Susurluk 10,573 1662 544 2643 881
Others (total) 30,744 1788 546 1721 507
Total 432,981 127,623 36,950 188,169 55,099
O. Yuksek / Energy Policy 36 (2008) 3374–3382 3377
3.2.3. Small hydropower (SHP)
The development of hydro-electricity in the 20th century wasusually associated with the building of large dams. Hundreds ofmassive barriers of concrete, rock and earth were placed acrossriver valleys worldwide to create huge artificial lakes. While theycreated a major, reliable power supply, plus irrigation and floodcontrol benefits, the dams necessarily flooded large areas of fertileland and displaced many thousands of local inhabitants. In manycases, rapid silting up of the dam has since reduced itsproductivity and lifetime. There are also numerous environmentalproblems that can result from such major interference with riverflows (Paish, 2002).
Small hydro technology is extremely robust (systems can lastfor 50 years or more with little maintenance), also has thecapacity to make a more immediate impact on the replacementof fossil fuels since, unlike other sources of renewable energy, itcan generally produce some electricity on demand (at least attimes of the year when an adequate flow of water is available)with no need for storage or backup systems. It is also in manycases cost competitive with fossil-fuel power stations, or forremote rural areas, diesel generated power (Kaygusuz, 2004).
Micro hydropower schemes are more suitable for ruraldispersed communities. In particular, the power generated frommicro hydropower schemes can be used for agro-processing, locallighting, water pumps, small business and industries, farms,and household in rural communities. Small HPPs combine theadvantages of hydropower with those of decentralized powergeneration, without the disadvantages of large-scale installations(Yuksel, 2007).
Small hydro currently contributes over 40 GW of worldcapacity. With positive environmental policies now being backedby favorable tariffs for ‘‘green’’ electricity, the industry believesthat small hydro will have a strong resurgence in Europe in thenext 10 years, after 20 years of decline (Paish, 2002). Smallhydropower can provide base-load capacity, and its potentialin Europe is not yet fully exploited (Kaygusuz et al., 2007).
The development of small hydropower began in the year 1902in Turkey. Since then, many small HPPs have been installed bygovernment organizations, the private sector, and local munici-palities in many parts of the country. However, until now, as aresult of a rapid increase in the field of energy consumption,priority has been given to the development of large-scale hydro-power projects to recover increasing energy demand and to
provide maximum energy to Turkey’s economy. During last threedecades, the average annual increase of SHP capacity was 5–10%(Bakıs- and Demirbas-, 2004; Balat, 2007).
If existing rivers, lakes, and their tributaries are evaluatedagain according to their head potential points, there might bemany available sides to install SHP plants along them, especiallyin the Eastern Black Sea Region of Turkey, which is the rainiestregion of the country and has more geographic and topographicadvantage. Owing to Turkey’s regions, most of which are hilly, itcan be possible to develop relatively higher heads withoutexpensive civil engineering works so that relatively smaller flowsare required to develop for the desired power. In these cases, itmay be possible to construct a relatively simple diversionstructure and obtain the highest drop by diverting flows at thetop of a waterfall.
There are intensive investigations to improve the small andlarge hydropower development in Turkey. For putting this aiminto practice, some small HPPs are still under construction inTurkey. There is a proposal of the project called ‘‘HYDROPOT’’submitted for FP6 (the 6th Framework Program) funding in orderto reevaluate hydropower potential.
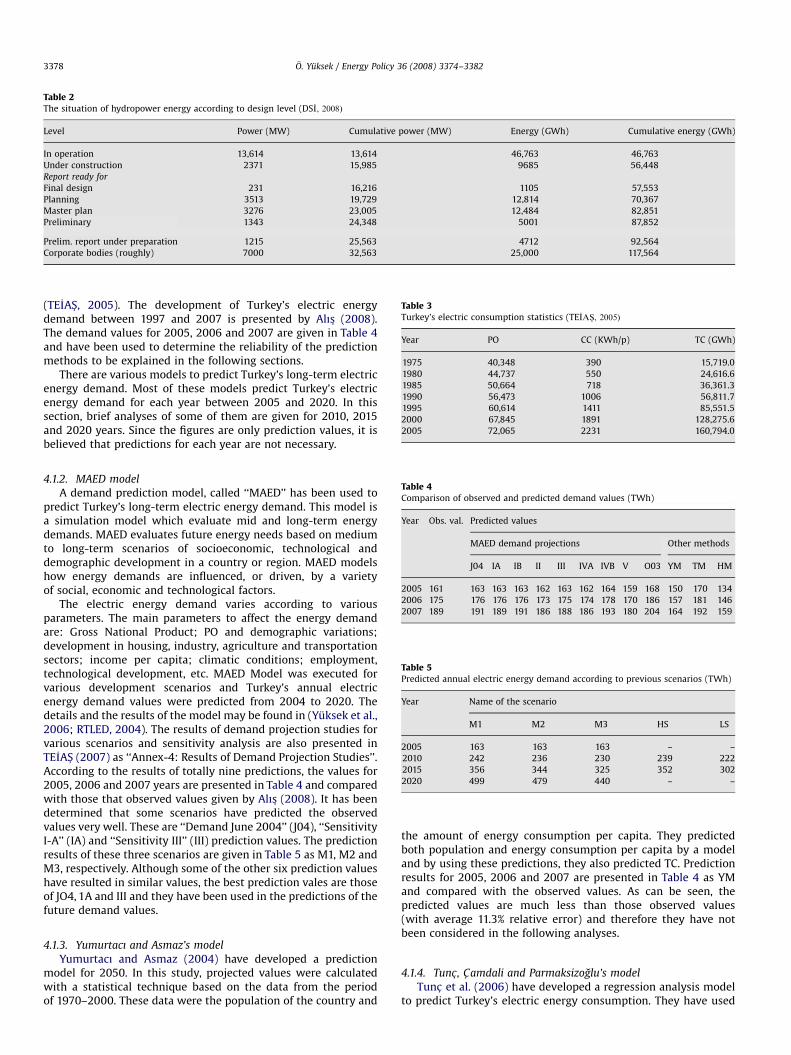
There is more hydropower potential to be studied in Turkey,including small hydro plants and run of river (without storage)plants. According to tables prepared by DSI (DSI, 2008), there havebeen developed 1100 local hydropower projects (by April 16,2008), which will be made by corporate bodies (private sector) bythe concept of BOT. The total capacities and annual energypotentials are predicted 7000 MW and 25,000 GWh, respectively.The situation of hydropower energy according to design level(by April 16, 2008) is presented in Table 2 (DSI, 2008). As can beseen, total hydropower is predicted as 117,564 GWh. Since therehave been intensive and feverish studies about developing thesekinds of projects, this figure is continuously going up.
4. Reevaluation of Turkey’s electric energy demand
4.1. A review on the existent demand predictions
4.1.1. Previous consumption data
Turkey’s population (PO), energy consumption per capita(CC, KWh/person) and total electric energy consumptions (totalconsumption—TC, TWh), for 5-yearly intervals, are given in Table 3
ARTICLE IN PRESS
Table 2The situation of hydropower energy according to design level (DSI, 2008)
Level Power (MW) Cumulative power (MW) Energy (GWh) Cumulative energy (GWh)
In operation 13,614 13,614 46,763 46,763
Under construction 2371 15,985 9685 56,448
Report ready for
Final design 231 16,216 1105 57,553
Planning 3513 19,729 12,814 70,367
Master plan 3276 23,005 12,484 82,851
Preliminary 1343 24,348 5001 87,852
Prelim. report under preparation 1215 25,563 4712 92,564
Corporate bodies (roughly) 7000 32,563 25,000 117,564
Table 3Turkey’s electric consumption statistics (TEIAS- , 2005)
Year PO CC (KWh/p) TC (GWh)
1975 40,348 390 15,719.0
1980 44,737 550 24,616.6
1985 50,664 718 36,361.3
1990 56,473 1006 56,811.7
1995 60,614 1411 85,551.5
2000 67,845 1891 128,275.6
2005 72,065 2231 160,794.0
Table 4Comparison of observed and predicted demand values (TWh)
Year Obs. val. Predicted values
MAED demand projections Other methods
J04 IA IB II III IVA IVB V O03 YM TM HM
2005 161 163 163 163 162 163 162 164 159 168 150 170 134
2006 175 176 176 176 173 175 174 178 170 186 157 181 146
2007 189 191 189 191 186 188 186 193 180 204 164 192 159
Table 5Predicted annual electric energy demand according to previous scenarios (TWh)
Year Name of the scenario
M1 M2 M3 HS LS
2005 163 163 163 – –
2010 242 236 230 239 222
2015 356 344 325 352 302
2020 499 479 440 – –
O. Yuksek / Energy Policy 36 (2008) 3374–33823378
(TEIAS- , 2005). The development of Turkey’s electric energydemand between 1997 and 2007 is presented by Alıs- (2008).The demand values for 2005, 2006 and 2007 are given in Table 4and have been used to determine the reliability of the predictionmethods to be explained in the following sections.
There are various models to predict Turkey’s long-term electricenergy demand. Most of these models predict Turkey’s electricenergy demand for each year between 2005 and 2020. In thissection, brief analyses of some of them are given for 2010, 2015and 2020 years. Since the figures are only prediction values, it isbelieved that predictions for each year are not necessary.
4.1.2. MAED model
A demand prediction model, called ‘‘MAED’’ has been used topredict Turkey’s long-term electric energy demand. This model isa simulation model which evaluate mid and long-term energydemands. MAED evaluates future energy needs based on mediumto long-term scenarios of socioeconomic, technological anddemographic development in a country or region. MAED modelshow energy demands are influenced, or driven, by a varietyof social, economic and technological factors.
The electric energy demand varies according to variousparameters. The main parameters to affect the energy demandare: Gross National Product; PO and demographic variations;development in housing, industry, agriculture and transportationsectors; income per capita; climatic conditions; employment,technological development, etc. MAED Model was executed forvarious development scenarios and Turkey’s annual electricenergy demand values were predicted from 2004 to 2020. Thedetails and the results of the model may be found in (Yuksek et al.,2006; RTLED, 2004). The results of demand projection studies forvarious scenarios and sensitivity analysis are also presented inTEIAS- (2007) as ‘‘Annex-4: Results of Demand Projection Studies’’.According to the results of totally nine predictions, the values for2005, 2006 and 2007 years are presented in Table 4 and comparedwith those that observed values given by Alıs- (2008). It has beendetermined that some scenarios have predicted the observedvalues very well. These are ‘‘Demand June 2004’’ (J04), ‘‘SensitivityI-A’’ (IA) and ‘‘Sensitivity III’’ (III) prediction values. The predictionresults of these three scenarios are given in Table 5 as M1, M2 andM3, respectively. Although some of the other six prediction valueshave resulted in similar values, the best prediction vales are thoseof JO4, 1A and III and they have been used in the predictions of thefuture demand values.
4.1.3. Yumurtacı and Asmaz’s model
Yumurtacı and Asmaz (2004) have developed a predictionmodel for 2050. In this study, projected values were calculatedwith a statistical technique based on the data from the periodof 1970–2000. These data were the population of the country and
the amount of energy consumption per capita. They predictedboth population and energy consumption per capita by a modeland by using these predictions, they also predicted TC. Predictionresults for 2005, 2006 and 2007 are presented in Table 4 as YMand compared with the observed values. As can be seen, thepredicted values are much less than those observed values(with average 11.3% relative error) and therefore they have notbeen considered in the following analyses.
4.1.4. Tunc- , C- amdali and Parmaksizoglu’s model
Tunc- et al. (2006) have developed a regression analysis modelto predict Turkey’s electric energy consumption. They have used

ARTICLE IN PRESS
Table 7Increment ratios of PO, CC and TC values (%)
Time interval PO CC TC
Measured values (TEIAS- , 2005)
1975–1980 2.09 7.1 9.0
1980–1985 2.52 5.5 8.1
1985–1990 2.19 7.0 9.3
1990–1995 1.42 7.0 8.5
1995–2000 2.27 6.0 8.4
2000–2005 1.21 3.4 4.6
1975–2005 (average) 1.95 6.0 8.1
Predicted values (TEIAS- , 2007)
2005–2010 1.4 5.5 7.0
2010–2015 1.2 6.4 7.7
2015–2020 1.0 6.4 7.5
2005–2020 (average) 1.2 6.1 7.4
Table 8
O. Yuksek / Energy Policy 36 (2008) 3374–3382 3379
TC values between 1980 and 2001 and predicted the valuesbetween 2004 and 2020. Their predicted values for 2005, 2006and 2007 are presented in Table 4 as TM and compared with theobserved values. As can be seen, the predicted values are morethan those observed values with average 3.5% relative error. Thiserror figure may be evaluated as an unimportant value; however,their method has predicted very small values as the predictionduration increase, in other words for the years of 2015 and 2020,and therefore this method has not been considered in thefollowing analyses.
4.1.5. Hamzac-ebi’s model
Hamzac-ebi (2007) has forecasted Turkey’s net electricityenergy consumption on sectoral basis by artificial neural networks(ANN) model. He has used consumption values between 1970and 2004 and predicted the values between 2005 and 2020.Prediction results for 2005, 2006 and 2007 are presented in Table 4as HM and compared with the observed values. As can be seen,the predicted values are much less than those observed values(with average 19.6% relative error) and therefore they are nottaken into account for following analyses.
4.1.6. TEIAS- model
TEIAS- (Turkish Electricity Transmission Company) has pre-dicted Turkey’s electric energy demand between 2007 and 20016by using two scenarios as Case I (High Scenario, HS) and Case II(Low Scenario, LS), depending on the growth scenarios. The detailsof the methods can be found in TEIAS- (2007). The results arepresented in Table 5.
4.1.7. A brief analysis of these models
By using the prediction values of the above five models, whichare presented in Table 5, the increment ratios between predictedyears are calculated by geometric mean as follows
Gm ¼Nv
Pv
� �1=N
; Ir ¼ 100ðGm � 1Þ (1)
where Gm is geometric mean, Nv and Pv are predicted values fornew and previous years, respectively, N is the time between yearsand Ir is increment ratio. The calculated increment ratios arepresented in Table 6 for the each prediction methods. M1 methodhas yielded the most increase ratios. Average increment ratios aregenerally going down by the time, which means that, the increasespeed of electric energy demand values are expected to decrease.
4.2. New prediction scenarios
4.2.1. Applied scenarios
As can be seen in Table 5, all of the above models have yieldeddifferent predictions. In this section, new prediction scenarios areintroduced to predict Turkey’s electric energy demand. In theanalysis, the data of Turkey’s population (PO), total electric energyconsumptions (TC) and energy CC for 5-yearly intervals, which arepresented in Table 3, are employed. Annual average increment
Table 6Increment ratios for the predicted demand values (%)
Time intervals Name of the scenario Average
M1 M2 M3 HS LS
2005–2010 8.2 7.7 7.1 – – 7.7
2010–2015 8.0 7.8 7.2 8.1 6.3 7.5
2015–2020 7.0 6.8 6.2 – – 6.7
2005–2020 (average) 7.7 7.5 6.8 – – 7.3
ratios of all of the three variables are calculated and presented inTable 7. As is seen, although there are some fluctuations, a generaldecrease trend is obvious in the increment ratios of all of thevariables. The increment ratios of PO, CC and TC values haveannual average values of 1.95, 6.0 and 8.1%, respectively.
The increase ratios for development ratio (DR) and PO arepredicted by DPT (State Planning Organization) in 2004 andpresented in Table 7 (TEIAS- , 2007). By assuming that the increasein energy CC is equal to the increase in DR, increase ratio in TC iscalculated as multiplying increases of PO and CC and are alsoincluded in Table 7. In the following, various kinds of increasescenarios for each of the variable (PO, CC and TC) are employed for5 yearly time intervals and according to these increment ratios,the values are predicted. The applied increment ratio values topredict the future demand are presented in Table 8.
Scenario 1 is as predicted by DPT; the other five scenarios areapplied for various increment ratios either in PO and CC or in TCvalues. The increment ratios are selected by taking into accountthe observed (1975–2005) and predicted values of PO, CC andTC. The predicted and observed values for 2006 and 2007 arepresented in Table 9. As is seen, the applied scenarios predictedthe observed values in 2006 and 2007 with small errors. Thepredicted annual electric energy demand values of all of theapplied 11 scenarios are summarized in Table 10. The maximumvalues are predicted for M1, HS and S6 scenarios, while minimumvalues are for M3 and LS scenarios.
4.2.2. Analysis of the predicted values
The mean, standard deviation and coefficient of variationvalues for all of the employed scenarios are calculated. Confidenceintervals for 2010, 2015 and 2020 demand predictions arecalculated by t (student) distribution for 90% and 50% confidencelevels. All of the statistical properties are presented in Table 11.
Applied increment ratio scenarios (%)
Scenario Time interval PO CC TC
S1 2005–2010 1.4 5.5
2010–2015 1.2 6.4 –
2015–2020 1.0 6.4
S2 2005–2020 1.2 6.0 –
S3 2005–2020 1.2 6.5 –
S4 2005–2020 1.4 6.0 –
S5 2005–2020 – – 7.0
S6 2005–2020 – – 8.0

ARTICLE IN PRESS
O. Yuksek / Energy Policy 36 (2008) 3374–33823380
As is seen, the standard deviation and coefficient of variationvalues are rather small, resulting in narrow confidence intervalsand increasing the reliability of the demand values. As the yearselapse, by getting new consumption data, the reliability of thepredictions will, of course, be increase.
5. The role of hydropower in meeting demand
The electric energy demand may be met by various resources,including thermal, hydro, wind and other renewable sources.TEIAS- (2007) has planned two scenarios both for demand andresource projections between 2007 and 2016, of which demandpredictions have previously been cited as HS (high scenario) andLS (low scenario). TEIAS- has classified the power plants as
Table 9Predicted and observed demands of the applied scenarios (TWh)
Year Name of the scenario
S1 S2 S3 S4 S5 S6
2006 Predicted 172 172 173 173 175 175
Observed 175 175 175 175 175 175
2007 Predicted 184 185 187 186 189 189
Observed 189 189 189 189 189 189
Table 10Predicted annual electric energy demand according to applied scenarios (TWh)
Year Name of the scenario
M1 M2 M3 HS LS S1 S2 S3 S4 S5 S6
2005 163 163 163 – – 161 161 161 161 161 161
2010 242 236 230 239 222 225 230 235 231 232 238
2015 356 344 325 352 302 326 324 340 331 325 350
2020 499 479 440 – – 467 461 495 475 455 514
Table 12Hydropower generation and demand balance for high scenario (TEIAS- , 2007)
Year D (TWh) Existing+under const. Exsiting+under con
H (TWh) H/D H (TWh)
2008 204 48 0.24 49
2009 221 51 0.23 52
2010 239 53 0.22 59
2011 259 53 0.20 64
2012 280 54 0.19 67
2013 302 54 0.18 67
2014 326 53 0.16 67
2015 352 53 0.15 67
2016 378 52 0.14 67
Table 11Statistical properties of predicted demand values (TWh)
Year Mean Standard deviation Coe
2010 233 6.0 0.02
2015 334 16.0 0.04
2020 476 23.4 0.04
existing, under construction, licensed power plants and newadditional capacity. The results of hydropower generation capa-cities and energy demand balance analyses for HS and LS arepresented in Tables 12 and 13, respectively, where D is demandand H is hydropower capacity. As can be seen, hydropower canmeet 14% and 16% of total demand for the existing and underconstruction plants in 2016 for HS and LS alternatives, respec-tively. These figures go up to 18% and 20% for existing, underconstruction and licensed plants and to 26% if the plannedadditional capacity plants are made.
The situation of hydropower energy according to designlevel is presented in Table 2 (DSI, 2008). As is seen, the capacityof plants in operation is 47 TWh, which meet the 25% of 2007demand (189 TWh). If all of the plants which are underconstruction can be ready until 2010, they can provide 24%of the demand according to the average value of predictions(Table 11). Similar projections may be carried out by comparingTables 2 and 11.
In order to make reliable predictions, it should be known thaton which level HPPs can be in operation in which year. Especially,there are intensive and feverish studies on the projects bycorporate bodies and therefore, it has been hoped that consider-able parts of these projects will be in operation within a few years.If this expectation become fact, the ratio of hydropower meet thedemand will increase. If all of the plants given in Table 2 areestablished by the time 2015 and 2020, then hydropower willprovide 35 and 25 of the average demand in these years,respectively. As a last scenario it is hoped that, if all of thehydropower capacity estimated by DSI (128 TWh) is utilized until2020 (which seems a reasonable scenario), then hydropower canprovide 27% of total demand for the average demand predictionvalue.
According to prediction values of reevaluated economicallyfeasible HP, (Bakır, 2007), Turkey’s total HP (188 TWh) can meet81%, 56% and 39% of the expected average demands in 2010, 2015and 2020, respectively. By taking into consideration of officialinvestment plans proposed both by DSI and TEIAS- , the probabilitythat this new potential will be available by 2020, let alone by 2010or 2015, seems to be small. However, corporate bodies are very
str.+licensed Exsiting+under constr. licensed +addit. capac.
H/D H (TWh) H/D
0.24 49 0.24
0.24 52 0.24
0.25 61 0.26
0.25 70 0.27
0.24 78 0.28
0.22 84 0.28
0.21 90 0.28
0.19 94 0.27
0.18 98 0.26
fficient of variation Confidence intervals
Conf. lev. 90% Conf. lev. 50%
6 220–246 229–237
8 305–363 323–345
9 432–520 459–493

ARTICLE IN PRESS
Table 13Hydropower generation and demand balance for low scenario TEIAS- (2007)
Year D (TWh) Existing+under const. Exsiting+under constr.+licensed Exsiting+under constr. licensed+addit. capac.
H (TWh) H/D H (TWh) H/D H (TWh) H/D
2008 197 48 0.24 49 0.25 49 0.25
2009 209 51 0.24 52 0.25 52 0.25
2010 222 53 0.24 59 0.27 59 0.27
2011 236 53 0.22 64 0.27 64 0.27
2012 251 54 0.22 67 0.27 70 0.28
2013 267 54 0.20 67 0.25 74 0.28
2014 284 53 0.19 67 0.24 75 0.26
2015 302 53 0.18 66 0.22 78 0.26
2016 322 52 0.16 66 0.20 83 0.26
O. Yuksek / Energy Policy 36 (2008) 3374–3382 3381
eager for investing especially in small HPPs and this seems to be agleam of hope for future energy projections.
6. Conclusions
From the viewpoint of energy sources such as petroleum andnatural gas reserves, Turkey is not a rich country, but hasan abundant hydropower potential to be used for generation ofelectricity and must base its energy strategy on developing thewhole hydroelectric potential as soon as possible. Turkey’s mainindigenous energy resources are hydro and almost all oil naturalgas and high-quality coal are imported and, in order to avoidforeign dependency both in sources and funds, Turkey mustdiscover new and renewable energy resources. Renewable sourcesof power other than hydro (solar, wind, tide, geothermal, etc.) arealso valuable options. But, even if major efforts were made todevelop them, they will not be able to produce large amountsof energy in the coming decades. In assessing life cycle costs,hydropower consistently compares favorably with virtually allother forms of energy generation.
In this paper, Turkey’s hydroelectric potential and long-termelectric energy demand is reevaluated. Firstly, Turkey’s hydrocapacity is reevaluated according to DSI and new criteria by Bakır.Turkey’s annual economically feasible HP values calculated by DSI
are 128 TWh. However, according to findings of Bakır’s study, inwhich a new criterion is developed related to key concept of theeconomical feasibility, annual economically feasible HP goes up to188 TWh, with an increase ratio of 47% compared to DSI value.
Secondly, the results of eight methods, which have beencarried out to predict the Turkey’s long-term electric energydemand, are reviewed. By comparing the predicted values withthose observed in 2005, 2006 and 2007, three of these methodsare eliminated, as a result of incorrect predictions. Then, by takinginto consideration the increase ratios of population, electricenergy consumption per capita and total electric energy con-sumptions values, both observed in the past and predicted by DPT(State Planning Organization), new six prediction methods areintroduced. Various statistical properties, including mean, stan-dard deviation, coefficient of variation and confidence intervals fortwo confidence levels, are calculated for all of the scenarios.
Because of social and economic development of the country,the demand for energy and electricity is growing rapidly inTurkey. Depending on the applied scenario and used model,Turkey’s annual electric energy demand in 2010, 2015 and 2020varies between 222 and 242 TWh; 302 and 356 TWh; and 440 and514 TWh; with average values of 233, 334 and 476 TWh,respectively. There are some uncertainties in demand predictions.Much study should be carried out to reach more reliable
predictions. As new data are obtained, these predictions shouldbe updated.
A discussion on the role of hydropower in meeting demand isalso included in the paper. Because of the knowledge shortage onwhen the power plants will be in operation, it is impossible tocertainly predict this role. It is obvious that, however, hydropowercan meet 25–35% of Turkey’s electric energy demand in 2020 andnew energy plants should be made as soon as possible.
Small hydropower (SHP) plants are one of key concepts inTurkey’s energy projection. By evaluating small hydro potential,Turkey will provide important part of its electric energy demandfrom its own hydropower resources. By enlarging hydropowerpotential, the economical status of the rural people, most of whomare unemployed and poor, will be improved by constructingvarious kinds of structures and thus by diminishing unemploy-ment and by providing cheaper electricity for domestic usage.Therefore, the Turkish Government should encourage utilizinghydropower.
References
Alıs-, H., 2008. Turkey’s electric energy generation capacity projection and legalarrangements. In: Clean Energy Conference, 29–30 January 2008, Istanbul,Turkey, /http://www.turkey-now.org/db/docs/Clean_Energy_Conference_2008/AlisHalil_2008CleanEnergy.pdfS (in Turkish).
Bakır, N.N., 2007. Turkey’s hydropower potential and review of electricitygeneration policies from EU perspective /www.ere.com.trS.
Bakıs-, R., Demirbas-, A., 2004. Sustainable development of small hydropower plants(SHPs). Energy Sources 26, 1105–1118.
Balat, H., 2007. A renewable perspective for sustainable energy development inTurkey: the case of small hydropower plants. Renewable and SustainableEnergy Review 11, 2152–2165.
Bartle, A., 2002. Hydropower potential and development activities. Energy Policy30, 1231–1239.
Dincer, I., 1999. Environmental impacts of energy. Energy Policy 27, 845–854.Dincer, I., 2002. The role of exergy in energy policy making. Energy Policy 30,
137–149.DSI (General Directorate of State Hydraulics Works), 2008. /www.dsi.gov.trS.Frey, G.W., Linke, D.J., 2002. Hydropower as a renewable and sustainable energy
resource meeting global energy challenges in a reasonable way. Energy Policy30, 1261–1265.
Hamzac-ebi, C., 2007. Forecasting of Turkey’s net electricity energy consumption onsectoral bases. Energy Policy 35, 2009–2016.
Hepbasli, A., Ozdamar, A., Ozalp, N., 2001. Present status and potential ofrenewable energy sources in Turkey. Energy Sources 23, 631–648.
IEA (International Energy Agency), 2001. Energy Policies of IEA Countries Turkey2001 Review. IEA/OECD, Paris.
IHA (International Hydropower Association), 2000. ICOLD (International Commis-sion on Large Dams), IAHTP IEA (Implementing Agreement on Hydropowerand Programmes IEA), CHA(Canadian Hydropower Association). Hydropowerand World’s energy future.
Kaygusuz, K., 2001. Hydropower and biomass as renewable energy sources inTurkey. Energy Sources 23, 775–799.
Kaygusuz, K., 2002a. Renewable and sustainable energy use in Turkey: a review.Renewable and Sustainable Energy Review 6, 339–366.
Kaygusuz, K., 2002b. Environmental impacts of energy utilization and renewableenergy policies in Turkey. Energy Policy 30, 689–698.

ARTICLE IN PRESS
O. Yuksek / Energy Policy 36 (2008) 3374–33823382
Kaygusuz, K., 2004. Hydropower and the World’s energy future. Energy Sources 26,215–224.
Kaygusuz, K., Yuksek, O., Sarı, A., 2007. Renewable energy sources in the EuropeanUnion: markets and capacity. Energy Sources Part B 2, 19–29.
Kilic- , F.C- ., Kaya, D., 2007. Energy production, consumption, policies, and recentdevelopments in Turkey. Renewable and Sustainable Energy Reviews 11,1312–1320.
Paish, O., 2002. Small hydropower: technology and current status. Renewable andSustainable Energy Reviews 6, 537–556.
RTLED (Report of Turkey Long Term Electric Energy Demand), 2004. Ministry ofEnergy and Natural Resources, Ankara, Turkey (in Turkish).
TEIAS- (Turkish Electricity Transmission Company), 2005. Annual developmentof installed capacity gross generation supply and net consumption in Turkey/www.teias.gov.tr/istatistik2005/index.htmS.
TEIAS- (Turkish Electricity Transmission Company), 2007. Turkish Electrical Energy10-Year Generation Capacity Projection (2007–2016) /www.teias.gov.tr/engS.
Tunc- , M., C- amdali, U., Parmaksizoglu, C., 2006. Comparison of Turkey’s electricalenergy consumption and production with some European countries andoptimization of future electrical power supply investments in Turkey. EnergyPolicy 34, 50–59.
Yuksek, O., Kaygusuz, K., 2006. Small hydropower plants as a new and renewableenergy Source. Energy Sources Part B 1, 279–290.
Yuksek, O., Uc- uncu, O., 1999. Basic Hydrology with Solved Problems. KaradenizTechnical University Civil Engineering Department, Trabzon, Turkey (inTurkish).
Yuksek, O., Komurcu, M.I., Yuksel, I., Kaygusuz, K., 2006. The role of hydro-power in meeting Turkey’s electric energy demand. Energy Policy 34,3093–3103.
Yuksel, I., 2007. Development of hydropower: a case study in developing countries.Energy Sources Part B 2, 113–121.
Yumurtacı, Z., Asmaz, E., 2004. Electric energy demand of Turkey for the year 2050.Energy Sources 26, 1157–1164.