redrock property csamt survey - atokagold.com · csamt work, reported upon by wright (2010, 2011),...
TRANSCRIPT

REDROCK PROPERTY CSAMT SURVEY - II GIS COMPILATION
Resistivity Iso-Surface Looking North-Northwest
James L. Wright M.Sc. October 9, 2011

TABLE OF CONTENTS
INTRODUCTION . . . . . . . . . . . . . . . . . . . . . . . . . 2 SURVEY PROCEDURE . . . . . . . . . . . . . . . . . . . . . . 3 DATA PROCESSING . . . . . . . . . . . . . . . . . . . . . . . 4 INTERPRETATION . . . . . . . . . . . . . . . . . . . . . . . 6 CONCLUSIONS AND RECOMMENDATIONS . . . . . . . . . . . . 11 REFERENCES APPENDIX A- CSAMT LOGISTICS APPENDIX B- INVERSION SUMMARIES APPENDIX C- SECTION COMPILATION, SOIL & ROCK GEOCHEMISTRY APPENDIX D- PROPOSED DRILL HOLES & RESISTIVITY SECTIONS DVD HOLDER- DATABASE DVD MAP BINDER (1:6000 & 1:12000 Sets) -
CSAMT SURVEY, LINES GRAVITY RESIDUAL, CSAMT STRUCTURES - II
GRAVITY RESIDUAL, GRAVITY STRUCTURES - II CSAMT SURVEY, LINE 4458730N, INVERTED RESISTIVITY SECTION/ GRAVITY CSAMT SURVEY, LINE 4458930N, INVERTED RESISTIVITY SECTION / GRAVITY CSAMT SURVEY, LINE 4459130N, INVERTED RESISTIVITY SECTION / GRAVITY CSAMT SURVEY, LINE 4459330N, INVERTED RESISTIVITY SECTION / GRAVITY CSAMT SURVEY, LINE 4459530N, INVERTED RESISTIVITY SECTION / GRAVITY CSAMT SURVEY, LINE 4458730N, INVERTED RESISTIVITY SECTION / GEOLOGY CSAMT SURVEY, LINE 4458930N, INVERTED RESISTIVITY SECTION / GEOLOGY CSAMT SURVEY, LINE 4459130N, INVERTED RESISTIVITY SECTION / GEOLOGY CSAMT SURVEY, LINE 4459330N, INVERTED RESISTIVITY SECTION / GEOLOGY CSAMT SURVEY, LINE 4459530N, INVERTED RESISTIVITY SECTION / GEOLOGY
J L WRIGHT GEOPHYSICS 1

INTRODUCTION A second controlled source audio magneto-telluric (CSAMT) survey was completed over a portion of the REDROCK property with the objective of defining structures and lithologies associated with gold mineralization. Gravity in conjunction with the earlier CSAMT work, reported upon by Wright (2010, 2011), demonstrated the effectiveness of CSAMT for structural / lithologic mapping on the property. Indeed, an initial gravity survey with CSAMT follow-up is a standard technique applied with success in Nevada. Figure 1 shows the property outline relative to roads, county boundaries and topography.
FIGURE 1: Property Location Results of the survey are provided in digital and map formats. Digital products included all raw data and processed files, as well as MAPINFO and ARCGIS GIS files for the five (5) inverted resistivity sections. Also included are data and GIS files for a number of related data sets such as regional gravity, topography, geology, etc. The combined files constitute a complete GIS data base for the property. Maps include inversion section plots with interpretive overlay for the five lines at both 1:6000 and 1:12000 scales over residual gravity and geology. The lines are also provided as plots over the topography at both scales. All plot files are also included in digital form as SURFER V9 SRF files. Files, both digital and map, are contained on a DVD located in a sleeve at the rear of the report. A README file on the DVD explains the folder / file organization. Survey procedures and data processing are first reviewed followed by an interpretation of the CSAMT survey with incorporation of multiple data sets. Finally, recommendations and conclusions are presented, along with several proposed drill holes.
J L WRIGHT GEOPHYSICS 2
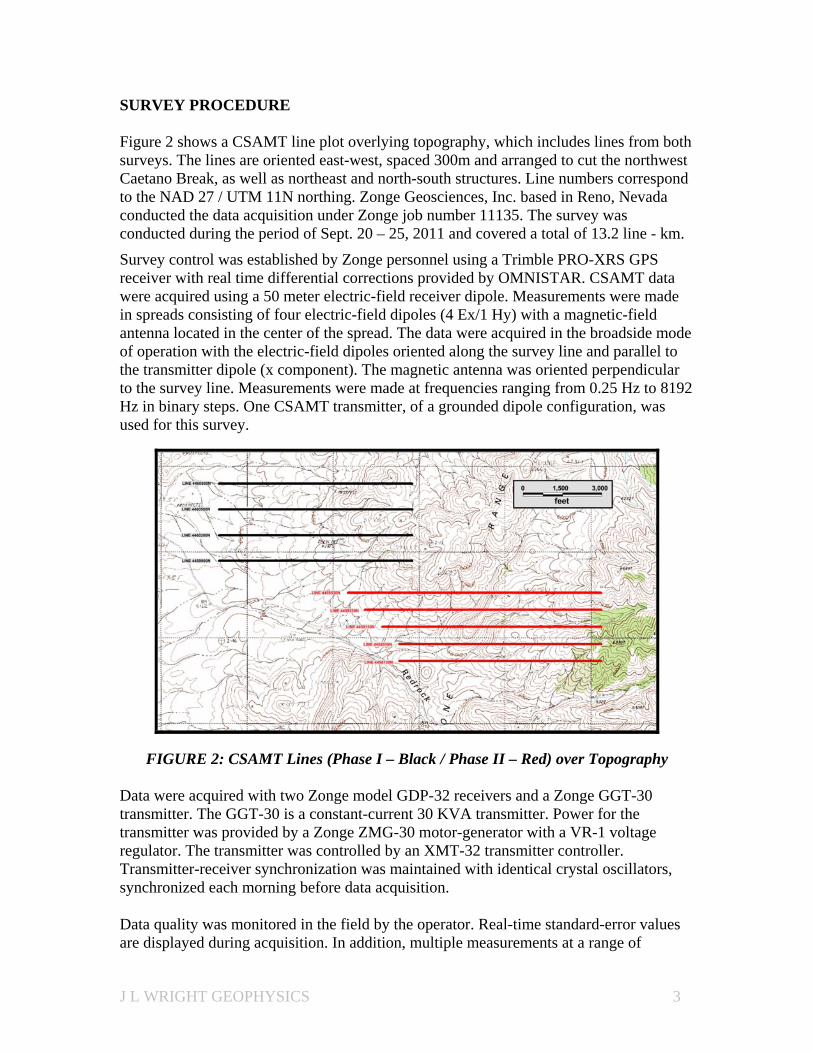
SURVEY PROCEDURE Figure 2 shows a CSAMT line plot overlying topography, which includes lines from both surveys. The lines are oriented east-west, spaced 300m and arranged to cut the northwest Caetano Break, as well as northeast and north-south structures. Line numbers correspond to the NAD 27 / UTM 11N northing. Zonge Geosciences, Inc. based in Reno, Nevada conducted the data acquisition under Zonge job number 11135. The survey was conducted during the period of Sept. 20 – 25, 2011 and covered a total of 13.2 line - km. Survey control was established by Zonge personnel using a Trimble PRO-XRS GPS receiver with real time differential corrections provided by OMNISTAR. CSAMT data were acquired using a 50 meter electric-field receiver dipole. Measurements were made in spreads consisting of four electric-field dipoles (4 Ex/1 Hy) with a magnetic-field antenna located in the center of the spread. The data were acquired in the broadside mode of operation with the electric-field dipoles oriented along the survey line and parallel to the transmitter dipole (x component). The magnetic antenna was oriented perpendicular to the survey line. Measurements were made at frequencies ranging from 0.25 Hz to 8192 Hz in binary steps. One CSAMT transmitter, of a grounded dipole configuration, was used for this survey.
FIGURE 2: CSAMT Lines (Phase I – Black / Phase II – Red) over Topography
Data were acquired with two Zonge model GDP-32 receivers and a Zonge GGT-30 transmitter. The GGT-30 is a constant-current 30 KVA transmitter. Power for the transmitter was provided by a Zonge ZMG-30 motor-generator with a VR-1 voltage regulator. The transmitter was controlled by an XMT-32 transmitter controller. Transmitter-receiver synchronization was maintained with identical crystal oscillators, synchronized each morning before data acquisition.
Data quality was monitored in the field by the operator. Real-time standard-error values are displayed during acquisition. In addition, multiple measurements at a range of
J L WRIGHT GEOPHYSICS 3

frequencies are displayed graphically as resistivity versus frequency curves with error bars showing the data scatter. This allows a visual evaluation of the data quality and remedial action to be taken if necessary. Data quality is also evaluated during post-acquisition processing by reviewing data component plots. Data are edited to remove spurious data if necessary. As a whole, the data are of good quality typified by repeated measurements generally within 5 percent. The smooth nature of the curves and lack of noticeable error bars also demonstrates good data quality. Additional logistical details are available in Appendix A, where a more complete discussion of the various aspects of the survey is presented. DATA PROCESSING Zonge Geosciences provided averaged and edit files, along with station survey information, for each line in standard Zonge AVG and STN files. These data were processed with Zonge’s SCS2D two dimensional, smooth model CSAMT inversion software version 3.20z. A variable cell size ranging from 50x35m to 50X65m was selected to better refine data fits. Prior to additional processing all inverted resistivities were converted to logarithms base ten. Gridding with a kriging algorithm using a five meter spacing was implemented. The grids were then mask to the topography, line limits and a depth extent of approximately 1300m. This depth is considerably larger than the first survey due to a lower frequency for the transition zone. Finally, the inverted sections were colored and contoured for map preparation. Contour interval on all plots is 0.05 log ohm-m. The resistivity color bar for all products, including GIS files, follows. The contour interval and color bar are consistent with the first CSAMT survey.
Complete Bouguer Anomaly (CBA) residual gravity data are included as a back-drop to the CSAMT sectional results. Wright (2010) reports on the survey and the color scale used for the plots and figures follows.
J L WRIGHT GEOPHYSICS 4

FIGURE 3: Plot Example
As noted previously, paper plots are provided at two scales along with SRF plot files. Figure 3 shows an example plot of a CSAMT section with all plots located in the accompanying binder. The inverted data for all lines from both surveys were merged and imported into the VOXLER 3D visualization program, an example image from the program follows.
FIGURE 4: VOXLER Inverted Sections
J L WRIGHT GEOPHYSICS 5

INTERPRETATION Figures 5 to 9 show the inverted resistivity sections for the lines rotated to plan about the line. Underlying the sections is the property scale geology of Conway et. al. (2007). Overlying the section is an interpretation with structures depicted with dashed or barbed (thrusts) lines and contacts with dotted lines. Various interpreted rock units are labeled. Possible silica alteration is denoted with a cross-hatched pattern. The silica alteration interpretations are based upon resistivity highs at locations which the geology suggests should not be highly resistive. However, several of the chert and quartzite units in the rock package exhibit similar resistivities. Thus the alteration interpretation should be considered speculative. The five lines have several common features. A wedge of Caetano Tuff and Quaternary colluvium (Tct / Qc) laps on to the west ends of all lines. Sub-horizontal layering is evident within the wedges. The Caetano Fault also occurs on all lines near the east edge of the Tct / Qc wedge or slightly to the west within the basin. Interestingly, the fault does terminate the Paleozoic (Pz) outcrop, but a major down-drop of the Pz is not indicate, rather a series of closely spaced structures down-drops Pz to the west. The Caetano Fault is manifested in the resistivity as a near vertical, relatively conductive zone cutting the Pz basement. Such a response is consistent with a large structure which has broken a considerable volume of rock. The broken rock increases porosity leading to reduced resistivity. Most surprising is a complex set of structures on the eastern end of all the lines. These high angle structures fall roughly along the thrusted contact between an Elder rock package to the west and a Devonian-Ordovician thrust sheet to the east as mapped by Conway et. al. (2007). The thrusted relationship mapped by Conway et. al. (2007) is not evident on the sections. Rock units appear to dip westerly west of the zone and easterly east of the zone. Indeed, the contact between the units could best be described as a collision zone, rather than one rock unit simply overriding another. Accordingly the zone is termed the “Collision Zone”. Interestingly, a dacite intrusion (Td) is mapped within the zone north of the lines. Figure 10 shows the geology overlain by a plan view of the Caetano Fault and Collision Zone extracted from the sectional interpretations. Note each of these features is composed of a number of structures, as would be expected for such large scale structures. Also shown on the figure are the rock chip gold values in the standard proportional dot format. Color legends for the both the rock chip and soil gold geochemistry are shown below. These legends apply to all gold geochemical data presented in the report.
Gold Rock and Soil Geochemistry Legends
J L WRIGHT GEOPHYSICS 6

FIGURE 5: L4458730N Inverted Resistivity Section over Geology
FIGURE 6: L4458930N Inverted Resistivity Section over Geology
J L WRIGHT GEOPHYSICS 7
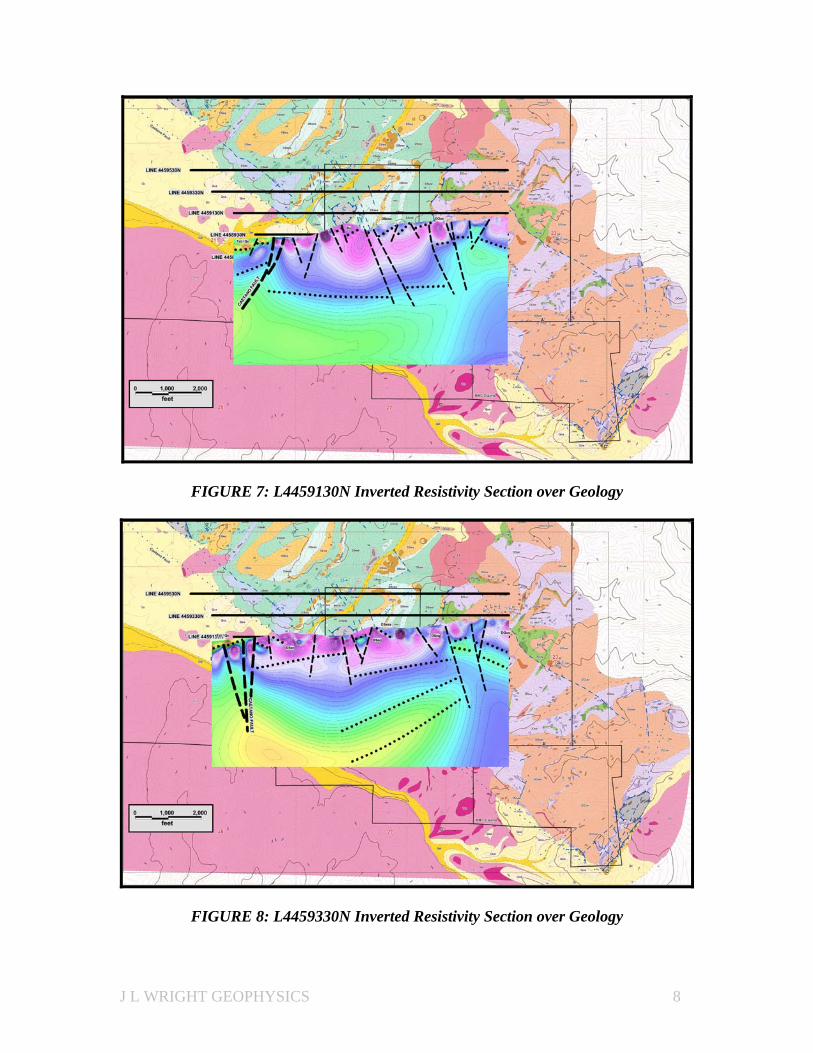
FIGURE 7: L4459130N Inverted Resistivity Section over Geology
FIGURE 8: L4459330N Inverted Resistivity Section over Geology
J L WRIGHT GEOPHYSICS 8

FIGURE 9: L4459530N Inverted Resistivity Section over Geology
FIGURE 10: Major Structures, Au Rock Geochemistry over Geology Figure 11 shows the two main structural features over the residual gravity discussed by Wright (2010). Placement of the Caetano Fault, or group of faults, based on the CSAMT agrees very well with that interpreted from the geology and gravity. The Collision Zone, as noted previously, correlates approximately with a mapped thrust which places Elder
J L WRIGHT GEOPHYSICS 9

rocks over a package of Devonian–Ordovician rocks. However, no high angle faults are mapped within the zone.
FIGURE 11: Major Structures, Au Soil Geochemistry over Residual Gravity Figure 11 shows the residual gravity with the major structures and gold soil geochemistry. The scale is somewhat larger than Figure 10. The southerly extension of the Collision Zone projects directly into a noticeable offset in the Caetano Fault. The sense of offset is apparent right lateral. No anomalous rock or soil geochemistry correlates with the Collision Zone; however, the zone does parallel a structure to the west with obvious gold mineralization (see Figure 10).
FIGURE 12: L4459130N Resistivity Section, Interpretation and Rock Au
J L WRIGHT GEOPHYSICS 10

A sectional analysis of the gold geochemistry with the CSAMT sections is presented in Appendix C. The ten figures in the appendix place the both rock and soil gold geochemistry over the five CSAMT inverted sections. Figure 12 shows an example for the rock chips and L4459130N. Of note is the correlation of rock chip anomalies along the north-south zone with interpreted structures on the section. Similar structural correlations are noted on the adjoining lines. The portion of the lines between the two main structural features is typified by variable high resistivities. Close examination of the geology reveals the quartzites and cherts tend to correlate with the higher resisivities and sandstones with somewhat lower values. The interpreted sections are labeled with rock units at a number of locations, which demonstrates this association. This intermediate portion of the lines is also cut by numerous smaller scale structures. At depth, beneath the near surface high resistivity rocks, is a layer of more conductive material which tends to slope downward from east to west. Depth to the layer ranges from 2500 – 3000’. Of course, both the Caetano Fault and Collision Zone dramatically disrupt or even terminate the layer. The depth is such that the layer is likely within the lower plate, perhaps a more carbonaceous unit. Indeed, Conway et. al. (2007) map the lower plate rocks as carbonaceous siltstones and cherts 5500’ southeast of the CSAMT lines. CONCLUSIONS AND RECOMMNEDATIONS The CSAMT survey defines two major structural zones – Caetano Fault and Collision Zone. Geologic mapping and previous gravity work define the Caetano Fault very well, which the present CSAMT survey agrees with perfectly. However, the Collision Zone has not been recognized in any of the previous work. Geologic mapping places a major thrust fault at the location, but does not identify the high angle nature of the zone. The zone trends north-south and parallels a known mineralized structure located approximately 2000’ to the west (see Figure 10). Furthermore, extending the zone south leads to an apparent right lateral offset in the Caetano Fault and extending the zone north leads to a mapped intrusion elongated along the zone. In fact, the mineralized structure to the west also offsets the Caetano Fault in a similar fashion. No obvious anomalous gold geochemistry is noted along the zone; however, slightly anomalous soil samples are noted near the southern end of the zone (see Figure 11). Recognition of the Collision Zone is significant as a new location for possible mineralization. The zone appears to be large and to have controlled emplacement of an intrusion north of the CSAMT lines. Clearly, a rigorous ground examination is required with detailed geochemical sampling. In addition, a more cursory ground examination of the secondary structures and alteration along the lines should be conducted. Figure 13 shows three proposed holes designed to test the Collision Zone. Table 1 provides hole location detail with the collar coordinates in NAD 27 / UTM 11N. The holes are placed slightly east of the surface trace of structures to test the zone at depth near lower plate rocks. This geometry is presented in sectional form in Appendix D, which shows the proposed holes in section over the corresponding CSAMT inverted resistivity section. Of
J L WRIGHT GEOPHYSICS 11

course, adjustments to the hole locations may be required based upon results from the proposed ground examination.
FIGURE 13: Proposed Drill Holes over Geology
HOLE COLLAR_E COLLAR_N INCL TD (ft) P1 499875 4458730 90 2000 P2 499715 4459130 90 2000 P3 499800 4459335 90 2000
TABLE 1: Proposed Hole Details
REFERENCES
Conway, K., Jones, W., Leger, A., Percival, T., Park, D and Dilles, P., 2007, 2007 Redrock Canyon Annual Report, Centerra (U.S.) Inc., Geologic map of the Redrock Canyon Property: Centerra (U.S.) Inc. company map. Wright, J. L., 2010, Redrock property, Gravity survey, GIS database: Challenger Deep Capital Corp. company report. Wright, J. L., 2011, Redrock property, CSAMT survey, GIS database: Sagebrush Gold company report.
J L WRIGHT GEOPHYSICS 12

APPENDIX A
CSAMT SURVEY
ON THE
REDROCK PROJECT
LANDER COUNTY, NEVADA
FOR
ARTTOR GOLD
DATA ACQUISITION REPORT
ZONGE JOB# 11135
ISSUE DATE: 27 September 2011
ZONGE GEOSCIENCES INC.
924 Greg Street
Sparks, Nevada 89431
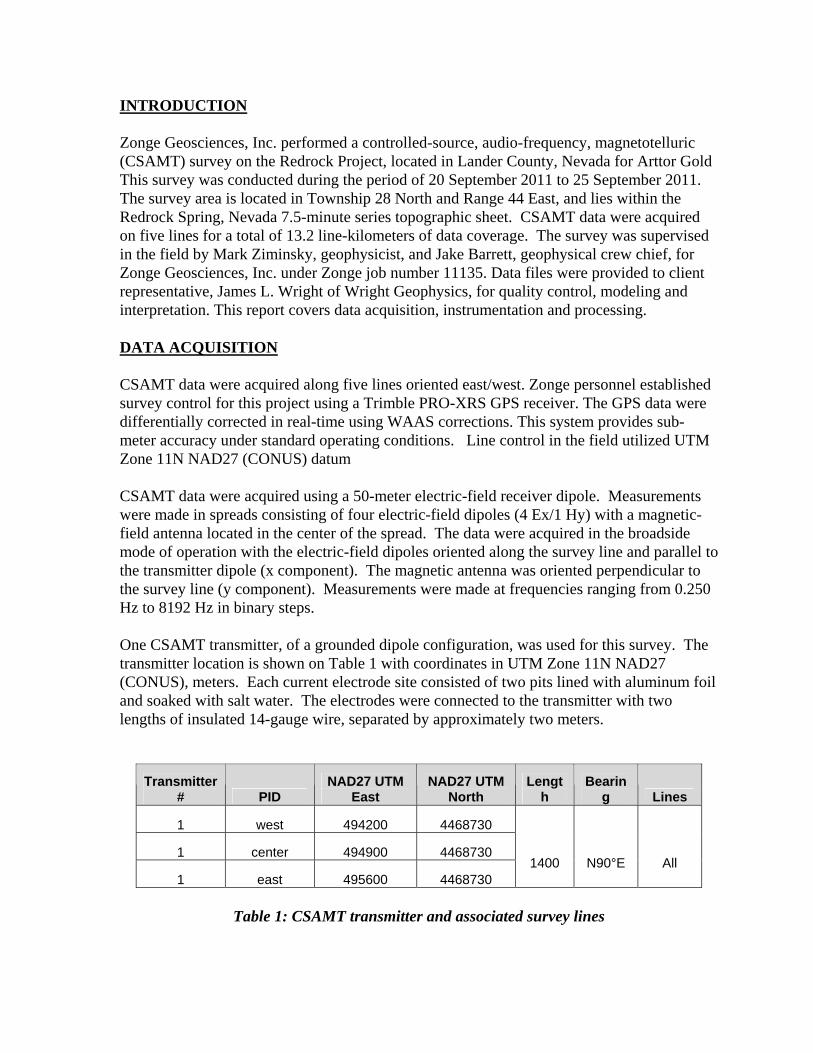
INTRODUCTION Zonge Geosciences, Inc. performed a controlled-source, audio-frequency, magnetotelluric (CSAMT) survey on the Redrock Project, located in Lander County, Nevada for Arttor Gold This survey was conducted during the period of 20 September 2011 to 25 September 2011. The survey area is located in Township 28 North and Range 44 East, and lies within the Redrock Spring, Nevada 7.5-minute series topographic sheet. CSAMT data were acquired on five lines for a total of 13.2 line-kilometers of data coverage. The survey was supervised in the field by Mark Ziminsky, geophysicist, and Jake Barrett, geophysical crew chief, for Zonge Geosciences, Inc. under Zonge job number 11135. Data files were provided to client representative, James L. Wright of Wright Geophysics, for quality control, modeling and interpretation. This report covers data acquisition, instrumentation and processing. DATA ACQUISITION CSAMT data were acquired along five lines oriented east/west. Zonge personnel established survey control for this project using a Trimble PRO-XRS GPS receiver. The GPS data were differentially corrected in real-time using WAAS corrections. This system provides sub-meter accuracy under standard operating conditions. Line control in the field utilized UTM Zone 11N NAD27 (CONUS) datum CSAMT data were acquired using a 50-meter electric-field receiver dipole. Measurements were made in spreads consisting of four electric-field dipoles (4 Ex/1 Hy) with a magnetic-field antenna located in the center of the spread. The data were acquired in the broadside mode of operation with the electric-field dipoles oriented along the survey line and parallel to the transmitter dipole (x component). The magnetic antenna was oriented perpendicular to the survey line (y component). Measurements were made at frequencies ranging from 0.250 Hz to 8192 Hz in binary steps. One CSAMT transmitter, of a grounded dipole configuration, was used for this survey. The transmitter location is shown on Table 1 with coordinates in UTM Zone 11N NAD27 (CONUS), meters. Each current electrode site consisted of two pits lined with aluminum foil and soaked with salt water. The electrodes were connected to the transmitter with two lengths of insulated 14-gauge wire, separated by approximately two meters.
Transmitter # PID
NAD27 UTM East
NAD27 UTMNorth
Length
Bearing Lines
1 west 494200 4468730
1 center 494900 4468730
1 east 495600 4468730 1400 N90°E All
Table 1: CSAMT transmitter and associated survey lines

CSAMT MEASUREMENTS The CSAMT data are collected by measuring the magnitude and phase of the electric and magnetic fields. Measurements are made at discrete frequencies in binary steps. The receiver measures the magnitude of the received signal and the absolute phase difference between the received signal and the transmitted signal, which is known via synchronization of the transmitter and receiver. The measured data are stored in the receiver memory and output in ASCII format data files INSTRUMENTATION Data were acquired with Zonge model GDP-32II receivers, serial numbers 3287T and 32287T. These instruments are backpack-portable, 16 bit, microprocessor-controlled receivers that can gather data on as many as eight channels. The electric-field signal was measured at the receiver site using non-polarizing ceramic Cu-CuSO4 porous-pot electrodes connected to the receiver with insulated 14-gauge wire. CSAMT magnetic-field measurements were made with Zonge ANT/6 antenna coils, serial numbers 246 and 2466. The signal source for the CSAMT measurements was a Zonge GGT-30 transmitter, serial number 2094. The GGT-30 is a constant-current 30 KVA transmitter. Power for the transmitter was provided by a Zonge ZMG-30DL motor-generator equipped with a built-in voltage regulator. An XMT-32 transmitter controller, serial number 4148, controlled the transmitter. Transmitter-receiver synchronization was maintained with identical crystal oscillators, synchronized each morning before data acquisition. DATA PROCESSING Routine data processing consists of the following steps:
1) Initial log-log plots are reviewed to evaluate the data. 2) Data identified as spurious by the operator or individual measurements that are obvious outliers with respect to multiple repeat measurements are flagged and removed from further processing. 3) Raw data files (.raw) are processed via the CSAVGW program to produce an intermediate (.zdb) file. Corrections for polarity or calibration errors are made at this step. The output (.zdb) file has a single record containing all data for each individual stack or data block taken for each data channel. 4) The individual measurements (stacks) are averaged for each channel in the CSAVGW program and output in a column-based ASCII file (.avg) with a single averaged value for each parameter for each channel (station). 5) The average data are processed with the ASTATIC algorithm. Individual sounding curves are viewed and final removal of individual measurements that are considered to be affected by coherent noise is made. Log-log plots and the parametric pseudosections are generated at this step.
DATA QUALITY

Data quality is monitored in the field by the operator. Real-time standard-error values are displayed during acquisition. In addition, multiple measurements at a range of frequencies are displayed graphically as resistivity versus frequency curves with error bars showing the data scatter. This allows a visual evaluation of the data quality and remedial action to be taken if necessary. Data quality is also evaluated during post-acquisition processing by reviewing data component plots. Data are edited to remove spurious data if necessary. The data for this survey are of good quality, with repeated measurements generally within 5 percent. The smooth nature of the curves and lack of noticeable error bars, demonstrates good data quality.
SAFETY AND ENVIRONMENTAL ISSUES No health, safety incidents or accidents occurred during the course of this survey. No environmental damage was sustained as a direct result of the survey progress. Vehicle travel was kept to existing roads.
PRODUCTION LOG:
Date Notes
9/20/2011 Setup transmitter bipole. GDP 3282T: Line 8730N. GDP 32287T: Line 8930N
9/21/2011 GDP 3282T: line 8730N. GDP 32287T: line 8930N
9/22/2011 GDP 3282T: lines 8730N - 9130N. GDP 32287T: lines 8930N - 9330N
9/23/2011 GDP 3282T: line 9130N. GDP 32287T: line 32287T: line 9330N.
9/24/2011 GDP 3282T: lines 9130N - 9530N. GDP line 32287T: line 9330N - 9530N
9/25/2011 GDP 3282T: line 9530N. GDP 32287T: line 9530N. Reclaimed transmitter bipole.

APPENDIX B
INVERSION SUMMARIES

FIGURE B1: Line 4458730N Inversion

FIGURE B2: Line 4458930N Inversion

FIGURE B3: Line 4459130N Inversion

FIGURE B4: Line 4459330N Inversion

FIGURE B5: Line 4459530N Inversion

APPENDIX C
SECTION COMPILATION
SOIL & ROCK GEOCHEMISTRY

FIGURE C1: L4458730N Au Soils

FIGURE C2: L4458930N Au Soils

FIGURE C3: L4459130N Au Soils
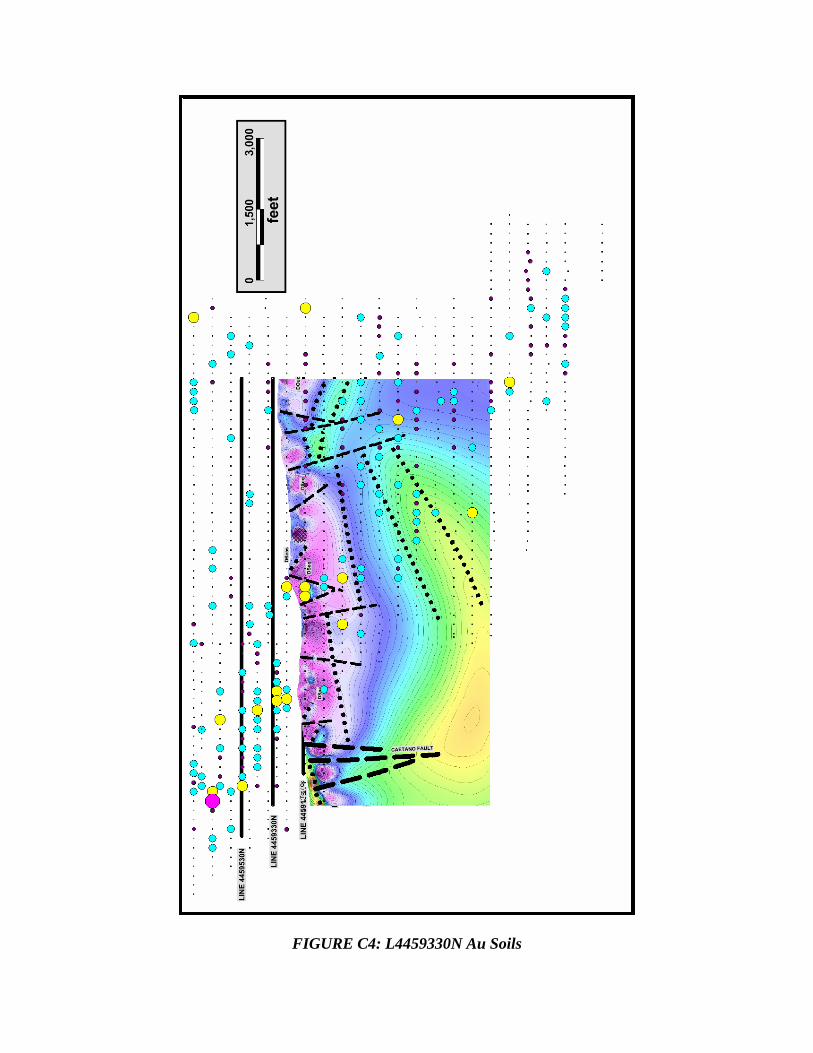
FIGURE C4: L4459330N Au Soils

FIGURE C5: L4459530N Au Soils

FIGURE C6: L4458730N Au Rocks
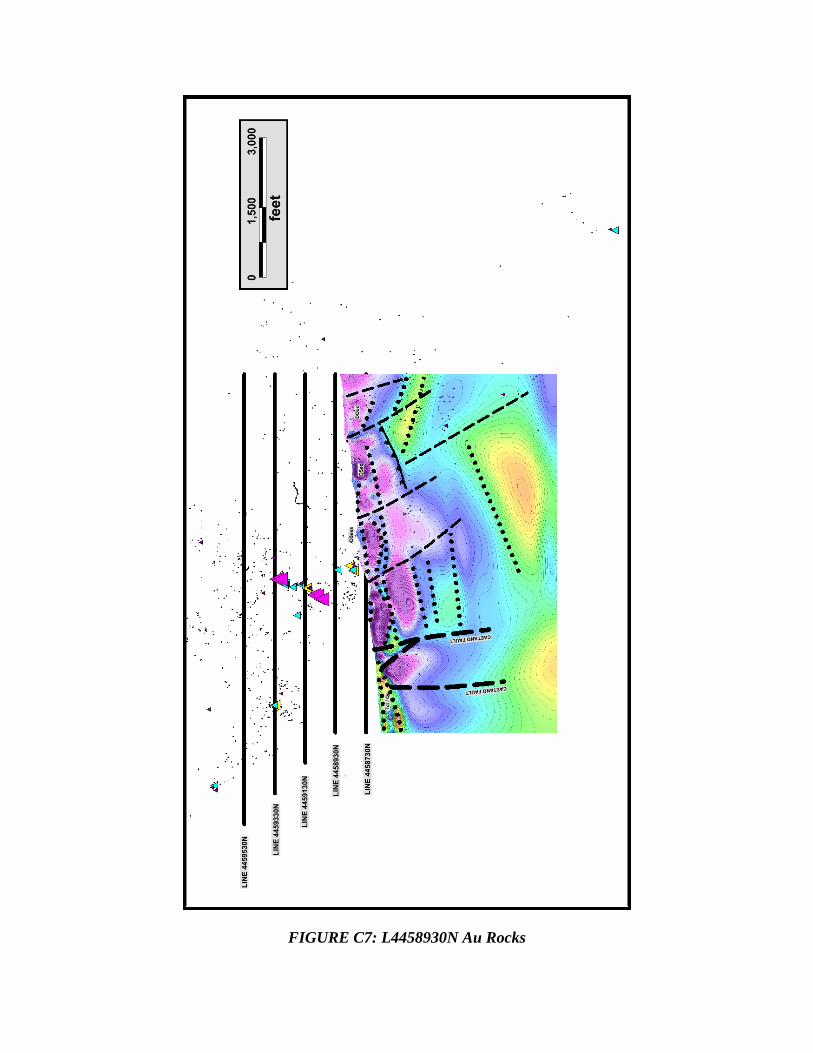
FIGURE C7: L4458930N Au Rocks

FIGURE C8: L4459130N Au Rocks

FIGURE C9: L4459330N Au Rocks

FIGURE C10: L4459530N Au Rocks

APPENDIX D
PROPOSED DRILL HOLES & RESISTIVITY SECTIONS
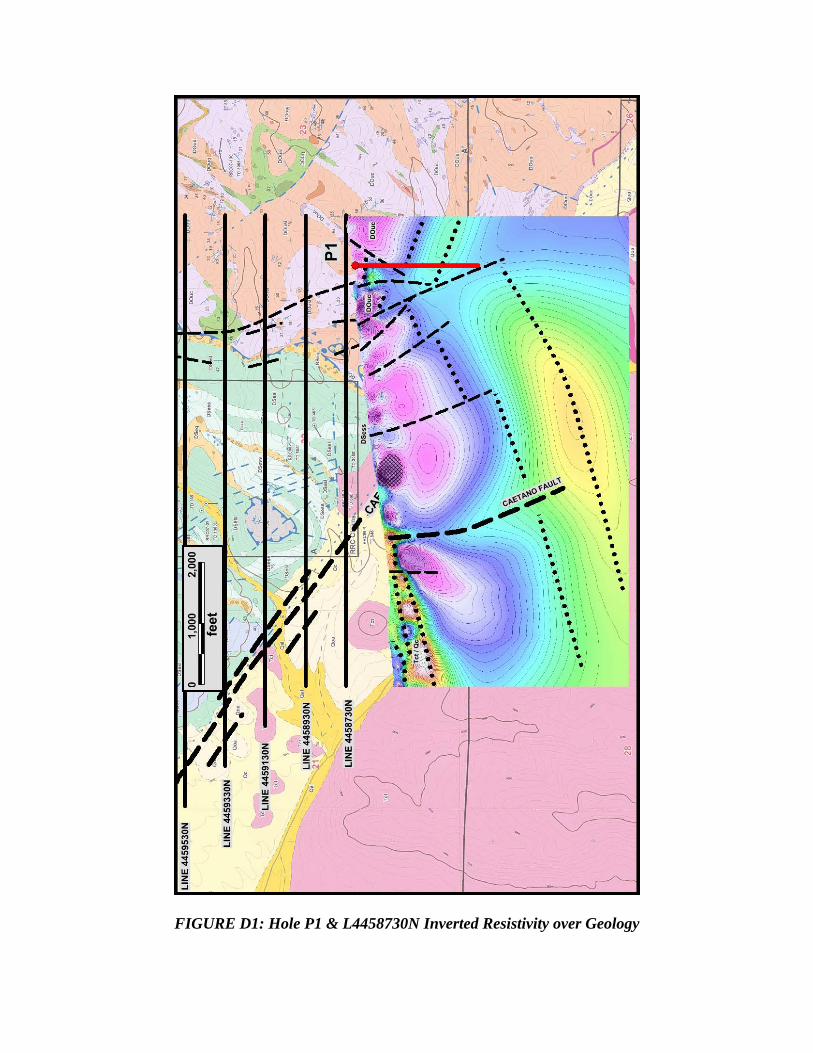
FIGURE D1: Hole P1 & L4458730N Inverted Resistivity over Geology

FIGURE D2: Hole P2 & L4459130N Inverted Resistivity over Geology

FIGURE D3: Hole P3 & L4459330N Inverted Resistivity over Geology