redlands · pdf fileproblem areas are in terms of water quality and ... extended the...
TRANSCRIPT

RedlandsWaterway Recovery Report - Condition Summary 2010

The Redlands Waterway Recovery Report was compiled by the Redland City Council Environmental Protection Unit.
Katrina Udell Adviser Waterways Management
Warren Mortlock Principal Adviser, Environmental Protection
AcknowledgementThroughout this report, data from the Ecosystem Health Monitoring Program has been reproduced with the kind permission of South East Queensland Healthy Waterways Partnership.

It gives me great pleasure to present Redland City Council’s Waterway Recovery Report - Condition Summary 2010. This document will be an invaluable tool in initiating annual reporting of the condition of our local waterways, and reporting on progress made with management actions and priorities set to improve them.
This is a starting point for our local waterways report card, to compliment and provide even greater detail than the regional SEQ Ecosystem Health Report Card issued annually by the SEQ Healthy Waterways Partnership, of which Council is a member.
Council has been collecting its own waterway health data since 2004, and this information coupled with that provided through the Healthy Waterways Partnership, shows that the health of our waterways is declining. This reflects the ongoing challenge we face in balancing development with preserving and enhancing our natural environment.
Council is determined to halt and reverse this trend. To do this, we need to know where the problem areas are in terms of water quality and ecosystem health, and what may be causing these problems. Ongoing monitoring and reporting form the basis for planning efficient and effective waterway improvement actions that will provide maximum benefit for our investment.
If we want to make headway on improving waterway conditions, we need to adopt a coordinated, city-wide approach. The Waterway Recovery Reports will underpin this approach, and track improvements in waterway health over the years as a result of on-ground efforts.
Council have already invested a great deal of time and energy into programs to address the health of our freshwater and estuarine waterways.
In the past 12 months, Council has planted almost 33,000 plants to help stabilise creek banks and restore riparian areas across the city. Bushcare groups managed half a hectare of riparian land and planted over 2,000 plants around waterways and wetlands over the same period.
In August 2009 I had the pleasure of launching the Redland Waterways Extension Program (WEP), through which Council is partnering with landholders to help them identify and manage the sources of nutrients and sediment entering waterways from their properties.
The Waterways Extension Program acts on the findings of Council’s Hotspot Water Quality Monitoring Program (the Hotspot Program), which identifies the sources of nutrients and sediment entering the creek during rainfall.
In April 2009, Council purchased 282 hectares of conservation land at Kidd Street, Redland Bay. This land includes the entire headwaters of the eastern branch of the Serpentine Creek and has extended the continuous reserve to a total of 725 hectares in this catchment.
I hope that Council’s efforts to date and the production of this and future waterway recovery reports will encourage residents to get involved with improving the health of our waterways. There are simple things that we can all do, such as watching what we put down the drain – stormwater drains directly into our creeks and then out to Moreton Bay. For more direct action, join a Bushcare group and help with riparian revegetation or consider the Waterways Extension Program.
We still have a long way to go to reverse the declining health of our waterways, but the production of the Waterway Recovery Report serves as our commitment to the people of the Redlands.
Melva E Hobson PSMMayor of Redlands
It gives me great pleasure to present Redland City Council’s Waterway Recovery Report -
MayorÕ s forward First Waterway Recovery Report

Ambient water quality monitoring Regular monitoring of waterways regardless of climatic conditions and rainfall timing. Provides baseline data for the creek during normal conditions. Helps identify point source pollutants.
Aquatic macro-invertebrates Animals without backbones that live in the water and are large enough to see with the naked eye (e.g. beetles, bugs, shrimp and snails) (EHMP, 2008).
Catchment A catchment is the area of land bounded by ridges, hills or mountains, from which rainfall gathers and flows to a low point (i.e. a creek, river or wetland) and eventually to the sea.
Diffuse pollutant source Pollution that comes from many sources in the landscape and does not have an obvious discharge point, e.g. runoff from several properties in a rural area.
E2 pollutant export modelling E2 is a software product that estimates of the amount of rainfall runoff and pollutant loads exported from a catchment, using data such as land use, elevation, rainfall and water monitoring data (Stewart, 2008).
EHMP Ecosystem Health Monitoring Program. Established by South East Queensland Healthy Waterways Partnership and monitors a range of ecosystem health indicators in South East QueenslandÕ s (SEQ) catchments twice a year to assess ecosystem health across the region. The results are released annually as a report card with grades (A Ð F) for 18 major catchments, 18 estuaries and nine zones within Moreton Bay (EHMP, 2008).
Environmental values Particular values or uses of the waterway that are important for a healthy ecosystem or for public benefit, welfare, safety or health. These values require protection from the effects of pollution, waste discharges and deposits (ANZECC, 2000).
Erosion The gradual wearing and washing away of rock and soil by physical forces such as water, rain or wind.
Event water quality monitoring Water quality monitoring carried out during and following rainfall events. The majority of pollutants enter waterways in rainfall runoff, making this type of monitoring very important. This program measures nutrients and sediment.
Hotspot water quality monitoring Strategic monitoring of discrete sections of a waterway to identify and narrow down where nutrients and sediment are entering a creek from the catchment.
Load The amount of a substance (in this case nutrients or sediment) that is carried or transported through a waterway in a certain period of time.
NSI North Stradbroke Island.
PET Refers to families of macro-invertebrates that belong to the Plecoptera, Ephemeroptera and Trichoptera orders, which are particularly sensitive. Their presence is an indicator of stream health Ð their abundance declines with increasing human impact (EHMP, 2008).
Point pollutant source Pollution with a single, localised source, e.g. a wastewater pipe from an industrial activity.
RAMSAR The Convention on Wetlands, signed in Ramsar, Iran, in 1971, is an intergovernmental treaty which provides the framework for national action and international cooperation for the conservation and wise use of wetlands and their resources.
Riparian Relating to the bed or banks of a waterway, e.g. riparian vegetation grows on the banks of a waterway.
SIGNAL score Stream Invertebrate Grade Number Ð Average Level. A simple scoring system for measuring ecological health of streams based on the average sensitivity of the macro-invertebrates recorded (e.g. sensitive macro-invertebrates would be found in less disturbed ecosystems) (EHMP 2008).
SMBI Southern Moreton Bay Islands, including Karragarra, Macleay, Lamb and Russell Islands
Taxa richness Taxa refers to a group of related organisms, in this case groups of macro-invertebrates including beetles, spiders, snails, shrimp etc. Taxa richness is the number of different taxa recorded, which generally increases with better ecological condition (EHMP, 2008).
WQO Water Quality Objective. A set of values listed in the Qld Water Quality Guidelines (EPA, 2006) that water quality results can be assessed against. Achieving the WQOs for a waterway means the corresponding environmental values and uses of that waterway will be protected.
Glossary and acronyms
3

Contents
Introduction to Report
Introduction ..............................................................................................5
Background ..............................................................................................7
Waterway recovery indicators ...................................................................9
Guide to Waterway Recovery Report ....................................................... 11
Executive summary .................................................................................13
The creeks
Tarradarrapin Creek ................................................................................ 17
Hilliards Creek .........................................................................................19
Cleveland and Thornlands Creeks............................................................21
Eprapah Creek ........................................................................................23
South-eastern creeks ..............................................................................25
Southern Creeks .....................................................................................27
Upper Tingalpa Creek .............................................................................29
Lower Tingalpa Creek .............................................................................31
Stradbroke Island catchments ..................................................................33
Coochiemudlo and Southern Moreton Bay Islands (SMBI) catchments .....35
City-wide status ......................................................................................37
Findings, challenges and recommendations
Major findings and challenges for improving creek health .......................43
Waterway Recovery Report recommendations ........................................45
Appendices and tables
Management actions completed to date .................................................47
Calculating ratings for indicators .............................................................49
Median values for water quality data ......................................................52
4

The Redlands Waterway Recovery Report - Condition Summary 2010 looks closely at vital statistics and measures that provide a snapshot of the condition of the freshwater reaches of Redlands waterways. It’s a bit like a health check for our creeks. It will present a summary of waterways data collected to date, and provide a starting point for annual waterway recovery reporting. It can identify important issues and be used to help set priorities for planning and management – so it is also much like Redland City Council’s annual State of the Environment Report except more detailed and just concerned with waterways. The reporting process can also help us to track the recovery of Redlands waterways as we improve our management and fix health problems.
Read on to find out some fascinating facts about your local waterway, and what condition it is in. Did you know that Redlands is home to three types of rare fish, and that three types of native fish were recently discovered that hadn’t been identified in Redlands before? There is even a creek that supports a healthy fish community in naturally acidic (very low pH) water (Moffatt, 2008). Some of the semi-aquatic species that rely on our creeks include 19 species of frogs, four species of turtles, water dragons, a freshwater snake species (Keelback), water skinks and water rats (BAAM, 2008a and BAAM 2008b).
Even though you may not live near one of these waterways, we all live in a water catchment. A catchment is the area of land bounded by ridges, hills or mountains, from which rainfall gathers and flows to a low point (e.g. a creek, river or wetland) and eventually to the sea – in our case to Moreton Bay. When it rains, any pollutants on the land such as fertilisers; grease and oils from roads; and litter in gutters and on pathways all wash into the stormwater system and into the creeks, wetlands and estuaries.
Do you know the catchments within which you live, work and play? Because of the connection between the land and waterways, our day-to-day activities within a catchment can have an impact on the quality of the water and habitat in the creek – and ultimately Moreton Bay. Find the creek catchment you live in using the map in Figure 1.
Redland City has many wonderful waterways including unique freshwater lakes and wetlands on North Stradbroke Island and other bay islands, inter-tidal areas along extensive foreshores, many small saltwater estuaries, freshwater creeks, wetlands, lakes and dams. Many of the creeks are small, flow infrequently and only after rainfall. There are no large rivers in the city although the Logan River mouth forms a small part of the city’s southern boundary.
IntroductionWelcome to the first Redlands Waterway Recovery Report.
Thorneside
Birkdale
Wellington Point
Ormiston
ClevelandAlexandra Hills
Capalaba
Thornlands
Victoria PointSheldon
Mount Cotton
Redland Bay
North Stradbroke Island
Coochiemudlo Island
MacleayIsland
RussellIsland
LambIslandKarragarra
Island
Thorneside
Birkdale
Wellington Point
Ormiston
ClevelandAlexandra Hills
Capalaba
Thornlands
Victoria PointSheldon
Mount Cotton
Redland Bay
North Stradbroke Island
Coochiemudlo Island
Brisbane City Council
LoganCity Council
Peel Island
Gold Coast City Council
MacleayIsland
RussellIsland
LambIslandKarragarra
Island
12 3
4
5
6
78
910
11
12
13
14
15
16
17
18
12 3
4
5
6
78
910
11
12
13
14
15
16
17
18
How healthy is your local waterway?The name of this report highlights the need for a recovery in our creeks. The health of our waterways is generally poor and declining. There continues to be downward trends in water quality and waterway health data in recent years. Redland City is under continued pressure to cope with new development and intensified land use. The health of our freshwater waterways is threatened by pollutants in stormwater run-off, removal of vegetation, erosion and sediment, damming/alteration of watercourses, and road sealing and concreting which leads to increased volume and speed of run-off.
These threats combine to create creeks with fragmented, unhealthy pools with too many exotic fish or too few insects and other life; too often cleared of vegetation or with eroding banks and overtaken by weeds.
The people who see this first hand are those who use the local waterways for:
• recreation–water-basedfunsuchasswimming,fishing, sailing and canoeing
• passiverecreation–suchaswalking,photography or sight-seeing along the creeks
• agriculture–providingwaterfromadamontheir property for livestock or irrigation.
A healthy waterway can cope with a certain amount of pollutant, however this capacity is greatly reduced when the health of the waterway declines.
Water qualityrefers to the physical, chemical and biological characteristics of water in a waterway.
Waterway healthrefers to the condition of the waterway as a whole, including the condition of bed and banks, water, vegetation and aquatic organisms.
5

The importance of reporting on waterway healthWater quality and health problems in Moreton Bay are a result of problems in the waterways that flow into the bay. Fixing health problems in the waterways will have the flow-on effect of improving the health of the bay.
We can all help in working to fix the health problems in Redlands’ waterways.
Alongside identifying the problems, we also need regular monitoring
and reporting to see what progress we are making.
This initial report is a more in-depth summary of waterway conditions. Future yearly reports will provide an update on conditions, results of projects and studies, and management actions to improve waterway health.
that flow into the bay. Fixing health problems in the waterways will have the flow-on effect of improving the health of the bay.
We can all help in working to fix the health problems in Redlands’ waterways.
Alongside identifying the problems, we also need regular monitoring
and reporting to see what progress we are making.
This initial report is a more in-depth summary of waterway conditions. Future yearly reports will provide an update on conditions, results of projects and studies, and management actions to improve waterway health.
Thorneside
Birkdale
Wellington Point
Ormiston
ClevelandAlexandra Hills
Capalaba
Thornlands
Victoria PointSheldon
Mount Cotton
Redland Bay
North Stradbroke Island
Coochiemudlo Island
MacleayIsland
RussellIsland
LambIslandKarragarra
Island
Thorneside
Birkdale
Wellington Point
Ormiston
ClevelandAlexandra Hills
Capalaba
Thornlands
Victoria PointSheldon
Mount Cotton
Redland Bay
North Stradbroke Island
Coochiemudlo Island
Brisbane City Council
LoganCity Council
Peel Island
Gold Coast City Council
MacleayIsland
RussellIsland
LambIslandKarragarra
Island
12 3
4
5
6
78
910
11
12
13
14
15
16
17
18
12 3
4
5
6
78
910
11
12
13
14
15
16
17
18
Redland catchments
Figure 1
1. Tarradarrapin Creek Catchment
2. Hilliards CreekCatchment
3. Cleveland Catchment
4. Thornlands Catchment
5. Eprapah Creek Catchment
6. Moogurrapum Creek Catchment
7. Southern Redland Bay Catchment
8. Serpentine CreekCatchment
9. Native Dog Creek Catchment
10. California Creek Catchment
11. Upper Tingalpa Creek Catchment
12. Lower Tingalpa and Coolnwynpin Creek Catchment
13. North Stradbroke Island
14. Coochiemudlo Island
15. Macleay Island
16. Lamb Island
17. Karragarra Island
18. Russell Island
This is the role of the Redlands Waterway Recovery Report: to inform and help people better manage our waterways in order to halt the decline in the health of Redlands’ creeks and Moreton Bay.
6

Why develop a local report card?Water quality data has been collected in the Redlands since 1996, initially as part of a partnership between the now Department of Environment and Natural Resource Management (DERM) and Council. Council has been conducting monthly water quality monitoring independently since 2004.
This data has been reported in Council’s 2008 State of the Environment Report
but only at a general level for Redlands catchments as a whole.
Various studies and plans have been completed by Council over the past six years which also contain data that has not been made publicly available, including a State of the Creeks survey (Dudgeon, 2007), pollutant export modelling (Stewart, 2008), a fish and macro-
invertebrates assessment (Moffatt, 2008) and soils
mapping (Thompson 2008).
In recent years, Council has increased its spending on waterway
management, upgraded sewage treatment plants and introduced tighter
controls on development. We need to be able to track improvements in waterway health over time in order to assess the effectiveness of such measures. An overview of some of the recent research projects and their outcomes is presented in Appendix 1.
Background
This data has been reported in Council’s 2008 State of the Environment Report
but only at a general level for Redlands catchments as a whole.
Various studies and plans have been completed by Council over the past six years which also contain data that has not been made publicly available, including a State of the Creeks survey (Dudgeon, 2007), pollutant export modelling (Stewart, 2008), a fish and macro-
invertebrates assessment (Moffatt, 2008) and soils
mapping (Thompson 2008).
In recent years, Council has increased its spending on waterway
management, upgraded sewage treatment plants and introduced tighter
controls on development. We need to be able
The Recovery Report is a new initiative of Council to meet the need for a tracking mechanism. Reports will be published annually so that residents can follow the progress of recovery in our waterways.
7
Relationship to State of the Environment reportingThe Waterway Recovery Report - Condition Summary 2010 uses indicators of waterway health to provide a snapshot of the condition of a waterway. The use of indicators is similar to the analysis used in Redland City Council’s State of the Environment report, but more detailed. Information from yearly waterway recovery reports will help in the development of the water sections of future State of the Environment reports.
Relationship to regional Healthy Waterways Partnership Ecosystem Health Monitoring Program (EHMP) reportingThe annual regional report card produced by the south east Queensland EHMP has given the ecosystem health of Redlands freshwater catchments a ‘fail’ rating for the past four years (2005-2008). This is based on sampling twice a year at seven sites across four of the 12 mainland catchments – Eprapah (2 sites), Hilliards (2), Tingalpa (2) and Moogurrapum (1).
The EHMP report card is based on a regional monitoring program which compares the health of the waterways across south east Queensland. The results of the monitoring program are standardised and averaged across the city. Using methods developed in large south east Queensland river catchments, the purpose of the EHMP report card is to:
• assessthebroadecosystemresponsesacross the region to natural pressures and human activities;
• allowcatchmentmanagerstoevaluateandcommunicate overall ecosystem and community benefits from investment in environmental protection actions; and
• providemanagersandresearcherswithfeedback required to target investment in management of south east Queensland’s catchments, estuaries and Moreton Bay.
The EHMP does not provide priorities or direction for improving waterway health at the local scale.
The Recovery Report allows greater understanding of local waterway health issues and over the years will allow Council to track local-scale improvements in waterway health more closely than the regional report. The Recovery Report should be read in conjunction with the Healthy Waterways EHMP Report Card.
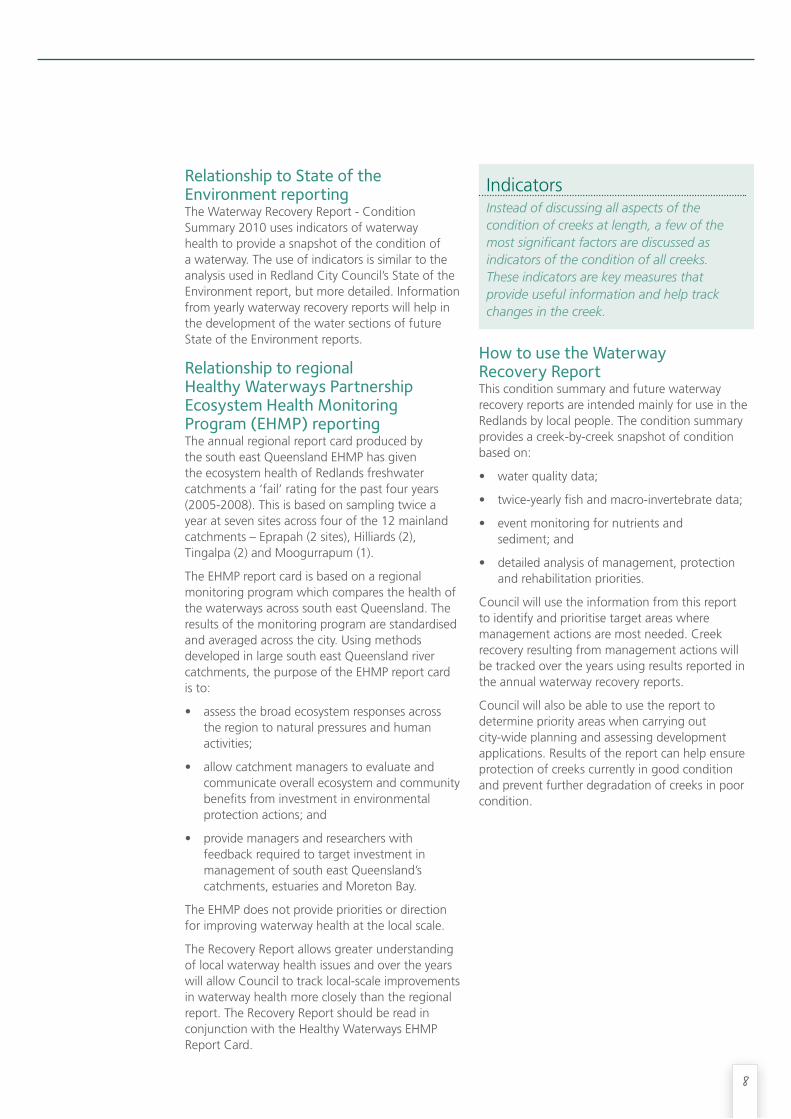
IndicatorsInstead of discussing all aspects of the condition of creeks at length, a few of the most significant factors are discussed as indicators of the condition of all creeks. These indicators are key measures that provide useful information and help track changes in the creek.
How to use the Waterway Recovery ReportThis condition summary and future waterway recovery reports are intended mainly for use in the Redlands by local people. The condition summary provides a creek-by-creek snapshot of condition based on:
• waterqualitydata;
• twice-yearlyfishandmacro-invertebratedata;
• eventmonitoringfornutrientsand sediment; and
• detailedanalysisofmanagement,protectionand rehabilitation priorities.
Council will use the information from this report to identify and prioritise target areas where management actions are most needed. Creek recovery resulting from management actions will be tracked over the years using results reported in the annual waterway recovery reports.
Council will also be able to use the report to determine priority areas when carrying out city-wide planning and assessing development applications. Results of the report can help ensure protection of creeks currently in good condition and prevent further degradation of creeks in poor condition.
8

Waterway recovery indicators
The Waterway Recovery Report - Condition Summary 2010 uses indicators to track the health of each creek. The results for each indicator reflect the condition of the creek. Each creek has been given a rating for each indicator. The calculation of ratings is described in Appendix 2.
Indicator 1. Waterways with defined environmental valuesThis indicator will not be reported on annually.
Environmental values reflect qualities identified by the community based on the use of and values for the waterways. They are fundamentally important because water quality objectives are set to protect these values from the effects of pollution, waste discharges and deposits, to ensure healthy aquatic ecosystems and waterways that are safe and suitable for community use. The Environmental Protection Agency (EPA) published the Redland Creeks Environmental Values and Water Quality Objectives in March 2006. Reporting on this indicator will show gaps where values and objectives need to be set.
Indicator 2. Freshwater monitoring coverageThis indicator will be reported on annually.
Without monitoring, we would not know what state the creeks are in, what problems to target, or if creek health is improving. Ambient monitoring is regular monthly monitoring and builds a baseline picture of water quality. Hotspot monitoring involves monitoring at regular lengths along the creek. Event monitoring is carried out during rainfall events. Hotspot and event monitoring can help narrow down the source of pollutants. Reporting on this indicator will show where there is little known about the health of a creek due to insufficient monitoring coverage.
Freshwater monitoringRefer to Glossary (page 3) for a description of ambient, hotspot, EHMP and Fish and Macro sampling programs/projects carried out in the freshwater sections of Redlands’ creeks.
Indicator 3. Water quality compared to objectivesThis indicator will be reported on annually.
Council collects physical measurements and water samples from the creeks to find out if physical conditions (e.g. pH and conductivity) are out of balance or if the water is polluted. In order to determine this, we need a benchmark of what the levels should be, to compare results. The EPA set these benchmarks (called Water Quality Objectives or WQO) in the Qld Water Quality Guidelines (EPA, 2006). If the WQO are consistently not met, the health of the creek and the animals and plants that live in it can be compromised. Water quality in the creeks was rated against the WQO by the process outlined in Appendix 2. Median values used to calculate ratings are in Appendix 3 (water quality) and Appendix 4 (fish and macro-invertebrates).
Water quality parameters compared for this report:
Physical/chemicalDissolved oxygen: Most aquatic organisms breathe the oxygen dissolved in water. Levels which are too low can cause suffocation; too high can cause gas bubbles to form in fish’s blood. Low dissolved oxygen can also cause nutrients to be released from sediments into the water.pH: a measure of the acidity or alkalinity of water. pH varies naturally between and within catchments depending on the types of rock, soil and vegetation present. Very low or high values can cause stress or death to aquatic organisms. Changes can also affect the natural chemistry of the water and make some toxins more harmful. Electrical conductivity: a measure of salinity, which includes many ions other than the typical saltiness of water. Aquatic plants and animals need these ions for survival. Levels outside the normal range can cause stress or even death. High levels affect the ability of plant roots to absorb nutrients. Turbidity: a measure of the muddiness or fogginess of water, caused by suspended particles of sediment or organic matter. High turbidity can smother organisms on the creek bed, irritate fish gills and reduce light penetration, which can slow plant growth.
NutrientsNitrogen and Phosphorus: High levels of nitrogen and phosphorus can cause plants and algae to grow too fast (a bloom) and impact creek health. Algal blooms block light from filtering down to the creek bed, change the pH, dissolved oxygen and stress or kill sensitive species. Excessive growth of larger plants slows water flow and leads to stagnation and loss of dissolved oxygen.
Aquatic processesChlorophyll-a: measured to give an indication of the amount of algae or phytoplankton growing in a waterway, which is influenced by the availability of light, nutrients and water temperature. High levels indicate poor water quality and low levels suggest good conditions. However, high chlorophyll-a concentrations are not necessarily a bad thing. It is the long-term persistence of elevated levels that is a problem.
9

Indicator 4. Estimated pollutant (nutrient and sediment) loads entering Moreton BayThis indicator will be reported on annually.
High amounts of nutrients in Moreton Bay have been linked to algal blooms, and sediment can smother seagrass. Because of this, it is a priority to reduce the loads (kilograms) of nutrients and sediment exported to the bay through Redlands’ creeks. The loads entering the bay from each of Redlands’ creeks were estimated in 2008 using a pollutant export model (E2 model) and are presented for each creek for relative comparison.
Indicator 6. Macro-invertebrate communitiesThis indicator will not be reported on annually.
Like fish, macro-invertebrate (water insect) community structures are also directly influenced by disturbance and changes in water quality. Certain macro-invertebrate species are more sensitive than others, so their presence can indicate that the creek is relatively undisturbed. These species are from the Plecoptera, Trichoptera and Ephemeroptera families (PET families). Macro-invertebrate ratings are based on the number of different groups recorded (Taxa richness), the number of species from the sensitive PET families (PET score), and the average sensitivity score of all species recorded (SIGNAL Score).
Indicator 5. Fish communitiesThis indicator will be reported on annually.
Looking at the types of fish present in a community gives an indication of whether the creek is in a natural state or has experienced disturbance. For example, fish are directly influenced by the quality of the water they live in, so in polluted water a hardier fish species would be expected to occur in higher numbers as it would have an advantage over a more sensitive species. Fish communities have been rated based on the number of native fish species and the proportion of introduced fish. Data comes from the ongoing EHMP monitoring, as well as the once-off Fish and Macro Sampling Project (Moffatt, 2008).
Ecological communitiesIn ecological terms, a community is a group of populations of different species interacting with and influencing each other. Interactions between the populations (e.g. competition and predation) as well as interactions with the surrounding environment affect the number of individuals and the types of species that make up a community.
Indicator 7. Waterways covered by recovery plansWaterway Management Plans (WMP) identify areas where action is required to improve the condition and health of the waterway, water quality and surrounding riparian areas. This process has allowed Council to direct on-ground works where they are needed most in the catchment.
Integrated Waterway Management Plans have been developed for several catchments and make recommendations for building infrastructure to improve water quality, waterway health and reducing flooding impacts.
Annual reporting on this indicator will show data gaps where planning is needed for management and protection of the creeks.
Indicator 8. High and medium priorities set for protection and management actionsWaterway habitats, including riparian vegetation and wetlands, have a greater likelihood of survival when threats and pressures are reduced through formalised protection measures under legislation and planning schemes. Council implements management actions to improve the condition of creek systems that have been impacted by vegetation removal, flooding, erosion and weed invasion.
This indicator reports on high and medium priorities set along the length of the creek for protection and management actions.
Council used the Creek Functional Unit Mapping project to determine these priorities, and over time, annual reports will report on management actions carried out in these areas.
Creek functional unit mapping Council commissioned a project in 2009 to develop a mapping tool to divide the creeks into functional units and identify the pressures and condition within these units. Management, rehabilitation and protection actions needed to lessen these pressures and improve condition were then identified and prioritised for implementation.
10
Guide to Waterway Recovery Report
Tarradarrapin CreekIncluding east branch and west branch
Tarradarrapin Creek has the highest monitoring coverage, and is part of the ambient and hotspot monitoring programs. This monitoring provides a good picture of the water quality over the years, as well as helping to pinpoint where pollutants are entering the creek. Fish and macro-invertebrates were sampled for the first time in 2007. A repeat of the fish and macro sampling would be helpful in building up more knowledge of the condition of the creek.
The creek has achieved good to fair water quality ratings over the years. However water quality has been worsening, due to increased nutrient (nitrogen and phosphorus) concentrations and decreased dissolved oxygen (although still the best dissolved oxygen results in the city).
Two sites in Tarradarrapin Creek were monitored by the Fish and Macro project in autumn 2007. The fish communities at these sites appear to be in very poor condition due to an extremely high proportion of introduced fish (98%). The status of macro-invertebrate communities indicates that the creek has experienced disturbance. Despite high numbers of species and a fair average sensitivity (SIGNAL) score, only one of the sensitive PET species was found.
Tarradarrapin Creek has been ranked as a high priority catchment through the creek functional unit and riparian zone mapping. Identified priority actions include managing and protecting existing high quality riparian habitat, stabilising the creek channel and enhancing planning scheme protection measures.
Catchment featuresCatchment area 13.4 km2
Stream length 9.5 km total
Elevation (source to sea) 30m
Modelled annual flow 4,346 megalitres water/year
Dominant land uses Urban residential, park/open space, industrial
% in public ownership 17%
Predominant soil types Podzolic soils in upper catchment, red soils in lower catchment
Most abundant native fish Southern purple-spotted gudgeon, Long-finned eel, Fire-tail gudgeon
Invertebrate numbers 18 taxa recorded
Wetlands RAMSAR-listed Tarradarrapin wetland is located on the eastern channel
Including east branch and west branch
12 3
4
5
6
78
910
11
12
13
14
15
16
17
18
12 3
4
5
6
78
910
11
12
13
14
15
16
17
18
Creek health summary
Including east branch and west branch
BIRKDALE
ALEXANDRA HILLS
WELLINGTON POINT
Birkdale Road
Old Cleveland Road East
Tarrad
a rrap inCreek
¥
17
Indicator analysis
Indicator 1. Waterways with defined environmental valuesWaterway
Tarradarrapin Creek
Indicator 2. Freshwater monitoring coverageNumber of sites per monitoring program
Approx. coverage Total sites Ambient Hotspot Event-based EHMP Fish and macro-invertebrates
1 site every 0.73km 13* 4 13 0 0 2
*Some of the programs sample from the same sites
Indicator 3. Water quality compared to objectives04/05 05/06 06/07 07/08 Data trend
Overall water quality rating B B B C
Physical/chemical rating
DO A A B C Worsening
pH A A A A Steady
Conductivity A A A A Steady
Turbidity A A A A Steady
Nutrient levels rating
Phosphorus C B B C Worsening
Nitrogen D C C D Worsening
Aquatic processing rating
Chlorophyll-a B A A A Steady
Indicator 4. Estimated pollutant loads entering Moreton BayWater flow (megalitres water/year) Total Suspended Solids (tonnes/yr) Total Nitrogen (tonnes/yr) Total Phosphorus (tonnes/yr)
4,346 398.0 5.92 0.91
Indicator 5. Fish communities and Indicator 6. Macro-invertebrate communities04/05 05/06 06/07 07/08 Data trend
Fish community rating C C C C Steady
Macro-invertebrate community rating A A A A Steady
Indicator 7. Waterways covered by recovery plansWMP completed Alternative plan completed Percentage of identified actions
commenced or completed (%)Rating
No No N/A F
Indicator 8. Priority ranking for management and protection actionsPercentage of creek length
Overall creek priority rankingHigh priority Medium priority Low priority
58% 35% 7% High
18
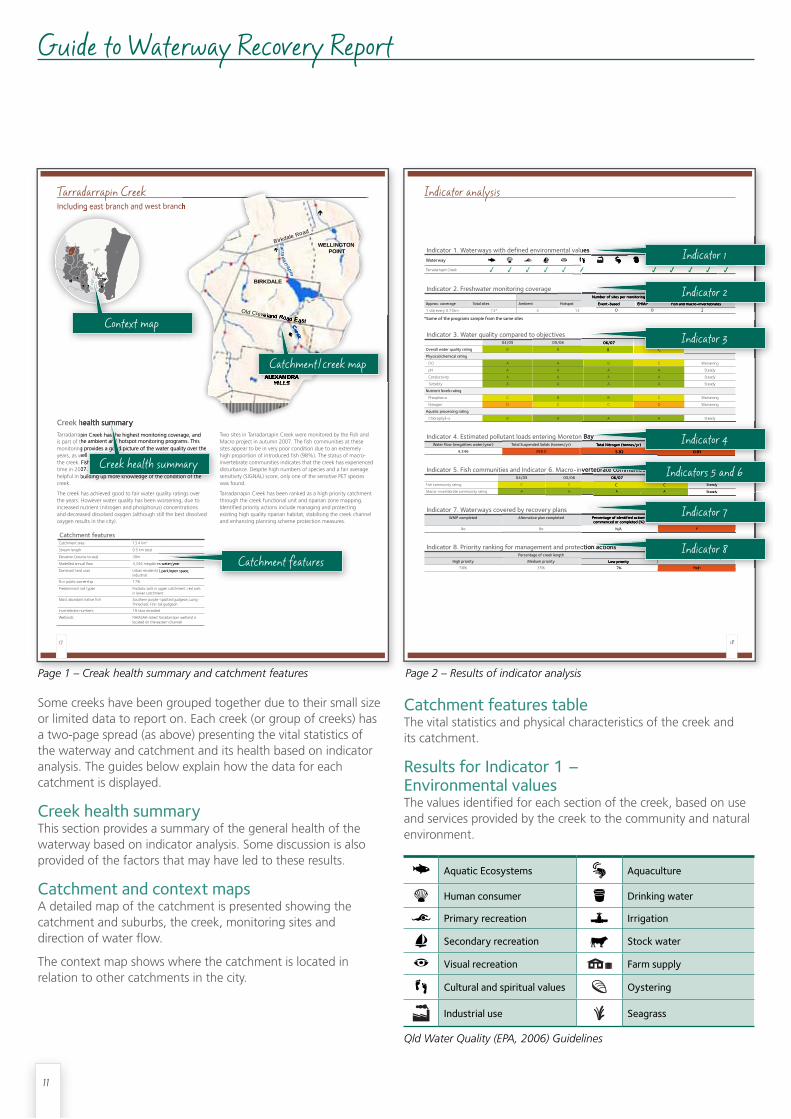
Some creeks have been grouped together due to their small size or limited data to report on. Each creek (or group of creeks) has a two-page spread (as above) presenting the vital statistics of the waterway and catchment and its health based on indicator analysis. The guides below explain how the data for each catchment is displayed.
Creek health summaryThis section provides a summary of the general health of the waterway based on indicator analysis. Some discussion is also provided of the factors that may have led to these results.
Catchment and context mapsA detailed map of the catchment is presented showing the catchment and suburbs, the creek, monitoring sites and direction of water flow.
The context map shows where the catchment is located in relation to other catchments in the city.
Catchment features tableThe vital statistics and physical characteristics of the creek and its catchment.
Results for Indicator 1 Ð Environmental valuesThe values identified for each section of the creek, based on use and services provided by the creek to the community and natural environment.
Aquatic Ecosystems Aquaculture
Human consumer Drinking water
Primary recreation Irrigation
Secondary recreation Stock water
Visual recreation Farm supply
Cultural and spiritual values Oystering
Industrial use Seagrass
Qld Water Quality (EPA, 2006) Guidelines
Page 2 – Results of indicator analysisPage 1 – Creak health summary and catchment features
6
78
91010 171717
1818181818
66666
7777788888
9999910101010101010101010101010101010101010101010101010101010101010101010101010101010101010101010101010 171717171717171717171717171717171717171717171717171717171717171717171717171717171717171717171717171717171717171717171717171717171717
1818181818181818181818181818181818181818181818181818181818181818181818181818
ALEXANDRA HILLS
eveland Road EastCCrreeeekk
4,346 megalitres water/year
Urban residential, park/open space,
Indicator 1. Waterways with defined environmental values
Number of sites per monitoring program
Event-based EHMP Fish and macro-invertebrates
0 0 2
06/07 07/08 Data trend
B C
Indicator 4. Estimated pollutant loads entering Moreton BayTotal Nitrogen (tonnes/yr) Total Phosphorus (tonnes/yr)
5.92 0.91
Indicator 5. Fish communities and Indicator 6. Macro-invertebrate communities06/07 07/08 Data trend
C C Steady
A A Steady
Percentage of identified actions commenced or completed (%)
Rating
N/A F
Indicator 8. Priority ranking for management and protection actions
Overall creek priority rankingLow priority
7% High
Tarradarrapin Creek has the highest monitoring coverage, and is part of the ambient and hotspot monitoring programs. This monitoring provides a good picture of the water quality over the years, as well as helping to pinpoint where pollutants are entering the creek. Fish and macro-invertebrates were sampled for the first time in 2007. A repeat of the fish and macro sampling would be helpful in building up more knowledge of the condition of the
Creek health summary
Context map
Catchment/creek map
Catchment features
Indicator 1
Indicator 2
Indicator 3
Indicator 4
Indicators 5 and 6
Indicator 7
Indicator 8
Creek health summary
11
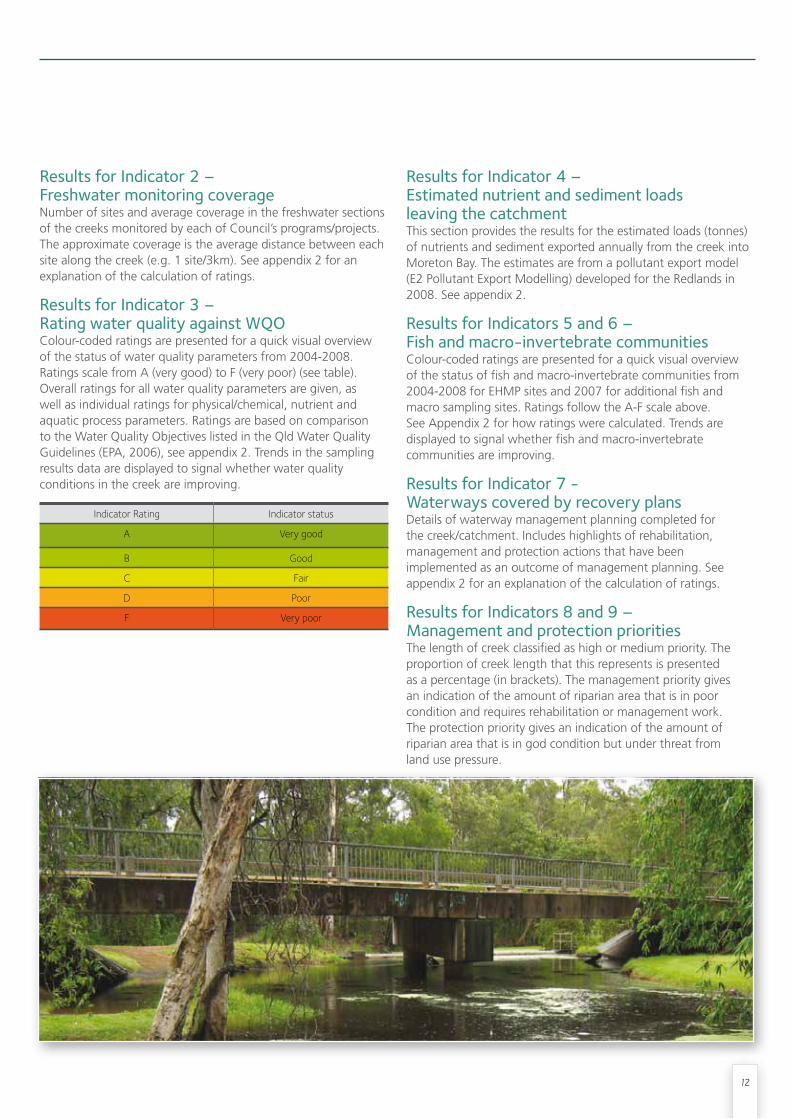
Results for Indicator 2 Ð Freshwater monitoring coverageNumber of sites and average coverage in the freshwater sections of the creeks monitored by each of Council’s programs/projects. The approximate coverage is the average distance between each site along the creek (e.g. 1 site/3km). See appendix 2 for an explanation of the calculation of ratings.
Results for Indicator 3 Ð Rating water quality against WQOColour-coded ratings are presented for a quick visual overview of the status of water quality parameters from 2004-2008. Ratings scale from A (very good) to F (very poor) (see table). Overall ratings for all water quality parameters are given, as well as individual ratings for physical/chemical, nutrient and aquatic process parameters. Ratings are based on comparison to the Water Quality Objectives listed in the Qld Water Quality Guidelines (EPA, 2006), see appendix 2. Trends in the sampling results data are displayed to signal whether water quality conditions in the creek are improving.
Indicator Rating Indicator status
A Very good
B Good
C Fair
D Poor
F Very poor
Results for Indicator 4 Ð Estimated nutrient and sediment loads leaving the catchmentThis section provides the results for the estimated loads (tonnes) of nutrients and sediment exported annually from the creek into Moreton Bay. The estimates are from a pollutant export model (E2 Pollutant Export Modelling) developed for the Redlands in 2008. See appendix 2.
Results for Indicators 5 and 6 Ð Fish and macro-invertebrate communitiesColour-coded ratings are presented for a quick visual overview of the status of fish and macro-invertebrate communities from 2004-2008 for EHMP sites and 2007 for additional fish and macro sampling sites. Ratings follow the A-F scale above. See Appendix 2 for how ratings were calculated. Trends are displayed to signal whether fish and macro-invertebrate communities are improving.
Results for Indicator 7 - Waterways covered by recovery plansDetails of waterway management planning completed for the creek/catchment. Includes highlights of rehabilitation, management and protection actions that have been implemented as an outcome of management planning. See appendix 2 for an explanation of the calculation of ratings.
Results for Indicators 8 and 9 Ð Management and protection prioritiesThe length of creek classified as high or medium priority. The proportion of creek length that this represents is presented as a percentage (in brackets). The management priority gives an indication of the amount of riparian area that is in poor condition and requires rehabilitation or management work. The protection priority gives an indication of the amount of riparian area that is in god condition but under threat from land use pressure.
12

The Recovery Report provides an overview of the freshwater sections of creeks in the Redlands. The report identifies creek health trends, possible causes for the conditions identified, and what management and protection actions can be put in place to fix creek health problems.
Indicator analysis The condition of the Redlands’ freshwater creeks was analysed using an indicator-style method based on readily available data. Indicator analysis provides a snapshot of the health of a creek, and is not meant to be an exhaustive study of creek condition. Generally, a poor rating for an indicator tells us the creek system is in poor health.
Indicators analysed are outlined in the previous Guide to Waterway Recovery Report section.
Environmental valuesIn 2006, DERM (formerly EPA) identified the environmental values for creeks in the Redlands. These values have been scheduled in the Environmental Protection (Water) Policy 1997. Some catchments do not have specific environmental values, so default generic values are applied. These include Serpentine, Native Dog and California Creeks, North Stradbroke Island, Coochiemudlo Island and Southern Moreton Bay Island (SMBI) catchments.
Monitoring activitiesCouncil’s monitoring activities are focussed on the freshwater sections of the creeks. No estuarine or marine water quality monitoring is carried out by Council. Freshwater monitoring includes ambient water quality, event water quality, hotspot water quality and fish and macro-invertebrate communities.
The monthly ambient monitoring program has been extended to the SMBI and will be reported in the 2010 Waterway Recovery Report. The program monitors just over half of the creeks on the mainland, including:
• BlackSwamp(ClevelandCatchment) • EprapahCreek • HilliardsCreek • MoogurrapumCreek • TarradarrapinCreek • UpperTingalpaCreek • WeinamCreek.
Sampling includes nutrients (nitrogen and phosphorus), chlorophyll-a and physical/chemical properties (dissolved oxygen, pH, conductivity and turbidity).
The Healthy Waterways Partnership EHMP monitors fish and macro-invertebrate communities twice and year in Eprapah, Hilliards, Moogurrapum and Upper and Lower Tingalpa Creeks. Fish and macro-invertebrate monitoring was extended as a one-off sampling project in 2007 (the Fish and Macro sampling project) to new sites in these creeks, as well as Tarradarrapin, Serpentine and Native Dog Creeks.
Hotspot and/or event-based monitoring are carried out in Tarradarrapin, Hilliards and Eprapah Creeks and are helping to track down the causes of poor waterway health.
Water quality trendsAcross the mainland catchments, there is a general trend of worsening ratings for nutrients (nitrogen and phosphorus), with Eprapah and Moogurrapum Creeks having the worst ratings. Poor ratings for dissolved oxygen generally accompany poor nutrient ratings.
The remaining physical/chemical parameters (pH, conductivity and turbidity) were found to be consistently within WQO levels across the creeks. Chlorophyll-a levels are variable across the city, and are worsening in Moogurrapum and Upper Tingalpa Creek.
Loads leaving the catchmentsA catchment pollutant export model was created for Redlands in 2008 to estimate how much nutrient (nitrogen and phosphorus) and sediment are being transported to Moreton bay through creeks in the Redlands.
Reporting on this indicator is limited to this initial Recovery Report. The modelling project found that coastal urban areas have higher rates of rainfall runoff compared to non-urbanised inland areas. This is due to higher amounts of impervious surfaces in urban areas (i.e. roofs, roads, concrete driveways). It also found that sewage treatment plants
contribute significant loads of nutrients when compared with wider catchment sources (e.g. diffuse sources).
On a per-hectare basis, diffuse loads from Redlands’ creeks are significantly higher than the Logan-Albert, and only slightly lower than the Lower Brisbane catchments.
Research is needed into the relationship between suspended solids and nutrients in the creeks. This will help in deciding appropriate management actions to reduce sediment and nutrient loads.
Fish and macro-invertebratesThe structure of fish and macro-invertebrate communities in a creek give an indication of creek health. In the Redlands, fish and macro-invertebrates have been sampled regularly at EHMP sites, as well as at additional sites as part of a one-off sampling project run by DERM (Moffatt, 2008) for Council. Ratings for creeks tested in the Fish and Macro project in 2007 were based on limited data and tended to be lower in comparison to those monitored over three to four years under the EHMP program.
Looking across the city, fish communities have improved slightly since 2004 and are currently rated fair to poor. In most cases, good scores for the number of native species have been brought down by high proportions of introduced fish.
Macro-invertebrate communities are generally rated as good and trends are steady in the creeks with yearly EHMP data. The macro-invertebrate results for the North Stradbroke Island (NSI) creeks suggest that the creeks are in good health. Low numbers of native fish were found in the NSI creeks, however more research is needed to find out whether this is a natural occurrence.
Keeping in mind that fish and macro-invertebrate communities are a reflection of waterway health, results across the city suggest that ecosystem health is stable or improving in most creeks, despite declining water quality. It should also be noted, however, that some of these ratings are based on one-off sampling at a limited number of sites.
Executive summaryState of freshwater creeks in the Redlands
• Weinam
13

Waterway management and protectionCouncil requires a city-wide tool to identify and prioritise on-ground rehabilitation works, planning scheme protection, and maintenance of already healthy areas across all catchments.
To date, Council’s creek-by-creek approach to planning for rehabilitation, management and protection actions has been inefficient at prioritising actions across the entire city. Since 2003, waterway management plans have been completed for three out of the total 14 catchments.
Several planning mechanisms have replaced the old approach. Integrated waterway planning has been completed for Native Dog Creek and Torquay Creek (Southern Redland Bay Catchment) and recommendations have been made for building infrastructure aimed at improving waterway health and water quality and reducing flooding impacts. Further plans will be completed for a group of catchments each financial year. Integrated waterway management plans are underway for Eprapah and Thornlands Creeks.
The Creek Functional Unit and Riparian Zone Mapping Project will go some way to achieving broad prioritisation of actions across the city. This work has been carried out on a broad city-wide scale for all creeks. Eprapah, Tarradarrapin, Lower Tingalpa/Coolnwynpin, Moogurrapum, Southern Redland Bay and Cleveland Catchments have been identified as high priority catchments for general management, rehabilitation and protection actions.
In-depth identification and prioritisation of actions has been completed for Eprapah Creek, and will be completed for the remaining catchments in order of priority over the coming years.
RecommendationsRecommendations have been split into five categories based on the Recovery Report findings. The recommendations relate to Council, the local community and other government and non-government waterway managers (e.g. DERM, Healthy Waterways and SEQ Catchments), who all have a responsibility when it comes to keeping our waterways healthy.
Education1. Support and encourage landholders to
improve land management practices through extension programs focussed on reducing nutrient and sediment inputs to the creeks.
2. Provide awareness and education services to the community on the impacts that their actions have on water quality and health in our creeks and in Moreton Bay.
Council programs3. Extend ambient, hotspot and event
monitoring to unmonitored creeks on the islands and mainland to:
• buildupabetterpictureofwaterquality issues in the creeks
• trackdownsourcesofpollution
• helpguidemanagementdecisions
• trackimprovementsinwaterquality and waterway health in future years.
4. Conduct regular fish and macro- invertebrate monitoring every second year as a continuation of the one-off Fish and Macro project completed in 2007.
5. Physical/chemical aspects of water quality are mostly within acceptable WQO levels, therefore it is recommended that Council aim to maintain these conditions when carrying out works in and around waterways.
6. Nutrient management is a vital action needed across all creeks. Based on the ratings in this report, Moogurrapum Creek and Eprapah Creek should be a high priority for nutrient reduction actions. Managing high nutrient levels is expected to improve dissolved oxygen and chlorophyll-a levels.
Research7. Extend monitoring activities in the
2010-11 financial year to island and mainland catchments where there is currently no available water quality or waterway health information.
8. As suspended solids are not well monitored in the creeks, it is recommended that this parameter be included in the ambient monitoring program. In addition, the relationship between suspended solids and nutrients in the creeks should be investigated to support management decisions.
9. Investigate ways of reducing numbers of introduced fish in the creeks of the Redlands.
Planning and protection10. Investigate strengthening of planning
rules in coastal alluvial areas with nutrient-rich soils in order to prevent the release of nutrients when these soils are disturbed.
11. Develop and implement a consistent framework for identifying and prioritising waterway protection, management and rehabilitation actions across the city.
Reporting12. Continue to develop and improve
reporting procedures established in the Redlands Waterway Recovery Report - Condition Summary 2010.
13. Produce the Redlands Waterway Recovery Report on an annual basis to track recovery in our creeks.
14

The creeks

The creeks

Tarradarrapin CreekIncluding east branch and west branch
Tarradarrapin Creek has the highest monitoring coverage, and is part of the ambient and hotspot monitoring programs. This monitoring provides a good picture of the water quality over the years, as well as helping to pinpoint where pollutants are entering the creek. Fish and macro-invertebrates were sampled for the first time in 2007. A repeat of the fish and macro sampling would be helpful in building up more knowledge of the condition of the creek.
The creek has achieved good to fair water quality ratings over the years. However water quality has been worsening, due to increased nutrient (nitrogen and phosphorus) concentrations and decreased dissolved oxygen (although still the best dissolved oxygen results in the city).
Two sites in Tarradarrapin Creek were monitored by the Fish and Macro project in autumn 2007. The fish communities at these sites appear to be in very poor condition due to an extremely high proportion of introduced fish (98%). The status of macro-invertebrate communities indicates that the creek has experienced disturbance. Despite high numbers of species and a fair average sensitivity (SIGNAL) score, only one of the sensitive PET species was found.
Tarradarrapin Creek has been ranked as a high priority catchment through the creek functional unit and riparian zone mapping. Identified priority actions include managing and protecting existing high quality riparian habitat, stabilising the creek channel and enhancing planning scheme protection measures.
Catchment featuresCatchment area 13.4 km2
Stream length 9.5 km total
Elevation (source to sea) 30m
Modelled annual flow 4,346 megalitres water/year
Dominant land uses Urban residential, park/open space, industrial
% in public ownership 17%
Predominant soil types Podzolic soils in upper catchment, red soils in lower catchment
Most abundant native fish Southern purple-spotted gudgeon, Long-finned eel, Fire-tail gudgeon
Invertebrate numbers 18 taxa recorded
Wetlands RAMSAR-listed Tarradarrapin wetland is located on the eastern channel
Including east branch and west branch
12 3
4
5
6
78
910
11
12
13
14
15
16
17
18
12 3
4
5
6
78
910
11
12
13
14
15
16
17
18
Creek health summary
Including east branch and west branch
17

Indicator analysis
Indicator 1. Waterways with defined environmental valuesWaterway
Tarradarrapin Creek
Indicator 2. Freshwater monitoring coverageNumber of sites per monitoring program
Approx. coverage Total sites Ambient Hotspot Event-based EHMP Fish and macro-invertebrates
1 site every 0.73km 13* 4 13 0 0 2
*Some of the programs sample from the same sites
Indicator 3. Water quality compared to objectives04/05 05/06 06/07 07/08 Data trend
Overall water quality rating B B B C
Physical/chemical rating
DO A A B C Worsening
pH A A A A Steady
Conductivity A A A A Steady
Turbidity A A A A Steady
Nutrient levels rating
Phosphorus C B B C Worsening
Nitrogen D C C D Worsening
Aquatic processing rating
Chlorophyll-a B A A A Steady
Indicator 4. Estimated pollutant loads entering Moreton BayWater flow (megalitres water/year) Total Suspended Solids (tonnes/yr) Total Nitrogen (tonnes/yr) Total Phosphorus (tonnes/yr)
4,346 398.0 5.92 0.91
Indicator 5. Fish communities and Indicator 6. Macro-invertebrate communities04/05 05/06 06/07 07/08 Data trend
Fish community rating C C C C Steady
Macro-invertebrate community rating A A A A Steady
Indicator 7. Waterways covered by recovery plansWMP completed Alternative plan completed Percentage of identified actions
commenced or completed (%)Rating
No No N/A F
Indicator 8. Priority ranking for management and protection actionsPercentage of creek length
Overall creek priority rankingHigh priority Medium priority Low priority
58% 35% 7% High
18
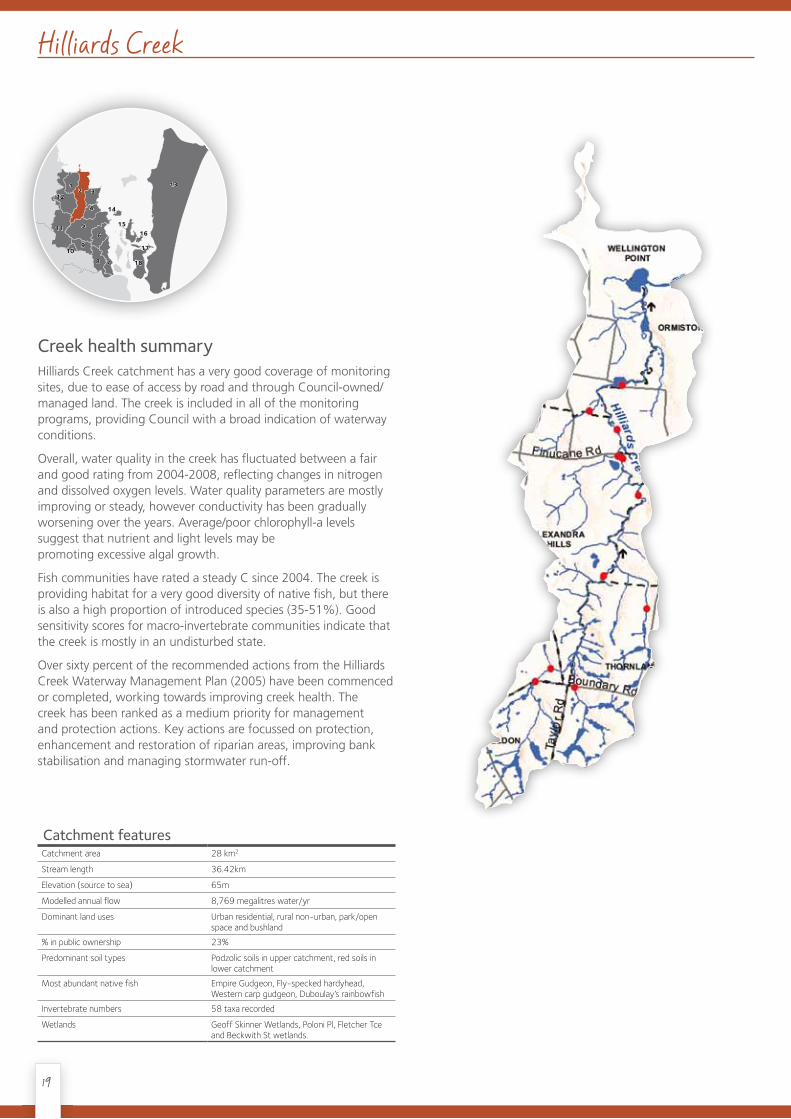
Catchment featuresCatchment area 28 km2
Stream length 36.42km
Elevation (source to sea) 65m
Modelled annual flow 8,769 megalitres water/yr
Dominant land uses Urban residential, rural non-urban, park/open space and bushland
% in public ownership 23%
Predominant soil types Podzolic soils in upper catchment, red soils in lower catchment
Most abundant native fish Empire Gudgeon, Fly-specked hardyhead, Western carp gudgeon, DuboulayÕ s rainbowfish
Invertebrate numbers 58 taxa recorded
Wetlands Geoff Skinner Wetlands, Poloni Pl, Fletcher Tce and Beckwith St wetlands.
Hilliards Creek
Creek health summaryHilliards Creek catchment has a very good coverage of monitoring sites, due to ease of access by road and through Council-owned/managed land. The creek is included in all of the monitoring programs, providing Council with a broad indication of waterway conditions.
Overall, water quality in the creek has fluctuated between a fair and good rating from 2004-2008, reflecting changes in nitrogen and dissolved oxygen levels. Water quality parameters are mostly improving or steady, however conductivity has been gradually worsening over the years. Average/poor chlorophyll-a levels suggest that nutrient and light levels may be promoting excessive algal growth.
Fish communities have rated a steady C since 2004. The creek is providing habitat for a very good diversity of native fish, but there is also a high proportion of introduced species (35-51%). Good sensitivity scores for macro-invertebrate communities indicate that the creek is mostly in an undisturbed state.
Over sixty percent of the recommended actions from the Hilliards Creek Waterway Management Plan (2005) have been commenced or completed, working towards improving creek health. The creek has been ranked as a medium priority for management and protection actions. Key actions are focussed on protection, enhancement and restoration of riparian areas, improving bank stabilisation and managing stormwater run-off.
12 3
4
5
6
78
910
11
12
13
14
15
16
17
18
12 3
4
5
6
78
910
11
12
13
14
15
16
17
18
19

Indicator analysis
Indicator 1. Waterways with defined environmental valuesWaterway
Hilliards Creek
Upper headwaters - freshwater
Middle reaches - freshwater
Lower reaches - estuary
Indicator 2. Freshwater monitoring coverageNumber of sites per monitoring program
Approx. coverage Total sites Ambient Hotspot Event-based EHMP Fish and macro-invertebrates
1 site every 2.8km 13* 3 8 3 2 2
*Some of the programs sample from the same sites
Indicator 3. Water quality compared to objectives04/05 05/06 06/07 07/08 Data trend
Overall water quality rating B C B C
Physical/chemical rating
DO B C A C No trend
pH A A A A Steady
Conductivity A A A A Worsening
Turbidity A A A A Improving
Nutrient levels rating
Phosphorus C C C C Steady
Nitrogen C B B C Steady
Aquatic processing rating
Chlorophyll-a F D A D Improving
Indicator 4. Estimated pollutant loads entering Moreton BayWater flow (megalitres water/year) Total Suspended Solids (tonnes/yr) Total Nitrogen (tonnes/yr) Total Phosphorus (tonnes/yr)
8769 630.2 11.19 1.44
Indicator 5. Fish communities and Indicator 6. Macro-invertebrate communities04/05 05/06 06/07 07/08 Data trend
Fish community rating C C C C Steady
Macro-invertebrate community rating A A A A Steady
Indicator 7. Waterways covered by recovery plansWMP completed Alternative plan completed Percentage of identified actions
commenced or completed (%) Rating
Completed in 2005 N/A 60% A
Indicator 8. Priority ranking for management and protection actionsPercentage of creek length
Overall creek priority rankingHigh priority Medium priority Low priority
26% 69% 5% Medium
20

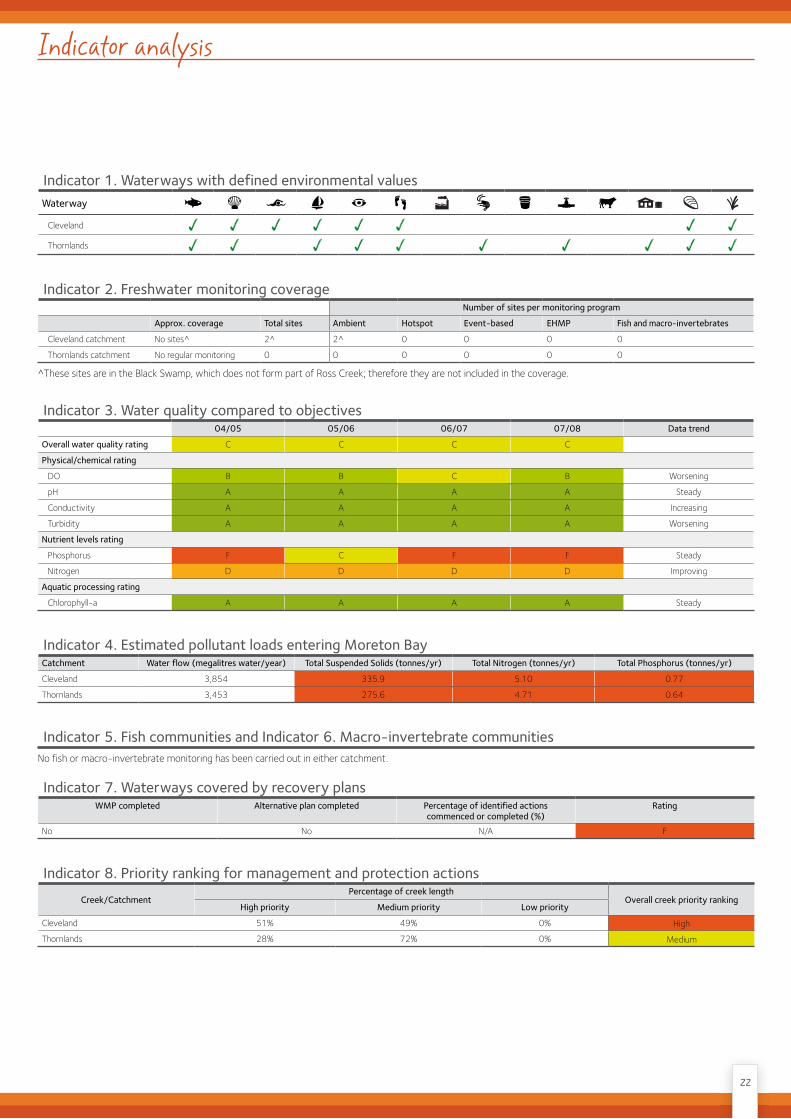
Creek health summaryThornlands catchment drains a series of small un-named creeks. Little is known of the condition of these creeks as no monitoring has been carried out by Council.
Cleveland catchment drains to Ross Creek, a highly modified waterway that is not monitored by Council. Ambient monitoring is carried out in the Black Swamp, located in the north-west of Cleveland catchment. The swamp is not connected to Ross Creek. Water quality results presented for this catchment are from a site on the main inlet to the Black Swamp.
The overall water quality at the Black Swamp has been rated as a steady C since 2004. This rating has mostly been influenced by high phosphorus and nitrogen levels. Dissolved oxygen levels are fair to good over the four years of monitoring. Very low (good) chlorophyll-a concentrations suggest that although nutrient levels are high, they are not promoting algal blooms in the swamp.
No waterway management plans have been developed to guide rehabilitation and management actions in these catchments. Cleveland catchment has been ranked as a high priority, mainly for riparian vegetation protection, enhancement and restoration. Thornlands catchment has been ranked as a medium priority.
Cleveland and Thornlands Creeks
Catchment features Cleveland ThornlandsCatchment area 11.5 km2 9.8 km2
Stream length 2.6 km 9.8 km
Elevation (source to sea) 25m 50m
Modelled annual flow 3,854 megalitres water/year 3,453 megalitres water/year
Dominant land uses Rural non-urban, park/open space, commercial Urban residential, park/open space, commercial
% in public ownership 12% 14%
Predominant soil types Podzolic soils in upper catchment, red soils in lower catchment
Podzolic soils in upper catchment, red soils in lower catchment
Most abundant native fish No data No data
Invertebrate numbers No data No data
Wetlands Black Swamp wetlands in the north-west of the catchment
Crystal Waters wetland, Primrose Dr wetland
12 3
4
5
6
78
910
11
12
13
14
15
16
17
18
12 3
4
5
6
78
910
11
12
13
14
15
16
17
18
21
Indicator analysis
Indicator 1. Waterways with defined environmental valuesWaterway
Cleveland
Thornlands
Indicator 2. Freshwater monitoring coverageNumber of sites per monitoring program
Approx. coverage Total sites Ambient Hotspot Event-based EHMP Fish and macro-invertebrates
Cleveland catchment No sites^ 2^ 2^ 0 0 0 0
Thornlands catchment No regular monitoring 0 0 0 0 0 0
^These sites are in the Black Swamp, which does not form part of Ross Creek; therefore they are not included in the coverage.
Indicator 3. Water quality compared to objectives04/05 05/06 06/07 07/08 Data trend
Overall water quality rating C C C C
Physical/chemical rating
DO B B C B Worsening
pH A A A A Steady
Conductivity A A A A Increasing
Turbidity A A A A Worsening
Nutrient levels rating
Phosphorus F C F F Steady
Nitrogen D D D D Improving
Aquatic processing rating
Chlorophyll-a A A A A Steady
Indicator 4. Estimated pollutant loads entering Moreton BayCatchment Water flow (megalitres water/year) Total Suspended Solids (tonnes/yr) Total Nitrogen (tonnes/yr) Total Phosphorus (tonnes/yr)
Cleveland 3,854 335.9 5.10 0.77
Thornlands 3,453 275.6 4.71 0.64
Indicator 5. Fish communities and Indicator 6. Macro-invertebrate communitiesNo fish or macro-invertebrate monitoring has been carried out in either catchment.
Indicator 7. Waterways covered by recovery plansWMP completed Alternative plan completed Percentage of identified actions
commenced or completed (%)Rating
No No N/A F
Indicator 8. Priority ranking for management and protection actions
Creek/CatchmentPercentage of creek length
Overall creek priority rankingHigh priority Medium priority Low priority
Cleveland 51% 49% 0% High
Thornlands 28% 72% 0% Medium
22

Creek health summaryEprapah Creek is made up of a main channel and two smaller tributary channels – Little Eprapah and Sandy Creek. There is average coverage of sampling sites along the main channel and Little Eprapah Creek. Sandy Creek in particular is not regularly monitored due to inaccessibility with large areas under private ownership.
Eprapah Creek has the lowest overall water quality rating across the city, due to increasing nutrient concentrations and declining dissolved oxygen concentrations. Based on the ratings, Eprapah Creek should be a high priority for nutrient reduction projects aimed at improving ecosystem health.
Fish community ratings reflect that the creek is supporting a fair-good diversity of native fish, but also a high proportion of introduced fish. Macro-invertebrate communities rated a steady A for all years, with consistently very good ratings for richness, SIGNAL score and PET score. This suggests that apart from high nutrient inputs, the creek is not highly disturbed.
A WMP was developed for Eprapah Creek in 2004. Ninety per cent of the recommended actions have been commenced or completed, working towards improving creek health. The creek has been ranked as a high priority for management and protection measures. Extensive actions are required along the creek to protect, enhance and restore riparian vegetation, geomorphic and ecological processes and water quality.
Eprapah Creek Including Little Eprapah Creek and Sandy Creek tributaries
Catchment featuresCatchment area 39 km2
Stream length 51.9 km
Elevation (source to sea) 75m
Modelled annual flow 13,776 megalitres water/year
Dominant land uses Rural non-urban, urban residential
% in public ownership 14%
Predominant soil types Podzolic soils in upper catchment, coastal soils in lower catchment
Most abundant native fish Empire gudgeon, Fire-tail gudgeon
Invertebrate numbers 63 taxa recorded
Wetlands Egret colony Wetlands in the lower catchment
12 3
4
5
6
78
910
11
12
13
14
15
16
17
18
12 3
4
5
6
78
910
11
12
13
14
15
16
17
18
23

Indicator analysis
Indicator 1. Waterways with defined environmental valuesWaterway
Upper main channel Ð upstream of Mt Cotton Rd
Sandy Creek
Middle main channel Ð Mt Cotton Rd to Luke St (east)
Little Eprapah Creek - freshwater
Lower main channel - Luke St (east) to tidal limit
Estuarine reaches
Indicator 2. Freshwater monitoring coverageNumber of sites per monitoring program
Approx. coverage Total sites Ambient Hotspot Event-based EHMP Fish and macro-invertebrates
1 site every 3.71km 14* 4 11 3 2 1
*Some of the programs sample from the same sites
Indicator 3. Water quality compared to objectives04/05 05/06 06/07 07/08 Data trend
Overall water quality rating C D C D
Physical/chemical rating
DO C D B F Worsening
pH A A A A Steady
Conductivity A A A A Steady
Turbidity A A A A Steady
Nutrient levels rating
Phosphorus F D B F Worsening
Nitrogen B D C D Worsening
Aquatic processing rating
Chlorophyll-a A A A A Slightly worsening
Indicator 4. Estimated pollutant loads entering Moreton BaySubcatchment Water flow (megalitres water/year) Total Suspended Solids (tonnes/yr) Total Nitrogen (tonnes/yr) Total Phosphorus (tonnes/yr)
Main channel 7,909 612.8 10.54 1.39
Little Eprapah 3,582 291.7 5.24 0.65
Sandy Creek 2,283 183.9 3.09 0.38
Indicator 5. Fish communities and Indicator 6. Macro-invertebrate communities04/05 05/06 06/07 07/08 Data trend
Fish communities D C C C Steady
Macro-invertebrate communities B A A A Steady
Indicator 7. Waterways covered by recovery plansWMP completed Alternative plan completed Percentage of identified actions
commenced or completed (%)Rating
Completed in 2004 N/A 90% A
Indicator 8. Priority ranking for management and protection actionsPercentage of creek length
Overall creek priority rankingHigh priority Medium priority Low priority
48% 47% 5% High
24
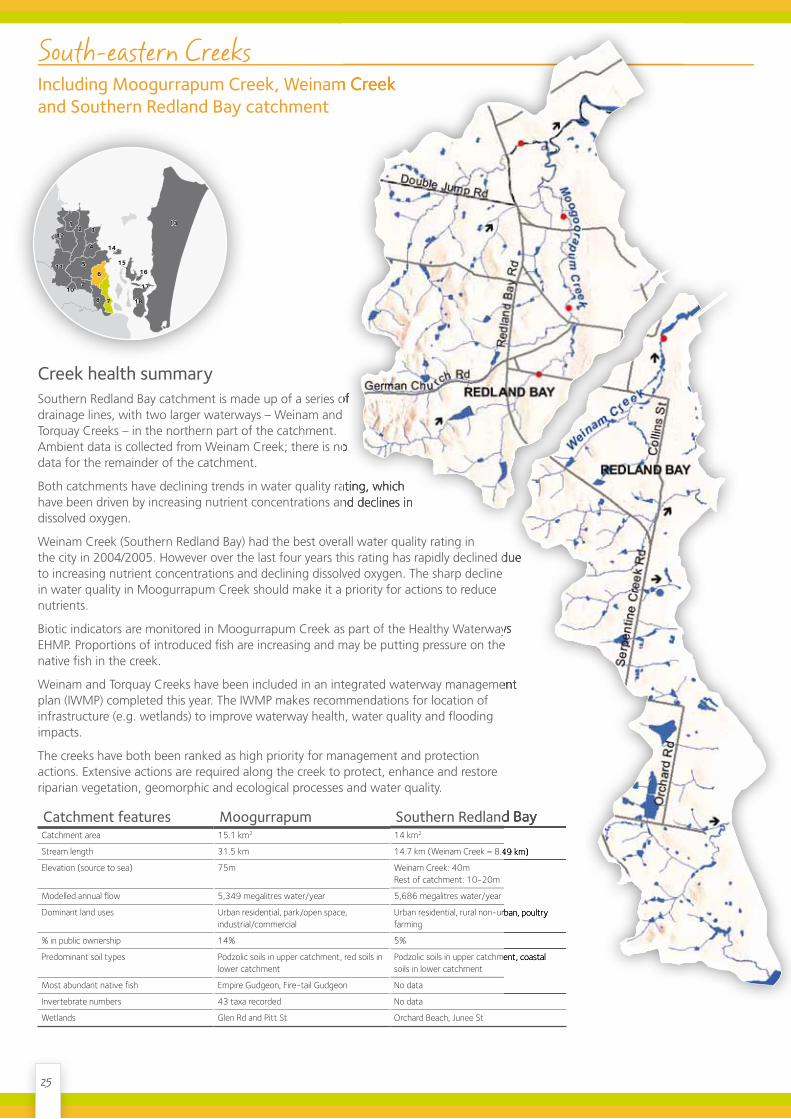
South-eastern Creeks Including Moogurrapum Creek, Weinam Creek and Southern Redland Bay catchment
Creek health summarySouthern Redland Bay catchment is made up of a series of drainage lines, with two larger waterways – Weinam and Torquay Creeks – in the northern part of the catchment. Ambient data is collected from Weinam Creek; there is no data for the remainder of the catchment.
Both catchments have declining trends in water quality rating, which have been driven by increasing nutrient concentrations and declines in dissolved oxygen.
Weinam Creek (Southern Redland Bay) had the best overall water quality rating in the city in 2004/2005. However over the last four years this rating has rapidly declined due to increasing nutrient concentrations and declining dissolved oxygen. The sharp decline in water quality in Moogurrapum Creek should make it a priority for actions to reduce nutrients.
Biotic indicators are monitored in Moogurrapum Creek as part of the Healthy Waterways EHMP. Proportions of introduced fish are increasing and may be putting pressure on the native fish in the creek.
Weinam and Torquay Creeks have been included in an integrated waterway management plan (IWMP) completed this year. The IWMP makes recommendations for location of infrastructure (e.g. wetlands) to improve waterway health, water quality and flooding impacts.
The creeks have both been ranked as high priority for management and protection actions. Extensive actions are required along the creek to protect, enhance and restore riparian vegetation, geomorphic and ecological processes and water quality.
Catchment features Moogurrapum Southern Redland BayCatchment area 15.1 km2 14 km2
Stream length 31.5 km 14.7 km (Weinam Creek = 8.49 km)
Elevation (source to sea) 75m Weinam Creek: 40mRest of catchment: 10-20m
Modelled annual flow 5,349 megalitres water/year 5,686 megalitres water/year
Dominant land uses Urban residential, park/open space, industrial/commercial
Urban residential, rural non-urban, poultry farming
% in public ownership 14% 5%
Predominant soil types Podzolic soils in upper catchment, red soils in lower catchment
Podzolic soils in upper catchment, coastal soils in lower catchment
Most abundant native fish Empire Gudgeon, Fire-tail Gudgeon No data
Invertebrate numbers 43 taxa recorded No data
Wetlands Glen Rd and Pitt St Orchard Beach, Junee St
Including Moogurrapum Creek, Weinam Creek
Southern Redland Bay catchment is made up of a series of
Ambient data is collected from Weinam Creek; there is no
Both catchments have declining trends in water quality rating, which have been driven by increasing nutrient concentrations and declines in
the city in 2004/2005. However over the last four years this rating has rapidly declined due
Biotic indicators are monitored in Moogurrapum Creek as part of the Healthy Waterways EHMP. Proportions of introduced fish are increasing and may be putting pressure on the
Weinam and Torquay Creeks have been included in an integrated waterway management
Southern Redland Bay
14.7 km (Weinam Creek = 8.49 km)
Urban residential, rural non-urban, poultry
Podzolic soils in upper catchment, coastal
12 3
4
5
6
78
910
11
12
13
14
15
16
17
18
12 3
4
5
6
78
910
11
12
13
14
15
16
17
18
25

Indicator analysis
Indicator 1. Waterways with defined environmental valuesWaterway
Moogurrapum Creek
Southern Redland Bay
Indicator 2. Freshwater monitoring coverageNumber of sites per monitoring program
Approx. coverage Total sites Ambient Hotspot Event-based EHMP Fish and macro-invertebrates
Moogurrapum 1 site every 7.9 km 4* 2 0 0 1 2
Southern Redland Bay 1 site every 8.49 km 1 1 0 0 0 0
*Some of the programs sample from the same sites
Indicator 3. Water quality compared to objectivesSouthern Redland Bay Moogurrapum
04/05 05/06 06/07 07/08 Data trend 04/05 05/06 06/07 07/08 Data trend
Overall water quality rating A B B D C C C D
Physical/chemical rating Physical/chemical rating
DO A D D F Worsening C D D F Worsening
pH A A A A Steady A A A A Steady
Conductivity A A A A Steady A A A A Steady
Turbidity A A A A Steady A A A A Steady
Nutrient levels rating Nutrient levels rating
Phosphorus A B B C Worsening B C C D Worsening
Nitrogen A A A C Worsening D D C F Worsening
Aquatic processing rating Aquatic processing rating
Chlorophyll-a F A F D Improving F A C D Worsening
Indicator 4. Estimated pollutant loads entering Moreton BaySubcatchment Water flow (megalitres water/year) Total Suspended Solids (tonnes/yr) Total Nitrogen (tonnes/yr) Total Phosphorus (tonnes/yr)
Moogurrapum Creek 5,349 434.6 7.46 0.94
Southern Redland Bay 5,686 411.5 7.82 1.00
Indicator 5. Fish communities and Indicator 6. Macro-invertebrate communities04/05 05/06 06/07 07/08 Data trend
Moogurrapum CreekFish communities C D D D Declining
Macro-invertebrate communities B A B B Steady
Southern Redland BayFish communities No data
Macro-invertebrate communities No data
Indicator 7. Waterways covered by recovery plansWMP completed Alternative plan completed Percentage of identified actions
commenced or completed (%)Rating
Moogurrapum No No N/A F
Southern Redland Bay No Yes (IWMP) 0% C
Indicator 8. Priority ranking for management and protection actionsCreek/Catchment Percentage of creek length
Overall creek priority rankingHigh priority Medium priority Low priority
Moogurrapum 45% 55% 0% High
Southern Redland Bay 84% 16% 0% High
26

Southern Creeks Including Serpentine Creek, Native Dog Creek and California Creek
Catchment features Serpentine Creek Native Dog Creek California CreekCatchment area 16.8 km2 (13.7 km2 in Redland City Council,
3.1 km2 in Logan City Council)32.4 km2 (11.3 km2 in Redland City Council, 21.1 km2 in Logan City Council)
15 km2 (2.9 km2 in Redland City Council, 12.1 km2 in Logan City Council)
Stream length 16.5 km (in Redlands) 9.6 km (in Redlands) 3.5 km
Elevation (source to sea) 45m 115m 155m
Modelled annual flow 4,197 megalitres water/year 3,967 megalitres water/year 971 megalitres water/year
Dominant land uses Bushland, open space Urban residential, park/open space, extractive industry and poultry farming
Rural non-urban
% in public ownership 56% 9% 0%
Predominant soil types Podzolic soils in upper catchment, alluvial soils in lower catchment
Podzolic soils and shallow soils over rock in upper catchment
Shallow soils over rock in upper catchment
Most abundant native fish Short-finned eel, Fire-tail gudgeon, Empire gudgeon
Fire-tail gudgeon No data
Invertebrate numbers 12 taxa recorded 13 taxa recorded No data
Wetlands Carbrook Wetlands Homestead Plc wetlands None identified
Including Serpentine Creek, Native Dog Creek and California Creek
Creek health summaryAccessibility is the biggest contributor to low monitoring coverage in Serpentine and California Creeks. Water quality ratings could not be derived for any of the three creeks as regular ambient data is not collected.
The Fish and Macro sampling project carried out in Autumn 2007 found that Native Dog and Serpentine Creeks have a low diversity of native fish. Native Dog Creek was found to have a problem with high numbers of introduced fish.
No macro-invertebrates from the PET families were recorded in either creek. PET are sensitive to disturbance, so this result suggests that the creek systems have suffered from disturbance.The fish and macro-invertebrate ratings are based on limited once-off data, so it is not known whether low native fish diversity and low PET numbers are a natural occurrence in these creeks.
No waterway management plan has been completed for the three southern catchments to date. An integrated waterway management plan has been developed for Native Dog Creek and has made recommendations on infrastructure to improve water quality, waterway health and reduce flooding impacts. These creeks have been ranked as low priority for protection, management and rehabilitation actions. There is low future land use pressure in these catchments and actions are mostly targeted at improving the condition of riparian zones.
Creek health summary
12 3
4
5
6
78
910
11
12
13
14
15
16
17
18
12 3
4
5
6
78
910
11
12
13
14
15
16
17
18
Logan City Council
27

Indicator analysis
Indicator 1. Waterways with defined environmental valuesWaterway
No environmental values identified Ð use default values
Other freshwater tributaries
Indicator 2. Freshwater monitoring coverageNumber of sites per monitoring program
Approx. coverage Total sites Ambient Hotspot Event-based EHMP Fish and macro-invertebrates
Serpentine 1 site every 16.52 km 1 0 0 0 0 1
Native Dog 1 site every 1.38 km 7 0 6 0 0 1
California No regular monitoring 0 0 0 0 0 0
*Some of the programs sample from the same sites
Indicator 3. Water quality compared to objectivesNo data collected for this indicator.
Indicator 4. Estimated pollutant loads entering Moreton BaySubcatchment Water flow (megalitres water/year) Total Suspended Solids (tonnes/yr) Total Nitrogen (tonnes/yr) Total Phosphorus (tonnes/yr)
Serpentine 4,197 164.2 4.04 0.36
Native Dog 3,967 251.7 4.85 0.54
California 971 46.0 1.03 0.11
Indicator 5. Fish communities and Indicator 6. Macro-invertebrate communities04/05 05/06 06/07 07/08 Data tend
SerpentineFish communities - - C - Insufficient data
Macro-invertebrate communities - - C - Insufficient data
Native DogFish communities - - F - Insufficient data
Macro-invertebrate communities - - C - Insufficient data
Indicator 7. Waterways covered by recovery plans
WMP completed Alternative plan completed Percentage of identified actions commenced or completed (%) Rating
California and Serpentine No No N/A F
Native Dog No Yes (IWMP) 0% C
Indicator 8. Priority ranking for management and protection actionsCreek/Catchment Percentage of creek length
Overall creek priority rankingHigh priority Medium priority Low priority
Serpentine 20% 50% 30% Low
Native Dog 17% 61% 22% Medium
California 2% 96% 2% Low
28
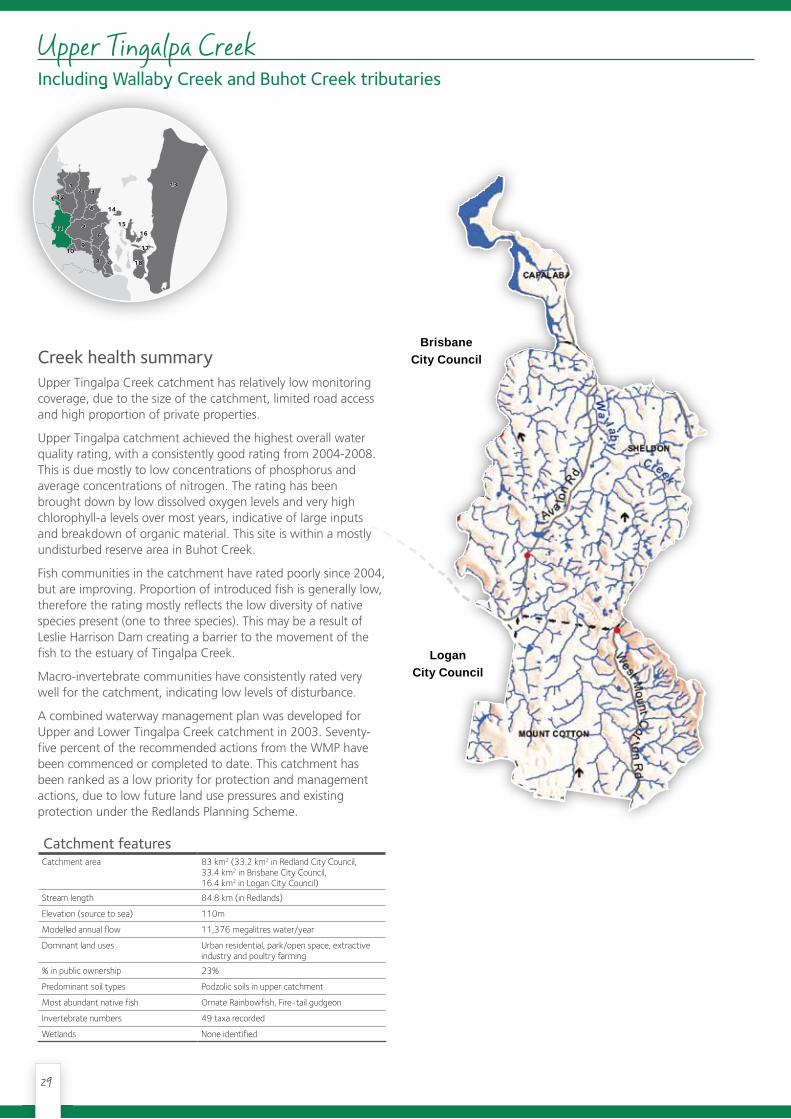
Upper Tingalpa Creek Including Wallaby Creek and Buhot Creek tributaries
Catchment featuresCatchment area 83 km2 (33.2 km2 in Redland City Council,
33.4 km2 in Brisbane City Council, 16.4 km2 in Logan City Council)
Stream length 84.8 km (in Redlands)
Elevation (source to sea) 110m
Modelled annual flow 11,376 megalitres water/year
Dominant land uses Urban residential, park/open space, extractive industry and poultry farming
% in public ownership 23%
Predominant soil types Podzolic soils in upper catchment
Most abundant native fish Ornate Rainbowfish, Fire-tail gudgeon
Invertebrate numbers 49 taxa recorded
Wetlands None identified
Including Wallaby Creek and Buhot Creek tributaries
12 3
4
5
6
78
910
11
12
13
14
15
16
17
18
12 3
4
5
6
78
910
11
12
13
14
15
16
17
18
Creek health summaryUpper Tingalpa Creek catchment has relatively low monitoring coverage, due to the size of the catchment, limited road access and high proportion of private properties.
Upper Tingalpa catchment achieved the highest overall water quality rating, with a consistently good rating from 2004-2008. This is due mostly to low concentrations of phosphorus and average concentrations of nitrogen. The rating has been brought down by low dissolved oxygen levels and very high chlorophyll-a levels over most years, indicative of large inputs and breakdown of organic material. This site is within a mostly undisturbed reserve area in Buhot Creek.
Fish communities in the catchment have rated poorly since 2004, but are improving. Proportion of introduced fish is generally low, therefore the rating mostly reflects the low diversity of native species present (one to three species). This may be a result of Leslie Harrison Dam creating a barrier to the movement of the fish to the estuary of Tingalpa Creek.
Macro-invertebrate communities have consistently rated very well for the catchment, indicating low levels of disturbance.
A combined waterway management plan was developed for Upper and Lower Tingalpa Creek catchment in 2003. Seventy-five percent of the recommended actions from the WMP have been commenced or completed to date. This catchment has been ranked as a low priority for protection and management actions, due to low future land use pressures and existing protection under the Redlands Planning Scheme.
Brisbane City Council
Logan City Council
29

Indicator analysis
Indicator 1. Waterways with defined environmental valuesWaterway
Tingalpa Creek
Upper freshwater, including Priest Gully, Buhot Creek and Stockyard Creek
Leslie Harrison Dam - freshwater
Indicator 2. Freshwater monitoring coverageNumber of sites per monitoring program
Approx. coverage Total sites Ambient Hotspot Event-based EHMP Fish and macro-invertebrates
1 site every 8.51km 4 1 0 0 1 2
*Some of the programs sample from the same sites
Indicator 3. Water quality compared to objectives04/05 05/06 06/07 07/08 Data trend
Overall rating B B B B
Physical/chemical
DO D D C D Worsening
pH A A A A Slightly increasing
Conductivity A B A A Increasing
Turbidity A A A A Decreasing
Nutrient levels
Phosphorus A A A A Steady
Nitrogen B B C B Slightly worsening
Aquatic processing
Chlorophyll-a F B F F Worsening
Indicator 4. Estimated pollutant loads entering Moreton BayWater flow (megalitres water/year) Total Suspended Solids (tonnes/yr) Total Nitrogen (tonnes/yr) Total Phosphorus (tonnes/yr)
11376 664.0 13.97 1.66
Indicator 5. Fish communities and Indicator 6. Macro-invertebrate communitiesUpper Tingalpa Catchment 04/05 05/06 06/07 07/08 Data trend
Fish communities F D C D Worsening
Macro-invertebrate communities A A A A Steady
Indicator 7. Waterways covered by recovery plansWMP completed Alternative plan completed Percentage of identified actions
commenced or completed (%)Rating
Completed in 2003* N/A 75% A
* combined WMP for Upper and Lower Tingalpa Creek.
Indicator 8. Priority ranking for management and protection actionsPercentage of creek length
Overall creek priority rankingHigh priority Medium priority Low priority
5% 48% 47% Low
30
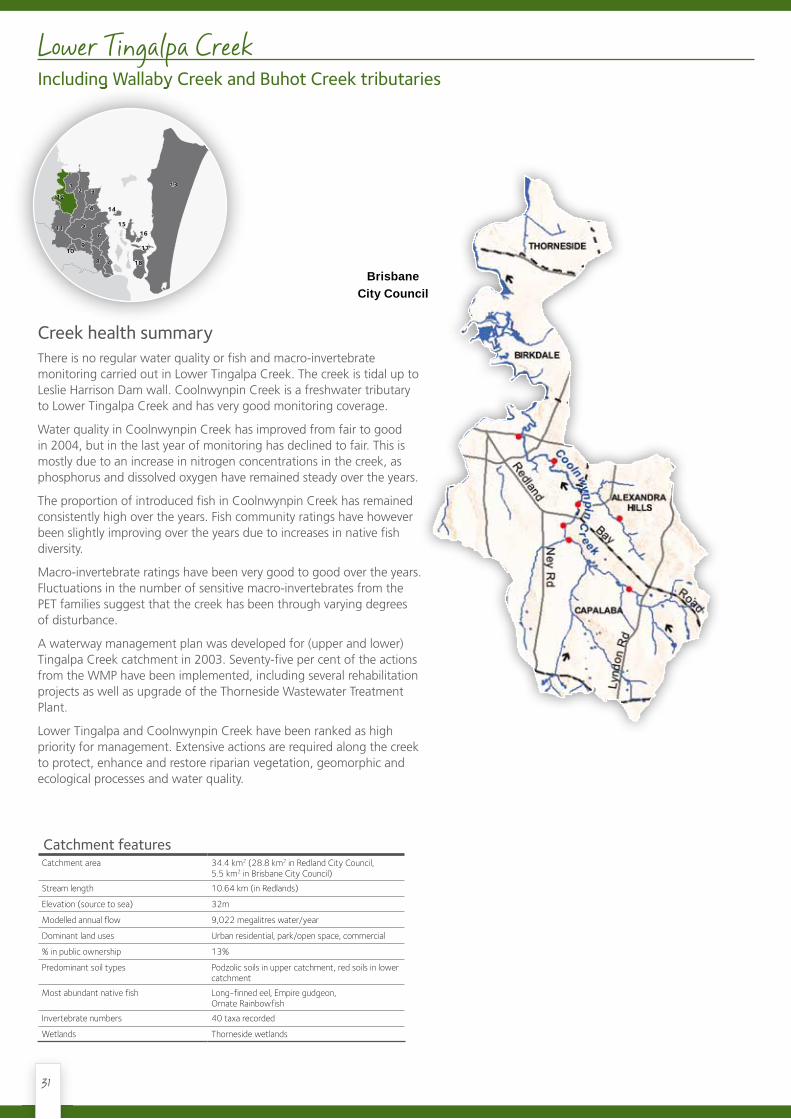
Creek health summaryThere is no regular water quality or fish and macro-invertebrate monitoring carried out in Lower Tingalpa Creek. The creek is tidal up to Leslie Harrison Dam wall. Coolnwynpin Creek is a freshwater tributary to Lower Tingalpa Creek and has very good monitoring coverage.
Water quality in Coolnwynpin Creek has improved from fair to good in 2004, but in the last year of monitoring has declined to fair. This is mostly due to an increase in nitrogen concentrations in the creek, as phosphorus and dissolved oxygen have remained steady over the years.
The proportion of introduced fish in Coolnwynpin Creek has remained consistently high over the years. Fish community ratings have however been slightly improving over the years due to increases in native fish diversity.
Macro-invertebrate ratings have been very good to good over the years. Fluctuations in the number of sensitive macro-invertebrates from the PET families suggest that the creek has been through varying degrees of disturbance.
A waterway management plan was developed for (upper and lower) Tingalpa Creek catchment in 2003. Seventy-five per cent of the actions from the WMP have been implemented, including several rehabilitation projects as well as upgrade of the Thorneside Wastewater Treatment Plant.
Lower Tingalpa and Coolnwynpin Creek have been ranked as high priority for management. Extensive actions are required along the creek to protect, enhance and restore riparian vegetation, geomorphic and ecological processes and water quality.
Lower Tingalpa Creek Including Wallaby Creek and Buhot Creek tributaries
Catchment featuresCatchment area 34.4 km2 (28.8 km2 in Redland City Council,
5.5 km2 in Brisbane City Council)
Stream length 10.64 km (in Redlands)
Elevation (source to sea) 32m
Modelled annual flow 9,022 megalitres water/year
Dominant land uses Urban residential, park/open space, commercial
% in public ownership 13%
Predominant soil types Podzolic soils in upper catchment, red soils in lower catchment
Most abundant native fish Long-finned eel, Empire gudgeon, Ornate Rainbowfish
Invertebrate numbers 40 taxa recorded
Wetlands Thorneside wetlands
Including Wallaby Creek and Buhot Creek tributaries
12 3
4
5
6
78
910
11
12
13
14
15
16
17
18
12 3
4
5
6
78
910
11
12
13
14
15
16
17
18
Brisbane City Council
31

Indicator analysis
Indicator 1. Waterways with defined environmental valuesWaterway
Middle freshwater Ð including Coolnwynpin Creek
Estuarine and enclosed coastal
Indicator 2. Freshwater monitoring coverageNumber of sites per monitoring program
Approx. coverage Total sites Ambient Hotspot Event-based EHMP Fish and macro-invertebrates
Lower Tingalpa Creek No regular monitoring 0 0 0 0 0 0
Coolnwynpin Creek 1 site every 1.52km 7 3 0 0 1 3
*Some of the programs sample from the same sites
Indicator 3. Water quality compared to objectives04/05 05/06 06/07 07/08 Data trend
Overall rating C B B C
Physical/chemical
DO C C C C Worsening
pH A A A A Slightly worsening
Conductivity A A A A No trend
Turbidity A A A A Steady
Nutrient levels
Phosphorus C A B B Slightly worsening
Nitrogen C C B D Worsening
Aquatic processing
Chlorophyll-a F B D A Improving
Indicator 4. Estimated pollutant loads entering Moreton BayWater flow (megalitres water/year) Total Suspended Solids (tonnes/yr) Total Nitrogen (tonnes/yr) Total Phosphorus (tonnes/yr)
9,022 716.2 12.00 1.71
Indicator 5. Fish communities and Indicator 6. Macro-invertebrate communitiesCoolnwynpin Creek 04/05 05/06 06/07 07/08 Data trend
Fish communities D D C C Slightly improving
Macro-invertebrate communities B A B B Steady
Indicator 7. Waterways covered by recovery plansWMP completed Alternative plan completed Percentage of identified actions
commenced or completed (%)Rating
Completed in 2003* N/A 75% A
*combined WMP for Upper and Lower Tingalpa Creek.
Indicator 8. Priority ranking for management and protection actionsPercentage of creek length
Overall creek priority rankingHigh priority Medium priority Low priority
57% 42% 1% High
32

Creek health summaryEnvironmental values have not been identified for the creeks of North Stradbroke Island (NSI), therefore default ‘other freshwater tributaries’ values are applied. Council does not have a clear idea of water quality issues facing the creeks as the Fish and Macro sampling project carried out in Autumn 2007 is the only formal sampling carried out on NSI.
Overall, the creeks of NSI rated good or very good for macro-invertebrate communities and this was due mostly to a high number of sensitive species from the ‘PET’ families. These species are affected by disturbance of the waterway, so the results suggest that the majority of the creeks are in an undisturbed state.
Fish community ratings were relatively lower than macro-invertebrates and this was mostly due to low numbers of native species present.
Capembah Creek, on the western side of NSI, had the highest diversity of native fish, with eight fish species recorded. The remainder of the creeks had diversity of six or less native species. The NSI creeks are largely undisturbed ecosystems so it is unclear what is causing low diversity, however it could be a natural occurrence. Further study would be needed to verify this.
No management and protection priorities have been set for the NSI creeks. A consistent approach to prioritising creek management is required across the city, for example applying the Creek Functional Unit and Riparian Zone Mapping to the NSI creeks.
North Stradbroke Island catchments
Catchment featuresCatchment area 271.9 km2
Stream length Creeks have not been formally mapped.
Elevation (source to sea)
Modelled annual flow 2,040 megalitres water/year Ð most rainfall infiltrates rather than run-off into the creeks.
Dominant land uses Bushland
Most abundant native fish Fire-tail Gudgeon, Striped Gudgeon
Invertebrate numbers
Wetlands
12 3
4
5
6
78
910
11
12
13
14
15
16
17
18
12 3
4
5
6
78
910
11
12
13
14
15
16
17
18
North Stradbroke
Island
33

Indicator analysis
Indicator 1. Waterways with defined environmental valuesWaterway
No environmental values identified Ð use default values
Other freshwater tributaries
Indicator 2. Freshwater monitoring coverageNumber of sites per monitoring program
Appox. coverage Total sites Ambient Hotspot Event-based EHMP Fish and macro-invertebrates
Unable to determine Ð stream length has not been formally calculated
8 0 0 0 0 8
*Some of the programs sample from the same sites
Indicator 3. Water quality compared to objectivesNorth Stradbroke Island 04/05 05/06 06/07 07/08 Data trend
Overall rating No data
Indicator 4. Estimated pollutant loads entering Moreton BayWater flow (megalitres water/year) Total Suspended Solids (tonnes/yr) Total Nitrogen (tonnes/yr) Total Phosphorus (tonnes/yr)
Remainder of NSI 2,004 189.8 2.68 0.44
Note: an assumption of the E2 model was that since NSI is a sand island and is highly vegetated apart from the residential areas, most of the rainfall will filter into the sand rather than running off into Moreton Bay. This means pollution export rates are much lower than areas of similar large size on the mainland.
Indicator 5. Fish communities and Indicator 6. Macro-invertebrate communitiesCreeks Indicator 04/05 05/06 06/07 07/08
Overall NSI rating Fish communities B
Macro-invertebrate communities A
Unnamed creek Ð Flinders Beach Fish communities D
Macro-invertebrate communities C
Aranarawai Creek Fish communities C
Macro-invertebrate communities A
Capembah Creek Fish communities A
Macro-invertebrate communities A
The Keyholes Fish communities D
Macro-invertebrate communities B
Yerrol Creek Fish communities B
Macro-invertebrate communities A
Brown Lake Fish communities D
Macro-invertebrate communities No data*
Freshwater Creek Fish communities C
Macro-invertebrate communities No data*
Blue Lake outflow Fish communities C
Macro-invertebrate communities B
*No edge habitat available for sampling
Indicator 7. Waterways covered by recovery plansWMP completed Alternative plan completed Percentage of identified actions
commenced or completed (%)Rating
No No N/A F
Indicator 8. Length of Creek with high and medium priority for management and protectionNSI was not included in the Creek Functional Unit and Riparian Zone Mapping project. Therefore no data has been collected for Indicator 8.
34

Coochiemudlo and Southern Moreton Bay Island (SMBI) catchmentsIncluding Macleay, Lamb, Karragarra and Russell Island catchments
Catchment featuresCatchment area 23.8 km2
Stream length Creeks have not been formally mapped.
Modelled annual flow 10,710 megalitres water/year
Dominant land uses Low-density urban and open space.
Most abundant native fish No data
Invertebrate numbers No data
Wetlands Karragarra wetland, Turtle Swamp Wetlands (Russell Island)
12 3
4
5
6
78
910
11
12
13
14
15
16
17
18
12 3
4
5
6
78
910
11
12
13
14
15
16
17
18
2
Creeks have not been formally mapped.
10,710 megalitres water/year
Low-density urban and open space.
Creeks have not been formally mapped.
10,710 megalitres water/year
Macleay Island
Lamb Island
Karragarra Island
Russell Island
Coochiemudlo Island
Creek health summaryCatchment-specific environmental values have not been identified for Coochiemudlo Island or the SMBI catchments. Default values are applied to these creeks to determine the water quality objectives that should be maintained.
Regular water quality monitoring is not carried out on Coochiemudlo or SMBI so there is no comparable data available to report on for this year’s report card. Council has extended its ambient monitoring program to the SMBI and has gathered quarterly water quality data to be reported in future recovery reports.
No management and protection priorities have been set for Coochiemudlo Island or the SMBI creeks. A consistent approach to prioritising creek management is required across the city, for example applying the Creek Functional Unit and Riparian Zone Mapping to the bay island creeks.
35

Indicator analysis
Indicator 1. Waterways with defined environmental valuesWaterway
No environmental values identified Ð use default values
Other freshwater tributaries
Indicator 2. Freshwater monitoring coverageMonitoring coverage Total sites Ambient Hotspot Event-based EHMP Fish and macro-invertebrates
No regular monitoring is carried out on any of the SMBI or Coochiemudlo.
Indicator 3. Water quality compared to objectivesSMBI 04/05 05/06 06/07 07/08 Data trend
Overall rating No data
Physical/Chemical No data
Nutrient Levels No data
Aquatic processing No data
Indicator 4. Estimated pollutant loads entering Moreton BayCatchment Water flow (megalitres water/year) Total Suspended Solids (tonnes/yr) Total Nitrogen (tonnes/yr) Total Phosphorus (tonnes/yr)
Coochiemudlo 429 28.1 0.50 0.07
Karragarra and Russell 7,064 340.6 8.23 0.86
Macleay and Lamb 3,216 189.5 3.94 0.47
Note: due to proximity, some of the SMBI were grouped in the E2 Model.
Indicator 5. Fish communities and Indicator 6. Macro-invertebrate communitiesSMBI 04/05 05/06 06/07 07/08 Data trend
Fish communities No data
Macro-invertebrate communities No data
Indicator 7. Waterways covered by recovery plansWMP completed Alternative plan completed Percentage of identified actions
commenced or completed (%)Rating
No No N/A F
Indicator 8. Length of Creek with high and medium priority for management and protection Coochiemudlo and the Southern Moreton Bay Islands were not included in the Creek Function Mapping project, therefore no data has been collected for Indicator 8.
36

Citywide statusEnvironmental values
Indicator 1. Waterways with defined environmental values
Waterway
Aqu
atic
Eco
syst
ems
Hum
an c
onsu
mer
Prim
ary
recr
eati
on
Seco
ndar
y re
crea
tion
Vis
ual r
ecre
atio
n
Cul
tura
l and
sp
irit
ual v
alue
s
Indu
stri
al u
se
Aqu
acul
ture
Dri
nkin
g w
ater
Irrig
atio
n
Stoc
k w
ater
Farm
sup
ply
Oys
teri
ng
Seag
rass
Tarradarrapin Creek
Hilliards Creek
Upper headwaters - freshwater
Middle reaches - freshwater
Lower reaches - estuary
Cleveland Creek
Thornlands Creek
Eprapah Creek
Upper main channel Ð upstream of Mt Cotton Rd
Sandy Creek
Middle main channel Ð Mt Cotton Rd to Luke St (east)
Little Eprapah Creek - freshwater
Lower main channel - Luke St (east) to tidal limit
Estuarine reaches
Moogurrapum Creek
Southern Redland Bay catchment
Tingalpa Creek
Upper freshwater, including Priest Gully, Buhot Creek and Stockyard Creek
Leslie Harrison Dam - freshwater
Middle freshwater Ð including Coolnwynpin Creek
Estuarine and enclosed coastal
Other freshwater tributaries (Serpentine, Native Dog and California Creeks)
Other estuarine tributaries (not listed above)
Other wetlands, lakes and reservoirs (not included above)
Other tidal canals, constructed estuaries, marinas and boat harbours (not listed above)
Ground waters
37

In the results tables in this section, creeks are numbered as follows.Creek/catchment name Creek/catchment number
Tarradarrapin Creek 1
Hilliards Creek 2
Cleveland catchment 3
Black Swamp (Cleveland catchment) 3a
Thornlands catchment 4
Eprapah Creek 5
Moogurrapum Creek 6
Southern Redland Bay catchment 7
Weinam Creek (Southern Redland Bay catchment) 7a
Serpentine Creek 8
Native Dog Creek 9
California Creek 10
Upper Tingalpa catchment 11
Buhot Creek (Upper Tingalpa catchment) 11a
Lower Tingalpa catchment 12
Coolnwynpin Creek (Lower Tingalpa catchment) 12a
North Stradbroke Island Creeks 13
Unnamed creek Ð Flinders Beach (NSI) 13a
Aranarawai Creek (NSI) 13b
Capembah Creek (NSI) 13c
The Keyholes 13d
Yerrol Creek (NSI) 13e
Brown Lake 13f
Freshwater Creek (NSI) 13g
Blue Lake outflow 13h
SMBI and Coochiemudlo Island Creeks 14
Coochiemudlo Island 14a
Macleay Island 14b
Lamb Island 14c
Karragarra Island 14d
Russell Island 14e
Citywide statusCreek numbering
38

Water qualityCity wide status
Indicator 2. Freshwater monitoring coverage
Creek/catchment
number
Approx. Coverage (1 site/x km) Total sites
Number of sites per monitoring program (status)
Ambient Hotspot Event-based EHMP Fish and macro
Active(monthly)
Active (during rainfall)
Active (during rainfall)
Active (2 per yr) Inactive (once in 2007)
1 0.73km 13* 4 13 2
2 2.8km 13* 3 8 3 2 2
3 No sites 0 2^
4 No sites 0
5 3.71km 14* 4 11 3 2 1
6 7.90km 4* 2 1 2
7 8.49km 1 1
8 16.52km 1 1
9 1.38km 7 6 1
10 No sites 0
11 8.51km 4 1 1 2
12 No sites 0
12a 1.52km 7* 3 1 3
13 Unable to determine 8
14 No sites 0
*Some of the programs sample from the same sites^ These sites are in the Black Swamp, which does not form part of Ross Creek; therefore they are not included in the coverage.# Stream length has not been formally mapped and calculated
Indicator 3. Water quality compared to objectivesCreek/
catchmentnumber
04/05 05/06 06/07 07/08
1 B B B C2 B C B C3a C C C C4
5 C D C D6 C C C D7a A B B D8
9
10
11a B B B B12a C B B C13
14
Indicator 4. Estimated pollutant loads entering Moreton BayCreek/catchment
numberTotal Suspended
Solids (tonnes/yr)Total Nitrogen (tonnes/yr)
Total Phosphorus (tonnes/yr)
1 398.0 5.92 0.91
2 630.2 11.19 1.44
3 335.9 5.10 0.77
4 275.6 4.71 0.64
5 1088.4 18.87 2.42
6 434.6 7.46 0.94
7 411.5 7.82 1.00
8* 164.2 4.04 0.36
9* 251.7 4.85 0.54
10* 46.0 1.03 0.11
11* 664.0 13.97 1.66
12* 716.2 12.00 1.71
13 189.8 2.68 0.44
14a 28.1 0.50 0.07
14b and 14c 189.5 3.94 0.47
14d and 14e 340.6 8.23 0.86
* export from Redland City Council portion of catchment only.
39

Biological indicators
Indicator 7. Waterways covered by recovery plansCreek/catchment number WMP completed Date completed Percentage of identified actions commenced or completed (%)
1 No WMP completed for this Creek
2 2005 60% of recommended actions commenced or completed
3 No WMP completed for this Creek
4 No WMP completed for this Creek
5 2004 90% of recommended actions commenced or completed
6 No WMP completed for this Creek
7 Integrated Waterway Plan recently completed for Torquay Creek
8 No WMP completed for this Creek
9 Integrated Waterway Plan recently completed for Native Dog Creek
10 No WMP completed for this Creek
11 and 12 2003 75% of recommended actions commenced or completed
13 No WMP completed for this Creek
14 No WMP completed for this Creek
Indicator 8. Priority ranking for management and protection actionsCreek/catchment number Overall Creek Priority Ranking
1 High
2 Medium
3 High
4 Medium
5 High
6 High
7 High
8 Low
9 Medium
10 Low
11 Low
12a High
13 No ranking available
14 No ranking available
Indicator 5. Fish communitiesCreek/
catchment number
04/05 05/06 06/07 07/08
1 F
2 C C C C
3
4
5 D C B C
6 C D D D
7
8 C
9 F
10
11 F D C D
12a D D C C
13 B
14
Indicator 6. Macro-invertebrate communitiesCreek/
catchment number
04/05 05/06 06/07 07/08
1 B
2 A A A A
3
4
5 B A A A
6 B A B B
7
8 C
9 C
10
11 A A A A
12a B A B B
13 A
14
40

Findings, challenges and recommendations

Findings, challenges and recommendations

Looking across the data in the report, there are major issues for further improvements in water quality and waterway health for each creek.
Monitoring activitiesData gaps: The report has revealed many gaps in water quality data across the city.
Areas where there is currently no regular ambient water quality monitoring:
• Clevelandcatchment(apartfromBlackSwamp)
• Thornlandscatchment
• SerpentineCreek
• NativeDogCreek
• CaliforniaCreek
• LowerTingalpaCreek
• NorthStradbrokeIslandcatchment
• CoochiemudloIslandcatchment
• SouthernMoretonBayIslandcatchment(commenced2009/10).
Without base-line data, Council does not have a clear understanding of the health of creeks in these areas and what factors are impacting on their health.
Hotspot and/or event-based monitoring is carried out in Tarradarrapin, Hilliards and Eprapah Creeks and is helping to track down the causes of poor waterway health.
The Healthy Waterways EHMP collects fish and macro-invertebrate data each autumn and spring in Hilliards, Eprapah, Upper Tingalpa, Moogurrapum and Coolnwynpin Creeks. The monitoring was extended as a once-off sampling project in 2007 (the Fish and Macro sampling project) to new sites in these creeks, as well as Tarradarrapin, Serpentine and Native Dog Creeks.
Water quality trendsGeneral trend: Across the mainland catchments, there is a general trend of worsening ratings for nutrients (nitrogen and phosphorus). Excessive nutrients can cause algal blooms to grow in a waterway. Oxygen in the water is used up when algal blooms sink and the algae is consumed by bacteria, micro-organisms and other water bugs.
Moogurrapum and Eprapah creeks have seen the sharpest increases in nitrogen and phosphorus levels over the year.
In 2007/2008 Moogurrapum Creek rated very poor for nitrogen and poor for phosphorus. Eprapah Creek rated very poor for phosphorus and poor for nitrogen.
Tarradarrapin, Weinam and Coolnwynpin Creeks all showed worsening nutrient trends. Hilliards Creek and the Black Swamp (Cleveland) maintained steady fair and poor ratings respectively.
Upper Tingalpa Creek achieved the best ratings for nutrients, with consistent A for phosphorus and mostly B for nitrogen.
The site on this creek is within a mostly undisturbed conservation area in the headwaters of Tingalpa Creek.
Poor ratings for dissolved oxygen generally accompany poor nutrient ratings. Worsening trends are mirrored in both parameters, as shown for Tarradarrapin Creek, Eprapah Creek, Moogurrapum Creek, Weinam Creek and Coolnwynpin Creek.
Chlorophyll-a and algae: The relationship between nutrient and chlorophyll-a levels is not always as obvious. Chlorophyll-a levels are variable across the city, and are worsening in Moogurrapum and Upper Tingalpa Creek. The cause of increasing chlorophyll-a in Moogurrapum is likely to be increased algal growth due to high amounts of nutrients, whereas in Upper Tingalpa Creek high levels are likely to be due to inputs of organic matter.
pH, conductivity and turbidity: The remaining physical/chemical parameters (pH, conductivity and turbidity) are consistently within WQO levels across the creeks.
Loads leaving the catchmentsRunoff rates: Coastal urban areas were found to have a higher runoff rate than non-urbanised inland areas.
This is due to higher amounts of impervious surfaces (i.e. roofs, roads, concrete driveways). There is a greater potential for nutrients and sediment to be washed into the creeks in these areas.
Sewage treatment plants contribute significant loads of nutrients when compared with wider catchment sources, particularly phosphorus levels.
Treatment plant loads account for a significant proportion of the total load for a creek. For example, Victoria Point treatment plant contributes most of the phosphorus loads from Eprapah Creek. The combined load from Victoria Point, Capalaba and Thorneside treatment plants make up a high proportion of the total phosphorus exported from Redland city to the bay.
Tingalpa Creek, Eprapah Creek and the Southern Moreton Bay Islands contribute the highest amount of rainwater runoff and suspended solids loads.
Load comparison: Redlands’ creeks do not contribute total loads as large as the surrounding catchments of Logan-Albert and the Lower Brisbane River due to smaller catchment areas.
However, on a per hectare basis, diffuse loads from Redlands’ creeks are significantly higher than the Logan-Albert, and only slightly lower than the Lower Brisbane catchments.
TSS and nutrients: Research is needed into the relationship between total suspended solids (TSS) and nutrients in the creeks, in particular phosphorus. This will help in deciding appropriate management actions to reduce sediment and nutrient loads.
Major findings and challenges for improving creek health
43

Fish and macro-invertebratesTrend: Keeping in mind that fish and macro-invertebrates communities are a reflection of waterway health, results across the city suggest that ecosystem health is stable or improving in most creeks despite declining water quality.
Data gathering: Ratings for creeks tested in the Fish and Macro project in 2007 are based on limited data and tended to rate lower in comparison to those monitored over three to four years under the EHMP program.
Running the Fish and Macro sampling project regularly (yearly or twice a year) at the additional sampling sites would be valuable in building baseline data on the health of these creeks. It would also help Council track improvements in response to management and rehabilitation activities.
Fish: Looking across the city, fish communities rated fair to poor but have improved slightly since 2004.
In most creeks the number of native species was rated good to fair.
Introduced fish species are a problem in all creeks except Serpentine and Upper Tingalpa Creeks on the mainland and Aranarawai, Capembah and Yerrol Creeks on NSI.
Macro-invertebrates: Ratings for macro-invertebrate communities are generally good and trends are steady in the creeks with yearly EHMP data.
Overall, the NSI creeks rated very well for macro-invertebrate communities. This was due mostly to a high number of sensitive species from the PET families.
PET species are affected by disturbance of the waterway, so the results suggest that the majority of the creeks are in an undisturbed state.
North Stradbroke Island (NSI): Fish community ratings on NSI were lower than macro-invertebrate ratings.
This result was mostly due to a low number of native species present. It is unknown whether this is a natural occurrence and whether it is appropriate to calculate the ratings on the same guidelines as the mainland creeks.
The initial impression of NSI streams was that they are in very good ecological condition, with the exception of:
• thepresenceoffloatingpestplantSalviniainFreshwaterCreek and Eighteen Mile Swamp; and
• highproportionsoftheintroducedMosquitofishinallsampled creeks except those flowing to the west of the island (Moffatt, 2008).
Waterway management and protectionFormal waterway management plans have been developed for Eprapah Creek, Hilliards Creek and Upper and Lower Tingalpa Creek combined (including Coolnwynpin Creek).
The catchment-by-catchment planning approach has proven slow. Since 2003, plans have been completed for three out of the 14 catchments.
While these plans provide detailed ecological assessments and information, they duplicate a lot of actions and content. The WMPs do not allow actions to be prioritised over the three catchments at once.
Council requires a city-wide tool to identify and prioritise on-ground rehabilitation works, planning scheme protection and maintenance of already healthy areas across all catchments.
The Creek Functional Unit and Riparian Zone Mapping Project will go some way to providing Council with a tool to identify and prioritise creek management actions.
The project has developed an initial mapping-based tool for splitting up the creeks into smaller management units and identifying management, rehabilitation and protection actions needed across all creeks.
The actions are then categorised into high, medium and low priority actions across the mainland catchments as a whole.
This work has been carried out on a city-wide scale for all creeks. Highest priority creek/catchments are Eprapah Creek, Southern Redland Bay catchment , Cleveland catchment, Tarradarrapin Creek, Lower Tingalpa/Coolnwynpin Creek and Moogurrapum Creek.
More in-depth management unit mapping has been completed for Eprapah Creek.
Similar detailed mapping of management units will be completed for the remaining high priority creeks/catchments, followed by medium and low priority creeks and catchments.
The integrated waterway management plans (IWMP) has superceded the waterway management plan as a planning tool. An IWP has been developed for Native Dog Creek and Torquay Creek (Southern Redland Bay catchment). The IWP provides detailed plans for building infrastructure aimed at improving waterway health and water quality and reducing flooding impacts (e.g. artificial wetlands and bioretention ponds).
The plans will be completed for a group of catchments each financial year. An IWMP is underway for Eprapah and Thornlands Creeks in the 2009/2010 financial year.
44
Waterway Recovery Report recommendations
Recommendations have been split into five categories based on the Recovery Report findings. The recommendations relate to Council, the local community and other government and non-government waterway managers (e.g. DERM, Healthy Waterways and SEQ Catchments), who all have a responsibility when it comes to keeping our waterways healthy.
Education1. Support and encourage landholders to improve land
management practices through extension programs focussed on reducing nutrient and sediment inputs to the creeks.
2. Provide awareness and education services to the community on the impacts their actions in the catchments have on the water quality and health of creeks and Moreton Bay.
Council programs3. Extend ambient, hotspot and event monitoring to
unmonitored creeks on the islands and mainland to:
• buildupabetterpictureofwaterqualityissuesinthecreeks
• trackdownsourcesofpollution
• helpguidemanagementdecisions,and
• trackimprovementsinwaterqualityandwaterwayhealthin future years.
4. Conduct regular fish and macro-invertebrate monitoring twice a year as a continuation of the one-off Fish and Macro project completed in 2007.
5. Physical/chemical aspects of water quality are mostly within acceptable WQO levels, therefore it is recommended that Council aim to maintain these conditions when carrying out works in and around waterways.
6. Nutrient management is a vital action needed across all creeks. Based on the ratings in this report, Moogurrapum Creek and Eprapah Creek should be a high priority for nutrient reduction actions. Managing high nutrient levels is expected to improve dissolved oxygen and chlorophyll-a levels.
Research7. Extend monitoring activities in the 2009/10 financial year to
island and mainland catchments where there is currently no available water quality or waterway health information.
8. As suspended solids are not well monitored in the creeks, it is recommended that this parameter be included in the ambient monitoring program. In addition, the relationship between suspended solids and nutrients in the creeks should be investigated to support management decisions.
9. Investigate ways of reducing numbers of introduced fish in the creeks of the Redlands.
Planning and protection10. Investigate strengthening of planning rules in coastal alluvial
areas with nutrient-rich soils in order to prevent the release of nutrients when these soils are disturbed.
11. Develop and implement a consistent framework for identifying and prioritising waterway protection, management and rehabilitation actions across the city.
Reporting12. Continue to develop and improve reporting procedures
established in the Redlands Waterway Recovery Report - Condition Summary 2010.
13. Produce the Redlands Waterway Recovery Report on an annual basis to track the recovery of our creeks.
ReferencesANZECC/ARMCANZ (2000) Australian and New Zealand Guidelines for Fresh and Marine Water Quality. Environment Australia, Canberra
BAAM (2008a) Hilliards Creek Corridor Biodiversity Assessment 2007/2008. Unpublished report to Redland City Council, Biodiversity Assessment and Management, Cleveland.
BAAM (2008b) Eprapah Creek Corridor Biodiversity Assessment 2008/2009. Unpublished report to Redland City Council, Biodiversity Assessment and Management, Cleveland.
Dudgeon, S (2007) Redland Waterway Assessment and Priority Plan. Unpublished report to Redland City Council, Natural Solutions Environmental Consultants Pty Ltd, Brisbane.
EHMP (2008) Ecosystem Health Monitoring Program 2006-07 Annual Technical Report. South East Queensland Healthy Waterways Partnership, Brisbane.
EPA (2006) Queensland Water Quality Guidelines 2006. Environmental Protection Agency, Brisbane.
Moffatt, D. B. (2008) Ecological assessment of the Non-tidal Waterways of Redland Shire: Autumn 2007. Unpublished report to Redland Shire Council, Natural Resources and Water, Indooroopilly.
Stewart, J. (2008) Redland Shire Council Catchment Model Development. Unpublished Report to Redland City Council, BMT WBM Pty Ltd, Brisbane.
Thompson, B (2008) Soil and Water Quality in Mainland Redlands. Unpublished Report to Redland City Council, Land Resource assessment and Management Pty Ltd, Kalbar.
45

Appendices and tables

Appendix 1Management actions to date
Council’s management objective for waterways is to ‘halt and reverse the declining trend in waterway health’.
The work carried out under the Waterways Recovery Actions program fits into four broad themes:
1. establishing a city-wide waterways status
2. finding the water quality hotspots
3. ending sediment and nutrient pollution
4. protecting habitat pools and core reaches from further degradation.
1. Establishing a city-wide waterways statusThe waterways recovery actions aim to provide a scientific basis for implementing protection and on-ground revegetation, rehabilitation and other management activities in the most strategic areas. The waterways recovery actions to date have included:
Waterway assessment and priority plan: This was one of the first studies under the Waterways Recovery Actions program. Using a State of the Creeks-style assessment, Redlands’ creeks have been divided into management units in order to prioritise protection and rehabilitation actions.
Outcomes/findings• Redlandcity’smainlandwaterwayhealthisratedasmoderate
or C.
• Thereachesofhighestenvironmentalvaluewerecontainedin management units described as currently in good condition.
• AllthewaterwaysonNSIwereidentifiedashavingverygood(A) environmental conditions.
• Halfofthetotalmainlandwaterwaylengthonlyreceivedanenvironmental value of moderate (C), being dominated by urban, grazing and rural residential areas.
• Whendefinedbysub-catchment;Serpentine,UpperTingalpa and Hilliards Creek catchments have the highest environmental value, whilst Southern Redland Bay, Thornlands and Lower Tingalpa Creek have the lowest environmental value.
• Manyreachesonthemainlandfallintothecategoriesoflow and very low priority for protection and conservation, whereas those on NSI all had a high or very high priority rating.
• Onawhole,thebedandbanksofthecity’swaterwaysarehighly stable against processes of erosion and sedimentation (Dudgeon, 2007).
Pollutant export modelling: For this project, the catchments have been divided into subcatchments and the levels of water run-off, nutrients and sediment leaving each subcatchment modelled. The modelling was based on the land use (i.e. amount of impermeable surface and general pollutants from each land use type), rainfall, and monitoring results from a neighbouring catchment of similar size and characteristics (Bulimba Creek).
Outcomes/findings• Theincreaseinpredictednutrientloadsduetolanduse
change between 2008 and 2023 (i.e. developing to the capacity that the Planning Scheme allows) is expected to be relatively minor compared with the resulting increase from sewage treatment plant outputs as the population grows.
• TheprojectcomparedthemodelledoutputsfromRedlandcatchments to the Logan-Albert and Lower Brisbane catchments, and the overall predicted amount of nutrients and sediments entering Moreton Bay from Redlands was significantly lower. Despite this, Redlands may be contributing higher loads from diffuse sources on a per hectare basis compared to Logan-Albert, and only just lower than the Lower-Brisbane.
Fish and macro-invertebrates assessment: A survey of the numbers and types of fish and macro-invertebrates (water insects) in creeks on the mainland and North Stradbroke Island was carried out using the same methods as that used for the Healthy Waterways Partnerships Ecosystem Health Monitoring Program.
Outcomes/findings• Threenewlocalnativespecieswerediscoveredinthe
Redlands – the Swamp Eel, Estuary Perchlet and Rendahl’s Catfish.
• Thesurveyidentifiedonerarefishspeciesonthemainland(Southern Purple-spotted Gudgeon) and two on NSI (Swamp Eel and the Ornate Sunfish).
• Thisisthefirsttimeastudyofthistypehasbeencarriedouton NSI, and if taken as a benchmark, the results comply with accepted standards. The study did however identify presence of aquatic weeds (Salvinia) and introduced fish (Mosquito fish – Gambusia) in high proportions at two sites on NSI.
• Onthemainland,HilliardsCreekhadthebestresultsintermsof numbers and diversity of native fish species. Tingalpa Creek also had high populations and species diversity.
• InSerpentineCreek,severalspeciesoffishwerefoundlivingin naturally very low pH.
47

Soils mapping project: This was the most recent waterways recovery action completed and the purpose was to map the soil types across the city and to provide information on how the soils may be interacting with land use activities and influencing water quality. The resulting report and mapping grouped soils into three broad soil types: coastal and alluvial, basalt and upland soils.
Outcomes/findings• Coastalandalluvialsoilsmakeuponly15%ofthemainland
but are nutrient sinks, and are likely to contain background carbon, nitrogen and phosphorus levels from five to 20 times that found in the middle and upper catchment areas. These are the areas where there is likely to be a significant exchange between surface waters and shallow groundwater systems impacted by land use.
• Thebasaltsoilsincludetheiconicredsoils,whicharelow activity clays with a large capacity to fix (immobilise) phosphorus. When these soils erode, the clay particles will remain suspended in the water column, resulting in high turbidity (cloudiness). The particles take a long time to settle and because of this are readily transported to the estuaries and into the bay, taking the attached phosphorus particles with them.
• Theuplandsoilscoverthegreatestpartofthemainlandarea. They have low to moderate potential for erosion, however this increases with slope. These soils are coarse and have limited nutrients, meaning nutrients must be added to increase productivity. They are found in all catchments, from mid to upper catchment.
• Intermsoflanduse,anumberoffactorsarelikelytobeimpacting water quality:
o Hydrological changes in the alluvial areas through drainage, land filling and vegetation changes are likely to be the major factors associated with nutrient and sediment hotspots in these areas.
o There is increasing grazing pressure and application of nutrients in the rural upland areas, which can lead to polluted stormwater runoff. Activities monitored by Council (e.g. poultry farms) are required to control their nutrient loading rates; however this does not apply to the equine and beef grazing sectors.
o Septic systems in upland soil areas may be contributing to the nutrient pollution in the creeks.
2. Finding the water quality hotspotsThe findings of the hotspot and event-based monitoring combine with the findings of the waterways recovery actions to provide a scientific basis for targeting specific sites for management activities to improve water quality and waterway health.
Focussed hotspot monitoring: Council implemented an intensive monitoring project to target the subcatchments and tributaries that are delivering the highest amounts of nutrients and sediment to the creeks and Moreton Bay. Monitoring is carried out following rainfall events and the results allow Council to seek out nutrient and sediment hotspots along the creeks by monitoring at a finer and finer scale until the pollutant sources have been identified. The program began in Eprapah, Hilliards and Tarradarrapin Creeks and now includes Native Dog and Torquay Creeks.
Trial event-based monitoring: Sampling during rain is a relevant way of measuring impacts from land use on the creek systems as more pollutants can be washed in during a few large events compared to entire contribution for the remainder of the year. Automatic sampling stations have been installed along Eprapah and Hilliards Creeks and these systems are capable to taking several samples during rainfall events as the water level rises, peaks and falls. The sites were selected to determine the influence of land use activities on the loads of nutrients and sediment entering the creeks. The data will also allow Council to determine the total loads leaving the catchments over the year.
3. Ending sediment and nutrient pollutionCouncil has launched a Waterways Extension Program to address the nutrient and sediment pollution problem. The program will include working with the landholders identified through the hotspot monitoring program to stop or decrease the loads of pollutants leaving their property. Proposed trial incentives include manure stockpile removal, land and waterway rehabilitation grants, septic system inspections and subsidised upgrades. Monitoring will be continued in the hotspot areas to evaluate the effectiveness of the extension activities.
4. Protection of habitat pools and core reaches from further degradationCouncil has recently undertaken a project to identify reaches of the creeks that have significant habitat in terms of contributing to the healthy functioning of the creek. This includes serving a physical or biological function to the health of the waterway, such as riparian vegetation that filters pollutants from runoff or a permanent pool that offers refuge to aquatic fauna during dry periods. The creeks have been mapped into smaller reaches prioritised for management activities. In terms of on-ground actions, the highest priority is protecting existing good quality habitat from degradation, then rehabilitating moderately degraded areas. The lowest priority would be converting highly degraded habitats back to a natural state. The rationale for this is that maintaining the habitat in its current state is more practical than allowing degradation to occur and having to implement rehabilitation and revegetation activities later on. By targeting waterway rehabilitation this way, Council will get the most effective outcomes for expenditure on management activities.
48

Appendix 2Calculating ratings for indicators
Indicator 2: Monitoring activitiesThe ratings for this indicator are colour-coded in the report rather than rated on an A – F scale. The approximate coverage for each creek was graphed and cut-off scores were determined based on the grouping of the data on the graph. These cut-offs were combined with scores for the number of monitoring programs carried out in the creek. The cut-off values for each rating are listed in Table 1 (over page).
Indicator 3, 5 and 6: Water quality objectives Ð WQO, fish and macro-invertebrate communitiesWater quality objectives (WQO) were derived from the Queensland Water Quality Guidelines (EPA, 2006) for all water quality and biota indicators, except for number of native fish present (Table 2). The objective for native fish was determined based on the total number of different species recorded for the mainland creeks (16 species), and the assumption that as the creeks have similar characteristics, it is reasonable to expect over half (up to 10) of these species to be present in any creek (see Table 2 over page).
Calculating ratings: For each creek, water quality and biota (fish and macro-invertebrates) data from all sites was pooled and sorted into years (04/05, 05/06, 06/07, 07/08, 08/09). Using ‘financial years’ made the best use of the available data, as there was not a whole year worth of data from 2004 and 2008.
Median values were derived for all parameter for each year and are presented in Appendix 3 and 4. The medians were then calculated as a percentage of the WQO value. A numerical score was then assigned using the rankings in Table 2, based on the criteria described in ANZECC/ARMCANZ (2000). For example, the WQO for turbidity is 50 NTU. A median turbidity value of 70 NTU would be 140% of the water quality objective and would be assigned a numerical score of 3 (moderate exceedance) from Table 3 (see over page).
Individual and overall scores were then converted to a rating according to the cut-offs in table 4 (see over page). Using the example given above, a median turbidity of 70 NTU would be rated as a C.
Weighting water quality rating components: In calculating an overall rating for water quality, more weighting was applied to nutrient and dissolved oxygen levels because Council has recognised these as major problems in the creeks. These factors are the main target of actions to improve water quality.
The remaining components of the physical/chemical indicators (i.e. pH, conductivity and turbidity) are for the most part within the WQO and only make up 10 per cent of the total water quality rating.
In contrast to this, the components of the fish and macro-invertebrate ratings were weighted equally.
All weightings applied are outlined in Table 2.
Indicator 4: Estimated pollutant loadsRatings for estimated loads were calculated in a similar way to water quality ratings. The expected tonnes of nutrients and sediment were calculated using the water flow data and WQO from Queensland Water Quality Guidelines (EPA, 2006). The estimated loads were then compared to the expected loads and assigned a rating based on the cut-off values in Table 5. The data ratings for this indicator are displayed based on a colour-coding rather than an A – F scale.
Indicator 7: Management plansThe ratings for this indicator are colour-coded and follow a scale of A (very good), C (fair) and F (very poor), rather than the complete A – F scale. Ratings are based on whether a waterway management plan has been completed, and the progress of the actions identified in the plan. The rating criteria are listed in Table 6.
Indicator 8: Protection and management prioritiesCreeks have been rated for this indicator based on the overall priority ranking for management and protection actions. Low priority creeks are rated better than high priority creeks. The reasoning behind this is that a creek that currently has good waterway health will need less work and is a lower priority than a creek with poor waterway health. Improving a creek with poor waterway health would require extensive work and would be a higher priority. Table 7 outlines the priority rankings and corresponding rating.
49
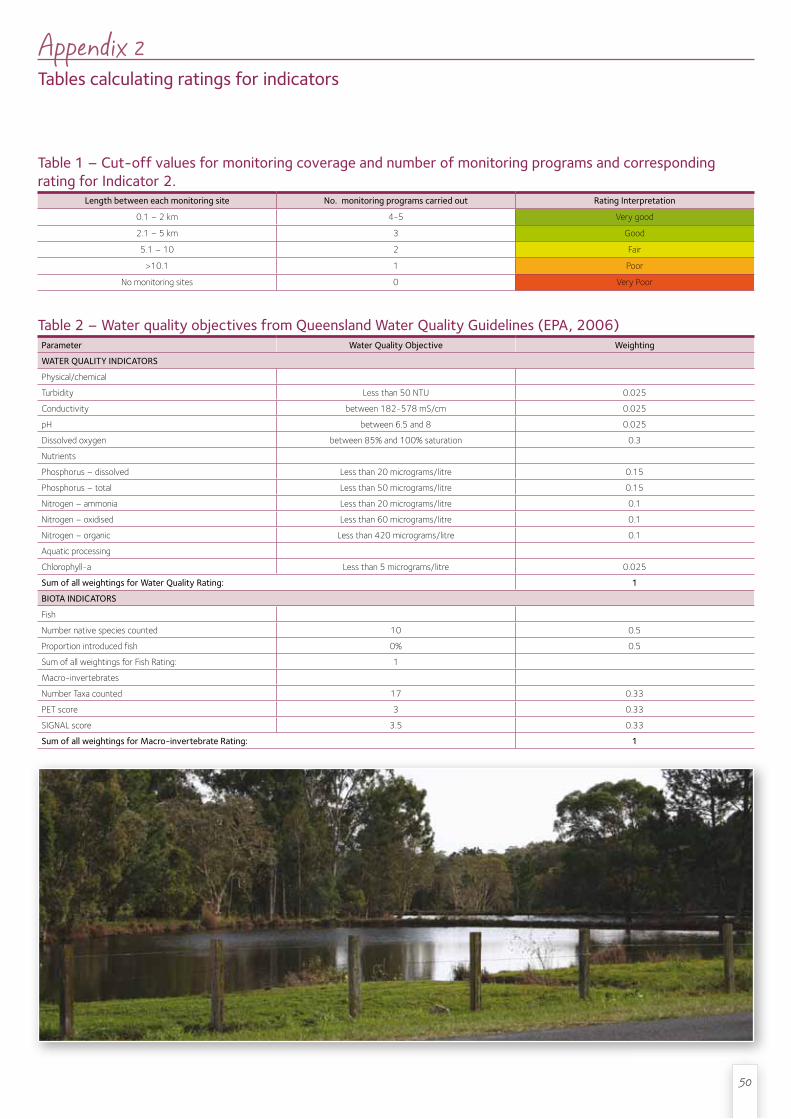
Appendix 2Tables calculating ratings for indicators
Table 1 Ð Cut-off values for monitoring coverage and number of monitoring programs and corresponding rating for Indicator 2.
Length between each monitoring site No. monitoring programs carried out Rating Interpretation
0.1 Ð 2 km 4-5 Very good
2.1 Ð 5 km 3 Good
5.1 Ð 10 2 Fair
>10.1 1 Poor
No monitoring sites 0 Very Poor
Table 2 Ð Water quality objectives from Queensland Water Quality Guidelines (EPA, 2006)Parameter Water Quality Objective Weighting
WATER QUALITY INDICATORS
Physical/chemical
Turbidity Less than 50 NTU 0.025
Conductivity between 182-578 mS/cm 0.025
pH between 6.5 and 8 0.025
Dissolved oxygen between 85% and 100% saturation 0.3
Nutrients
Phosphorus Ð dissolved Less than 20 micrograms/litre 0.15
Phosphorus Ð total Less than 50 micrograms/litre 0.15
Nitrogen Ð ammonia Less than 20 micrograms/litre 0.1
Nitrogen Ð oxidised Less than 60 micrograms/litre 0.1
Nitrogen Ð organic Less than 420 micrograms/litre 0.1
Aquatic processing
Chlorophyll-a Less than 5 micrograms/litre 0.025
Sum of all weightings for Water Quality Rating: 1
BIOTA INDICATORS
Fish
Number native species counted 10 0.5
Proportion introduced fish 0% 0.5
Sum of all weightings for Fish Rating: 1
Macro-invertebrates
Number Taxa counted 17 0.33
PET score 3 0.33
SIGNAL score 3.5 0.33
Sum of all weightings for Macro-invertebrate Rating: 1
50

Appendix 2Calculating ratings for indicators Tables continued
Table 3 Ð percent above WQO, condition category scores and interpretation used for assessing compliance with WQOs
Percent over/under WQO Condition category score Interpretation
80% - 120% 5 Meets WQO value
60% - 79% and 121% - 140% 4 Minor exceedance
40% - 50% and 141% - 160% 3 Moderate exceedance
20% - 39% and 161% - 180% 2 Major exceedance
0% - 19% and >180% 1 Very major exceedance
Table 4 Ð cut-off values for water quality ratings and corresponding ratinginterpretation for the water quality, fish and macro-invertebrate indicators.
Cut-off value Rating Rating interpretation
4.6 - 5 A Very good
3.6 Ð 4.5 B Good
2.6 Ð 3.5 C Fair
1.6 Ð 2.5 D Poor
1 Ð 1.5 F Very Poor
Table 5 - percent above Ô expected loadsÕ and interpretation and subsequent rating for Indicator 4.Percent over/under WQO Interpretation Rating Interpretation
80% - 120% Meets WQO value Very good
60% - 79% and 121% - 140% Minor exceedance Good
40% - 50% and 141% - 160% Moderate exceedance Fair
20% - 39% and 161% - 180% Major exceedance Poor
0% - 19% and >180% Very major exceedance Very Poor
Table 6 Ð Rating Criteria and corresponding rating colour for Indicator 7.Status of Management Plan (WMP) Rating Rating
WMP completed and over half of the identified actions commenced or completed
A Very good
WMP or alternative planning mechanism (e.g. Integrated Waterway Management Plan) completed but no actions have been commenced to date
C Fair
WMP not developed. F Very poor
Table 7 Ð Priority rankings and corresponding ratings for Indicator 8Priority ranking Rating interpretation
Low Very good
Medium Fair
High Very poor
51

Appendix 3Median values for water quality data
Nutrients Ð Median values
Phosphorus - Dissolved (μg/L) Phosphorus - Total (μg/L)
Creek No. 04/05 n 05/06 n 06/07 n 07/08 n 04/05 n 05/06 n 06/07 n 07/08 n
1 15 24 8 42 6 48 9.5 44 85 24 70 42 65 48 88 44
2 10 15 14 33 16 34 12.5 32 81 15 130 33 165 34 286.5 32
3a 37 9 34.5 12 40.5 12 39 11 95 9 70 12 90 12 87 11
5 36 27 30 45 18.5 46 32.5 44 140 27 225 46 140 46 187 44
6 18 21 12 24 16.5 24 29.5 22 63 21 85 24 125 24 165.5 22
7a 3 11 4 12 4.5 12 8 11 54 11 70 12 75 12 194 11
11a 5 9 4 11 5 12 4.5 10 46 9 40 11 40 12 53 9
12a 9 26 5.5 36 5 35 7 33 98.5 26 60 36 70 35 80 33
Nutrients Ð Median values
Nitrogen - Ammonia (μg/L) Nitrogen - Oxidised (μg/L)
Creek No. 04/05 n 05/06 n 06/07 n 07/08 n 04/05 n 05/06 n 06/07 n 07/08 n
1 53.5 24 27 42 32 48 45 44 120 24 240 41 90 48 214.5 44
2 29 15 15 33 24 34 26 32 7 15 19 33 8 34 14 32
3a 81 9 39 12 92.5 12 89 11 3600 9 3630 12 2480 12 2318 11
5 31 27 46 46 44 46 51.5 44 62 27 42.5 46 13.5 46 13 44
6 76 21 72 24 97.5 24 73.5 22 290 21 685 24 17 24 182 22
7a 14 11 14.5 12 10.5 12 247 11 2 11 15 12 5 12 23 11
11a 20 9 19 11 47 12 15.5 10 4 9 7 11 12 12 6 10
12a 46.5 26 43 36 39 35 49 33 75.5 26 74 36 61 35 107 33
Nutrients Ð Median values Physical/Chemical parameters Ð Median values
Nitrogen - Organic (μg/L) Dissolved Oxygen (% saturation)
Creek No. 04/05 n 05/06 n 06/07 n 07/08 n 04/05 n 05/06 n 06/07 n 07/08 n
1 523 24 510 41 406 48 553.5 44 75.7 23 75.7 42 63 40 48.7 44
2 1136 15 699 33 624 34 992 32 57.6 14 47.9 33 83.5 28 44.8 30
3a 339 9 453 12 384.5 12 563 11 58.2 9 60.6 12 41.5 10 52.6 11
5 530 27 886.5 46 542 46 1306.5 44 46 27 32.6 46 34.9 38 16.2 44
6 602 21 630.5 24 609 24 909.5 22 49.4 21 32.6 24 29.1 20 16.4 20
7a 524 11 419.5 12 452 12 689 11 70.4 11 26.6 12 31.6 10 13.9 10
11a 790 9 713 11 701 12 833 9 28.5 9 24.4 11 39.8 10 22.5 10
12a 630.5 26 549 36 460 35 663 33 48.8 26 45.3 36 40.8 29 34 33
Physical/Chemical parameters Ð Median values
pH Conductivity (mS/cm)
Creek No. 04/05 n 05/06 n 06/07 n 07/08 n 04/05 n 05/06 n 06/07 n 07/08 n
1 6.73 24 6.76 42 6.68 48 7.04 44 422.5 24 292.5 42 390.5 48 383.5 44
2 6.66 15 6.96 33 7.11 34 7.22 32 271 15 248 33 409 34 482 31
3a 7.19 9 6.86 12 6.6 12 7.36 11 429 9 230.5 12 393 12 260.5 10
5 6.9 27 6.46 46 6.63 46 6.96 44 397 27 179 46 391 46 410.5 40
6 6.95 21 6.49 24 6.68 24 7.06 20 492 20 218.5 24 397 24 424 18
7a 6.9 11 6.46 12 6.68 12 6.9 9 331 10 157 12 278 12 254 9
11a 6.84 9 6.3 11 6.89 12 7.16 10 170 9 111 11 175.5 12 212 10
12a 6.45 26 6.56 36 6.71 35 7.06 33 327 26 220.5 36 283 35 317 33
Physical/Chemical parameters Ð Median values Aquatic processing Ð Median values
Turbidity (NTU) Chlorophyll-a (μg/L)
Creek No. 04/05 n 05/06 n 06/07 n 07/08 n 04/05 n 05/06 n 06/07 n 07/08 n
1 12.6 24 15.7 42 10.8 43 11.7 40 6.5 24 3 41 5.5 48 2 44
2 31.4 15 10.9 33 14.4 33 5.2 28 25 15 9 33 4.5 34 10 32
3a 6.6 9 5 12 2.8 9 21.5 9 2 9 1 12 1 12 1 11
5 10.6 26 11.3 45 14.3 44 10.8 42 3 27 3 46 4 46 5.5 44
6 5.1 17 11.7 24 10 23 17.65 18 14 21 4 24 7.5 24 8.5 22
7a 23 11 10.75 12 21.85 12 13.5 10 10 11 4.5 12 15 12 9 11
11a 7.3 9 11.8 11 4.1 10 7 9 12 9 7 11 11 10 13 10
12a 9.35 26 8.85 36 7.45 30 7.89 29 12.5 26 7 36 9 35 5 33
52

Appendix 4Values for fish and macro-invertebrate data
Biotic parameters
No. macro-invertebrate taxa SIGNAL score PET score
Creek No. 04/05 05/06 06/07 07/08 04/05 05/06 06/07 07/08 04/05 05/06 06/07 07/08
Mainland
1 - - 18 - - - 3.7 - - - 1 -
2 33 40 38 39 3.7 3.8 3.6 3.7 3 4 4 3
5 28 39 31 32 3.2 3.7 3.5 3.6 1 3 2 2
6 21 28 34 30 3.4 3.5 3.3 3.1 1 2 1 1
8 - - 12 - - - 2.8 - - - 0 -
9 - - 13 - - - 3.5 - - - 0 -
11 21 25 28 31 3.9 3.7 3.6 3.7 3 3 3 2
12a 15 27 34 28 4.3 3.4 3.1 3.2 0 2 1 1
North Stradbroke Island
13a - - 5 - - - 4.4 - - - 0 -
13b - - 12 - - - 4.5 - - - 4 -
13c - - 11 - - - 4.5 - - - 3 -
13d - - 12 - - - 3.8 - - - 1 -
13e - - 13 - - - 4 - - - 3 -
13f - - * - - - * - - - * -
13g - - * - - - * - - - * -
13h - - 13 - - - 4 - - - 2 -
Biotic parameters
Number native fish species Proportion alien fish (%)
Creek No. 04/05 05/06 06/07 07/08 04/05 05/06 06/07 07/08
Mainland
1 - - 3 - - - 98 -
2 10 9 9 8 45 51 35 64
5 5 7 8 7 51 44 35 28
6 7 6 7 5 27 41 68 65
8 - - 3 - - - 2 -
9 - - 3 - - - 84 -
11 3 1 5 3 68 13 10 43
12a 5 7 8 6 81 76 85 63
North Stradbroke Island
13a - - 1 - - - 30 -
13b - - 3 - - - 0 -
13c - - 8 - - - 0 -
13d - - 3 - - - 90 -
13e - - 6 - - - 0 -
13f - - 1 - - - 13 -
13g - - 3 - - - 83 -
13h - - 5 - - - 55 -
*No edge habitat available for sampling
53

54

PO Box 21, Cleveland Qld 4163 phone 07 3829 8999 fax 07 3829 8765
For more information visit our website www.redland.qld.gov.au
This publication is printed on ENVI™ 50/50 Recycled Carbon-Neutral Paper. ENVI™ 50/50 Recycled is manufactured in Australia by Australian Paper and is certified Greenhouse Friendly™ by the Australian Government under the Department of Climate Change Greenhouse Friendly™ Initiative. ENVI™ pulp fibre is sourced via a recognised chain-of-custody certified scheme.
6390
04/
10 D
YN