redistricting 101 - sites@duke | sites.duke.edu
TRANSCRIPT

Moon Duchin
REDISTRICTING 101 METRICS FOR GERRYMANDERING

SETTING THE STAGE

GERRYMANDERING: THE POWER OF THE PEN
➤ We will see that you can produce extremely skewed outcomes by drawing designer districts
➤ Throughout: seek to distinguish neutral vs fair and set some bounds on permissibility
➤ How do our gerrymandering rules and metrics line up with political values?
➤ How are the most vulnerable/marginal populations harmed or protected?
Many lines to draw:
NC has 13 U.S. House districts
120 state House districts
50 state Senate districts

HOW TO GERRYMANDER WHEN PLURALITIES RULE
➤ Very simplest principle: to win a single district, arrange the placement of the lines to ensure you get most votes within the district.
➤ Famous example: Elbridge Gerry’s salamander gave us the term “gerrymander”
➤ Districting plan designed to favor Democratic-Republican party over Federalists
Tufts

HOW TO GERRYMANDER
➤ Suppose (a) you know exactly which people vote your way, and (b) you have total freedom to separate people into buckets arbitrarily.
Goal: win the most buckets.
➤ You’d make a narrow majority in as many buckets as possible and you wouldn’t waste voters in any others.
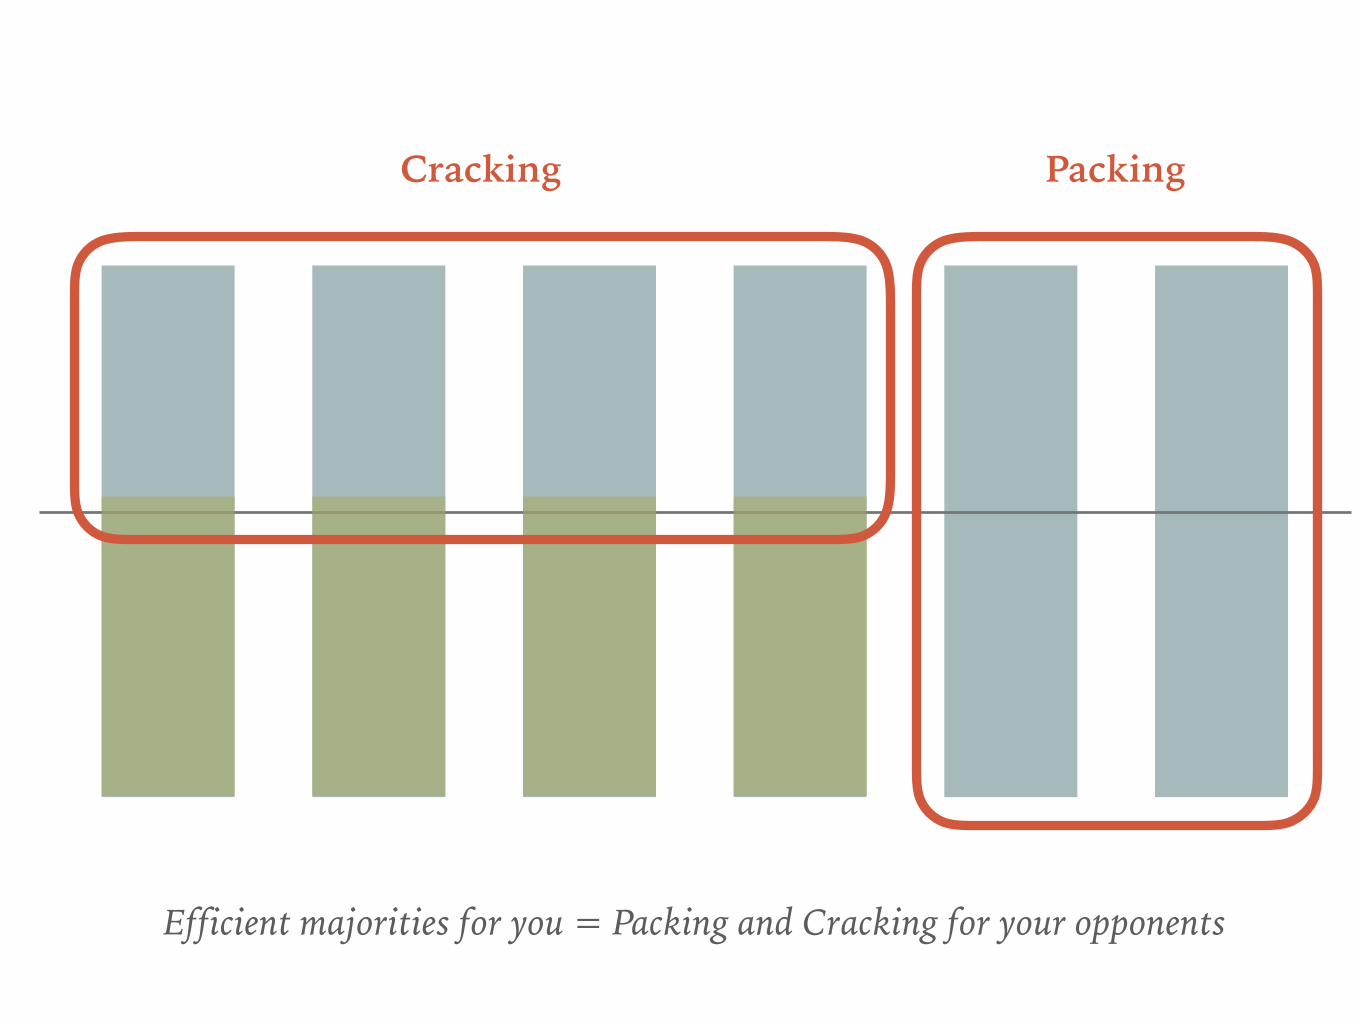
PackingCracking
Efficient majorities for you = Packing and Cracking for your opponents

WI: half the votes, 2/3 of seats
PA: half the votes, 70% of seats
➤ So theoretically it’s possible to get a seat share that is double your vote share, if you were unconstrained by geography. How does it actually play out?
➤ Key point: Rs now have 32/50 legislatures, 33/50 governors, and “trifectas” in 27/50 states.
➤ Was not always so, and both parties gerrymander rampantly when they can!

WHY DOES SHAPE MATTER?
➤ Any careful composition of demographics (such as packing/cracking) requires your pen to follow the distribution
➤ Limiting degrees of freedom limits the power of the pen
Neutral Both sides PackedPacked & Cracked
In these pictures, the two sides have an equal number of voters, but Team ★ can get all but one seat!
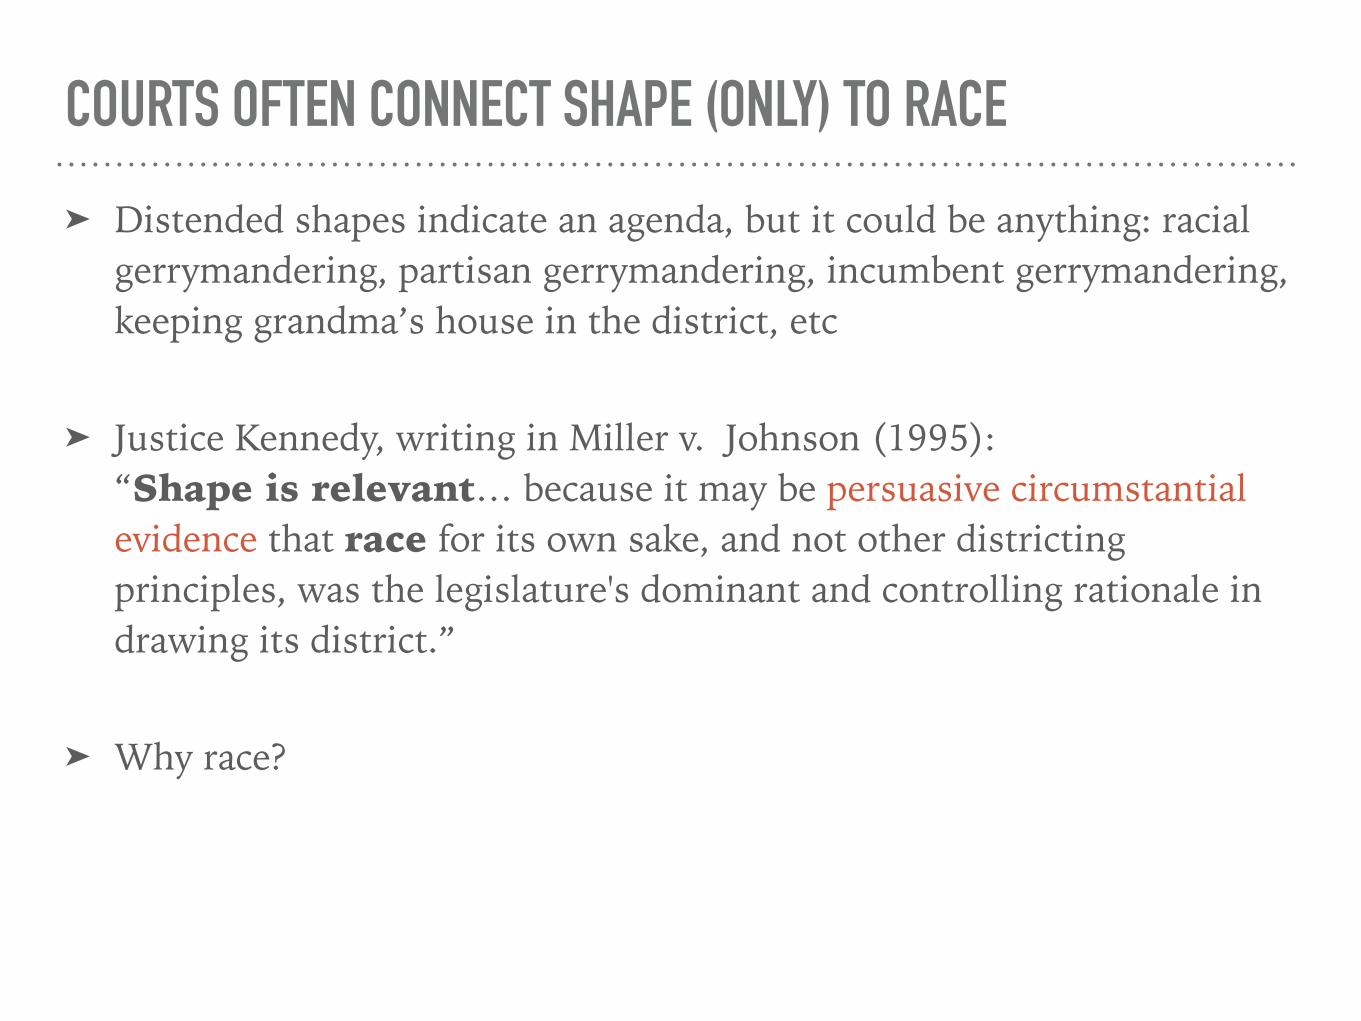
COURTS OFTEN CONNECT SHAPE (ONLY) TO RACE
➤ Distended shapes indicate an agenda, but it could be anything: racial gerrymandering, partisan gerrymandering, incumbent gerrymandering, keeping grandma’s house in the district, etc
➤ Justice Kennedy, writing in Miller v. Johnson (1995): “Shape is relevant… because it may be persuasive circumstantial evidence that race for its own sake, and not other districting principles, was the legislature's dominant and controlling rationale in drawing its district.”
➤ Why race?

MID-TWENTIETH CENTURY GERRYMANDERS OF NOTE
➤ Gomillion v. Lightfoot (1960)
➤ Tuskegee redrew its lines in 1957
After: 28-sided polygonBefore: square
Before: 79% BlackAfter: 100% White
red

MISSISSIPPI REDRAWS THE LINES
MS’s Black population is concentrated in Delta region in state’s Northwest
Delta traditionally preserved
Broken up in 1960s—zero majority-Black districts

RACE AND PARTY ENTWINED
➤ These days, pronounced “conjoined polarization” effects
➤ Race can be a very effective proxy for party preference, and vice versa

“SHAW LINE” AND BEYOND
➤ Court has derided “tortured,” “irregular,” “bizarre,” “irrational” shapes, and has thrown out maps on the basis of shape, when race is in the mix—but no standard
➤ Shaw v Reno, Bush v Vera, etc: on one hand, no standard; on the other, grumbling about “endless beauty contests” (!)
➤ We’re left with a muddle.


SO, WHAT ARE THE RULES?
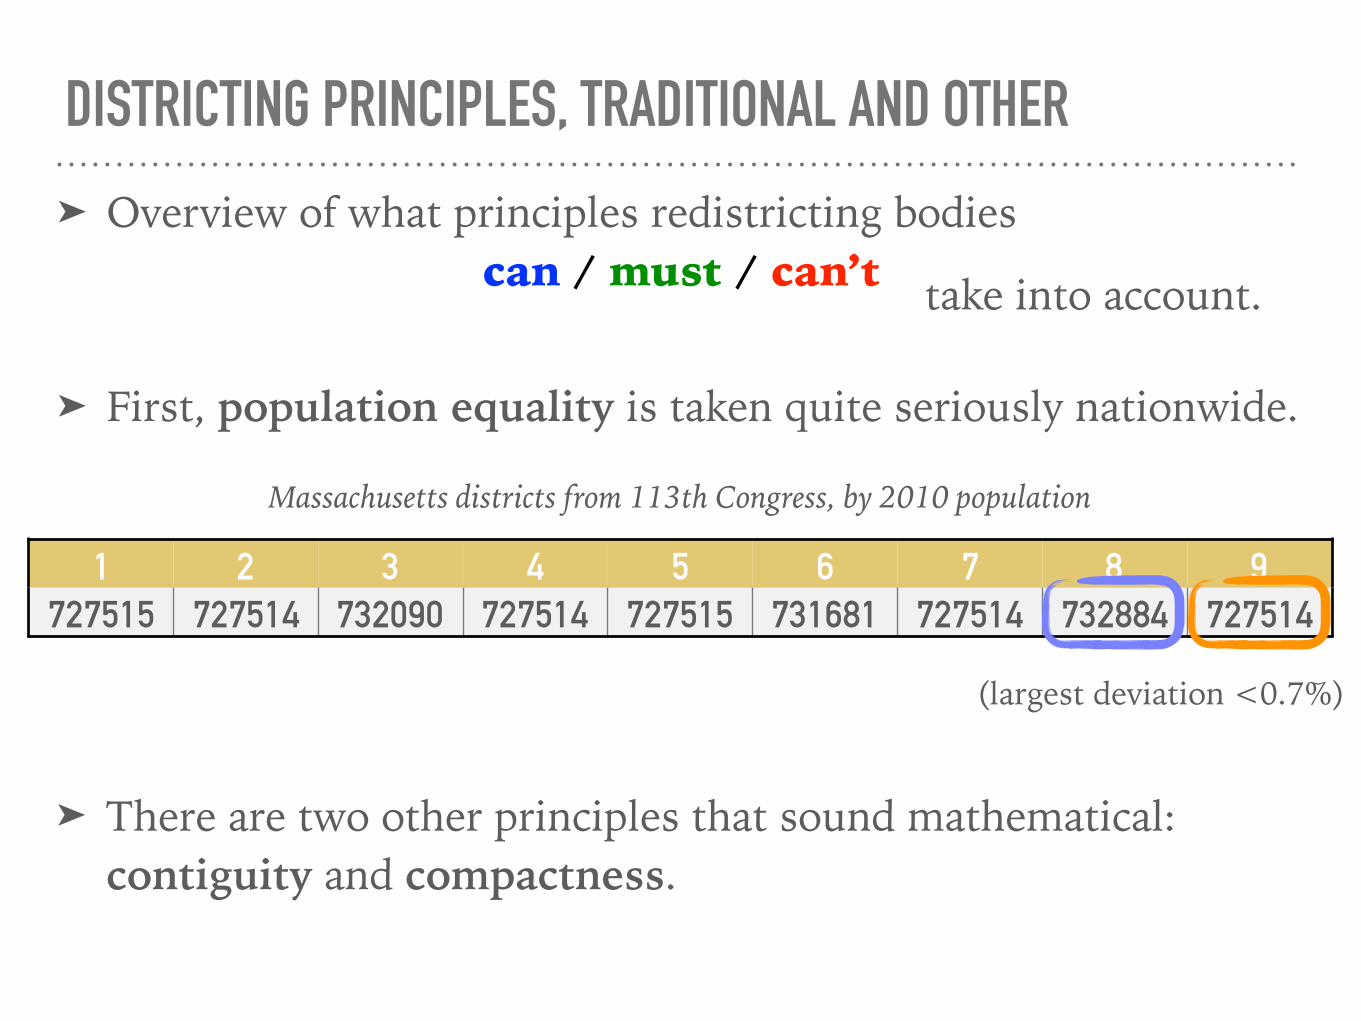
DISTRICTING PRINCIPLES, TRADITIONAL AND OTHER
➤ Overview of what principles redistricting bodies can / must / can’t
➤ First, population equality is taken quite seriously nationwide.
1 2 3 4 5 6 7 8 9727515 727514 732090 727514 727515 731681 727514 732884 727514
Massachusetts districts from 113th Congress, by 2010 population
(largest deviation <0.7%)
➤ There are two other principles that sound mathematical: contiguity and compactness.
take into account.
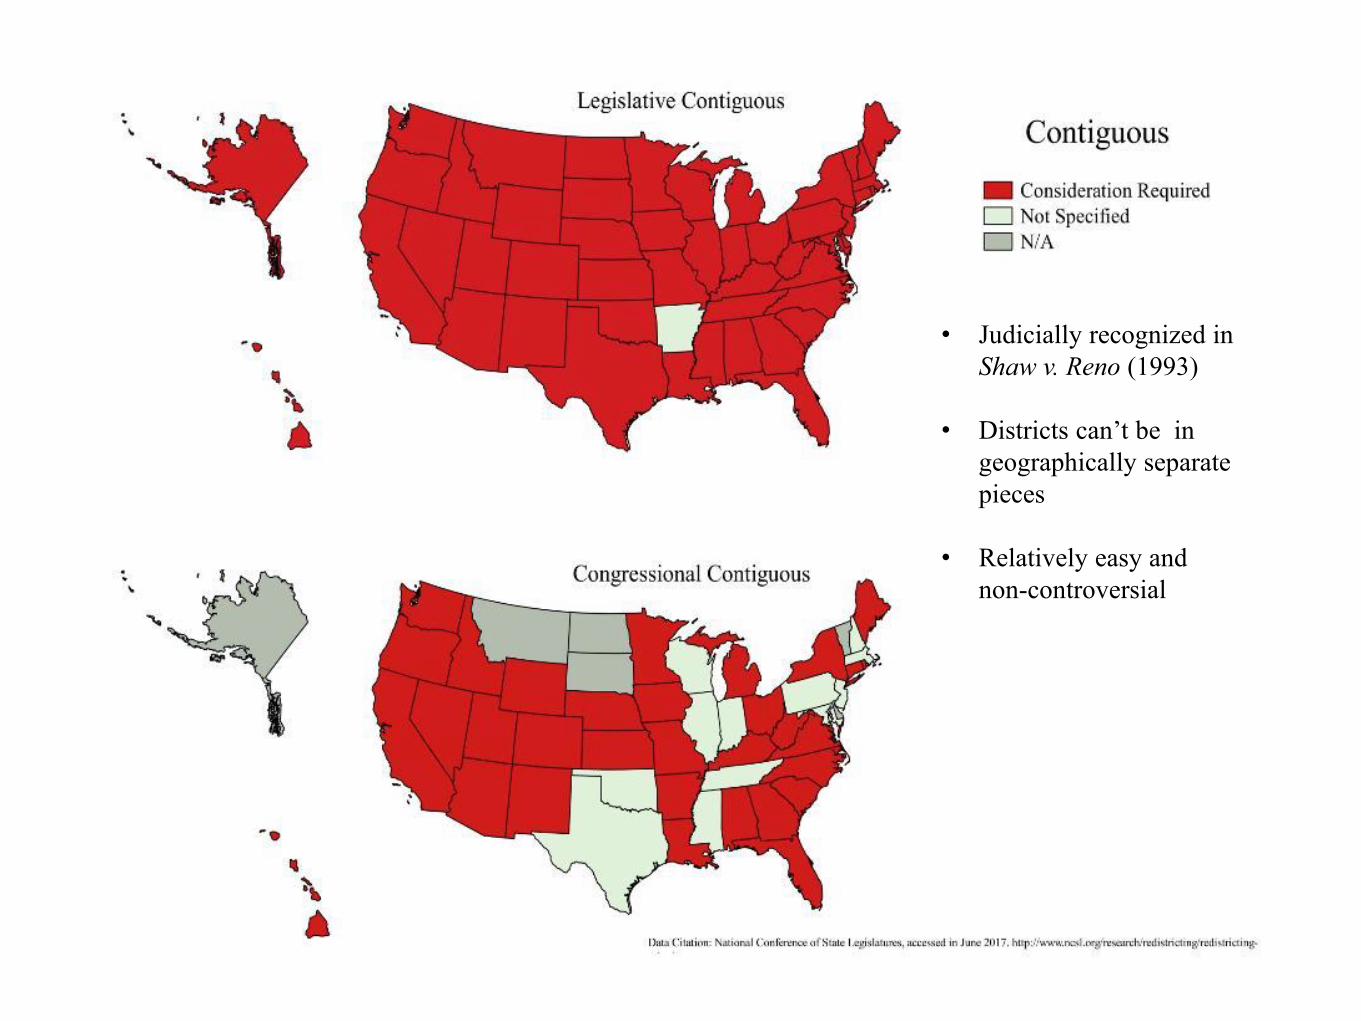
Contiguity map
• Judicially recognized in Shaw v. Reno (1993)
• Districts can’t be in geographically separate pieces
• Relatively easy and non-controversial

Compactness map
• Judicially recognized in Shaw v. Reno (1993)
• Geographic compactness
• Few jurisdictions define compactness

LESS MATHY-SOUNDING REQUIREMENTS
➤ There are three more widespread principles and then some scattered others.
➤ VRA: All states are bound by the federal Voting Rights Act of 1965, which takes minority representation into account.
➤ Political boundaries: avoid splitting cities/counties/towns.
➤ Communities of interest: keep them together when possible.
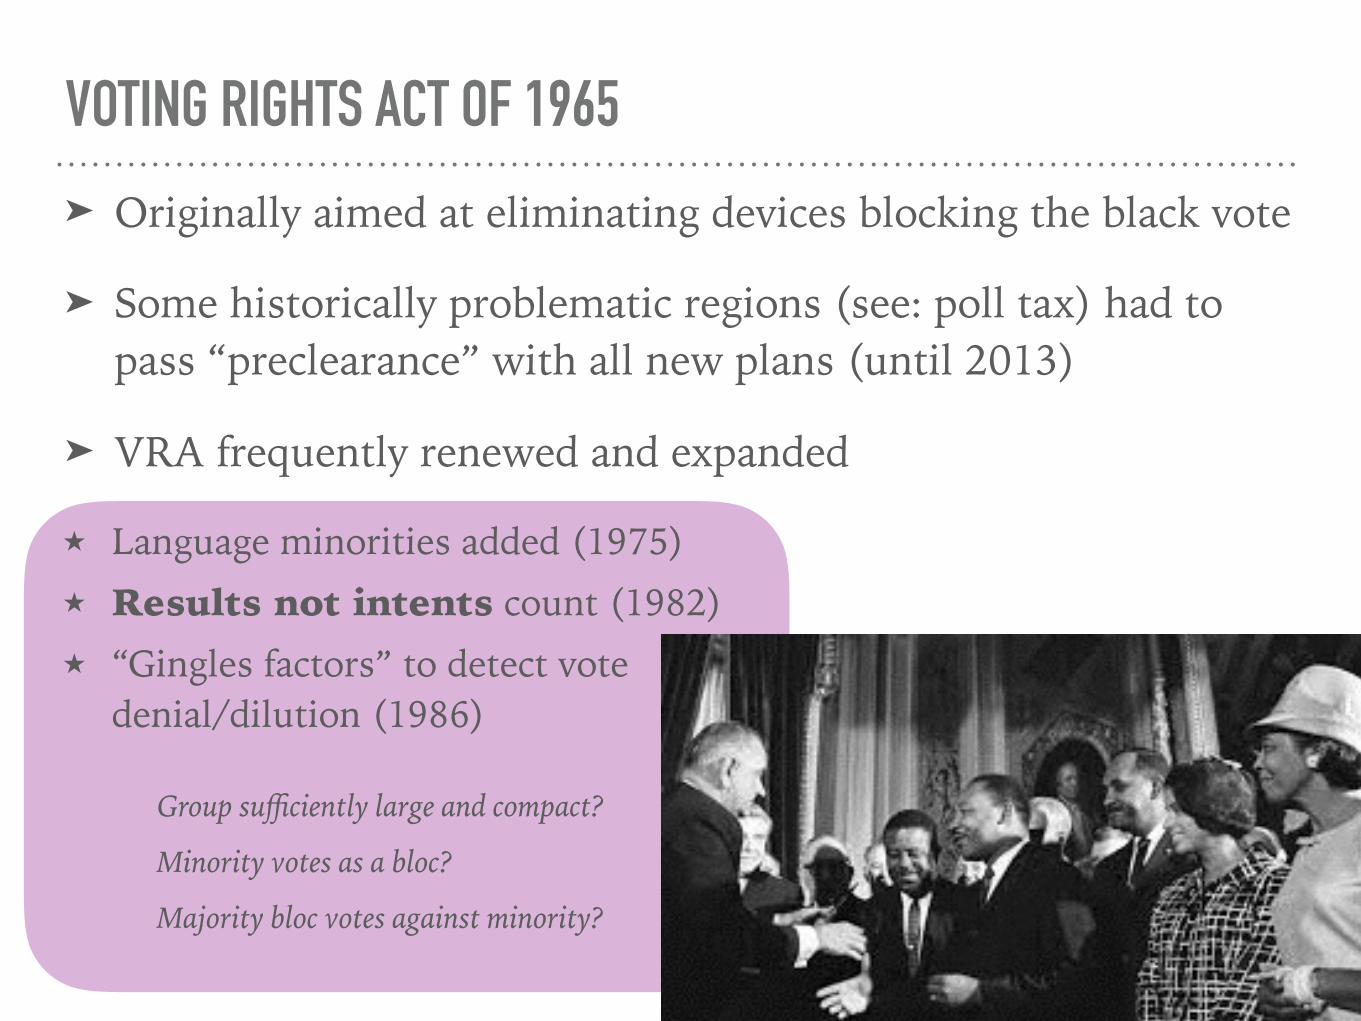
VOTING RIGHTS ACT OF 1965
➤ Originally aimed at eliminating devices blocking the black vote
➤ Some historically problematic regions (see: poll tax) had to pass “preclearance” with all new plans (until 2013)
➤ VRA frequently renewed and expanded
★ Language minorities added (1975) ★ Results not intents count (1982) ★ “Gingles factors” to detect vote
denial/dilution (1986)
Group sufficiently large and compact?
Minority votes as a bloc?
Majority bloc votes against minority?

Preservation of political boundaries map
• Judicially recognized in Shaw v. Reno (1993)
• Political boundaries, e.g. counties, cities, wards
• Not always clear cut
• Splitting jurisdictions
(maps made by NCSL and borrowed from Megan Gall, LCCR/NAACP LDF)
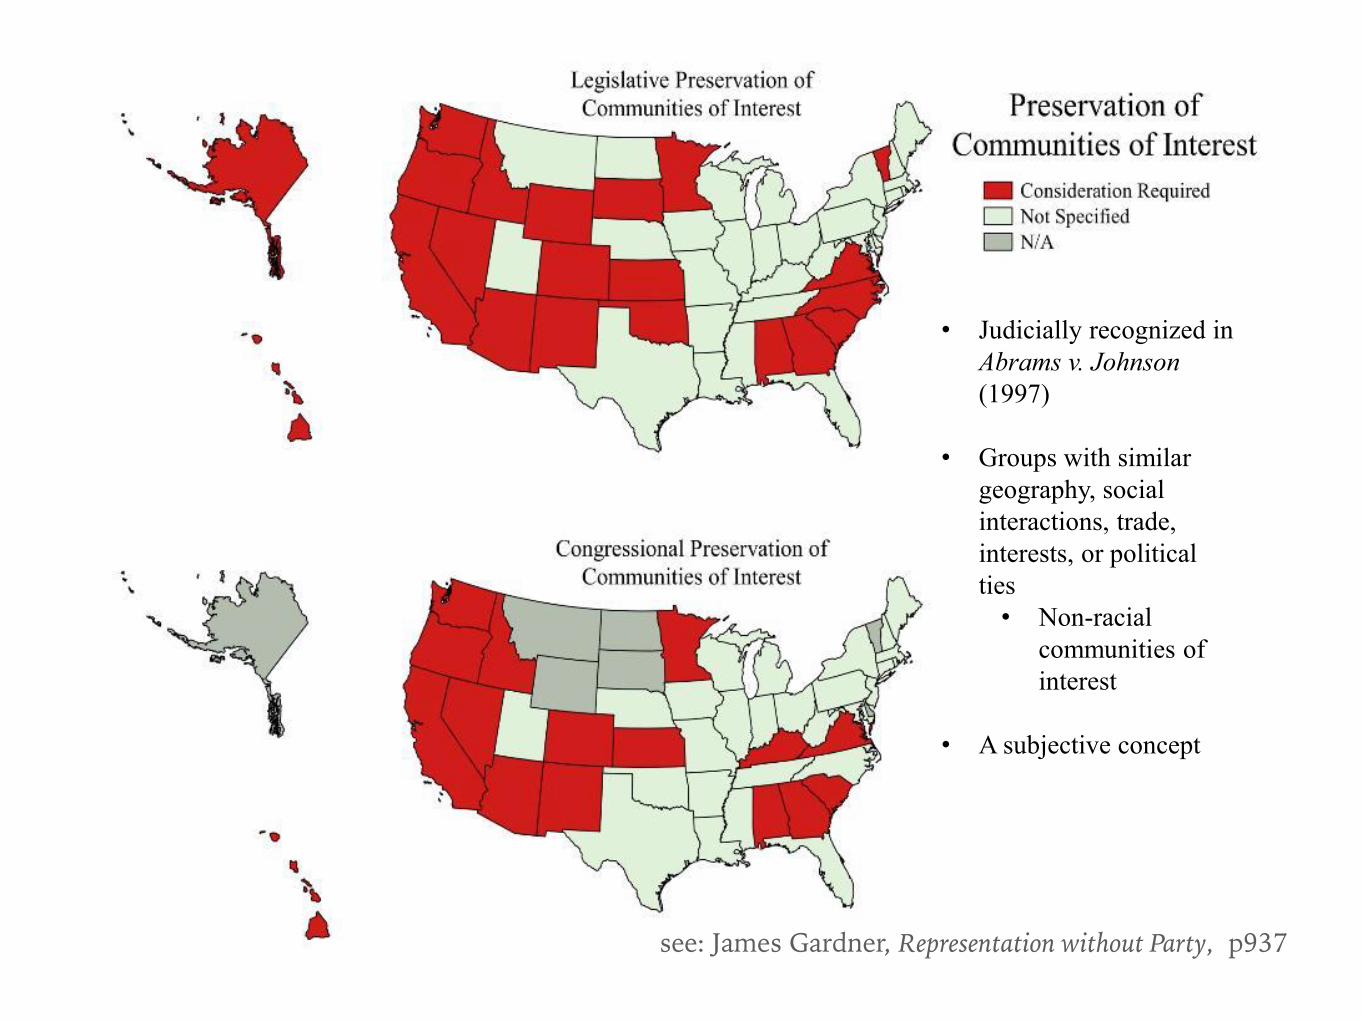
Presevation of COIs map
• Judicially recognized in Abrams v. Johnson(1997)
• Groups with similar geography, social interactions, trade, interests, or political ties
• Non-racial communities of interest
• A subjective concept
see: James Gardner, Representation without Party, p937

Presevation of district cores map
• Judicially recognized in Abrams v. Johnson (1997)
• Preserving prior district cores

• Judicially recognized in Abrams v. Johnson(1997)
• Exactly what it sounds like
• Only principle that is prohibited in some areas

LET’S TRY TO MEASURE COMPACTNESS
FOR STARTERS
HOW CAN WE MEASURE COMPLIANCE WITH THESE RULES?

HOW IS COMPACTNESS MEASURED?
➤ There are many metrics in the literature, mostly classifiable three ways:
★ isoperimetry - a measure of efficiency
๏ Polsby-Popper: A/P2 and variants ๏ total perimeter
★ convexity - a measure of indentedness
๏ Reock: compare to circumcircle ๏ compare to convex hull
★ dispersion - a measure of sprawl
๏ average distance between points ๏ moment of inertia
Louisiana House of Reps v. Ashcroft Martinez v. Bush Perez v. Perry Vesilind v. VA State Board of Elections Page v. Judd Sanders v. Dooly County Sessions v. Texas Session v. Perry U.S.v. County of Los Angeles Harris v. McCrory Johnson v. Mille Cromartie v. Hunt Moon v. Meadows
The City of Greensboro et al v. Guilford County Board of Elections Romo v. Detzner Missouri NAACP v. Ferguson-Florissant School District Whitford v. Nichol

ISOPERIMETRY / AREA VS. PERIMETER / POLSBY-POPPER
➤ Suppose you have a district of area A and perimeter P. You could create a score of the form A/P or A/P2.
➤ Why A/P2? It seems to protect you from scale effects; when you dilate a shape by a factor k, the perimeter is scaled by k and the area by k2, so this score is invariant.

RIGOROUS BOUNDS
Isoperimetric Theorem (Steiner 1838): For any shape with area A and perimeter P,
A/P2 ≤ 1/4π, with equality only for circles.
➤ So for any shape S, if we define C(S)= 400πA/P2, we get a nice statistic of shape efficiency, because
0 ≤ 400πA/P2 ≤ 100.

A RANGE OF ISOPERIMETRIC RATIOS
➤ This compactness score C(S)= 400πA/P2 works by comparing the area of a region by the area of a circle of the same perimeter.
➤ Idea: circles are the most efficient, so you’re dividing (actual area) by (max possible area). This gives you a percentage efficiency for any shape.


INDENTATION / CONVEXITY / REOCK
➤ Mathematically, a region is convex if it contains the line segment between any two of its points
➤ The convex hull is the “rubber-band enclosure”–smallest convex body containing the region
➤ Convex hull score: A(region)/A(conv hull)
➤ Reock score: A(region)/A(circumcircle)


SO, DOES IT WORK?
Pilsen (Mexican)
Humboldt Park (Puerto Rican)
highway
Packing!
…but it turns out to be friendly packing!

SO, DOES IT WORK?
Pilsen (Mexican)
Humboldt Park (Puerto Rican)
highway
Packing!
…but it turns out to be friendly packing!

STATES THAT DEFINE COMPACTNESS
➤ Arizona: map should begin with a “grid-like pattern”; some talk of the score A/P2
➤ California: “To the extent practicable… districts must also encourage compactness, defined by lines that do not bypass nearby population in favor of more distant population.”
➤ Colorado: sum the perimeter of all districts
➤ Michigan: “as compact as possible, measured by drawing a circle around the district, and assessing the area within the circle (and within the landmass of the state) but outside the district lines.”
➤ Montana: general appearance, and the degree to which it fosters "functional compactness" through "travel and transportation, communication, and geography."
(KINDA)
the only one concrete enough to score a plan

2017 CODE OF IOWA, SECTION 42.4, REDISTRICTING STANDARDS➤ Districts shall be reasonably compact in form, to the extent consistent with the standards
established by subsections 1, 2, and 3. In general, reasonably compact districts are those which are square, rectangular, or hexagonal in shape, and not irregularly shaped, to the extent permitted by natural or political boundaries. If it is necessary to compare the relative compactness of two or more districts, or of two or more alternative districting plans, the tests prescribed by paragraphs “a” and “b” shall be used.
➤ a.Length-width compactness. The compactness of a district is greatest when the length of the district and the width of the district are equal. The measure of a district’s compactness is the absolute value of the difference between the length and the width of the district. In general, the length-width compactness of a district is calculated by measuring the distance from the northernmost point or portion of the boundary of a district to the southernmost point or portion of the boundary of the same district and the distance from the westernmost point or portion of the boundary of the district to the easternmost point or portion of the boundary of the same district. The absolute values computed for individual districts under this paragraph may be cumulated for all districts in a plan in order to compare the overall compactness of two or more alternative districting plans for the state, or for a portion of the state.
➤ b.Perimeter compactness. The compactness of a district is greatest when the distance needed to traverse the perimeter boundary of a district is as short as possible. The total perimeter distance computed for individual districts under this paragraph may be cumulated for all districts in a plan in order to compare the overall compactness of two or more alternative districting plans for the state, or for a portion of the state.

SO WHAT IS COMPACTNESS?
➤ In practice, usually: “you know it when you see it”
➤ i.e., eyeball test
➤ e.g., Utah debuted redistrictutah.com to allow public creation of plans, listing compactness as a requirement… In practice, committee simply tossed maps that looked bad.
outcome? current map looks fine… but splits SLC four ways!
Dems got 33% of 2016 Congressional vote and 0/4 seats—cracking

A CLOSER LOOK AT ISOPERIMETRY

THINKING ABOUT THE “GUTS” OF A DISTRICT
➤ What is the right abstraction to capture the relevant information? (i.e., what object should we study?)
➤ The census data comes in discrete units: census blocks (0-100 people), block groups (600-3000), and tracts (1200-8000)
➤ Could break down a state into its census units, form graph to see the guts of a state and its district plan
Q: What are the edges… adjacency? distance/travel time? commonalities?
(Perhaps all squares are not created equal)

➤ Census data comes in blocks, block groups, and tracts
➤ Tracts typically have 4000 people; NC has 2195 tracts
➤ This graph shows one vertex for every tract in NC, with edges between tracts that share a border
BUILDING A CENSUS-DATA GRAPH

THE GRAPH “SEES” MORE POLITICALLY RELEVANT DATA
DurhamWinston-Salem
Charlotte
Greensboro
Discrete perimeter? Curvature?
Clustering?

WHAT CAN YOU DO WITH A GRAPH?
➤ Use discrete/coarse definitions of area and perimeter, counting area as the total number of nodes and perimeter as the number of boundary nodes
A=n2, P=4n-4
A/P2 → 1/16
A=3n2-3n+1, P=6n-6
A/P2 → 1/12
➤ Behaves well under refinement if the pattern is stable

DISCRETIZED POLSBY-POPPER
➤ Current project with Bridget Tenner: compare discrete A/P2 to classical
➤ Discrete score lightens coastline penalty
➤ Better protects from scale effects
➤ Weights perimeter heavily as it cuts through cities

THE ROLE OF TECHNOLOGY

RICH DATA, AD HOC METHODS
➤ We have incredible descriptive and predictive data, plus the ability to overlay it on spatial “shapefiles”
➤ But maps are still built by hand
➤ What is the baseline?

CAN’T WE JUST AUTOMATE?
➤ Algorithms can take into account: population equality, contiguity, compactness. Can even try to optimize.
➤ Can handle county splits with a score, but communities of interest? Racial fairness? Tradeoffs in priorities among competing norms?
“Blue Waters meets Maxine Waters”
source: Cohen-Addad–Klein–Young
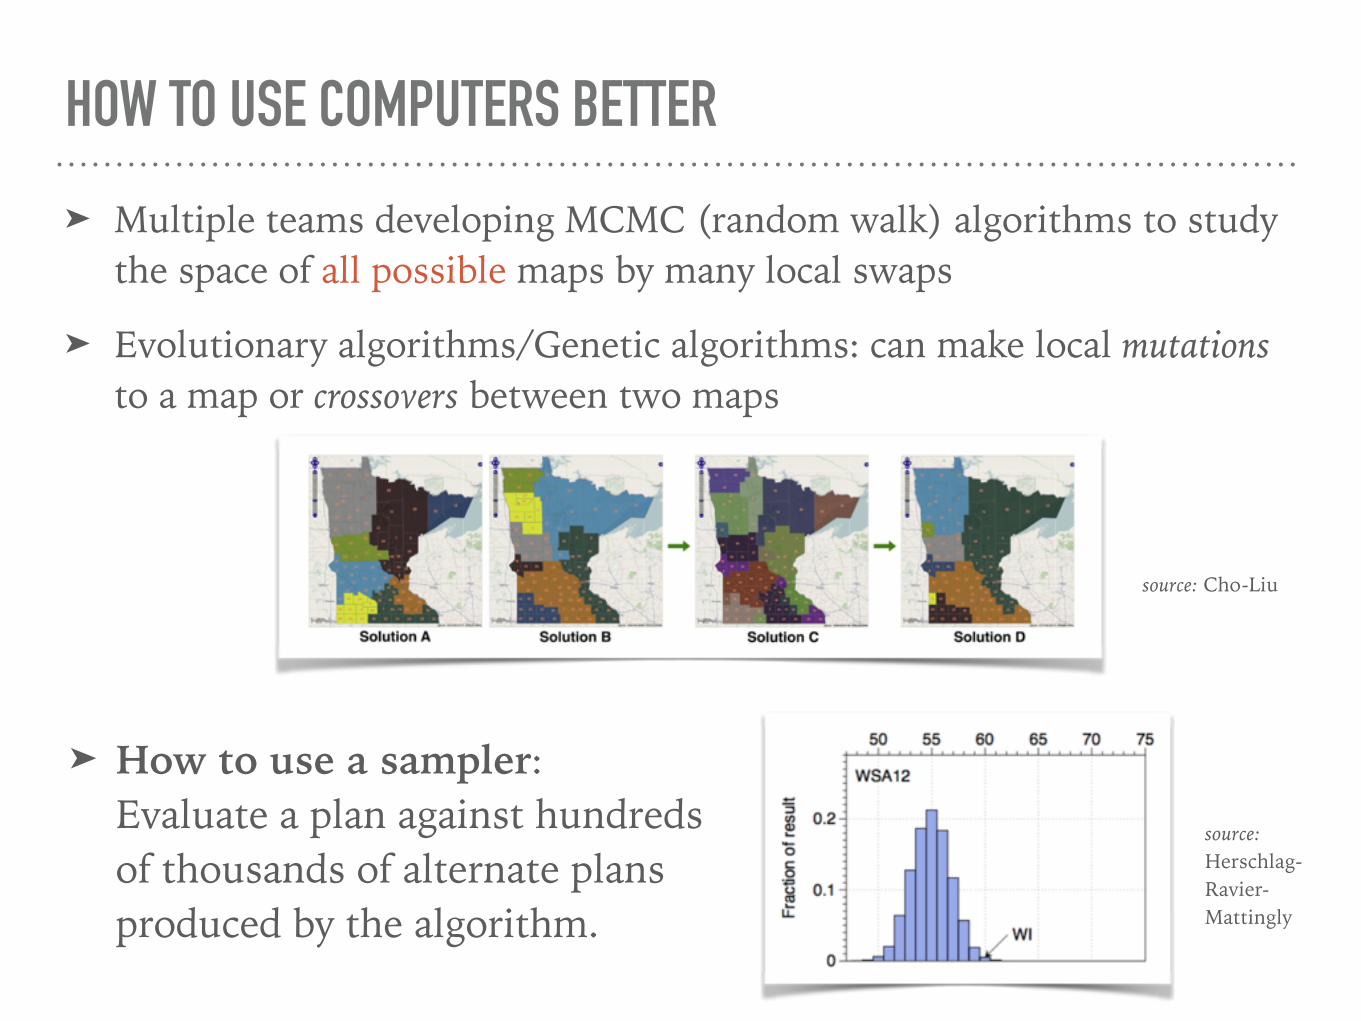
HOW TO USE COMPUTERS BETTER
➤ Multiple teams developing MCMC (random walk) algorithms to study the space of all possible maps by many local swaps
➤ Evolutionary algorithms/Genetic algorithms: can make local mutations to a map or crossovers between two maps
source: Cho-Liu
➤ How to use a sampler: Evaluate a plan against hundreds of thousands of alternate plans produced by the algorithm.
source: Herschlag-Ravier- Mattingly

SAMPLING AND OUTLIER ANALYSIS
➤ How to use a sampler: Evaluate a plan against hundreds of thousands of alternate plans produced by the algorithm.
source: Herschlag-Ravier- Mattingly

WHAT IS THE SHAPE OF THE SPACE OF MAPS?
➤ Rugged? Smooth? Disconnected? Depends on constraint choices.
➤ Climb hills or explore blindly?
➤ Can we characterize the sampling distribution?
➤ Are the sampled plans neutral? fair? reasonable? …
Looking for a good practical math problem? Start here!

THANK YOU!visit
sites.tufts.edu/gerrymandr to find out more about the
Metric Geometry and Gerrymandering Group
and come talk math nitty gritties tonight 7-8:30pm
in the Math Department (Physics Building)