redalyc.integrated modeling of water quantity and quality in the
TRANSCRIPT

Latin American Journal of Aquatic Research
E-ISSN: 0718-560X
Pontificia Universidad Católica de Valparaíso
Chile
Salla, Marcio Ricardo; Paredes-Arquiola, Javier; Solera, Abel; Álvarez, Joaquín Andreu; Pereira,
Carlos Eugênio; Alamy Filho, José Eduardo; De Oliveira, André Luiz
Integrated modeling of water quantity and quality in the Araguari River basin, Brazil
Latin American Journal of Aquatic Research, vol. 42, núm. 1, marzo, 2014, pp. 224-257
Pontificia Universidad Católica de Valparaíso
Valparaiso, Chile
Available in: http://www.redalyc.org/articulo.oa?id=175030002019
How to cite
Complete issue
More information about this article
Journal's homepage in redalyc.org
Scientific Information System
Network of Scientific Journals from Latin America, the Caribbean, Spain and Portugal
Non-profit academic project, developed under the open access initiative

Integrated modeling in the Araguari River basin, Brazil 1
Lat. Am. J. Aquat. Res., 42(1): 224-244, 2014 DOI: 103856/vol42-issue1-fulltext-19
Research Article
Integrated modeling of water quantity and quality in the Araguari River basin, Brazil
Marcio Ricardo Salla1, Javier Paredes-Arquiola2, Abel Solera2, Joaquín Andreu Álvarez2 Carlos Eugênio Pereira1, José Eduardo Alamy Filho1 & André Luiz De Oliveira1
1Faculdade de Engenharia Civil, Universidade Federal de Uberlândia, Brasil 2Instituto de Ingeniería del Agua y Medio Ambiente, Universidad Politécnica de Valencia España
ABSTRACT. The Araguari River basin has a huge water resource potential. However, population and industrial growth have generated numerous private and collective conflicts of interest in the multiple uses of water, resulting in the need for integrated management of water quantity and quality at the basin scale. This study used the AQUATOOL Decision Support System. The water balance performed by the SIMGES module for the period of October 2006 to September 2011 provided a good representation of the reality of this basin. The parameters studied were dissolved oxygen, biochemical oxygen demand, organic nitrogen, ammonia, nitrate and total phosphorus. The coefficients of biochemical reactions, sedimentation rates and sediment dissolved oxygen release for this period were calibrated and validated in the quality modeling using the GESCAL module. A sensitivity analysis indicated that the coefficients of carbonaceous matter decomposition, nitrification, water temperature, and sediment oxygen demand interfered more significantly in the variables of state. To prevent eutrophication in the Nova Ponte reservoir and in the other cascade reservoirs, the local River Basin Committee should adopt restrictive actions against the use of agricultural fertilizers. On the other hand, in the sub basin of the Uberabinha River, new alternatives for public water supply to the city of Uberlândia and improvements in the treatment efficiency of the main wastewater treatment plant (WWTP) should be proposed, since the biochemical oxygen demand, ammonia and total phosphorus failed to meet the requirements of COPAM (2008) in the driest months. Keywords: water, modelling, AQUATOOL, Araguari River, basin, Brazil.
Modelación integrada de cantidad y calidad del agua en la
cuenca del río Araguari, Brasil
RESUMEN. La cuenca del río Araguari tiene un enorme potencial de recursos hídricos. Sin embargo, la población y crecimiento industrial han generado numerosos conflictos de interés, privados y colectivos, en los usos múltiples del agua, dando lugar a la necesidad de una gestión integrada de la cantidad y calidad del agua a nivel de la cuenca. En este estudio se utilizó el Sistema de Soporte de Decisión AQUATOOL. El balance hídrico realizado por el módulo SIMGES, para el período de octubre 2006 a septiembre 2011 proporcionó una buena representación de la realidad de esta cuenca. Los parámetros estudiados fueron el oxígeno disuelto, demanda bioquímica de oxígeno, nitrógeno orgánico, amonio, nitrato y fósforo total. Los coeficientes de las reacciones bioquímicas, tasas de sedimentación y demanda de oxígeno disuelto del sedimento para este período fueron calibrados y validados en la modelación de calidad del agua, mediante el módulo GESCAL. El análisis de sensibilidad indica que los coeficientes de degradación de la materia orgánica, nitrificación, temperatura del agua y demanda de oxígeno del sedimento interfirieron más significativamente en las variables de estado. Para evitar la eutrofización en el embalse de Ponte Nova y en el resto de los embalses en cascada, el Comité Local de la Cuenca del Río debería adoptar medidas restrictivas contra el uso de fertilizantes agrícolas. Por otra parte, en la subcuenca del Río Uberabinha, nuevas alternativas para el suministro público de agua a la ciudad de Uberlandia y mejoras en la eficiencia del tratamiento de la principal Estación Depuradora de Aguas Residuales (EDAR) deben ser considerados, ya que la demanda bioquímica de oxígeno, amonio y fósforo total no han cumplido con los requisitos de la COPAM (2008) en los meses con más sequías. Palabras clave: agua, modelación, AQUATOOL, cuenca río Araguari, Brasil.
___________________ Corresponding author: Marcio Ricardo Salla ([email protected])
224
2 Latin American Journal of Aquatic Research
INTRODUCTION
In developing countries, such as Brazil, which lack financial resources for basic sanitation and proper wastewater treatment, the problem of dissolved oxygen consumption in waterways after wastewater has been discharged into them is still significant, justifying the use of the assimilative capacity of waterways to complement the treatment process. Sustainable development and rational water use require the existence of a proper relationship between water quantity and quality. In this context, joint mathematical modeling allows for the diagnosis and prediction of impacts resulting from multiple water uses and the discharge of pollutant loads.
Numerous researchers have designed a variety of models and Decision Support Systems (DSS) that are useful for water resource planning and management at the basin scale. It is well known that the main focus of computational tools is quantitative water resource management and planning, considering the increasing demands and need to implement optimal rules for the operation of water resources. In this context, with different mathematical complexities, the main quantity models that stand out are: HEC-HMS (Klipsch & Hurst, 2007; Fan et al., 2009) and the MIKE SHE (McMichael et al., 2006) models, designed to simulate the precipitation-runoff processes of watershed systems which integrate all the important processes of the hydrologic cycle at catchment scale. HEC-ResSim and WRAP (Wurbs, 2005) models are used to model reservoir operations at one or more reservoirs and the interactions with rivers. MODFLOW (Rodriguez et al., 2008; Xu et al., 2012) and IRAS (Salewicz & Nakayama, 2004; Matrosov et al., 2011) models are used to simulate flow of groundwater through aquifers interactive river-aquifer simulation. However, envi-ronmental concerns regarding water quality at the basin scale, driven by the continuous discharge of domestic and industrial wastewater, have led to the design of increasingly complete water quality models (De Paula, 2011). These models have been in use since the development of Streeter & Phelps’s classical model (Streeter & Phelps, 1925), which is a benchmark in the history of sanitary and environ-mental engineering. Several other models have been designed with increasing complexity and number of modeled variables. Those models can be used to simulate different water quality problems. For example, while the Qual2E model (Palmieri & De Carvalho, 2006; Chapra, 2008) and its updated version Qual2K model (Von Sperling, 2007; Chapra et al., 2008; De Paula, 2011) are used to model water quality in river and stream, WASP model (Lai et al., 2012;
Zhang & Rao, 2012; Yenilmez & Aksoy, 2013) has been used to examine eutrophication in lakes or streams and heavy metal pollution in rivers. AQUATOX model (Mamaqani et al., 2011; McKnight et al., 2012) is a valuable tool in ecological risk assessment for aquatic ecosystems.
This brief review reveals the marked existence of river and reservoir water quality models that are not linked with any DSS in the quantitative management and planning of water resources. According to Paredes-Arquiola et al. (2010a), many scientific researches disregard the interactions between qualitative and quantitative aspects in water resource management at the basin scale. Due to this situation, many researchers around the world, e.g., Dai & Labadie (2001), Paredes & Lund (2006), Argent et al. (2009), Zhang et al. (2010), Paredes-Arquiola et al. (2010a, 2010b), Zhang et al. (2011), Sulis (2013) and Welsh et al. (2013), are focusing on relating water quality within a DSS in water management at a basin scale.
According to the State Environmental Foundation, the state of Minas Gerais has the highest water resource potential in Brazil and accounts for the generation of 18.5% of all the electricity produced in the country. Nevertheless, there is a lack of scientific research on the integrated management of water quantity and quality at the basin scale. Many water resource management proposals have been put forward by local river basin committees. However, these proposals are not underpinned by integrated studies of water quantity and quality in lentic and lotic environments, but instead focused only on the implementation of quantitative and qualitative telemetric information systems, on user registration and updating, on the creation of criteria for granting water rights, on charging for the use of water and on payment to the surrounding municipalities, watercourse guidelines, conflict prognosis between demands and capacities, and the creation of environmental protec-tion units.
In this context, based on the AQUATOOL Decision Support System (DSS), this article presents an integrated modeling of water quantity (using the SIMGES module) and quality (using the GESCAL module) of the three main watercourses of the Araguari River basin (Araguari, Quebra-Anzol and Uberabinha rivers). Based on water flow and water quality data monitored by the National Water Agency (ANA), the Minas Gerais Water Management Institute (IGAM) and the Minas Gerais Electric Company (CEMIG), this article presents the results of the water balance and calibration of the water quality model for the period of October 2006 to September 2009, and its validation for the period of October 2009 - September
225
Integrated modeling in the Araguari River basin, Brazil 226
2011. The calibration and validation of the bioche-mical reaction coefficients, sedimentation rates and sediment oxygen demand will serve as a basis for future studies on quantitative or qualitative interven-tions in this basin.
The coefficients that are part of the natural self-purification process of a watercourse, be it lentic or lotic, have distinct influences on the final water quality in the water system. Thus, using the factor model, this study performed a sensitivity analysis of the four main coefficients of biochemical reactions involved in the modeling (the re-aeration coefficient Ka, decomposition coefficient of CBOD Kd, coeffi-cient of decomposition of organic nitrogen KNoa, and coefficient of ammonia nitrification KNai), of the water temperature (Temp) and the sediment oxygen demand (SOD).
MATERIALS AND METHODS
AQUATOOL DSS There are few computational tools or models that simulate water quality linked to quantity at a basin scale. Andreu et al. (1996) developed a DSS called AQUATOOL, which is an interface for editing, simulating, reviewing and analyzing basin management simulation models, including a lentic and lotic water quality simulation module, that is widely used in Europe, Africa, Asia and Latin America (Paredes-Arquiola et al., 2010a, 2010b; Nakamura, 2010; Sulis & Sechi, 2013).The GESCAL and SIMGES modules are intercon-nected, sharing georeferenced quality and quantity data through a graphical interface (Paredes-Arquiola et al., 2010a). Thus, hypothetically considering a basin with multiple and transient uses, water quality can be simulated for any simulated outfall, recharge and environmental flow scenario.
SIMGES module In this study, the quantitative water management module SIMGES was used in the water balance model in the Araguari River basin. In this water balance was considered the flow in rivers and reservoirs at the basin scale, based on the spatial and quantitative definition of outfalls (point wise outfall for irrigation, industries and human consumption). Simulations were performed by means of a network flow optimization algorithm, which controls the surface flow within the basin while aiming to minimize the deficits and maximize the liquid levels in reservoirs to meet irrigation, human consumption and hydropower demands.
GESCAL module In order to simulate water quality linked to quanti-tative management in lentic and lotic environments previously defined in the SIMGES module, Paredes-Arquiola et al. (2009) developed the water quality module GESCAL. Although GESCAL allows modeling eutrophication, temperature, toxics and conventional contaminants, in our case, due to the lack of data and planning purpose of the study, the contaminants modeled were DO, CBOD, organic nitrogen, ammo-nia, nitrate and total phosphorus. In the modeling process adopted in this study, the relationship between nitrogen cycle and carbonaceous organic matter and the effect on dissolved oxygen, and total phosphorus as an arbitrary parameter was considered, according to the scheme illustrated in Fig. 1.
Study area: Araguari river basin The Araguari River basin (Fig. 2) is located in the western region of the state of Minas Gerais, Brazil (18°20’-20°10’S, 46°00’-48°50’W). Headwaters are located in Serra da Canasta National Park, in the municipality of São Roque de Minas, covering 475 km to its mouth in the Parnaíba River (which is a tributary of the Grande River, that belongs to Transnational Paraná River basin). This basin covers an area of approximately 22,000 km2, with altitudes ranging from 465 m to 1,350 m and rainfall exceeding 1600 mm year-1. The weather condition is warm, with the dry season between May and September and a wet season between October and April (Rosa et al., 2004). It has a resident population of approximately 1.2 million, distributed in 18 municipalities, 14 of which discharge their wastewater into the basin (Fig. 2). Only the municipalities of Araxá, Nova Ponte, Patrocínio and Uberlândia (which accounts for approximately 70% of the total population in the basin) have wastewater treatment plants (WWTPs), while the other 10 municipalities discharge their untreated wastewaters directly into the surface water bodies. According to the IGAM, surface and groundwater demands allocated in 2006 for human consumption, irrigation, industry, and livestock watering were 250.6 and 3.6 hm3 year-1, respectively.
This basin has six hydroelectric power stations (HP), the four largest ones located on the Araguari River with cascade reservoirs (Fig. 2). The first one, situated on the upper Araguari River, is a regulation reservoir with a storage capacity of 12,792 hm3 (Nova Ponte HP), while the other three reservoirs, located on the lower Araguari River, are trickle reservoirs (from up to downstream, Miranda HP, Capim Branco HP 1, and Capim Branco HP 2). There are also two small hydroelectric power stations (SHP) situated on the

4 Latin American Journal of Aquatic Research
Figure 1. Relationship among the modeled quality parameters.
Figure 2. Location of the Araguari river basin (18°20’-20°10’S, 46°00’-48°50’W).
Uberabinha River (Martins SHP and Malagone SHP). However, in the 2006-2011 period they had not yet entered into production that, for modeling purpose, make us to consider this region as a simple river segment.
In the 1980s, the joint effect of economic valuation of soybeans and the scientific discovery of suitability of the crop to the soil of the Araguari River,
transformed the region through the practice of a modern agriculture, associated with the intensive use of phosphate fertilizers and agrochemicals. Also, the presence of phosphate rocks in the region contributes to the existence of that nutrient from their natural deposits (EPE, 2006; Rosolen et al., 2009; Flauzino et al., 2010; Danelon et al., 2012). Figure 2 shows that the basin may be divided into 18 sub basins, whose
Norg
NH
NO3‐
4+DO
PTotal
CBOD
Mineralization
Nitrification
DenitrificationDegradation
Re aerationSOD
Sedimentation
Degradation
Sedimentflux
227

Integrated modeling in the Araguari River basin, Brazil 5
main economic activities are agriculture, aquaculture, farming, mining, power generation, manufacturing, agribusiness and tourism.
Quantity modeling The initial procedure in the quantity modeling was to outline the topology of the model using AQUATOOL, which basically corresponds to the situational diagram of the Araguari River basin, including the unscaled elements of the model, as illustrated in Figure 3. To improve visualization, the elements that represent the smaller tributaries and the diffuse distribution along the Quebra-Anzol, Araguari and Uberabinha rivers were removed from Figure 3.
In the quantity and quality modeling processes, the three main watercourses of this basin (Araguari, Quebra-Anzol and Uberabinha rivers) were divided into 20 segments, each of which was identified by a numbered node upstream and another numbered node downstream (Fig. 3).
Data input Based on the water flow data monitored by the National Water Agency and the Minas Gerais Electric Company (Fig. 2), a text file was arranged containing the model’s quantity input data for the calibration and validation periods. According to Figure 3, all the tributaries and point wise discharges of domestic wastewater with and without the wastewater treatment plant (WWTP) are identified as inputs.
Quebra-Anzol and Araguari rivers The quantity data of the upper Araguari River and upper Quebra-Anzol River were used directly as input data in the simulation. However, the diffuse and point wise inputs from the other tributaries were obtained from the specific outfall in m3 s-1 km-2 (Eq.1), taking into account the existing quantity data of the upper Araguari and Quebra-Anzol rivers and of the four cascading hydroelectric plants (data on turbine flow, downstream flow and volume variations in the reservoir, which enabled the flow upstream from each hydropower plant to be estimated).
( )
⎥⎥⎦
⎤
⎢⎢⎣
⎡ −=
∑ in
upstreamdownstreami A
AQQ
Q (1)
where: Qi = inflow i Qupstream = flow at any point upstream Qdownstream =flow at any point downstream from the inflow Qi;
An = total area between two monitoring stations, Ai = area contribution of the inflow i, obtained by means of a GIS tool that enables the simultaneous acquisition of the area from the perimetral outline.
Uberabinha River Existing data for the upper Uberabinha River were used directly as input data in the simulation of the model. The absence of water flow data from the mouth of this sub basin and from the two small hydroelectric plants precluded the use of the specific discharge method to estimate the diffuse and point wise flow rates. Thereby a specific rainfall-runoff model is needed for the water balance in this sub basin.
The curve number method (CN) for urban sub basins was used in our study (SCS, 1986). This is a distributed model widely accepted worldwide due to the reduced number of parameters and their relationship with the physical characteristics of the basin (Tucci, 2005; Rezende, 2012).
The HBV model developed by Bergström (1995) was used for the rural sub basins. This is a semi-distributed model that is part of a range of models which use the most important surface runoff processes by means of a simple structure and with a reduced number of parameters. The model functions on a daily or monthly time scale and uses precipitation, ground-level air temperature and average monthly evapo-transpiration as input data (Hundecha & Bárdossy, 2004; Das et al., 2006). Detailed descriptions of the equations used in the HBV model are given by Bergström (1995) and Paredes-Arquiola et al. (2011).
The parameters of the HBV model were calibrated using the evolutionary algorithm for calibration, SCE-UA (Shuffled Complex Evolution method, University of Arizona) (Duan et al., 1992). To this end, the results of the time series of surface flow obtained from the HBV model were compared with the existing time series of surface flow in the upper Uberabinha River. Self-calibration was performed adapting the original code of the SCE-UA algorithm from Duan et al. (1992) and reprogrammed in a Visual Basic platform. Each assessment of the objective function implies the execution of the HBV model. This algorithm has been used successfully to solve nonlinear problems in various applications of hydrological models at the basin scale (Paredes-Arquiola et al., 2011).
In our study, the model was applied to the sub basin corresponding to the single water flow moni- toring station existing in the upper Uberabinha River (Fig. 2), whose area of contribution is 801.6 km2. Due to the similarity of climate, geology, land use and
228

6 Latin American Journal of Aquatic Research
1516
173
4
5
6
7
9
10
1112
1
2
1819
20
821
13
IbiáSerra do Salitre
Patrocínio
PerdizesPedrinópolis
Santa Juliana
Nova Ponte
Tapuirama
Indianópolis
Uberlândia 1
Uberlândia 3
Uberlândia 2
6
WWTP – Wastewater Treatment Plant
InfluentHBV rain - flow method
Pointwise outflow
Consumption requirements
Hydroelectric demand
Downstream flow
Hydropower plant
Reservoir
Node limits in the river segment
Node
End node
River segment
14
Nova Ponte
Miranda
Capim Branco 1
Capim Branco 2
Martins
Malagone
Uberabinha river
Araguari river
Araguari river Quebra-Anzol river
Araxá
Tapira
Untreated wastewater
Pratinha
CamposAltos
Figure 3. Model topology applied to the Araguari River basin.
occupation throughout the Uberabinha River sub basin, the initially calibrated parameters for this sub basin were used as input data to estimate the surface flow into the other rural sub basins. As it can be seen in Fig. 2, the Bom Jardim River sub basin (394.6 km2) and the Das Pedras River sub basin (389.4 km2) are the main rural sub basins.
WWTP The WWTP's inflows were calculated using the drinking water flow distribution equation multiplied by the coefficient of return, which, according to the Brazilian standards ABNT: NBR 9649 (1986) and ABNT: NBR 14486 (2000), is set to 0.80 for these situations in which there are no observed data available.
Point wise demand with and without consumption The data on granted and georeferenced surface water demands for human consumption, irrigation, industry, and livestock watering were obtained from the IGAM, based on 2006 data. Data relating to variable require-ments for hydroelectric purposes were obtained from CEMIG.
Water balance The water balance was determined using the SIMGES module after completion of the topographic map, along with inputs of quantity data required for each element of the model, which include the point wise surface consumption demands, point wise requirements for hydroelectric purposes without consumption, point wise entries of tributaries, point wise effluents with and without WWTP, and the diffuse inputs from the main rivers (Quebra-Anzol, Araguari and Uberabinha). Various input data on storage reservoirs and hydroelectric plants are also essential in modeling, such as the dead volume of each reservoir (hm3), volume set aside in each reservoir at the beginning of the simulation (hm3), maximum storage capacity in each reservoir (hm3), base depth (m), minimum turbine depth (m), energy coefficient (GW hm3 m-1), maximum turbine requirement (m3 s-1), evapo-transpiration for each month, and bathymetric data of the reservoirs.
Quality modeling In AQUATOOL, quality modeling with the GESCAL module is performed after quantity modeling. Another text file was created containing data on the water
229
Integrated modeling in the Araguari River basin, Brazil 7
quality of tributaries and point wise discharges of WWTP treated and untreated domestic wastewater. The text file was introduced into the GESCAL module to start the simulations.
The data on water quality of the tributaries and the WWTPs were obtained from IGAM and CEMIG.
With respect to the 10 municipalities that discharge their untreated wastewaters directly into the water courses (approximately 30% of the total population of this basin), the water quality was estimated based on the characteristics of raw wastewater. The per capita gross load of BOD of 54 g day-1 was adopted based on the recommendation of the Brazilian standard ABNT: NBR 12209 (2011), in the absence of available measured data. Likewise, the per capita gross pollutant loads of organic nitrogen, ammonia, nitrate, and inorganic and organic phosphorus were estimated, to be 5.0, 7.0, 0.5, 1.0 and 1.5 g day-1, respectively. These estimates are based on the numerous experimental results reported by several authors, such as Tchobanoglous et al. (2003) and Von Sperling (2007). The number of inhabitants per municipality was obtained from census of the Brazilian Institute of Geography and Statistics (IBGE, 2013).
The simulated water quality parameters are: dissolved oxygen, biochemical oxygen demand (BOD5), organic nitrogen, ammonia, nitrate and total phosphorus. Due to the absence of eutrophication in the reservoirs for the time series under study, the modeling of water quality assumed thoroughly mixed reservoirs, for which the simulations were performed adopting only the upper region of the epilimnion. Although we thought that the behavior of the water quality in the reservoirs are enough defined with the model, overall, based on the available data, new information regarding temperature profiles and dynamics of nutrients could improve the model of the reservoir. Generally, the model is related to phosphorous and the internal sediment source of phosphorous. In this case, the developed CSTR model could be incremented to two layer model and could include the effect of the sediment, improving the knowledge of the system and the robustness of the model.
Fig. 4 shows the line diagram of the integrated modeling of water quantity and quality in the Araguari River basin. This plot shows the longitudinal distance between all the elements of the model, the longitudinal distance of the 20 river segments, and the location of the water quality monitoring stations used in the calibration model and its validation process. To calibrate the model in each segment of the river, existing water quality data was used in the node downstream from the segment (Figs. 3, 4). The GESCAL module allows the re-aeration coefficient in
each segment of the river to be obtained by the Covar method (Von Sperling, 2007; Paredes-Arquiola et al., 2009) or through the direct introduction of its value in the calibration process. The Covar method (empirical equations that depend on the mean flow velocity and the net depth) showed a good fit between observed and simulated dissolved oxygen data only in the headwater segments of the rivers involved. Table 1 identifies the 20 segments, the longitudinal length of each segment, and the hydraulic relationships used in the headwater segments.
Calibration, validation and sensitivity analysis In this study, the coefficients of biochemical reactions, sedimentation rates and sediment oxygen release in the 20 segments identified in Figures 3 and 4 were calibrated through a process of trial and error. The coefficients of reactions and sedimentation rates include: re-aeration, decomposition of carbonaceous organic matter, sedimentation rate of carbonaceous organic matter, hydrolysis of organic nitrogen, sedimentation rate of organic nitrogen, ammonia nitrification and denitrification, phytoplankton growth, phytoplankton death/respiration, phytoplankton sedi-mentation rate, organic phosphorus decay rate and organic phosphorus sedimentation rate.
A sensitivity analysis was performed of all the segments defined in Figures 3 and 4 in view of the changes in the input values of the four main previously calibrated coefficients of reactions (re-aeration coefficient Ka, coefficient of carbonaceous organic matter decomposition Kd, decomposition coefficient of organic nitrogen KNoa, and coefficient of ammonia nitrification of KNai), sediment oxygen demand SOD and water temperature Temp.
Unlike what was done in the calibration process, in which each segment was calibrated separately, using the data observed in the node downstream from the segment as the base for calibration, the sensitivity analysis joined two or more sequential segments in some cases in which the simulated and calibrated values of the node downstream from the last sequential segment were used as the standard in the analyses. The analyses of sequential segments were organized as follows: Araguari segments (1), (2), (3-4-5-6), (7-8) and (9-10-11) correspond, respectively, to the nodes 2, 3, 7, 9 and 12; Quebra-Anzol segments (1) and (2-3-4) correspond, respectively, to the nodes 15 and 3; finally, Uberabinha segments (1), (2-3) and (4) correspond, respectively, to the nodes 19, 21 and 13.
The factor method used in the sensitivity analysis enabled the assessment of changes in the concen-trations of quality parameters based on the simulta-
230

8 Latin American Journal of Aquatic Research
WWTP – Wastewater Treatment Plant
HBV rain-flow method
Influent
Water quality stationQuebra-Anzol riverUberabinha riverAraguari river
Kilometers
0 50 100 150 200 250 300 350 400 450
IbiáSerra do Salitre
Patrocínio
PerdizesPedrinópolis
Santa JulianaNova Ponte
Tapuirama
Indianópolis
Uberlândia 1
Uberlândia 2Uberlândia 3
Hydropower plant
Nova Ponte
Miranda
Capim Branco 1
Capim Branco 2
Martins
Malagone
141516173
4567
89
101112
131
2
181920
21
Tapira
CamposAltos
Pratinha
Paranaíba river
Araxá
Untreated wastewater
Table 1. Identification of the 20 segments, longitudinal length (L) of each segment, and hydraulic relationships used in the headwater segments. Q: average flow (m3 s-1); u: average velocity (m s-1); h: average depth (m); b: width of the transverse section (m); α1, β1, α2, β2, α3 and β3 are coefficients of the potential relationships of u = f(Q), h = f(Q) and b = f(Q), adjusted by optimizing the Nash-Sutcliffe efficiency coefficient (Nash & Sutcliffe, 1970).
Segment Between nodes
L (km) u = α1.Qβ1 h = α2.Qβ2 b = α3.Qβ3
Araguari 1 1-2 131.42 α1=0.135; β1=0.446 α2=1.472; β2=0.240 α3=5.017; β3=0.314 α1=0.200; β1=0.468 α2=0.171; β2=0.516 α3=29.338; β3=0.017
Araguari 2 2-3 47.32 --- --- --- Araguari 3 3-4 25.82 --- --- --- Araguari 4 4-5 20.57 --- --- --- Araguari 5 5-6 12.58 --- --- --- Araguari 6 6-7 18.50 --- --- --- Araguari 7 7-8 9.38 --- --- --- Araguari 8 8-9 23.40 --- --- --- Araguari 9 9-10 25.30 --- --- --- Araguari 10 10-11 21.30 --- --- --- Araguari 11 11-12 27.83 --- --- --- Araguari 12 12-13 16.75 --- --- --- Quebra-Anzol 1 14-15 90.02 α1=0.470; β1=0.258 α2=0.161; β2=0.674 α3=13.237; β3=0.068
α1=0.198; β1=0.452 α2=0.312; β2=0.505 α3=16.225; β3=0.043 α1=0.025; β1=0.661 α2=0.789; β2=0.320 α3=51.554; β3=0.020
Quebra-Anzol 2 15-16 33.62 --- --- --- Quebra-Anzol 3 16-17 41.16 --- --- --- Quebra-Anzol 4 17-3 42.76 --- --- --- Uberabinha 1 18-19 26.68 α1=0.240; β1=0.391 α2=0.214; β2=0.580 α3=19.496; β3=0.029
α1=0.066; β1=0.713 α2=0.736; β2=0.227 α3=20.692; β3=0.059 α1=0.053; β1=0.738 α2=0.742; β2=0.261 α3=25.347; β3=0.002
Uberabinha 2 19-20 3.15 --- --- --- Uberabinha 3 20-21 17.93 --- --- --- Uberabinha 4 21-13 29.74 --- --- ---
Figure 4. Single line diagram of the model.
231

Integrated modeling in the Araguari River basin, Brazil 9
neous variation of Ka, Kd, KNoa, KNai, and SOD by ± 10% from their calibrated value, which is called a dual-level analysis. According to Loucks et al. (2005) and Nakamura (2010), in dual-level analysis, 2n different simulations are performed, where n is the number of coefficients. However, for each river segment, 1 x 2 x 2n simulations were made, in which the number 1 corresponds to the number of + and – pairs, the first number 2 corresponds to the two simulations +10% and -10%, and n corresponds to the number of coefficients (n is equal to 4 in the segments that have no sediment oxygen demand SOD). With respect to temperature, a relative method was used to assess changes in the concentrations of quality parameters on the isolated variation by +10% and -10% from water temperature.
RESULTS
Quantity modeling Figure 5a illustrates the variation of simulated flow during the period of calibration and validation of the main sections in the basin. The flow at the mouth of Uberabinha River varies from 54.28 to 310.81 hm3
month-1. In the upper Araguari River (node 2) and upper Quebra-Anzol River (node 15) vary, respec-tively, from 80.06 to 603.56 hm3 month-1 and from 83.89 to 761.98 hm3 month-1, while at the mouth of the Araguari River basin (node 13) the flow varied from 799.23 to 2654.52 hm3 month-1.
Figures 5b, 5c and 5d, respectively, illustrate the longitudinal profiles of the simulated flows of the Araguari, Quebra-Anzol and Uberabinha rivers in the driest and rainiest months, along with the maximum flow observed, minimum flow observed, average flow observed and 25-75% percentile observed. Downstream to the Nova Ponte reservoir, the box-plot graph (Fig. 5) shows that the extreme model scenarios-driest and rainiest months-are between 25-75% percentiles. In the upper Quebra-Anzol and Uberabinha Rivers, it is observed that the extreme model scenario in the driest month is between minimum observed and 25% percentile observed and the extreme model scenario in rainiest month is between maximum observed and 75% percentile observed.
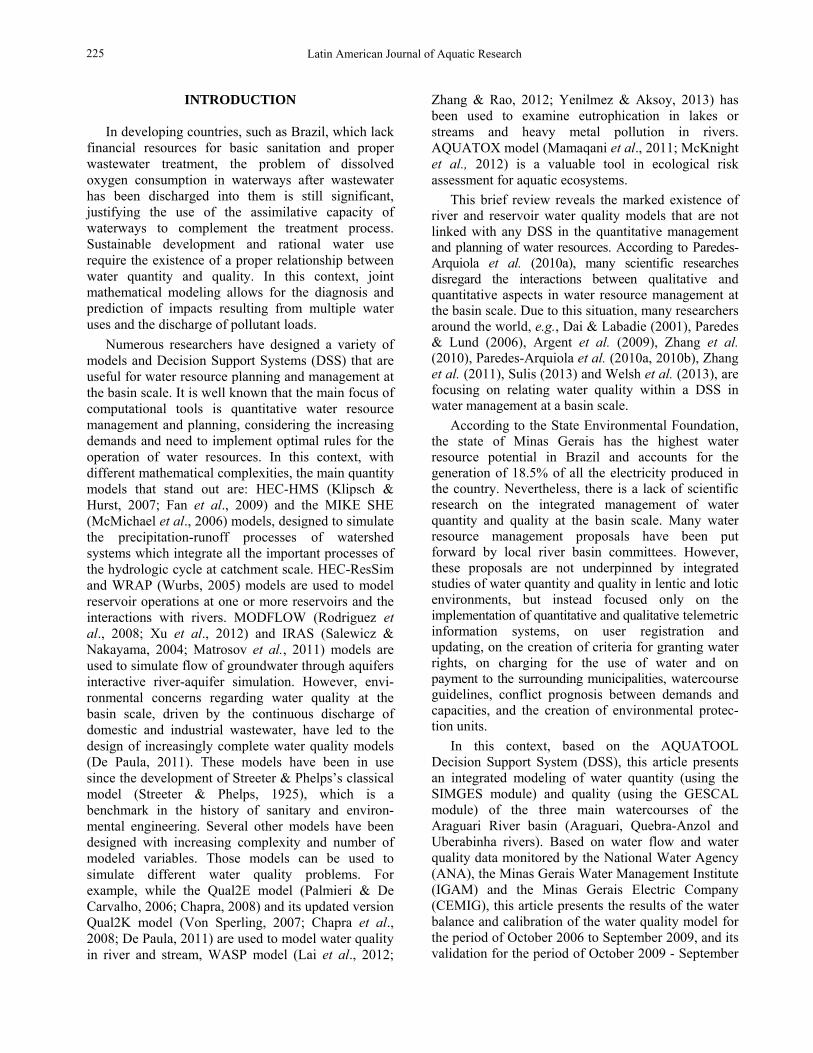
Quality modeling Figures 6 and 7 show longitudinal profile of simulated quality parameters in the driest and rainiest months, and average values, maximum and minimum flow rates observed and 25-75% percentiles observed in the period of calibration and validation in the Araguari, Quebra-Anzol and Uberabinha rivers. In the three major rivers, the longitudinal profile of simulate
quality parameters always remained within the minimum and maximum values observed in all the nodes studied.
Table 2 presents the calibrated values of the main coefficients of biochemical reactions (Ka, Kd, KNoa, KNai and Kphosph), the sedimentation rates (VSd, VSNo and VSphosph) and sediment oxygen demand (SOD) in each river segment. The values in this table are within limits recommended in the literature (Chapra, 2003; Von Sperling, 2007; Paredes-Arquiola et al., 2009). Also in Table 2, the values set at -1 for Ka in some segments indicate that this coefficient was estimated by the Covar method. Note that there was sediment oxygen demand in much of the basin, ranging from nodes 2 (upper course of Araguari River) and 15 (upper course of Quebra-Anzol River) to node 9 (Capim Branco HP 1).
According to Figure 8, a comparison was made for the main coefficients found in this paper with values from the literature. ka values upstream to the Nova Ponte reservoir are similar to the found by Paredes-Arquiola et al. (2010a, 2010b), Nakamura (2010) and Salla et al. (2013), which varied between 0.5 and 6.4 day-1, kd values presented two bands, a range between 0.001 to 0.1 day-1 (similar to Paredes-Arquiola et al., 2010a) and another range from 0.1 to 0.6 day-1 (similar to Paredes-Arquiola et al., 2010b; Nakamura, 2010; and Salla et al., 2013). With respect to SOD, the same range of values found in this study was found in Paredes-Arquiola et al. (2010a), which varied between 0.10 and 0.23 day-1. In all references consulted KNoa coefficient ranged from 0.002 to 0.6 day-1. The range of values found in this study to KNai (0.007 to 0.2 day-
1) is within the limits found by Paredes-Arquiola et al. (2010a, 2010b) and Salla et al. (2013).
The low value of the constants of biochemical reactions (Table 2) are associated with the high pollutant dilution capacity due to high surface water flows in all the river segments under study and to the low pollutant loads discharged point wise by the 13 aforementioned municipalities (Figs. 3, 4). The models that have been calibrated are intended for basin planning so that the aim is not to obtain the same adjustment to specific models or detail of water masses, as general data have been used. This approach allows to consider a reasonable fit between the time series of the simulated and observed values of water quality parameters studied here, with the best results achieved in the upper course of Araguari River, the upper course of Quebra-Anzol River and in Uberabinha River, according to the results indicated by the most representative nodes of this basin (Fig. 9).
232

10 Latin American Journal of Aquatic Research
Figure 5. a) Variation of the simulated flow over the period of calibration and validation at the main points in the basin. Longitudinal profile of the simulated flows in the driest and rainiest months, with values of average, maximum and minimum flow rates observed and 25-75% percentiles observed in b) Araguari River, c) Quebra-Anzol River, and d) Uberabinha River.
In this study, a analysis was made of the sensitivity of the variables of state to changes of +10% and -10% in the values of the coefficients of re-aeration Ka,
decomposition of carbonaceous organic matter Kd, decomposition of organic nitrogen KNoa and ammonia nitrification KNai, water temperature Temp and for
233

Tab
le 2
. Cal
ibra
ted
coef
ficie
nts:
Ka:
re-a
erat
ion,
Kd:
deco
mpo
sitio
n of
car
bona
ceou
s m
atte
r, K
Noa
: ni
troge
n m
iner
aliz
atio
n, K
Nai:
amm
onia
nitr
ifica
tion
and
Kph
osph
: dec
ompo
sitio
n of
tota
l pho
spho
rus;
Sed
imen
tatio
n ra
tes:
VSd
: car
bona
ceou
s org
anic
mat
ter,
V SN
o: or
gani
c ni
troge
n an
d V S
phos
ph: p
artic
ulat
e ph
osph
orus
; SO
D:
sedi
men
t oxy
gen
dem
and.
Segm
ent
Bet
wee
n no
des
Ka
(day
-1)
S OD
(g
m-2
day-1
) K
d (d
ay-1
) V S
d (m
day
-1)
KN
oa
(day
-1)
V SN
o (d
ay-1
) K
Nai
(d
ay-1
) K
phos
ph
(day
-1)
V Sph
osph
(m
day
-1)
Ara
guar
i 1
1-2
-1
---
0.02
0.
01
0.02
0.
001
0.01
0.
01
0.00
1 A
ragu
ari 2
2-
3 2.
0 0.
10
0.5
0.05
0.
05
0.05
0.
007
0.01
0.
001
Ara
guar
i 3
3-4
0.3;
0.4
0.
10; 0
.12
0.2;
0.3
0.
01
0.02
; 0.
05
0.00
1; 0
.05
0.01
0.
3 0.
1 A
ragu
ari 4
4-
5 0.
3 0.
14
0.2
0.01
0.
05
0.05
0.
01
0.3
0.1
Ara
guar
i 5
5-6
0.3
0.16
0.
2 0.
01
0.05
0.
05
0.01
0.
3 0.
1 A
ragu
ari 6
6-
7 0.
3 0.
19
0.2
0.01
0.
05
0.05
0.
01
0.3
0.1
Ara
guar
i 7
7-8
0.10
; 0.1
5 0.
10
0.02
0.
01
0.00
2 0.
2 0.
01
0.02
0.
001
Ara
guar
i 8
8-9
0.10
0.
12
0.02
0.
01
0.00
2 0.
2 0.
01
0.01
0.
001
Ara
guar
i 9
9-10
0.
1 --
- 0.
02
0.01
0.
002
0.2
0.01
0.
01
0.00
1 A
ragu
ari 1
0 10
-11
0.1
---
0.02
0.
01
0.00
2 0.
2 0.
01
0.01
0.
001
Ara
guar
i 11
11-1
2 0.
1 --
- 0.
02
0.01
0.
002
0.2
0.01
0.
01
0.00
1 A
ragu
ari 1
2 12
-13
0.1
---
0.05
0.
1 0.
002
0.2
0.01
0.
2 0.
1 Q
uebr
a-A
nzol
1
14-1
5 -1
--
- 0.
02
0.01
0.
05
0.00
1 0.
1 0.
01
0.00
1 Q
uebr
a-A
nzol
2
15-1
6 -1
0.
21
0.6
0.1
0.01
0.
05
0.1
0.2
0.1
Que
bra-
Anz
ol 3
16
-17
2.0
0.22
0.
4 0.
05
0.01
0.
05
0.1
0.2
0.1
Que
bra-
Anz
ol 4
17
-30
4.0
0.23
0.
5 0.
1 0.
05
0.05
0.
007
0.2
0.1
Ube
rabi
nha
1 18
-19
-1
---
0.02
0.
01
0.2
0.00
1 0.
1; 0
.2
0.01
0.
001
Ube
rabi
nha
2 19
-20
0.04
; 0.0
8 --
- 0.
04; 0
.06
0.01
0.
2;0.
4 0.
001;
0.0
1 0.
1 0.
01
0.00
1 U
bera
binh
a 3
20-2
1 0.
04
---
0.06
0.
01
0.4
0.01
0.
01
0.01
0.
001
Ube
rabi
nha
4 21
-13
0.04
; 0.1
--
- 0.
05; 0
.06
0.01
; 0.1
0.
002;
0.4
0.01
; 0.2
0.
01
0.01
;0.0
2;0.
03
0.01
;0.1
Integrated modeling in the Araguari River basin, Brazil 9 234

12 Latin American Journal of Aquatic Research
Figure 6. Longitudinal profile of simulated quality parameters in the driest and rainiest months, and values of average, maximum and minimum flow rates observed and 25-75% percentile observed in the period of calibration and validation: a) Araguari River, b) Quebra-Anzol River.
235

Integrated modeling in the Araguari River basin, Brazil 13
Figure 7. Longitudinal profile of the simulated quality parameters for the rainiest and driest months, and values of average, maximum and minimum flow rates observed and 25-75% percentiles observed in the period of calibration and validation in Uberabinha River.
some segments, also the sediment oxygen demand SOD.
Figure 10 illustrates the percentage of variation of the parameters DO, BOD5, organic nitrogen, ammonia and nitrate as a function of the segments. In general, it was found that variations in the coefficients and in sediment oxygen demand display a low sensitivity with respect the previously calibrated results, while water temperature generated the largest one. With regard to the parameter DO, the highest sensitivities occurred as a result of changes in SOD and Temp in the segments of the Nova Ponte reservoir. With respect to SOD, the parameter DO ranged from -2.1 to +10% SOD and +1.9 to -10% SOD in Araguari segment 2 and from -3.8 to +10% SOD and +3.3 to -10% SOD in Quebra-Anzol segments 2, 3 and 4. With respect to Temp, the parameter DO has reached -6.4 to -10% Temp in Araguari segment 2 and +6.7 to +10% Temp in Quebra-Anzol segments 2, 3 and 4. The variation of Ka generated little sensitivity in the calibrated results of DO (≤ 1.2% in all the segments).
The parameter BOD5 showed sensitivity only in Araguari segment 2 and Quebra-Anzol segments 2 a 4 (Nova Ponte reservoir) and Araguari segments 3 a 6 (between Nova Ponte HP and Miranda HP) due to variations in the coefficient Kd and Temp. With respect to Kd, the parameter BOD5 ranged from -5.2 to +10% Kd and +5.6 to -10% Kd in Araguari segment 2; -4.8 to +10% Kd and +5.0 to -10% Kd in Araguari segments 3-6; and -2.8 to +10% Kd and +3.6 to -10% Kd in Quebra-Anzol segments 2-4 (Fig. 10). With respect to Temp, the parameter BOD5 has reached -15.0 to -10% Temp in Araguari segment 2 and -4.8 to -10% Temp in Quebra-Anzol segments 2-4 (Fig. 10).
The highest variations in the organic nitrogen occurred due to variations in the coefficient KNoa and water temperature Temp. The higher sensitivities observed where of ± 1.7% in Quebra-Anzol segments 2 to 4 and of ± 2.1% in Uberabinha segments 2 and 3 due to variations in the coefficient KNoa. With respect to Temp, organic nitrogen has reached -5.4 to -10% Temp in Araguari segment 2 and -4.4 to -10% Temp in Uberabinha river segments 2 and 3 (Fig. 10).
Ammonia showed low sensitivity (≤1.1%) due to variations in the coefficients KNoa and KNai. With respect to water temperature Temp, the ammonia has reached -2.1 to +10% Temp and -3.2 to -10% Temp in Quebra-Anzol segment 1.
And nitrate showed the highest sensitivity due to variations in the coefficient KNai and water temperature Temp, showed the highest sensitivity of ± 6.4% in Quebra-Anzol segments 2 to 4 and of ±3.4%
236

14 Latin American Journal of Aquatic Research
Figure 8. Comparison of the main coefficients found in this paper with literature values.
in Uberabinha segments 2 and 3 due to variations in the coefficient KNai. With respect to Temp, the nitrate has reached +19.3 to +10% Temp and +27.5 to -10% Temp in Quebra-Anzol segment 1.
DISCUSSION
In the quantity simulations performed in the SIMGES module, from October 2006 to September 2011, the adjustments were satisfactory for scale work used in this paper, in which we tried to represent the mean behavior of the system. In Figure 5a, the greater amplitude of oscillation of the flow in the Nova Ponte HP (node 3) compared to the Miranda HP (node 7), Capim Branco HP 1 (node 9) and Capim Branco HP 2 (node 12) indicates the regulatory behavior of the Ponte Nova reservoir vis-à-vis the other three cascade reservoirs. The regulatory behavior of the Nova Ponte reservoir (node 3) is also shown in Figure 5b. An analysis of node 3 reveals that there is storage of liquid volume in the rainy season and release during the dry months, which causes a considerable decrease in the difference in flow between the rainy and dry seasons (note the segments upstream and downstream from node 3).
In Brazil, water bodies are classified by CONAMA (2005). In addition to this resolution, the state of Minas Gerais has its own Joint Regulatory Resolution (COPAM, 2008), which is similar to CONAMA (2005) with respect to the parameters studied here. According to the COPAM (2008), the Araguari, Quebra-Anzol and Uberabinha rivers are Class 2 rivers, for which the following limits with respect to the quality parameters studied here must be observed: dissolved oxygen ≥5.0 mg O2 L-1; BOD5 ≤5.0 mg O2
L-1; ammonia ≤3.7 mg NH4+ L-1; nitrate ≤10.0 mg
NO3- L-1; phosphorus (lentic environment) ≤0.03 mg P
L-1; phosphorus (intermediate environment) ≤0.05 mg P L-1; and phosphorus (lotic environment) ≤0.10 mg P L-1.
However, a general analysis of the longitudinal profiles of the quality parameters simulated for the rainiest and driest months (Figs. 6, 7) reveals discre-pancies with regard to the parameters BOD5 in the Uberabinha River (Fig. 7) and total phosphorus in the Uberabinha, Araguari and Quebra-Anzol rivers (Figs. 6, 7). In Uberabinha River, downstream from the site where the municipality of Uberlândia discharges its treated wastewater, to the mouth of Uberlandia River (called Uberabinha segments 3 and 4), the BOD5 and total phosphorus show Class 3 behavior. The BOD5 ranged from 5.1 to 6.8 mg O2 L-1 in the rainiest month and from 6.2 to 9.1 mg O2 L-1 in the driest month. The total phosphorus parameter for lotic environments ranged from 0.10 to 0.14 mg P L-1 in the rainiest month and from 0.17 to 0.28 mg P L-1 in the driest month. The higher concentrations of BOD5 and total phosphorus in the driest month are associated with the lower capacity for natural self-purification and dilution of pollutants due to reduced flows. This problem will increase due to the increasing population of this municipality.
In the Araguari and Quebra-Anzol rivers, the simulated profiles of the parameter total phosphorus show non-compliance with the COPAM (2008) in the Araguari 2, Quebra-Anzol 3 and Quebra-Anzol 4 segments. These segments, which correspond to the flooded areas of the Nova Ponte reservoir, behave like lentic environments, in which phosphorus ranged from 0.04 to 0.06 mg P L-1 in the rainiest month and from
237

Integrated modeling in the Araguari River basin, Brazil 15
DO
(mgO
2.L-1
)
BOD
(mgO
2.L-1
)
Org
anic
nitr
ogen
(mgN
.L-1
)
Am
mon
ia(m
gNH
4+ .L-1
)
Nitr
ate
(mgN
O3- .L
-1)
Phos
phor
us(m
gP.L
-1)
calibration validation calibration
calibration calibration
calibration calibration
validation
validation validation
validation validation
Simulated Observed a) – Node 15
DO
(mgO
2.L-1
)
BOD
(mgO
2.L-1
)
Org
anic
nitr
ogen
(mgN
.L-1
)
Am
mon
ia(m
gNH
4+ .L-1
)
Nitr
ate
(mgN
O3-. L
-1)
Phos
phor
us(m
gP.L
-1)
calibration validation calibration
calibration calibration
calibration calibration
validation
validation validation
validation validation
Simulated Observed b) – Node 2
238
16 Latin American Journal of Aquatic Research
DO
(mgO
2.L-1
)
BO
D(m
gO2.L
-1)
Org
anic
nitr
ogen
(mgN
.L-1
)
Am
mon
ia(m
gNH
4+ .L-1
)
Nitr
ate
(mgN
O3- .L
-1)
Phos
phor
us(m
gP.L
-1)
calibration validation calibration
calibration calibration
calibration calibration
validation
validation validation
validation validation
Simulated Observed
c) – Node 21
DO
(mgO
2.L-1
)
BO
D(m
gO2.L
-1)
Org
anic
nitr
ogen
(mgN
.L-1
)
Am
mon
ia(m
gNH
4+ .L-1
)
Nitr
ate
(mgN
O3- .L
-1)
Phos
phor
us(m
gP.L
-1)
calibration validation calibration
calibration calibration
calibration calibration
validation
validation validation
validation validation
Simulated Observed
d) – Node 8
239

Integrated modeling in the Araguari River basin, Brazil 17
DO
(mgO
2.L-1
)
BO
D(m
gO2.L
-1)
Org
anic
nitr
ogen
(mgN
.L-1
)
Am
mon
ia(m
gNH
4+ .L-1
)
Nitr
ate
(mgN
O3- .L
-1)
Phos
phor
us(m
gP.L
-1)
calibration validation calibration
calibration calibration
calibration calibration
validation
validation validation
validation validation
Simulated Observed
e) – Node 13 Figure 9. Time series of simulated and observed values in: a) Node 15, b) Node 2, c) Node 21, d) Node 8, and e) Node 13. 0.02 to 0.04 mg P L-1 in the driest month in the Araguari segment 2, and from 0.03 to 0.09 mg P L-1 in the rainiest month in the Quebra-Anzol segments 1, 2 and 3. In this region of the Araguari River basin, the higher concentrations of total phosphorus in the rainiest month are associated with land use in terms of the excessive application of this nutrient in annual and perennial crops. In the period of this study, land use for pasture, and annual and perennial crops repre-sented approximately 53% of the area of contribution to the sub basin of the Quebra-Anzol River, according to the Committee of Araguari river basin.
An overall analysis of the time series of observed values of quality parameters (Figs. 6, 7) reveals a behavior that does not comply with the recom-mendations of the COPAM (2008) on certain dates within the period studied. In Uberabinha River, the parameter DO showed values of less than 5.0 mg O2 L-1 on only four occasions in the dry months, downstream from Uberlandia’s municipal wastewater treatment plant (nodes 20 and 21). Point wise DO values of less than 5.0 mg O2 L-1 were found in Araguari River segments 3, 4 and 5, indicating the influence of the bottom discharge of Nova Ponte
reservoir (lower concentrations of dissolved oxygen). BOD5 values far exceeding the maximum of 5.0 mg O2 L-1 were found only in Uberabinha River downstream from the municipality’s WWTP, which reached up to 32.0 mg O2 L-1 to observed data in node 20, However, the box-plot graph (Fig. 7) shows that the extreme model scenarios –driest and rainiest month– are between 25 and 75% percentile observed in node 20. Ammonia values exceeded the maximum of 3.7 mg NH4
+ L-1 only in Uberabinha River, also downstream from the municipality’s WWTP, which reached up to 11.0 mg NH4
+ L-1 in a single month without rain. The nitrate parameter was in compliance with the COPAM (2008) in the analyzed time series. However, in most of the nodes, the total phosphorus parameter presented values not in compliance with the maximum of 0.03 mg P L-1, except for nodes 4, 5, 6, 10, 14, and 18.
The calibrations in the upper courses of Araguari and Quebra-Anzol rivers (Figs. 9a, 9b) showed satisfactory fits to the DO, nitrate and total phosphorus parameters. As for organic nitrogen, the reduced number of observed data precluded a good assessment of the fit. The time series of observed data of the
240

18 Latin American Journal of Aquatic Research
Figure 10. Sensitivity Analysis – Percentages of variation of the DO, BOD5, organic nitrogen, ammonia and nitrate parameters as a function of the segments of river.
241

Integrated modeling in the Araguari River basin, Brazil 19
BOD5 and ammonia parameters showed practically constant values, which also made it difficult to assess the fit between observed and simulated data, indicating the possibility that the laboratory measurements of these parameters have methodological limitations.
Figure 9c shows the time series of simulations and observed data at node 21, located downstream from Uberlandia’s municipal WWTP at the lower course of Uberabinha River. The calibrations achieved satis-factory results for the DO, BOD5, ammonia, nitrate and total phosphorus parameters, despite a few observed data scattered of the ammonia, nitrate and phosphorus parameters. The quality of the observed data for the nitrogen parameter hindered their fit to the simulations, as indicated by a comparison of the oscillatory behavior of the data observed for ammonia and its fixed behavior and with the value of 0.2 mg N L-1 for 60% of the data observed for nitrogen. Calibrations in the middle and lower course of Araguari River (Figs. 9d, 9e) showed different behaviors in relation to the nodes located in the upper course of Araguari River and in Uberabinha River. In general, the time series of observed data are highly scattered in these regions of the basin, which hindered the satisfactory fit of the simulations, except for the of dissolved oxygen and phosphorus parameters.
The model was validated from October 2009 to September 2011, as indicated in Figure 9. The fits between simulated and measured data were satisfactory for the upper courses of Quebra-Anzol and Araguari rivers for most of the parameters (Figs. 9a, 9b), except for ammonia in node 15 for the year 2011 (Fig. 9a). As for node 21 (Fig. 9c), the validation was not satisfactory for organic nitrogen and phosphorus due to the marked dispersion observed in the time series. With regard to the validation of the model for the middle and lower course of Araguari River (Figs. 9d, 9e), the same findings as those recorded during the period of calibration persisted.
ACKNOWLEDGMENTS
The first author gratefully acknowledges CAPES (Brazil’s Federal Agency for the Support and Improvement of Higher Education) for process No1304/ 12-7 and CEMIG, IGAM-MG and the Araguari River Basin Agency-ABHA-MG for providing water quantity and quality data.
REFERENCES
Andreu, J., J. Capilla & E. Sanchís. 1996. AQUATOOL: a generalized decision support-system for water-
resources planning and operational management. J. Hydrol., 177(3-4): 269-291.
Associação Brasileira de Normas Técnicas (ABNT). 1986. NBR 9649: Projeto de redes coletoras de esgoto sanitário. Rio de Janeiro. [http://www.abnt catalogo.com.br/norma.aspx?ID=4200]. Reviewed: 15 June 2013.
Associação Brasileira de Normas Técnicas (ABNT). 2011. NBR 12209: Elaboração de projetos hidráulico-sanitários de estações de tratamento de esgotos sanitários. [http://www.abntcatalogo.com.br/norma. aspx?ID=89383]. Reviewed: 15 June 2013.
Associação Brasileira de Normas Técnicas (ABNT). 2000. NBR 14486: Sistemas enterrados para condução de esgoto sanitário-Projeto de redes coletoras com tubos de PVC. [http://www.abnt catalogo.com.br/norma.aspx?ID=2404]. Reviewed: 15 June 2013.
Argent, R.M., J.M. Perraud, J.M.Rahman, R.B.Grayson & G.M. Podger. 2009. A new approach to water quality modeling and environmental decision support systems. Environ. Modell. Softw., 24: 809-818.
Bergström, S. 1995. The HBV model, computer models of watershed hydrology. In: V.P. Singh (ed.). Water resources publications. Littleton, CO, pp. 443-476.
CBHAraguari-Comitê da Bacia Hidrográfica do Rio Araguari, 2012. [http://www.cbharaguari.org.br]. Reviewed: 10 April 2013.
Chapra, S.C. 2003. Engineering water quality models and TDMLs. J. Water Res. Pl-ASCE, 129(4): 247-256.
Chapra, S.C. 2008. Surface water quality modeling. McGraw-Hill, New York, 844 pp.
Chapra, S.C., G.J. Pelletier & H. Tao. 2008. QUAL2K: a modeling framework for simulating river and stream water quality, Version 2.11: documentation and user's manual. Civil and Environmental Engineering De-partment, Tufts University, Medford, 109 pp.
Conselho Estadual de Política Ambiental-Deliberação Normativa Conjunta COPAM/CERH nº 01, de 05 de maio de 2008. Dispõe sobre a classificação dos corpos de água e diretrizes ambientais para o seu enquadramento, bem como estabelece as condições e padrões de lançamento de efluentes, e dá outras providências. [http://www.siam.mg.gov.br/sla/down load.pdf?idNorma=8151]. Reviewed: 10 April 2013.
Conselho Nacional do Meio Ambiente (CONAMA) 2005. Resolução CONAMA Nº357, de 17 de março de 2005. Dispõe sobre a classificação dos corpos de água e diretrizes ambientais para o seu enquadra-mento, bem como estabelece as condições e padrões de lançamento de efluentes, e dá outras providências.
242

20 Latin American Journal of Aquatic Research
[http://www.mma.gov.br/port/conama/res/res05/res35705.pdf]. Reviewed: 10 april 2013.
Dai, T. & J.W. Labadie. 2001. River basin network model for integrated water quantity/quality mana-gement. J. Water Res. Pl-ASCE, 127(5): 295-305.
Danelon, J.R.B., F.M.L. Netto & S.C. Rodrigues. 2012. Análise do nível de fósforo total, nitrogênio amoniacal e cloretos nas águas do córrego Terra Branca no município de Uberlândia (MG). Rev. Geonorte, 1(4): 412-421.
Das, T., A. Bárdossy & E. Zehe. 2006. Influence of spatial variability of precipitation on distributed rainfall-runoff modeling. IAHS Publication 303: Promise and Progress, pp. 195-203.
De Paula, L.M. 2011. Avaliação da qualidade da água e autodepuração do rio Jordão, Araguari (MG). Dissertação de Mestrado, Universidade Federal de Uberlândia, Engenharia Civil, Uberlândia, 177 pp.
Duan, Q., S. Sorooshian & V. Gupta. 1992. Effective and efficient global optimization for conceptual rainfall-runoff models. Water Resour. Res., 28(4): 1015-1031.
Empresa de Pesquisas Energéticas (EPE). 2006. AAI dos aproveitamentos hidrelétricos da bacia hidrográfica do rio Paranaíba. Sondotécnica. [http://www.epe.gov. br/Meioambiente/Documents]. Reviewed: 10 April 2013.
Fan, C., C.H. Ko & W.S. Wang. 2009. An innovative modeling approach using Qual2K and HEC-RAS integration to assess the impact of tidal effect on river water quality simulation. J. Environ. Manage., 90(5): 1824-1832.
Flauzino, F.S., M.K.A. Silva, L. Nishiyama & R. Rosa. 2010. Geotecnologias aplicadas à gestão dos recursos naturais da bacia hidrográfica do rio Paranaíba no cerrado mineiro. Sociedade & Natureza, 22(1): 75-91.
Hundecha, Y. & A. Bárdossy. 2004. Modeling of the effect of land use changes on the runoff generation of a river basin through parameter regionalization of a watershed model. J. Hydrol., 292(1-4): 281-295.
Instituto Brasileiro de Geografia e Estatística (IBGE). 2013. Cidades@. [http://www.ibge.gov.br/cidadesat]. Reviewed: 11 November 2013.
Klipsch, J.D. & M.B. Hurst. 2007. HEC-ResSim reservoir system simulation user's manual version 3.0, USACE, Davis, CA, 512 pp.
Lai, Y.C., Y.T. Tu, C.P. Yang, R.Y. Surampalli & C.M. Kao. 2012. Development of a water quality modeling system for river pollution index and suspended solid loading evaluation. J. Hydrol., 478: 89-101.
Loucks, D.P., E. Van Beek, J.R. Stedinger, J.P.M. Dijkman & M.T. Villars. 2005. Water resources systems planning and management: an introduction to methods, models and applications. UNESCO, Paris, 680 pp.
Mamaqani, Y.A., N. Khorasani, K. Talebi, S.H. Hashemi, G. Rafiee & F.B. Khosroshahi. 2011. Diazinon fate and toxicity in the Tajan River (Iran) ecosystem. Environ. Eng. Sci., 28(12): 859-868.
Matrosov, E.S., J.J. Harou & D.P. Loucks. 2011. A computationally efficient open-source water resource system simulator-Application to London and the Thames Basin. Environ. Modell. Softw., 26(12): 1599-1610.
Mcknight, U.S., J.J. Rasmussen, B. Kronvang, P.L. Bjerg & P.J. Binning. 2012. Integrated assessment of the impact of chemical stressors on surface water ecosystems. Sci. Total Environ., 427-428: 319-331.
Mcmichael, C.E., A.S. Hope & H.A. Loaiciga. 2006. Distributed hydrological modeling in California semi-arid shrublands: MIKE SHE model calibration and uncertainty estimation. J. Hydrol., 317(3-4): 307-324.
Nakamura, M.S. 2010. Modelación y análisis de calidad del Río Atibaia en el tramo entre el punto de captación de la ciudad de Atibaia y el punto de vertido de la ciudad de Paulínia (São Paulo- Brasil). Master en Ingeniería Hidráulica y Medio Ambiente, Universidad Politécnica de Valencia, Valencia, 119 pp.
Nash, J.E. & J.V. Sutcliffe. 1970. River flow forecasting through conceptual models. Part I. A discussion of principles. J. Hidrol., 10: 280-290.
Palmieri, V. & R.J. Carvalho. 2006. Qual2E model for the Corumbatai River, Ecol. Model., 198: 269-275.
Paredes, J. & J. Lund. 2006. Refill and drawdown rules for parallel reservoirs: quantity and quality. Water Resour. Manage., 20(1): 359-376.
Paredes-Arquiola, J., J.A. Álvarez, A. Solera. 2009. Modelo GESCAL para la simulación de la calidad del agua en sistemas de recursos hídricos. Manual de usuario. Versión 1.1. Universidad Politécnica de Valencia, Valencia, 100 pp.
Paredes-Arquiola, J., J.A. Álvarez & A. Solera. 2010a. A decision support system for water quality issues in the Manzanares River. Sci. Total Environ., 408(12): 2576-2589.
Paredes-Arquiola, J., J.A. Álvarez, M.M. Monerris & A. Solera. 2010b. Water quantity and quality models applied to the Jucar River Basin, Spain. Water Resour. Manage., 24(11): 2759-2779.
Paredes-Arquiola, J., A. Solera, J.A. Álvarez, N.L. Elvira. 2011. Manual Técnico v1.0-Herramienta
243
Integrated modeling in the Araguari River basin, Brazil 21
EvalHid para la evaluación de recursos hídricos. Universidad Politécnica de Valencia, Valencia, 31 pp.
Rezende, G.B.M. 2012. Modelo hidrológico e hidráulico para estimativa e delimitação de áreas inundadas: uma ferramenta de auxílio à elaboração de planos diretores de drenagem urbana. Dissertação de Mestrado. Programa de Pós-Graduação em Engenharia Civil. Universidade Federal de Uberlândia, Uberlândia. 115 pp.
Rodriguez, L.B., P.A. Cello, C.A. Vionnet & D. Goodrich. 2008. Fully conservative coupling of HEC-RAS with MODFLOW to simulate stream-aquifer interactions in a drainage basin. J. Hydrol., 353(1-2): 129-142.
Rosa, R., J.L.S. Brito, E.F. Lima, A.C. Siqueira & D. Macedo. 2004. Elaboração de uma base cartográfica e criação de um banco de dados georreferenciados da Bacia do Rio Araguari. In: gestão ambiental da bacia do rio Araguari rumo ao desenvolvimento sustentável. Universidade Federal de Uberlândia, Uberlândia. [http://www.seer.ufu.br/index.php/caminhosdegeografia/issue/view/745]. Reviewed: 11 November 2013.
Rosolen, V., H. Uwe, N.M.M. Coelho, L.M. Coelho, J.L.S. Brito, L.A. Silva, S.C. Lima. 2009. Qualidade dos sedimentos no rio Uberabinha (Uberlândia, MG) e implicações ambientais. Rev. Bras. Geociências, 39(1): 151-159.
Salla, M.R., C.E. Pereira, J.E. Alamy Filho, L.M. De Paula & A.M. Pinheiro. 2013. Estudo da autodepuração do Rio Jordão, localizado na bacia hidrográfica do Rio Dourados. Eng Sanit Ambient, 18(2): 105-114.
Salewicz, K.A & M. Nakayama. 2004. Development of a web-based decision support system (DSS) for managing large international rivers. Sci. Tech., 14(1): 25-37.
Soil Conservation Service (SCS). 1986. Urban hydrology for small watersheds, Tech, Release, n. 55, U.S. Department of Agriculture, Washington D.C. [http:// www.cpesc.org/reference/tr55.pdf]. Reviewed: 15 June 2013.
Streeter, H.W. & E.B. Phelps. 1925. A Study of the pollution and natural purification of the Ohio River. III. Factors concerned in the phenomena of oxidation and re-aeration, Public Health Bull., 146 pp. [http://dspace.udel.edu:8080/dspace/bitstream/handle/19716/1590/C%26EE148.pdf?sequence=2]. Reviewed: 18 June 2013.
Received: 9 July 2013; Accepted: 17 January 2014
Sulis, A. & G.M. Sechi. 2013. Comparison of generic simulation models for water resource systems, Environ. Modell Softw., 40: 214-225.
Tchobanoglous, G., F.L. Burton & H.D. Stensel. 2003. Wastewater engineering: treatment and reuse. Mc Graw-Hill, Boston, 1848 pp.
Tucci, C.E.M. 2005. Modelos hidrológicos. Universidade Federal do rio Grande do Sul, Editora UFRGS, Porto Alegre, 678 pp.
Von Sperling, M. 2007. Estudos e modelagem da qualidade da água de rios. Departamento de Engenharia Sanitária e Ambiental, Universidade Federal de Minas Gerais, Ed. UFMG, Belo Horizonte, 588 pp.
Welsh, W., J. Vaze, D. Dutta, D. Rassam, J. Rahman, I. Jolly, P. Wallbrink, G. Podger, M. Bethune, M. Hardy, J. Teng & J. Lerat. 2013. An integrated modeling framework for regulated river systems. Environ. Modell. Softw., 39: 81-102.
Wurbs, R.A. 2005. Modeling river/reservoir system management, water allocation and supply reliability. J. Hydrol., 300(1-4): 100-113.
Xu, X., G. Huanga, H. Zhanc, Z. Que & Q. Huanga. 2012. Integration of SWAP and MODFLOW-2000 for modeling groundwater dynamics in shallow water table areas. J. Hydrol., 412-413: 170-181.
Yenilmez, F. & A. Aksoy. 2013. Comparison of phosphorus reduction alternatives in control of nutrient concentrations in Lake Uluabat (Bursa, Turkey): Partial versus full sediment dredging. Limnologica, 43: 1-9.
Zhang, W., Y. Wang, H. Peng, Y. Li, J. Tang & K.B. Wu. 2010. A coupled water quantity-quality model for water allocation analysis. Water Resour. Manage., 24: 485-511.
Zhang, X. G.H. Huang, X. Nie, Q. Li. 2011. Model-based decision support system for water quality management under hybrid uncertainty. Expert. Syst. Appl., 38(3): 2809-2816.
Zhang, W. & Y.R. Rao. 2012. Application of a eutrophication model for assessing water quality in Lake Winnipeg. J. Great Lakes Res., 38(3): 158-173.
244
Lanternfish from Brazil 245
Lat. Am. J. Aquat. Res., 42(1): 245-257, 2014 DOI: 103856/vol42-issue1-fulltext-20
Research Article
Lanternfish (Myctophidae) from eastern Brazil, southwest Atlantic Ocean
Adriana da Costa Braga1, Paulo A.S. Costa1, Agnaldo S. Martins2
George Olavo3 & Gustavo W. Nunan4
1Laboratório de Dinâmica de Populações Marinhas, Departamento de Ecologia e Recursos Marinhos Universidade Federal do Estado do Rio de Janeiro, Av. Pasteur, 458, sala 410
Urca, Rio de Janeiro, 22290-240, RJ, Brazil 2Departamento de Oceanografia e Ecologia, Universidade Federal do Espírito Santo
Av. Fernando Ferrari, 514, Vitória, 29075-910, ES, Brazil 3Laboratório de Biologia Pesqueira, Universidade Estadual de Feira de Santana
Km-3, BR 116 Campus Universitário, s/n, Feira de Santana, 44031-460, BA, Brazil 4In memoriam
ABSTRACT. Twenty-nine species from 11 genera of Myctophidae were taken in daytime midwater and bottom trawl hauls off eastern Brazil (11o-22oS). Trawls were performed aboard the French R/V Thalassa to depths from 19 to 2271 m, including samples from shelf, slope and in the vicinity of oceanic banks and seamounts. Diaphus garmani was the most abundant species, accounting for 84% of all identified individuals and with four other species (D. dumerilii, D. brachycephalus, D. perspicillatus and Myctophum obtusirostre) accounted for >95% of all myctophids caught. Regarding longitudinal distribution patterns, 16 species are broadly tropical, seven tropical, three subtropical, two temperate and one amphi-Atlantic. For the most abundant and frequent species, highest abundances were associated mainly with cold waters, either South Atlantic Central Water or Antarctic Intermediate Water. Non-metric multidimensional scaling based on species presence-absence in the samples and oceanographic conditions was used to identify spatial distribution of myctophid assemblages. Three assemblages were identified in the studied area: north of Abrolhos Bank, south of Abrolhos Bank, and seamounts. Keywords: Myctophidae, fish assemblages, seamounts, southwest Atlantic.
Peces linterna (Myctophidae) de la costa oriental de Brasil, Atlántico suroeste
RESUMEN. Veintenueve especies de 11 géneros pertenecientes a la familia Myctophidae fueron recolectados mediante faenas diurnas de arrastre de fondo y arrastre de mediagua en la costa oriental brasileña (11o-22oS). Las faenas fueron realizadas con el buque oceanográfico Thalassa entre 19-2271 m de profundidad, cubriendo las regiones de la plataforma continental, talud, bancos oceánicos y montes submarinos. Diaphus garmani fue la especie más abundante (84%) y en conjunto con otras cuatro especies (D. dumerilii, D. brachycephalus, D. perspicillatus, Myctophum obtusirostre) representaron más del >95% de los mictófidos capturados. De acuerdo a los patrones de distribución longitudinal, 16 especies son de distribución tropical, siete tropical, tres son subtropicales, dos de zonas templadas y una anfi-Atlántica. Para las especies más abundantes y frecuentes, sus mayores abundancias estuvieron asociadas principalmente con aguas frías, especificamente con el Agua Central del Atlántico Sur y con el Agua Intermedia Antártica. Para definir la distribución espacial de las asociaciones de mictófidos basadas en la presencia y ausencia de las especies y su relación con las condiciones oceanográficas imperantes, se aplicó el análisis de ordenación MDS. Los resultados obtenidos indican la presencia de tres ensambles en el área de estudio: norte del Banco Abrolhos, sur del Banco Abrolhos y montes submarinos. Palabras clave: Myctophidae, asociaciones de peces, montes submarinos, Atlántico suroeste.
___________________ Corresponding author: Adriana C. Braga ([email protected])

246 Latin American Journal of Aquatic Research
INTRODUCTION
Myctophids are typically pelagic fish of the open ocean (Hartel & Craddock, 2002) and, together with members of Sternoptychidae, Gonostomatidae, Chau-liodontidae and the suborder Stomiatoidei, represent the characteristic families in mesopelagic depths (Haedrich, 1997). Among these, Myctophidae is the dominant family (Nafpaktitis et al., 1977) and the most speciose, including almost 250 species referred to as lanternfish due to a variety of luminous organs, among which photophores are the most characteristic (Nelson, 2006). Lanternfish range from arctic to antarctic waters, and from the surface at night to depths exceeding 2000 m (Nafpaktitis et al., 1977). The family also includes species known as pseudoceanic, associated with continental shelf and slope regions and in the neighbourhood of oceanic islands (Hulley, 1981). Continental slopes are particularly important due to the topographic and hydrographic gradients, and are considered areas of dynamic tension (Merrett & Haedrich, 1997). Continental slopes also encompass a wider set of physical niches, and provide an environment for the development of a recognizable and trophically-dependent community of benthic and benthopelagic fish (Haedrich et al., 1980). Down-slope zonation of lanternfish may result from the combined effects of depth and water column structure (Hulley, 1992).
Much of the current knowledge on Atlantic myctophids resulted from the study of the collections of the Woods Hole Oceanographic Institution (WHOI) (Nafpaktitis et al., 1977) and Institut für Seefischerei (Hulley, 1981). In the southwestern Atlantic (0º-60ºS), 79 species (22 genera) were collected during the 11th cruise of the R/V Akademik Kurchatov (Parin & Andriyashev, 1972; Parin et al., 1974). The distribu-tion of 40 of these species, with respect to the water masses between 40º30’-47º00’S, was further exa-mined (Konstantinova et al., 1994; Figueroa et al., 1998). Off the coasts of Suriname and French Guiana, 15 species from 7 genera were reported (Uyeno et al., 1983). In the Eastern Central Atlantic, Wienerroither et al. (2009) reported 52 species for the Canarian archipelago.
Although relatively few documents have been published on myctophids from low latitude oligo-trophic waters (Nafpaktitis & Nafpaktitis, 1969; Hulley, 1972, 1981; Clarke, 1973; Gartner et al., 1987), high diversity is apparent (Backus et al., 1977). Figueiredo et al. (2002) and Santos (2003) reported 37 species captured in 133 midwater trawl hauls off southeastern and southern Brazil (22º-34ºS), with sampling effort concentrated from 100 to 500 m. From
Rio Real, BA to Cabo São Tomé, RJ (12-22oS), 27 larval lanternfish species were identified in 658 samples collected in depths ≤200 m (Castro et al., 2010), and Myctophidae was the most diverse family at epi- and mesopelagic depths (Braga et al., 2007).
The present study provides knowledge about southwestern Atlantic lanternfish, including samples from Vitória-Trindade chain, an area understudied (Clark et al., 2010), adjacent to a transition zone between tropical Atlantic and temperate South America biota. We report the occurrence and distribution of lanternfish in relation to oceanographic conditions and attempt to examine whether species associations are spatially different.
MATERIALS AND METHODS
Study area The eastern coast of Brazil is a typical oligotrophic system (Gaeta et al., 1999), and the most important oceanic surface feature is the southward flowing Brazil Current (BC: 22-27oC, 36.5-37.0 psu), the warm western boundary current of the subtropical gyre (Silveira et al., 2001). The continental shelf of the study area (11-22ºS) extends for only 8 km off Salvador (França, 1979) and widens to the south to form the Royal Charlotte Bank (RCB, 16oS) and the Abrolhos Bank (AB, 18oS). The Vitória-Trindade chain that extends along 20.5ºS comprises seamounts that have shallow summits at depths of 34-76 m (Miloslavich et al., 2011). These topographic barriers produce a complex hydrographic structure including vortices, upwellings and vertical mixing processes, which alter the oligotrophic condition mainly south of AB (Ciotti et al., 2007; Valentin et al., 2007). The subsurface layer beneath the BC is occupied by the cold and nutrient-rich South Atlantic Central Water (SACW: 6.0-18.5oC, 34.5-36.0 psu) flowing north, between 400-700 m (Schmid et al., 1995). Periodic upwelling of SACW beyond the deep thermocline (80-120 m) enhances primary production (Nonaka et al., 2000). In the subthermocline region there are three major water masses, Antarctic Intermediate Water (AAIW) near 800-900 m, North Atlantic Deep Water (NADW) centered at about 2500 m, and Antarctic Bottom Water (AABW) below about 3500 m (Hogg & Owens, 1999).
Biological sampling The studied material was obtained with midwater and demersal trawls, both performed only during the day, on the continental shelf, continental slope and near oceanic banks and seamounts off eastern Brazil (Fig. 1). Table 1

Lanternfish from Brazil 247
Figure 1. Study area and location of the sampling stations. Table 1. Number of stations, depth range, effort and characteristics of nets used in midwater and demersal sampling off eastern Brazil and details of myctophids catch.
Midwater net Demersal net Number of trawls 50 68 Number of stations (with myctophids) 12 53 Depth range (m) 19 - 910 100 - 2,271 Horizontal opening during operation (m) 24 - 56 28 - 45.5 Vertical opening during operation (m) 25 - 42 3 - 10.6 Net size (m) 191 80.5 Codend mesh size (mm) 20 20 Total sampling effort (hour) 40:59 h 63:41 h Total catch (number) 28,645 2,720 Number of species 17 26 Number of exclusive species 3 12
summarizes the characteristics of midwater and demersal sampling, effort and catch of myctophids. Samples were taken aboard the French R/V Thalassa in May-July 1999 (midwater) and May-June 2000 (demersal). Both cruises were developed in the context of the Brazilian fishery research program REVIZEE, in scientific cooperation with IFREMER
(Institut Français de Recherche pour l’Exploitation de la Mer).
During the midwater cruise, the collections were obtained using a large midwater net (292 m circum-ference and 191 m long). During operations, maxi-mum horizontal and vertical opening was 56 and 25 m, respectively. Mesh sizes were 8000 mm in the

248 Latin American Journal of Aquatic Research
wings and 20 mm in the cod-end. A total of 62 pelagic midwater trawls were towed at depths from 19 to 910 m, among which 50 had myctophid catches (n = 28,645). Hauls were undertaken on acoustically detected fish aggregations.
During the demersal cruise, the individuals were obtained using a bottom-trawl net with a 26.8 m head rope and 47.2-m foot rope, equipped with 40 rubber bobbins (rockhoppers) attached to the foot-rope. Mesh sizes were 110 mm for the wings and 20 mm for the cod-end. During the fishing operations, the horizontal and vertical mouth openings ranged between 28.0 and 45.5 m and from 3.0 to 10.6 m, respectively.
Demersal trawls were decided based on the availability of trawlable bottoms. A total of 58 stations yielded more than 45,000 specimens, from which 2,720 specimens of myctophids were recorded in 47 stations, ranging in depth from 100 to 2,271 m. On both cruises, trawl depth was acoustically controled using SCANMAR system, which was also used to access trawl geometry, including the horizontal opening and distance from net to bottom. The vertical opening and its distance in relation to the bottom was controled by the Ossian Trawl-Eye 49 KHz transducer fixed in the headrope. These systems allowed maintaining the net operating at specific depths during fishing and further classify the stations into different depth strata.
Water mass distribution in the study area Temperature and salinity profiles (n = 116) recorded during the midwater cruise were used to analyse the horizontal distribution of temperature contours at the 200 m isobath (e.g., beginning of the mesopelagic zone), throughout the studied area (11-22oS). Water masses distribution was inferred from a T-S diagram using data compiled from the National Oceanographic Data Centre (Brazilian Navy), including CTD profiles down to 5,000 m. These data was sorted from the same geographic area and period (May-July) and processed using Ocean Data View (ODV) software.
Identification of species and abundance The ichthyological material analysed was identified using identification keys provided by Nafpaktitis et al. (1977), Hulley (1986), McEachran & Fechhelm (1998), and Wang & Tsung-Chen (2001). Measure-ments and counts were made according to Nafpaktitis & Nafpaktitis (1969). Photophore terminology followed Parr (1929) and Nafpaktitis & Nafpaktitis (1969). A representative number of specimens were deposited in the collections of Museu Nacional do Rio de Janeiro (MNRJ) and Museu Oceanográfico do Vale do Itajaí (MOVI).
Species abundance followed primarily the classification proposed by Gartner et al. (1987) based on total number of specimens captured [abundant (>500 individuals), common (100-500 individuals), uncommon (10-100 individuals), rare (<10 indivi-duals)], with an additional category, extremely abundant (>2,000 individuals).
Distribution The distribution of myctophid assemblages was analysed with non-metric multidimensional scaling (Clarke & Warwick, 2001) using the Sorensen similarity index calculated with species presence-absence in the samples. The final matrix used in the ordination was composed by 29 species and 53 samples (9 midwater and 44 demersal trawls). Stations with only one species (n = 11) were excluded from the matrix. A non-quantitative index was chosen due to differences in net sizes and sampling strategies between midwater and demersal fishing.
RESULTS
Water mass distribution in the study area The thermal structure of the water column during the two cruises, both during winter, was similar. The water temperature ranged from 24-28ºC at surface, 20-24ºC at 100 m depth, 15.7-16.1ºC at 200 m, 8-9.5ºC at 500 m, and was always <3ºC beyond 1,000 m depth. Tropical Water (TW) from BC (T > 20oC; S > 36.2 psu) was present at surface (29-68 m), and the subtropical SACW with lower temperatures (6-18.5oC) and salinities (34.6-36.0 psu) occuppied the subsurface layer (118-624 m) (Fig. 2).
AAIW was present mainly from 700 m (2.0-4.0oC and 34.2-34.6 psu) to eventually 1,500 m, while NADW was found at depths between 1,500-2,000 m (3.0-4.0oC; 34.6-35.0 psu). At depths greater than 2,000 m, the top layer of the AABW (3.0-3.5oC; 34.6-35.0 psu) was found.
The horizontal distribution of the water temperature at 200 m (Fig. 3) showed that this depth was occuppied by SACW throughout the studied area, with an east-west gradient of decreasing temperatures. The lowest temperatures (14-15ºC) were identified between 13-15oS off Salvador, and near RCB, AB and the Vitória Channel, reflecting the upwelling of SACW as a result of BC meandering along the shelf edge and seamounts.
Distribution of catches Myctophids were more frequent in demersal (78%) than in midwater (24%) trawls, although higher

Lanternfish from Brazil 249
Figure 2. Water masses recorded in the present study, according to depth. TW: Tropical Water, SACW: South Atlantic Central Water, AAIW: Antartic Intermediate Water, NADW: North Atlantic Deep Water, AABW: Antartic Bottom Water. abundances in midwater catches resulted from acoustically detected schools (Fig. 4). The total number of myctophids per trawl ranged from 1 to 12,415, although almost always <50 ind trawl-1 occurred in demersal trawls (85%). Midwater trawl catches were mostly >200 ind trawl-1, including massive catches (>1,000 ind trawl-1) near the Royal Charlotte Bank and seamounts (Minerva, Hotspur).
The number of species/trawl ranged from 1-13 (Fig. 5), but captures of more than 5 species/trawl were more frequent in demersal trawls (21%) than in midwater trawls (17%). The maximum number of species per trawl (13) was similar in demersal and midwater trawls. Midwater trawls near seamounts south of Abrolhos Bank yielded the highest number of species (Vitória: 13 spp.; Davis: 7 spp.). Demersal trawls that yielded the highest number of species occurred at the southernmost part of the area at 624.5 m (13 spp.) and at 2,126 m off Salvador (10 spp.). Nine trawls yielded 6-9 species trawl-1. Among these, six were performed between 13-14ºS at depths from 522 to 1,929 m, and three were performed between 19-20ºS at depths from 895 to 1,649 m.
Species data From a total of 31,365 myctophids examined, all but 278 (0.9%) were identifiable to species. Table 2 lists
the species grouped according to abundance, along with their totals and frequency of occurrence in midwater and demersal trawls, depth of occurrence and size range. The identified material comprised 11 genera and 29 species. The top five most abundant species comprised approximately 95% of the total number of individuals. Only one species was extremely abundant, 4 were abundant, 5 were common, 8 were uncommon and 11 were rare. Diaphus dumerilii was the most frequent species, both in demersal (62%) and midwater (66%) trawls. The majority of species (79%) had broadly tropical and tropical affinities (as indicated by Hulley, 1981), while species with subtropical and temperate affinities were poorly represented and occurred in very low numbers (1-17 ind).
Assemblages Three groups of trawl stations were identified in MDS ordination (Fig. 6): North of Abrolhos Bank (NAB), South of Abrolhos Bank (SAB) and Seamounts (SEAM). Assemblages were significantly different (P = 0.02) when similarities between SEAM x NAB (P = 0.014) and SEAM x SAB (P = 0.030) were compared (ANOSIM Global R: 0.181).
Although NAB and SAB did not significantly differ (P = 0.255), a change in dominance was evident
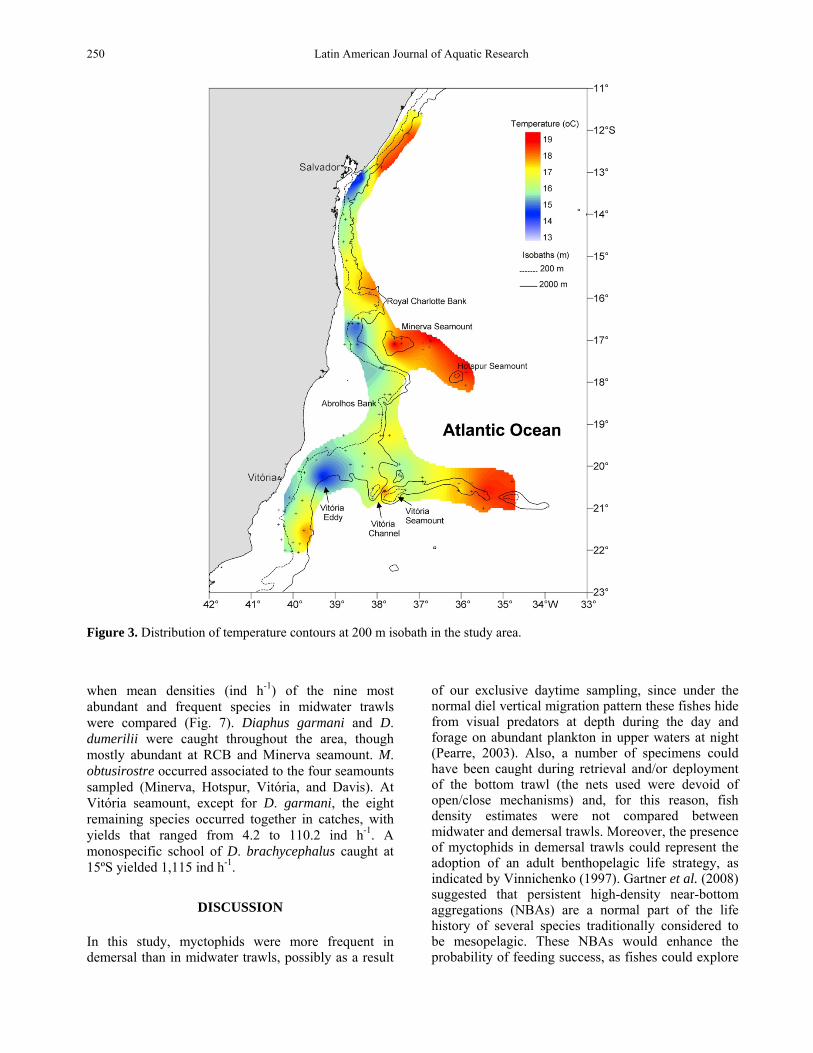
250 Latin American Journal of Aquatic Research
Figure 3. Distribution of temperature contours at 200 m isobath in the study area. when mean densities (ind h-1) of the nine most abundant and frequent species in midwater trawls were compared (Fig. 7). Diaphus garmani and D. dumerilii were caught throughout the area, though mostly abundant at RCB and Minerva seamount. M. obtusirostre occurred associated to the four seamounts sampled (Minerva, Hotspur, Vitória, and Davis). At Vitória seamount, except for D. garmani, the eight remaining species occurred together in catches, with yields that ranged from 4.2 to 110.2 ind h-1. A monospecific school of D. brachycephalus caught at 15ºS yielded 1,115 ind h-1.
DISCUSSION
In this study, myctophids were more frequent in demersal than in midwater trawls, possibly as a result
of our exclusive daytime sampling, since under the normal diel vertical migration pattern these fishes hide from visual predators at depth during the day and forage on abundant plankton in upper waters at night (Pearre, 2003). Also, a number of specimens could have been caught during retrieval and/or deployment of the bottom trawl (the nets used were devoid of open/close mechanisms) and, for this reason, fish density estimates were not compared between midwater and demersal trawls. Moreover, the presence of myctophids in demersal trawls could represent the adoption of an adult benthopelagic life strategy, as indicated by Vinnichenko (1997). Gartner et al. (2008) suggested that persistent high-density near-bottom aggregations (NBAs) are a normal part of the life history of several species traditionally considered to be mesopelagic. These NBAs would enhance the probability of feeding success, as fishes could explore

Lanternfish from Brazil 251
Figure 4. Total catch (in numbers) of myctophids in a) midwater trawls, b) demersal trawls. Triangles represent stations without myctophids.
Figure 5. Number of myctophid species in a) midwater trawls, b) demersal trawls. Triangles represent stations without myctophids. food supplies in a two dimensional search area (i.e., near bottom).
Among the 29 myctophid species captured in this study, tropical and broad tropical distribution patterns
dominated. Species with temperate and subtropical affinities were restricted to hauls that sampled depths below 700 m, which is the upper limit of AAIW in the area (Hogg & Owens, 1999). Although this number is

252 Latin American Journal of Aquatic Research
Table 2. Lanternfish catch in midwater and demersal trawls off eastern Brazil (frequency in parentheses). Tropical: distributed only in tropical waters, Subtropical: distributed between 20o and 35o in the western South Atlantic, Broadly Tropical: distributed in both tropical and subtropical waters, Amphi-Atlantic: restricted to warm subtropical waters. Biogeographical definitions according to Hulley (1981).
lower than that recorded off southeastern and southern Brazil between 22-34ºS (41 species: Figueiredo et al., 2002; Bernardes et al., 2005), if larval occurrence is considered (Bonecker & Castro, 2006), ten more species could be added (Benthosema suborbitale, Centrobranchus nigroocelattus, Diaphus anderseni, Diogenichthys atlanticus, Hygophum macrochir, Hygophum taaningi, Lampanyctus nobilis, Lepidophanes gaussi, Nannobrachium cuprarium, Notolychnus valdiviae) and the numbers be similar. All myctophids spend their larval stages in the productive epipelagic
zone (Sassa et al., 2004), moving to the mesopelagic zone after reaching the juvenile stage (Clarke, 1973).
Eastern and south-southeastern Brazilian waters share 12 of 16 myctophid genera. Regarding the four genera exclusive within each area, broad or tropical genera (Centrobranchus, Diogenichthys, Lampadena, Notolychnus) occur between 11-22ºS, while cold-water genera associated with the STC (Electrona, Gymnoscopelus, Lampichthys, Scopelopsis) occur between 22-34ºS. The diversity within each area (11-22ºS: 39 species, 16 genera; 22-34ºS: 41 species, 16
Total catch
(n) Midwater trawls
(n = 12) Demersal trawls
(n = 53) Standard length
(mm) Distribution
pattern
>2,000 individuals Diaphus garmani 26,199 24,953 (6) 1,246 (21) 33-60 Tropical 500-2,000 individuals Diaphus dumerilii 1,703 1,192 (8) 511 (33) 46-105 Tropical Diaphus brachycephalus 778 761 (4) 17 (6) 25-52 Broadly Tropical Diaphus perspicillatus 614 436 (6) 178 (7) 40-86 Broadly Tropical Myctophum obtusirostre 575 336 (6) 239 (28) 34-98 Tropical 100-500 individuals Lepidophanes guentheri 388 155 (3) 233 (5) 25-76 Tropical Ceratoscopelus warmingii 171 51 (3) 120 (10) 43-76 Broadly Tropical Diaphus adenomus 139 - 139 (8) 83-203 Amphi-Atlantic Diaphus problematicus 107 11 (2) 96 (14) 68-95 Tropical Diaphus fragilis 106 56 (1) 50 (3) 69-95 Tropical 10-100 individuals Diaphus splendidus 81 16 (3) 65 (3) 38-92 Broadly Tropical Myctophum affine 42 38 (1) 4 (3) 28-44 Tropical Myctophum selenops 42 20 (2) 22 (10) 48-62 Broadly Tropical Lampadena luminosa 31 - 31 (14) 115-190 Tropical Diaphus lucidus 28 10 (1) 18 (3) 73-103 Broadly Tropical Bolinichthys distofax 17 - 17 (10) 71-85 Subtropical Bolinichthys photothorax 17 - 17 (5) 40-60 Tropical Notoscopelus caudispinosus 15 2 (1) 13 (6) 106-132 Broadly Tropical <10 individuals Symbolophorus rufinus 6 6 (2) - 50-72 Broadly Tropical Diaphus bertelseni 3 - 3 (3) 44-60 Broadly Tropical Diaphus meadi 3 - 3 (3) 52-59 Temperate Diaphus cf. ostenfeldi 3 - 4 (2) 98-112 Temperate Hygophum reinhardti 3 3 (1) - 39-41 Broadly Tropical Lampanyctus alatus 3 - 3 (1) 93-107 Broadly Tropical Lobianchia gemellari 3 - 3 (3) 44-69 Broadly Tropical Myctophum nitidilum 3 - 3 (3) 39-73 Broadly Tropical Notoscopelus resplendens 3 - 3 (1) 54-59 Broadly Tropical Hygophum hygomii 2 - 2 (2) 50-58 Subtropical Myctophum phengodes 1 1 (1) - 49 Subtropical

Lanternfish from Brazil 253
Figure 6. Multidimensional scaling ordination (MDS) plots of myctophid fishes, based on Sorensen similarity and presence-absence of species. NAB: North Abrolhos Bank <18oS, SAB: South Abrolhos Bank >19oS, SEAM: Seamounts.
Figure 7. Relative abundance (ind h-1) in percent, of the nine most abundant and frequent myctophids caught in midwater trawls. NAB: North Abrolhos Bank <18oS, SAB: South Abrolhos Bank >19oS, SEAM: Seamounts.
254 Latin American Journal of Aquatic Research
genera) is comparable to that reported for Hawaii (47 species, 18 genera; Clarke, 1973), eastern Gulf of Mexico, GOM (49 species, 17 genera; Gartner et al., 1987) and north-central GOM (38 species, 17 genera; Ross et al., 2010). Collectively, Brazilian waters have a high diversity of myctophids (79 species, 23 genera: Menezes et al., 2003) comparable to that registered in the North Atlantic (82 species, 20 genera: Nafpaktitis et al., 1977). These numbers include the 30 species reported by Hulley (1981) for waters beyond 3,000 m during the research cruises of FRV “Walther Herwig” to South America (1966-1976). Among these, many are typically associated with the STC, the frontal zone where subantarctic and subtropical waters meet, which is a circumglobal feature of the Southern Ocean (Williams et al., 2001). The STC is a major biogeographic boundary, as well as a region of enhanced productivity (Pakhomov et al., 2000), and much of the plankton and fish fauna in this region have a circumglobal distribution (McGinnis, 1982; Pakhomov et al., 2000).
Excluding two hauls that sampled massive aggregations of D. garmani and captured 23,502 individuals, the top four species off eastern Brazil between 11-22ºS (D. garmani, D. dumerilii, D. brachycephalus, D. perspicillatus) comprised 76.4% of the specimens caught. Off southeastern and southern Brazil between 22-34ºS, the three dominant species (D. dumerilii, L. guentheri, Symbolophorus barnardi) comprised 74.9% (Figueiredo et al., 2002; Bernardes et al., 2005). Both values were similar to those reported for the contribution of the top seven species off Hawaii (75.5%; Clarke, 1973) and eastern GOM (74.7%; Gartner et al., 1987), and of the top six species off north-central GOM (75.1%; Ross et al., 2010). Diaphus is the most species among myctophid genera (60 species; Nafpaktitis et al., 1977) and 19 species are reported for Brazil (Santos & Figueiredo, 2008). In ichthyoplankton surveys off eastern Brazil, Diaphus spp. larvae integrated the transitional and oceanic assemblages (Nonaka et al., 2000; Castro et al., 2010), and the numeric dominance of adults between 11-22ºS probably reflects the higher sampling effort in deeper waters when compared to 22-34ºS, where sampling was shallower (<500 m: Figueiredo et al., 2002).
A tendency of increasing species number with depth was observed, and since temperature correlates to lanternfish distribution (Brandt, 1983), this result could be associated with the marked thermal structure of the water column. During hauls that sampled depths higher than 1,500 m between 11º-22ºS, the net was towed through four waters masses (BC, SACW, AAIW, NADW), possibly increasing the probability
of catching a higher number of species. Hulley (1992) also observed an increase in lanternfish species richness and in the complexity of the distributions across the slope, possibly as the result of a higher structuring of the water column.
The presence of a variety of reliefs between 11-22ºS adds topographic complexity, causing island-induced disturbance, in which upwelled nutrients promote primary and secondary production in the island wake (Bonecker et al., 1992, 1993) and probably act to affect the distribution of the mesopelagic fauna. Our hydrographic results showed the occurrence of SACW at 200 m between 13-15ºS, and near RCB, AB and the Vitória Channel; this possibly reflects the permanent cyclonic eddy that Schmid et al. (1995) detected to be formed south of the AB from the meandering movement of the BC after passing through the Vitória Channel. The spatial distribution of the SACW in the area studied seems to explain the distribution of the more speciose trawls and, for some species, the highest densities associated with seamounts and banks.
While D. dumerilii was the most frequent and second most abundant species in our study, it was dominant between 22-34ºS (47%; Figueiredo et al., 2002) and seemed to be important in the trophic relation on the slope, once it was found in the stomach contents of several demersal bony fish of STC ecosystem (Haimovici et al., 1994). Near RCB this species was most abundant in rather shallow depths (25-34 m), indicating a certain degree of land association, as it was observed by Wienerroither et al. (2009). Diaphus dumerilii dominated both the water column (deep scattering layer) and the bottom (NBAs) on deep coral banks off Cape Lookout middle slope, North Carolina (Gartner et al., 2008).
The occurrence of mesopelagic species in shallow waters is ascribed to the abrupt depth changeover around islands of volcanic origin (Uiblein & Bordes, 1999), and the direct interaction between pelagic and demersal organisms at the interfaces between submer-ged bottom features establishes and important link between epipelagic waters and the deep benthos (Marshall & Merrett, 1977). Lanternfish may be an important prey item for large pelagic species, abundant in longline catches from Vitória-Trindade seamounts (Olavo et al., 2005). Future research in the area should address the study of oceanic food webs.
ACKNOWLEDGEMENTS
The authors wish to express their gratitude to the Captains (Hervé Piton and Paul-Ives Guilcher) and

Lanternfish from Brazil 255
crew of the R/V Thalassa for their collaboration. Special thanks are given to the Chief Scientists and coordinators of the Brazilian cruises aboard R/V Thalassa, for the facilitation of logistics and successful integration of the multidisciplinary teams during cruises Bahia-1 and Bahia-2. Two anonymous reviewers made numerous comments to improve the manuscript.
REFERENCES
Backus, R.H., J.E. Craddock, R.L. Haedrich & R.H. Robison. 1977. Atlantic mesopelagic zoogeography. In: R.H. Gibbs (ed.). Fishes of the western North Atlantic. Mem. Sears Found. Mar. Res., 1(7): 266-287.
Bernardes, R.A., J.L. Figueiredo, A.R. Rodrigues, L.G. Fischer, C.M. Vooren, M. Haimovici & C.L.D.B. Rossi-Wongtschowski. 2005. Peixes da zona econômica exclusiva da região sudeste-sul do Brasil. Levantamento com armadilhas, pargueiras e rede de arrasto de fundo. Edusp, São Paulo, 295 pp.
Bonecker, A.C.T. & M.S. Castro. 2006. Atlas de larvas de peixes da região central da zona econômica exclusiva brasileira. Museu Nacional, Rio de Janeiro (Série Livros n. 19), 216 pp.
Bonecker, S.L.C., C.R. Nogueira, A.C.T. Bonecker, L.H.S. Santos, M.V. Reynier & D.R. Tenenbaum. 1992-1993. Estudo hidrográfico e planctonológico da região entre Cabo Frio (Rio de Janeiro) e o Arquipélago de Abrolhos (BA). Nerítica 7(1-2): 71-86.
Braga, A.C., P.A.S. Costa, A.T. Lima, G.W. Nunan, G. Olavo & A.S. Martins. 2007. Padrões de distribuição de teleósteos epi- e mesopelágicos na costa central (11-22oS) brasileira. In: P.A.S. Costa, G. Olavo & A.S. Martins (eds.). Biodiversidade da fauna marinha profunda da costa central brasileira. Museu Nacional, Rio de Janeiro, (Série Livros n. 24), pp. 63-86.
Brandt, S.B. 1983. Temporal and spatial patterns of lanternfish (family Myctophidae) communities associated with a warm-core eddy. Mar. Biol., 74: 231-244.
Castro, M.S., W.J. Richards & A.C.T. Bonecker. 2010. Occurrence and distribution of larval lanternfish (Myctophidae) from the southwest Atlantic Ocean. Zoologia, 27(4): 541-553.
Ciotti, A.M., E. Gonzalez-Rodriguez, L. Andrade, R. Paranhos & W.F. Carvalho. 2007. Clorofila-a, medidas bio-ópticas e produtividade primária. In: J.L. Valentin (ed.). Características hidrobiológicas da região central da zona econômica exclusiva brasileira (Salvador, BA, ao Cabo de São Tomé, RJ). Série
Documentos REVIZEE/SCORE-Central, Ministério do Meio Ambiente, Brasília, pp. 61-72.
Clark, M.R., A.A. Rowden, T. Schlacher, A. Williams, M. Consalvey, K.I. Stocks, A.D. Rogers, T.D. O’Hara, M. White, T.M. Shank & J.M. Hall-Spencer. 2010. The ecology of seamounts: structure, function, and human impacts. Ann. Rev. Mar. Sci., 2: 253-278.
Clarke, T.A. 1973. Some aspects of the ecology of lanternfishes (Myctophidae) in the Pacific Ocean near Hawaii. Fis. B-NOAA, 71(2): 401-433.
Clarke, K.R. & R.M. Warwick. 2001. Primer E (5) Computer Program. Natural Environmental Research council, Plymouth.
Figueiredo, J.L., A.P. Santos, N. Yamaguti, R.A. Bernardes & C.L.D.B. Rossi-Wongtschowski. 2002. Peixes da Zona Econômica Exclusiva da região sudeste-sul do Brasil. Edusp, São Paulo, 242 pp.
Figueroa, D.E., J.M.D. de Astarloa & P. Martos. 1998. Mesopelagic fish distribution in the southwest Atlan-tic in relation to water masses. Deep-Sea Res., 45: 317-332.
França, J.J.C. 1979. Geomorfologia da margem continental leste brasileira e da bacia oceânica adjacente. PETROBRAS-CENPES-DINTEP. (Série Projeto REMAC, 7) Rio de Janeiro, pp. 89-127.
Gaeta, S.A., J.A. Lorenzetti, L.B. Miranda, S.M.B. Susini-Ribeiro, M. Pompeu & C.E.S. Araujo. 1999. The Vitória eddy and its relation to the phytoplankton biomass and primary productivity during the austral fall of 1995. Arch. Fish. Mar. Res., 47(2/3): 253-270.
Gartner, J.V., T.L. Hopkins, R.C. Baird & D.M. Milliken. 1987. The lanternfishes (Pisces: Mycto-phidae) of the eastern Gulf of Mexico. Fish. B-NOAA, 85(1): 81-98.
Gartner, J.V., K.J. Sulak, S.W. Ross & A.M. Necaise. 2008. Persistent near-bottom aggregations of mesopelagic animals along the North Carolina and Virginia continental slopes. Mar. Biol., 153: 825-841.
Haedrich, R.L. 1997. Distribution and population ecology. In: D.J. Randall & A.P. Farrell (eds.). Deep-Sea fishes. Academic Press, London, pp. 79-114.
Haedrich, R.L., G.T. Rowe & P.T. Polloni. 1980. The megabenthic fauna in the deep sea south of New England, USA. Mar. Biol., 57: 165-179.
Haimovici, M., A.S. Martins, J.L. Figueiredo & P.C. Vieira. 1994. Demersal bony fish of the outer shelf and upper slope of the southern Brazil Subtropical Convergence Ecosystem. Mar. Ecol. Prog. Ser., 108: 59-77.
Hartel, K.E. & J.E. Craddock. 2002. Order Mycto-phiformes. In: K.E. Carpenter (ed.). The living

256 Latin American Journal of Aquatic Research
marine resources of the western central Atlantic. Vol. 2: Bony fishes part 1 (Acipenseridae to Gram-matidae). FAO Species identification guide for fishery purposes. ASIH Spec. Publ. Nº5. Rome, FAO, pp. 942-951.
Hogg, N.G. & W.B. Owens. 1999. Direct measurement of the deep circulation within the Brazil Basin. Deep-Sea Res., 46: 335-353.
Hulley, P.A. 1972. A report on the mesopelagic fish collected during the deep-sea cruises of R.S. Africana II, 1961-1966. Ann. S. Afr. Mus., 60(6): 197-236.
Hulley, P.A. 1981. Results of the research cruises of FRV Walther Herwig to South America. LVIII. Family Myctophidae (Osteichthyes, Myctophifor-mes). Arch. Fischwiss, 31(1): 1- 300.
Hulley, P.A. 1986. Family Myctophidae. In: M.M. Smith & P.C. Heemstra (eds.). Smith’s Sea Fishes. Springer-Verlag, Berlin, pp. 282-321.
Hulley, P.A. 1992. Upper-slope distributions of oceanic lanternfishes (family Myctophidae). Mar. Biol., 114(3): 365-383.
Konstantinova, M.P., A.V. Remesio & P.P. Fedulov. 1994. The distribution of myctophids in the southwest Atlantic in relation to water structure and dynamics. J. Ichthyol., 34(7): 151-160.
Marshall, N.B. & N.R. Merrett. 1977. The existence of a benthopelagic fauna in the deep-sea. A voyage of discovery. Deep-Sea Res. George Deacon 70th Anniversary Volume, (Suppl.) 483-497.
McEachran, J.D. & J.D. Fechhelm. 1998. Fishes of the Gulf of Mexico. Volume I: Myxiniformes to Gaste-rosteiformes. University of Texas Press, Austin, 1120 pp.
McGinnis, R.F. 1982. Biogeography of lanternfishes (family Myctophidae) south of 30oS. Antarct. Res. Ser. XII, 35: 1-110.
Menezes, N.A., P.A. Buckup, J.L. Figueiredo & R.L. Moura. 2003. Catálogo das espécies de peixes marinhos do Brasil. Museu de Zoologia USP, São Paulo, 160 pp.
Merrett, N.R. & R.L. Haedrich. 1997. Deep-sea demersal fish and fisheries. Chapman & Hall, London, 282 pp.
Miloslavich, P., E. Klein, J.M. Díaz, C.E. Hernández, G. Bigatti, L. Campos, F. Artigas, J. Castillo, P.E. Penchaszadeh, P.E. Neill, A. Carranza, M.V. Retana, J.M. Díaz de Astarloa, M. Lewis, P. Yorio, M.L. Piriz, D. Rodríguez, Y. Yoneshigue-Valentin, L. Gamboa, & A. Martín. 2011. Marine biodiversity in the Atlantic and Pacific coasts of South America: knowledge and gaps. PLoS One. 2011; 6(1): e14631. doi: 10.1371/journal.pone.0014631.
Nafpaktitis, B.G. & M. Nafpaktitis. 1969. Lanternfishes (Family Myctophidae) collected during cruises 3 and 6 of the R/V "Anton Bruun" in the Indian Ocean. Bull. Los Angeles County Mus. Nat. Hist., Science, 5: 79.
Nafpaktitis, B.G., R.H. Backus, J.E. Craddock, R.L. Haedrich, B.H. Robison & C. Karnella. 1977. Family Myctophidae. In: Fishes of the western North Atlantic. Mem. Sears Found. Mar. Res., 1(7): 13-265.
Nelson, J.S. 2006. Fishes of the world. John Wiley & Sons, New York, 601 pp.
Nonaka, R.H., Y. Matsuura & K. Suzuki. 2000. Seasonal variation in larval fish assemblages in relation to oceanographic conditions in the Abrolhos Bank region off eastern Brazil. Fish. B-NOAA, 98: 767-784.
Olavo, G., P.A.S. Costa & A.S. Martins. 2005. Prospecção de grandes peixes pelágicos na região central da ZEE brasileira entre o Rio Real-BA e o Cabo de São Tomé-RJ. In: P.A.S. Costa, A.S. Martins & G. Olavo (eds.). Pesca e potenciais de exploração de recursos vivos na região central da Zona Econômica Exclusiva brasileira. Rio de Janeiro: Museu Nacional (Série Livros Nº13), pp. 167-202.
Pakhomov, E.A., R. Perissinotto, C.D. McQuaid & P.W. Foroneman. 2000. Zooplankton structure and grazing in the Atlantic sector of the Southern Ocean in late austral summer 1993. Part 1. Ecological zonation. Deep-Sea Res. I, 47: 1663-1686.
Parin, N.V. & A.P. Andriyashev. 1972. Ichthyological studies during the 11th cruise of the Research Vessel Akademik Kurchatov in the South Atlantic. J. Ichthyol., 12(5): 883-886.
Parin, N.V., A.P. Andriyashev, O.D. Borodulina & V.M. Tchuvasov. 1974. Midwater fishes of the south western Atlantic Ocean. Akad. Nauk. CCCP, [In Russian, with English abstract.] Moscow, 98: 76-140.
Parr, A.E. 1929. Notes on the species of myctophine fishes represented by type species in the United States National Museum. Proc. U.S. Natl. Mus., 76: 1-47.
Pearre, S. 2003. Eat and run? The hunger/satiation hypothesis in vertical migration: history, evidence and consequences. Biol. Rev., 78: 1-79.
Ross, S.W., A.M. Quattrini, A.Y. Roa-Varón & J.P. McClain. 2010. Species composition and distri-butions of mesopelagic fishes over the slope of the north-central Gulf of Mexico. Deep-Sea Res. II, 57: 1926-1956.
Santos, A.P. 2003. Estudos sobre a taxonomia e a distribuição dos peixes da família Myctophidae (Actinopterygii: Myctophiformes) no sudeste-sul do Brasil. M.Sc. Thesis in Oceanography, Universidade de São Paulo, São Paulo, 108 pp.
Lanternfish from Brazil 257
Santos, A.P. & J.L. Figueiredo. 2008. Guia de identi-ficação dos peixes da família Myctophidae do Brasil. Edusp, São Paulo, 176 pp.
Sassa, C., K. Kawaguchi, Y. Hirota & M. Ishida. 2004. Distribution patterns of larval myctophid fish assemblages in the subtropical-tropical waters of the western North Pacific. Fish. Oceanogr., 13(4): 267-282.
Schmid, C., H. Schäfer, G. Podestá & W. Zenk. 1995. The Vitória eddy and its relation to the Brazil Current. J. Phys. Oceanogr., 25: 2532-2546.
Silveira, I.C.A., A.C.K. Schmidt, E.J. Campos, S.S. Godoi & Y. Ikeda. 2001. A Corrente do Brasil ao largo da costa leste brasileira. Braz. J. Oceanogr., 48: 171-183.
Uiblein, F. & F. Bordes. 1999. Complex trophic interac-tions around oceanic islands. Ocean Challenge, 9: 15-16.
Uyeno, T., K. Matsuura & E. Fujii. 1983. Fishes trawled off Suriname and French Guiana. Japan Marine Fishery Resource Research Center, Tokyo, 519 pp.
Received: 10 June 2013; Accepted: 20 January 2014
Valentin, J.L., R. Paranhos, B.C.M.T. Faro & A.S.M. González. 2007. Massas d’Água. In: J.L. Valentin (ed.). Características hidrobiológicas da região central da Zona Econômica Exclusiva brasileira (Salvador, BA, ao Cabo de São Tomé, RJ). Sér. Doc. REVIZEE/SCORE-Central, Ministério do Meio Ambiente, Brasília, pp. 21-29.
Vinnichenko, V.I. 1997. Russian investigations and deep water fishery on the Corner Rising seamount in subarea 6. NAFO Sci. Countries Stud., 30: 41-49.
Wang, J.T. & C. Tsung-Chen. 2001. A review of lanternfishes (Families: Myctophidae and Neosco-pelidae) and their distribution around Taiwan and the Tungsha Islands with notes on seventeen new records. Zool. Stud., 40(2): 103-126.
Wienerroither, R.M., F. Uiblein, F. Bordes & T. Moreno. 2009. Composition, distribution and diversity of pelagic fishes around the Canary Islands, eastern central Atlantic. Mar. Biol. Res., 5: 328-344.
Williams, A., J.A. Koslow, A. Terauds & K. Haskard. 2001. Feeding ecology of five fishes from the mid-slope micronekton community off southern Tasmania, Australia. Mar. Biol., 139(6): 1177-1192.