red hill elementary school school accountability report
TRANSCRIPT

2015-16 School Accountability Report Card for Red Hill Elementary School Page 1 of 13
Red Hill Elementary School
School Accountability Report Card
Reported Using Data from the 2015-16 School Year
Published During 2016-17
By February 1 of each year, every school in California is required by state law to publish a School Accountability Report Card (SARC). The SARC contains information about the condition and performance of each California public school. Under the Local Control Funding Formula (LCFF) all local educational agencies (LEAs) are required to prepare a Local Control and Accountability Plan (LCAP), which describes how they intend to meet annual school-specific goals for all pupils, with specific activities to address state and local priorities. Additionally, data reported in an LCAP is to be consistent with data reported in the SARC. • For more information about SARC requirements, see the California Department of Education (CDE) SARC Web page at
http://www.cde.ca.gov/ta/ac/sa/. • For more information about the LCFF or LCAP, see the CDE LCFF Web page at http://www.cde.ca.gov/fg/aa/lc/. • For additional information about the school, parents/guardians and community members should contact the school principal or
the district office. DataQuest DataQuest is an online data tool located on the CDE DataQuest Web page at http://dq.cde.ca.gov/dataquest/ that contains additional information about this school and comparisons of the school to the district and the county. Specifically, DataQuest is a dynamic system that provides reports for accountability (e.g., test data, enrollment, high school graduates, dropouts, course enrollments, staffing, and data regarding English learners). Internet Access Internet access is available at public libraries and other locations that are publicly accessible (e.g., the California State Library). Access to the Internet at libraries and public locations is generally provided on a first-come, first-served basis. Other use restrictions may include the hours of operation, the length of time that a workstation may be used (depending on availability), the types of software programs available on a workstation, and the ability to print documents.
About This School Contact Information (School Year 2016-17)
School Contact Information
School Name------- Red Hill Elementary School
Street------- 11911 Red Hill Ave.
City, State, Zip------- Santa Ana, CA 92705
Phone Number------- (714) 730-7543
Principal------- Will Neddersen
E-mail Address------- [email protected]
Web Site------- http://www.tustin.k12.ca.us/redhilles
CDS Code 30-73643-6030662

2015-16 School Accountability Report Card for Red Hill Elementary School Page 2 of 13
District Contact Information
District Name------- Tustin Unified School District
Phone Number------- (714) 730-7301
Superintendent------- Gregory A. Franklin, Ed.D.
E-mail Address------- [email protected]
Web Site------- http://www.tustin.k12.ca.us
School Description and Mission Statement (School Year 2016-17)
Built in 2001, our award-winning school was designed to provide students with a facility to succeed in the 21st century while keeping the heritage of the original 1960's site. The school is surrounded by trees and "red hill," which is connected to the strong community history of Tustin. The mission of Red Hill Elementary School is being committed to providing an engaging and challenging instructional program for all students. We provide a safe and nurturing environment which promotes character-building and establishes a foundation for life-long learning and achievement. We are a dedicated community of students, staff and parents who work collaboratively for the success of all Red Hill students. Our focus is student success! High standards, quality instruction, strong collaboration, and a strong sense of community are what guide Red Hill in achieving our mission. Our strength comes in the dedication that all members of the Red Hill community have to providing an outstanding educational experience through strong programs. The curriculum is both rigorous and comprehensive. Differentiated instruction is essential to meeting each student individually. Our instruction is designed to engage students as we prepare them to be the leaders of tomorrow. Our practices are in Balanced Literacy and Cognitively Guided Instruction (CGI). We want to build independent readers and writers who analyze their learning. We also want mathematicians who are able to reason and problem solve in various math experiences. Parents are an integral partner in the success of our school. Countless hours of volunteering in the classrooms throughout the years have built a strong relationship with teachers to support our students. Continuous PTA support through volunteering and fundraising provide enriching learning opportunities and materials such as educational assemblies, Art Masters, the Red Hill Garden, and upgraded technology throughout the campus. As our community moves forward in reaching our mission of learning, our Red Hill Rockets will soar! Student Enrollment by Grade Level (School Year 2015-16)
Grade Number of
Level Students
Kindergarten 122
Grade 1 109
Grade 2 89
Grade 3 78
Grade 4 104
Grade 5 88
Total Enrollment 590

2015-16 School Accountability Report Card for Red Hill Elementary School Page 3 of 13
Student Enrollment by Group (School Year 2015-16)
Student Percent of
Group Total Enrollment
Black or African American 0.8
American Indian or Alaska Native 0.2
Asian 4.6
Filipino 1.7
Hispanic or Latino 20.2
Native Hawaiian or Pacific Islander 0
White 65.9
Two or More Races 5.9
Socioeconomically Disadvantaged 10.7
English Learners 4.6
Students with Disabilities 9.7
Foster Youth 0
A. Conditions of Learning
State Priority: Basic The SARC provides the following information relevant to the Basic State Priority (Priority 1): • Degree to which teachers are appropriately assigned and fully credentialed in the subject area and for the pupils they are
teaching; • Pupils have access to standards-aligned instructional materials; and • School facilities are maintained in good repair. Teacher Credentials
Teachers School District
2014-15 2015-16 2016-17 2016-17
With Full Credential 22 24 23 947
Without Full Credential 0 0 0 1
Teaching Outside Subject Area of Competence (with full credential) 0 0 0 70
Teacher Misassignments and Vacant Teacher Positions
Indicator 2014-15 2015-16 2016-17
Misassignments of Teachers of English Learners 0 0 0
Total Teacher Misassignments * 0 0 0
Vacant Teacher Positions 0 0 0 Note: “Misassignments” refers to the number of positions filled by teachers who lack legal authorization to teach that grade level, subject area, student group, etc. * Total Teacher Misassignments includes the number of Misassignments of Teachers of English Learners.

2015-16 School Accountability Report Card for Red Hill Elementary School Page 4 of 13
Core Academic Classes Taught by Highly Qualified Teachers (School Year 2015-16)
Location of Classes Percent of Classes In Core Academic Subjects
Taught by Highly Qualified Teachers Not Taught by Highly Qualified Teachers
This School 100.0 0.0
All Schools in District 100.0 0.0
High-Poverty Schools in District 100.0 0.0
Low-Poverty Schools in District 100.0 0.0 Note: High-poverty schools are defined as those schools with student eligibility of approximately 40 percent or more in the free and reduced price meals program. Low-poverty schools are those with student eligibility of approximately 39 percent or less in the free and reduced price meals program. Quality, Currency, Availability of Textbooks and Instructional Materials (School Year 2016-17) Year and month in which data were collected: October 10, 2016 On October 10, 2016, the Tustin Unified School District Board of Education verified by resolution that each student at this school has a textbook and/or instructional materials for each core subject area that are aligned to the content and cycles of the curriculum framework adopted by the State of California.
Subject Textbooks and Instructional Materials/
Year of Adoption
From Most Recent
Adoption?
Percent of Students Lacking Own
Assigned Copy
Reading/Language Arts State-Adopted Textbooks
Textbooks and support materials are state-adopted and consistent with the content and cycles of the curriculum frameworks adopted by the State Board of Education. The school district has purchased and provided each student with textbooks and materials in this subject area that are aligned with state standards. The Units of Study for Teaching Reading and the Units of Study in Opinion, Information, and Narrative Writing by Lucy Calkins as well as K-2 Phonics Lessons by Irene Fountas and Gay Su Pinnell are the state adopted textbooks for the District. The Tustin Unified School District Board of Education approved these textbooks for adoption on December 12, 2016.
Supplemental Textbooks and Materials
Students have access to classroom libraries containing both literature and non-fiction text.
Yes 0%
Mathematics State-Adopted Textbooks
Textbooks and support materials are state-adopted and consistent with the content and cycles of the curriculum frameworks adopted by the State Board of Education. The school district has purchased and provided each student with textbooks and materials in this subject area that are aligned to state standards. Houghton Mifflin Harcourt California Math Expressions Common Core (2015) is the state adopted core curriculum for the District. The Tustin Unified Board of Education approved this textbook for adoption on June 9, 2014.
Yes 0%
2015-16 School Accountability Report Card for Red Hill Elementary School Page 5 of 13
Subject Textbooks and Instructional Materials/
Year of Adoption
From Most Recent
Adoption?
Percent of Students Lacking Own
Assigned Copy
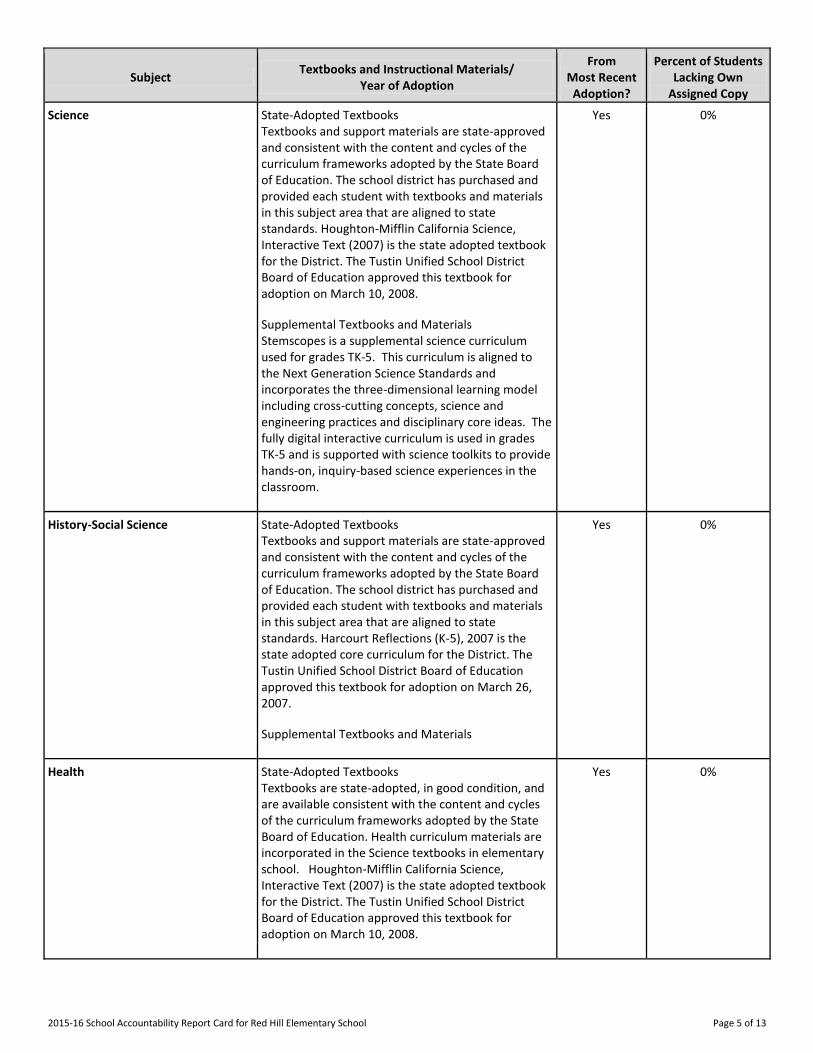
Science State-Adopted Textbooks
Textbooks and support materials are state-approved and consistent with the content and cycles of the curriculum frameworks adopted by the State Board of Education. The school district has purchased and provided each student with textbooks and materials in this subject area that are aligned to state standards. Houghton-Mifflin California Science, Interactive Text (2007) is the state adopted textbook for the District. The Tustin Unified School District Board of Education approved this textbook for adoption on March 10, 2008.
Supplemental Textbooks and Materials
Stemscopes is a supplemental science curriculum used for grades TK-5. This curriculum is aligned to the Next Generation Science Standards and incorporates the three-dimensional learning model including cross-cutting concepts, science and engineering practices and disciplinary core ideas. The fully digital interactive curriculum is used in grades TK-5 and is supported with science toolkits to provide hands-on, inquiry-based science experiences in the classroom.
Yes 0%
History-Social Science State-Adopted Textbooks
Textbooks and support materials are state-approved and consistent with the content and cycles of the curriculum frameworks adopted by the State Board of Education. The school district has purchased and provided each student with textbooks and materials in this subject area that are aligned to state standards. Harcourt Reflections (K-5), 2007 is the state adopted core curriculum for the District. The Tustin Unified School District Board of Education approved this textbook for adoption on March 26, 2007.
Supplemental Textbooks and Materials
Yes 0%
Health State-Adopted Textbooks
Textbooks are state-adopted, in good condition, and are available consistent with the content and cycles of the curriculum frameworks adopted by the State Board of Education. Health curriculum materials are incorporated in the Science textbooks in elementary school. Houghton-Mifflin California Science, Interactive Text (2007) is the state adopted textbook for the District. The Tustin Unified School District Board of Education approved this textbook for adoption on March 10, 2008.
Yes 0%

2015-16 School Accountability Report Card for Red Hill Elementary School Page 6 of 13
School Facility Conditions and Planned Improvements (Most Recent Year)
The Tustin Unified School District takes great efforts to ensure that all schools are clean, safe, and functional. To assist in this effort, the District uses a facility survey instrument developed by the State of California Office of Public School Construction (OPSC). The results of this survey are available at the school office, the District office, or on the Internet at http://www.tustin.k12.ca.us/Domain/3505. The District maintenance staff ensures that the repairs necessary to keep the school in good repair and working order are completed in a timely manner. A work order process is used to ensure efficient service and that emergency repairs are given the highest priority. Red Hill is a newer facility, built in 2001, and is maintained in excellent condition. Two additional shade structures in the lunch area were added in October 2008 to provide more comprehensive protection from the sun. School Facility Good Repair Status (Most Recent Year)
School Facility Good Repair Status (Most Recent Year) Year and month of the most recent FIT report: 11/09/2016
System Inspected Repair Status Repair Needed and
Action Taken or Planned Good Fair Poor
Systems: Gas Leaks, Mechanical/HVAC, Sewer
X
Interior: Interior Surfaces X
Cleanliness: Overall Cleanliness, Pest/ Vermin Infestation
X
Electrical: Electrical X
Restrooms/Fountains: Restrooms, Sinks/ Fountains
X
Safety: Fire Safety, Hazardous Materials X
Structural: Structural Damage, Roofs X
External: Playground/School Grounds, Windows/ Doors/Gates/Fences
X
Overall Facility Rating (Most Recent Year)
Year and month of the most recent FIT report: 11/09/2016
Overall Rating Exemplary Good Fair Poor
X

2015-16 School Accountability Report Card for Red Hill Elementary School Page 7 of 13
B. Pupil Outcomes
State Priority: Pupil Achievement The SARC provides the following information relevant to the State priority: Pupil Achievement (Priority 4): • Statewide assessments (i.e., California Assessment of Student Performance and Progress [CAASPP] System, which includes the
Smarter Balanced Summative Assessments for students in the general education population and the California Alternate Assessments [CAAs] for English language arts/literacy [ELA] and mathematics given in grades three through eight and grade eleven. The CAAs have replaced the California Alternate Performance Assessment [CAPA] for ELA and mathematics, which were eliminated in 2015. Only eligible students may participate in the administration of the CAAs. CAA items are aligned with alternate achievement standards, which are linked with the Common Core State Standards [CCSS] for students with significant cognitive disabilities); and
• The percentage of students who have successfully completed courses that satisfy the requirements for entrance to the University of California and the California State University, or career technical education sequences or programs of study
CAASPP Test Results in English Language Arts/Literacy (ELA) and Mathematics for All Students
Subject
Percent of Students Meeting or Exceeding the State Standards (grades 3-8 and 11)
School District State
2014-15 2015-16 2014-15 2015-16 2014-15 2015-16
English Language Arts/Literacy 74 76 57 62 44 48
Mathematics 70 66 49 52 34 36 Note: Percentages are not calculated when the number of students tested is ten or less, either because the number of students in this category is too small for statistical accuracy or to protect student privacy.
CAASPP Test Results in ELA by Student Group Grades Three through Eight and Grade Eleven (School Year 2015-16)
Student Group Grade
Number of Students Percent of Students
Enrolled Tested Tested Standard Met or
Exceeded
All Students 3 80 79 98.8 64.6
4 104 101 97.1 82.2
5 90 89 98.9 78.7
Male 3 51 51 100.0 62.8
4 62 60 96.8 78.3
5 42 41 97.6 68.3
Female 3 29 28 96.5 67.9
4 42 41 97.6 87.8
5 48 48 100.0 87.5
Black or African American 3 -- -- -- --
4 -- -- -- --
American Indian or Alaska Native 5 -- -- -- --
Asian 3 -- -- -- --
4 -- -- -- --
5 -- -- -- --
Filipino 4 -- -- -- --
5 -- -- -- --

2015-16 School Accountability Report Card for Red Hill Elementary School Page 8 of 13
Student Group Grade
Number of Students Percent of Students
Enrolled Tested Tested Standard Met or
Exceeded
Hispanic or Latino 3 13 12 92.3 50.0
4 19 19 100.0 73.7
5 18 17 94.4 58.8
White 3 55 55 100.0 69.1
4 71 68 95.8 88.2
5 61 61 100.0 83.6
Two or More Races 3 -- -- -- --
4 -- -- -- --
5 -- -- -- --
Socioeconomically Disadvantaged 3 -- -- -- --
4 -- -- -- --
5 13 12 92.3 58.3
English Learners 3 -- -- -- --
4 -- -- -- --
5 -- -- -- --
Students with Disabilities 3 -- -- -- --
4 -- -- -- --
5 -- -- -- --
Foster Youth 3 -- -- -- --
4 -- -- -- --
5 -- -- -- --
Note: ELA test results include the Smarter Balanced Summative Assessment and the CAA. The “Percent Met or Exceeded” is calculated by taking the total number of students who met or exceeded the standard on the Smarter Balanced Summative Assessment plus the total number of students who met the standard on the CAAs divided by the total number of students who participated in both assessments. Double dashes (--) appear in the table when the number of students is ten or less, either because the number of students in this category is too small for statistical accuracy or to protect student privacy. Note: The number of students tested includes all students who participated in the test whether they received a score or not; however, the number of students tested is not the number that was used to calculate the achievement level percentages. The achievement level percentages are calculated using only students who received scores.
CAASPP Test Results in Mathematics by Student Group Grades Three through Eight and Grade Eleven (School Year 2015-16)
Student Group Grade
Number of Students Percent of Students
Enrolled Tested Tested Standard Met or
Exceeded
All Students 3 80 79 98.8 70.9
4 104 101 97.1 75.3
5 90 89 98.9 51.7
Male 3 51 51 100.0 70.6
4 62 60 96.8 76.7
5 42 41 97.6 53.7

2015-16 School Accountability Report Card for Red Hill Elementary School Page 9 of 13
Student Group Grade
Number of Students Percent of Students
Enrolled Tested Tested Standard Met or
Exceeded
Female 3 29 28 96.5 71.4
4 42 41 97.6 73.2
5 48 48 100.0 50.0
Black or African American 3 -- -- -- --
4 -- -- -- --
American Indian or Alaska Native 5 -- -- -- --
Asian 3 -- -- -- --
4 -- -- -- --
5 -- -- -- --
Filipino 4 -- -- -- --
5 -- -- -- --
Hispanic or Latino 3 13 12 92.3 50.0
4 19 19 100.0 57.9
5 18 17 94.4 17.6
White 3 55 55 100.0 80.0
4 71 68 95.8 80.9
5 61 61 100.0 59.0
Two or More Races 3 -- -- -- --
4 -- -- -- --
5 -- -- -- --
Socioeconomically Disadvantaged 3 -- -- -- --
4 -- -- -- --
5 13 12 92.3 25.0
English Learners 3 -- -- -- --
4 -- -- -- --
5 -- -- -- --
Students with Disabilities 3 -- -- -- --
4 -- -- -- --
5 -- -- -- --
Foster Youth 3 -- -- -- --
4 -- -- -- --
5 -- -- -- --
Note: Mathematics test results include the Smarter Balanced Summative Assessment and the CAA. The “Percent Met or Exceeded” is calculated by taking the total number of students who met or exceeded the standard on the Smarter Balanced Summative Assessment plus the total number of students who met the standard on the CAAs divided by the total number of students who participated in both assessments. Double dashes (--) appear in the table when the number of students is ten or less, either because the number of students in this category is too small for statistical accuracy or to protect student privacy.

2015-16 School Accountability Report Card for Red Hill Elementary School Page 10 of 13
Note: The number of students tested includes all students who participated in the test whether they received a score or not; however, the number of students tested is not the number that was used to calculate the achievement level percentages. The achievement level percentages are calculated using only students who received scores.
CAASPP Test Results in Science for All Students
Subject
Percent of Students Scoring at Proficient or Advanced (meeting or exceeding the state standards)
School District State
2013-14 2014-15 2015-16 2013-14 2014-15 2015-16 2013-14 2014-15 2015-16
Science (grades 5, 8, and 10) 90 87 75 76 73 71 60 56 54 Note: Science test results include California Standards Tests (CSTs), California Modified Assessment (CMA), and California Alternate Performance Assessment (CAPA) in grades five, eight, and ten. Note: Scores are not shown when the number of students tested is ten or less, either because the number of students in this category is too small for statistical accuracy or to protect student privacy.
CAASPP Test Results in Science by Student Group Grades Five, Eight, and Ten (School Year 2015-16)
Student Group
Total Enrollment
# of Students with Valid Scores
% of Students with Valid Scores
% of Students Proficient or
Advanced
All Students 90 89 98.9 75.3
Male 42 41 97.6 73.2
Female 48 48 100.0 77.1
Hispanic or Latino 18 17 94.4 52.9
White 61 61 100.0 78.7
Socioeconomically Disadvantaged 13 12 92.3 50.0 Note: Science test results include CSTs, CMA, and CAPA in grades five, eight, and ten. The “Proficient or Advanced” is calculated by taking the total number of students who scored at Proficient or Advanced on the science assessment divided by the total number of students with valid scores. Note: Scores are not shown when the number of students tested is ten or less, either because the number of students in this category is too small for statistical accuracy or to protect student privacy.
State Priority: Other Pupil Outcomes The SARC provides the following information relevant to the Other Pupil Outcomes State Priority (Priority 8): • Pupil outcomes in the subject areas of physical education. California Physical Fitness Test Results (School Year 2015-16)
Grade Level
Percent of Students Meeting Fitness Standards
Four of Six Standards Five of Six Standards Six of Six Standards
---5--- 11.2 22.5 59.6 Note: Percentages are not calculated when the number of students tested is ten or less, either because the number of students in this category is too small for statistical accuracy or to protect student privacy.
2015-16 School Accountability Report Card for Red Hill Elementary School Page 11 of 13
C. Engagement
State Priority: Parental Involvement The SARC provides the following information relevant to the Parental Involvement State Priority (Priority 3): • Efforts the school district makes to seek parent input in making decisions for the school district and each schoolsite. Opportunities for Parental Involvement (School Year 2016-17)
Parents are our partners and we welcome their involvement. With more than 40 different committees available, our dedicated parents volunteer more than 12,000 hours each year to benefit our students and community. There are multiple ways to be involved and include serving as a classroom volunteer, Jr. Great Book Discussion Leader, computer lab assistant, library assistant, noon duty supervisor, garden helper, Art Masters, room parent, and a leader for small group instruction. Parents and community members are encouraged to contact the classroom teacher, principal or PTA president. Please call the school office for contact information is needed at (714) 730-7543.
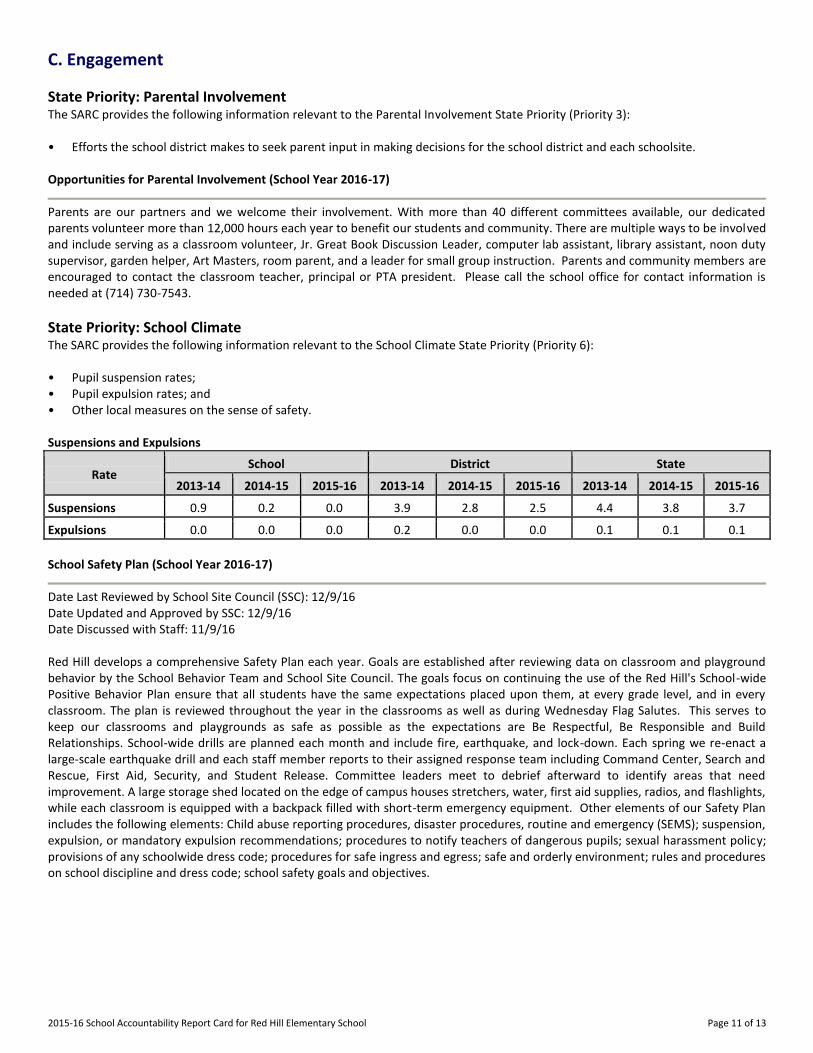
State Priority: School Climate The SARC provides the following information relevant to the School Climate State Priority (Priority 6): • Pupil suspension rates; • Pupil expulsion rates; and • Other local measures on the sense of safety. Suspensions and Expulsions
Rate School District State
2013-14 2014-15 2015-16 2013-14 2014-15 2015-16 2013-14 2014-15 2015-16
Suspensions------- 0.9 0.2 0.0 3.9 2.8 2.5 4.4 3.8 3.7
Expulsions------- 0.0 0.0 0.0 0.2 0.0 0.0 0.1 0.1 0.1
School Safety Plan (School Year 2016-17)
Date Last Reviewed by School Site Council (SSC): 12/9/16 Date Updated and Approved by SSC: 12/9/16 Date Discussed with Staff: 11/9/16 Red Hill develops a comprehensive Safety Plan each year. Goals are established after reviewing data on classroom and playground behavior by the School Behavior Team and School Site Council. The goals focus on continuing the use of the Red Hill's School-wide Positive Behavior Plan ensure that all students have the same expectations placed upon them, at every grade level, and in every classroom. The plan is reviewed throughout the year in the classrooms as well as during Wednesday Flag Salutes. This serves to keep our classrooms and playgrounds as safe as possible as the expectations are Be Respectful, Be Responsible and Build Relationships. School-wide drills are planned each month and include fire, earthquake, and lock-down. Each spring we re-enact a large-scale earthquake drill and each staff member reports to their assigned response team including Command Center, Search and Rescue, First Aid, Security, and Student Release. Committee leaders meet to debrief afterward to identify areas that need improvement. A large storage shed located on the edge of campus houses stretchers, water, first aid supplies, radios, and flashlights, while each classroom is equipped with a backpack filled with short-term emergency equipment. Other elements of our Safety Plan includes the following elements: Child abuse reporting procedures, disaster procedures, routine and emergency (SEMS); suspension, expulsion, or mandatory expulsion recommendations; procedures to notify teachers of dangerous pupils; sexual harassment policy; provisions of any schoolwide dress code; procedures for safe ingress and egress; safe and orderly environment; rules and procedures on school discipline and dress code; school safety goals and objectives.

2015-16 School Accountability Report Card for Red Hill Elementary School Page 12 of 13
D. Other SARC Information
The information in this section is required to be in the SARC but is not included in the state priorities for LCFF. Federal Intervention Program (School Year 2016-17)
Indicator School District
Program Improvement Status In PI
First Year of Program Improvement 2011-2012
Year in Program Improvement* Year 3
Number of Schools Currently in Program Improvement N/A 10
Percent of Schools Currently in Program Improvement N/A 76.9 Note: Cells with N/A values do not require data.
Average Class Size and Class Size Distribution (Elementary)
Grade Level
2013-14 2014-15 2015-16
Avg. Class Size
Number of Classes Avg. Class Size
Number of Classes Avg. Class Size
Number of Classes
1-20 21-32 33+ 1-20 21-32 33+ 1-20 21-32 33+
K
16 6 1 14 9 30 4
1
29 2 28 3 30 4
2
25 1 3 29 2 29 3
3
27 3 28 4 31 2
4
36 2 29 3 32 2 1
5
30 1 3 34 3 29 3
Other
14 1 Number of classes indicates how many classes fall into each size category (a range of total students per class).
Academic Counselors and Other Support Staff (School Year 2015-16)
Title Number of FTE
Assigned to School Average Number of Students per
Academic Counselor
Academic Counselor------- 0 0
Counselor (Social/Behavioral or Career Development) 0 N/A
Library Media Teacher (Librarian) 0 N/A
Library Media Services Staff (Paraprofessional) .493 N/A
Psychologist------- .5 N/A
Social Worker------- 0 N/A
Nurse------- .2 N/A
Speech/Language/Hearing Specialist 1.4 N/A
Resource Specialist------- 0.4 N/A
Other------- 0 N/A Note: Cells with N/A values do not require data. *One Full Time Equivalent (FTE) equals one staff member working full time; one FTE could also represent two staff members who each work 50 percent of full time.

2015-16 School Accountability Report Card for Red Hill Elementary School Page 13 of 13
Expenditures per Pupil and School Site Teacher Salaries (Fiscal Year 2014-15)
Level
Expenditures Per Pupil Average Teacher Salary Total
Supplemental/ Restricted
Basic/ Unrestricted
School Site------- $6,012 $1,295 $4,717 $84,088
District------- N/A N/A $4,915 $79,250
Percent Difference: School Site and District N/A N/A -4.0 6.1
State------- N/A N/A $5,677 $75,837
Percent Difference: School Site and State N/A N/A -16.9 10.9 Note: Cells with N/A values do not require data.
Types of Services Funded (Fiscal Year 2015-16)
Red Hill Elementary School receives funding for instructional and academic program improvement through the Local Control Formula Funding (LCFF) Supplemental in the amount of $16,425. Funding supports professional development, equipment, instructional materials, technology, books, and media that support our academic achievement efforts. Red Hill staff members actively pursue outside grant opportunities to fund classroom programs, averaging $3,000 per year in each of the past seven years. Additionally, our Red Hill PTA raised $69,000 in 2015-16 to support enrichment programs, purchase technology, and fund classroom aides to further reduce the student to teacher/staff ratio. Teacher and Administrative Salaries (Fiscal Year 2014-15)
Category District Amount State Average for Districts In Same Category
Beginning Teacher Salary $48,196 $45,092
Mid-Range Teacher Salary $77,747 $71,627
Highest Teacher Salary $103,485 $93,288
Average Principal Salary (Elementary) $131,008 $115,631
Average Principal Salary (Middle) $146,875 $120,915
Average Principal Salary (High) $148,859 $132,029
Superintendent Salary $293,164 $249,537
Percent of Budget for Teacher Salaries 41% 37%
Percent of Budget for Administrative Salaries 6% 5% For detailed information on salaries, see the CDE Certificated Salaries & Benefits Web page at http://www.cde.ca.gov/ds/fd/cs/.
Professional Development (Most Recent Three Years)
Red Hill teachers are committed to providing an engaging and challenging instructional program for all students. This commitment leads to teachers continually developing as professionals and pursuing opportunities to maintain life-long learning. Teachers can participate in Professional Development through district offerings, as well as through the school site. Summer institutes are in place so teachers can sign up to attend trainings of their choice. The trainings focus on the areas of GATE instruction, Balanced Literacy and technology. Additional professional development opportunities throughout the school year are determined by teacher surveys in conjunction with assessment data. On selected Wednesdays each month, time is allotted for teachers to participate in these learning opportunities to promote professional growth.
Red Hill teachers are also given regular release time and grade-level planning days to work together on school-wide accountability for state and district academic standards. In grade-level teams, teachers conduct ongoing analyses of student performance data and adjust curriculum and long-range lesson plans accordingly. Grade level teams continue to map out strategies to meet standards and compare results of assessments to plan for additional staff development. By sharing strategies, teachers are able to pool understanding and organization of subject matter and develop meaningful data from assessments, as defined by the California State standards for teaching and learning. Teachers have also received professional development in the area of Balanced Literacy through a lab experience model for 5 days. Teachers go into a classroom to see an element of Reading and Writing Workshop modeled and then reflect on the lesson with the trainer. From there, teachers plan their next steps for delivery of Reading and Writing Workshop. The coaching model has also been used to support teacher professional development in ELD, technology and Balanced Literacy. The coach will come into a teacher's classroom and either observe or model for the teacher. Then they will come together to reflect on the experience and determine next steps to bring back into the teachers classroom to support student learning.