a.j dorsa elementary school school accountability report ... · a.j dorsa elementary school school...
TRANSCRIPT

2015-16 School Accountability Report Card for A.J Dorsa Elementary School Page 1 of 13
A.J Dorsa Elementary School
School Accountability Report Card
Reported Using Data from the 2015-16 School Year
Published During 2016-17
By February 1 of each year, every school in California is required by state law to publish a School Accountability Report Card (SARC). The SARC contains information about the condition and performance of each California public school. Under the Local Control Funding Formula (LCFF) all local educational agencies (LEAs) are required to prepare a Local Control and Accountability Plan (LCAP), which describes how they intend to meet annual school-specific goals for all pupils, with specific activities to address state and local priorities. Additionally, data reported in an LCAP is to be consistent with data reported in the SARC. • For more information about SARC requirements, see the California Department of Education (CDE) SARC Web page at
http://www.cde.ca.gov/ta/ac/sa/. • For more information about the LCFF or LCAP, see the CDE LCFF Web page at http://www.cde.ca.gov/fg/aa/lc/. • For additional information about the school, parents/guardians and community members should contact the school principal or
the district office. DataQuest DataQuest is an online data tool located on the CDE DataQuest Web page at http://dq.cde.ca.gov/dataquest/ that contains additional information about this school and comparisons of the school to the district and the county. Specifically, DataQuest is a dynamic system that provides reports for accountability (e.g., test data, enrollment, high school graduates, dropouts, course enrollments, staffing, and data regarding English learners). Internet Access Internet access is available at public libraries and other locations that are publicly accessible (e.g., the California State Library). Access to the Internet at libraries and public locations is generally provided on a first-come, first-served basis. Other use restrictions may include the hours of operation, the length of time that a workstation may be used (depending on availability), the types of software programs available on a workstation, and the ability to print documents.
About This School Contact Information (School Year 2016-17)
School Contact Information
School Name------- A.J Dorsa Elementary School
Street------- 1290 Bal Harbor Way
City, State, Zip------- San Jose CA, 95122
Phone Number------- (408) 928-7400
Principal------- Leticia Rivas
E-mail Address------- [email protected]
Web Site------- www.arusd.org
CDS Code 43-69369-6046114

2015-16 School Accountability Report Card for A.J Dorsa Elementary School Page 2 of 13
District Contact Information
District Name------- Alum Rock Union Elementary School District
Phone Number------- (408) 928-6800
Superintendent------- Hilaria Bauer, Ph.D.
E-mail Address------- [email protected]
Web Site------- www.arusd.org
School Description and Mission Statement (School Year 2016-17)
Mission: At A. J. Dorsa Elementary School our mission is to ensure that all students have the essential learnings to excel academically and socially, by providing rigorous academic instruction within:
• Individualized Learning Paths • Development of Global Citizenship Leadership • Application of 21st Century Technology Skills
Vision: Our vision is to create and maintain a safe learning environment where everyone works collaboratively in empowering all students to reach their full academic and personal potential, in middle and high school, college, and 21st century careers, as well as in becoming outstanding, active contributors in our surrounding community and global society. Student Enrollment by Grade Level (School Year 2015-16)
Grade Number of
Level Students
Kindergarten 90
Grade 1 62
Grade 2 75
Grade 3 87
Grade 4 98
Grade 5 77
Total Enrollment 489

2015-16 School Accountability Report Card for A.J Dorsa Elementary School Page 3 of 13
Student Enrollment by Group (School Year 2015-16)
Student Percent of
Group Total Enrollment
Black or African American 1.2
American Indian or Alaska Native 0
Asian 5.1
Filipino 1.6
Hispanic or Latino 90.6
Native Hawaiian or Pacific Islander 0.4
White 0.4
Two or More Races 0.6
Socioeconomically Disadvantaged 91.4
English Learners 66.1
Students with Disabilities 11
Foster Youth 1.2
A. Conditions of Learning
State Priority: Basic The SARC provides the following information relevant to the Basic State Priority (Priority 1): • Degree to which teachers are appropriately assigned and fully credentialed in the subject area and for the pupils they are
teaching; • Pupils have access to standards-aligned instructional materials; and • School facilities are maintained in good repair. Teacher Credentials
Teachers School District
2014-15 2015-16 2016-17 2016-17
With Full Credential 23 22 19 496
Without Full Credential 0 1 1 43
Teaching Outside Subject Area of Competence (with full credential) 0 0 0 0
Teacher Misassignments and Vacant Teacher Positions
Indicator 2014-15 2015-16 2016-17
Misassignments of Teachers of English Learners 0 0 0
Total Teacher Misassignments * 0 0 0
Vacant Teacher Positions 0 0 1 Note: “Misassignments” refers to the number of positions filled by teachers who lack legal authorization to teach that grade level, subject area, student group, etc. * Total Teacher Misassignments includes the number of Misassignments of Teachers of English Learners.

2015-16 School Accountability Report Card for A.J Dorsa Elementary School Page 4 of 13
Core Academic Classes Taught by Highly Qualified Teachers (School Year 2015-16)
Location of Classes Percent of Classes In Core Academic Subjects
Taught by Highly Qualified Teachers Not Taught by Highly Qualified Teachers
This School 90.9 9.1
All Schools in District 86.3 13.7
High-Poverty Schools in District 86.3 13.7
Low-Poverty Schools in District 0.0 0.0 Note: High-poverty schools are defined as those schools with student eligibility of approximately 40 percent or more in the free and reduced price meals program. Low-poverty schools are those with student eligibility of approximately 39 percent or less in the free and reduced price meals program. Quality, Currency, Availability of Textbooks and Instructional Materials (School Year 2016-17) Year and month in which data were collected: December 2016 The following are the most recent adoptions for Alum Rock Union Elementary School District:
• Benchmark Advance (ELA and ELD) 2016-Elementary/Engage NY 2016- Middle Schools • EnVision Mathematics 2015-Elementary / CPM 2015- Middle Schools • Scott Foresman Science 2006- Elementary/Glencoe Science 2006-Middle Schools • Scott Foresman Social Studies 2007- Elementary /TCI Curriculum 2007- Middle School
Subject Textbooks and Instructional Materials/
Year of Adoption
From Most Recent
Adoption?
Percent of Students Lacking Own
Assigned Copy
Reading/Language Arts Benchmark Advance (ELA and ELD) 2016-Elementary/Engage NY 2016- Middle Schools
Yes 0
Mathematics EnVision Mathematics 2015-Elementary / CPM 2015- Middle Schools
Yes 0
Science Scott Foresman Science 2006- Elementary/Glencoe Science 2006-Middle Schools
Yes 0
History-Social Science Scott Foresman Social Studies 2007- Elementary /TCI Curriculum 2007- Middle School
Yes 0
School Facility Conditions and Planned Improvements (Most Recent Year)
School Facility Good Repair Status (Most Recent Year)
School Facility Good Repair Status (Most Recent Year) Year and month of the most recent FIT report: December 2016
System Inspected Repair Status Repair Needed and
Action Taken or Planned Good Fair Poor
Systems: Gas Leaks, Mechanical/HVAC, Sewer
X
Interior: Interior Surfaces X
Cleanliness: Overall Cleanliness, Pest/ Vermin Infestation
X
Electrical: Electrical X

2015-16 School Accountability Report Card for A.J Dorsa Elementary School Page 5 of 13
School Facility Good Repair Status (Most Recent Year) Year and month of the most recent FIT report: December 2016
System Inspected Repair Status Repair Needed and
Action Taken or Planned Good Fair Poor
Restrooms/Fountains: Restrooms, Sinks/ Fountains
X
Safety: Fire Safety, Hazardous Materials X
Structural: Structural Damage, Roofs X
External: Playground/School Grounds, Windows/ Doors/Gates/Fences
X
Overall Facility Rating (Most Recent Year)
Year and month of the most recent FIT report: December 2016
Overall Rating Exemplary Good Fair Poor
X
B. Pupil Outcomes
State Priority: Pupil Achievement The SARC provides the following information relevant to the State priority: Pupil Achievement (Priority 4): • Statewide assessments (i.e., California Assessment of Student Performance and Progress [CAASPP] System, which includes the
Smarter Balanced Summative Assessments for students in the general education population and the California Alternate Assessments [CAAs] for English language arts/literacy [ELA] and mathematics given in grades three through eight and grade eleven. The CAAs have replaced the California Alternate Performance Assessment [CAPA] for ELA and mathematics, which were eliminated in 2015. Only eligible students may participate in the administration of the CAAs. CAA items are aligned with alternate achievement standards, which are linked with the Common Core State Standards [CCSS] for students with significant cognitive disabilities); and
• The percentage of students who have successfully completed courses that satisfy the requirements for entrance to the University of California and the California State University, or career technical education sequences or programs of study
CAASPP Test Results in English Language Arts/Literacy (ELA) and Mathematics for All Students
Subject
Percent of Students Meeting or Exceeding the State Standards (grades 3-8 and 11)
School District State
2014-15 2015-16 2014-15 2015-16 2014-15 2015-16
English Language Arts/Literacy 28 32 34 39 44 48
Mathematics 16 22 25 30 34 36 Note: Percentages are not calculated when the number of students tested is ten or less, either because the number of students in this category is too small for statistical accuracy or to protect student privacy.

2015-16 School Accountability Report Card for A.J Dorsa Elementary School Page 6 of 13
CAASPP Test Results in ELA by Student Group Grades Three through Eight and Grade Eleven (School Year 2015-16)
Student Group Grade
Number of Students Percent of Students
Enrolled Tested Tested Standard Met or
Exceeded
All Students 3 91 89 97.8 31.5
4 99 94 95.0 23.4
5 77 75 97.4 42.7
Male 3 52 50 96.2 22.0
4 57 54 94.7 20.4
5 35 34 97.1 35.3
Female 3 39 39 100.0 43.6
4 42 40 95.2 27.5
5 42 41 97.6 48.8
Black or African American 3 -- -- -- --
4 -- -- -- --
5 -- -- -- --
Asian 3 -- -- -- --
4 -- -- -- --
5 -- -- -- --
Filipino 3 -- -- -- --
4 -- -- -- --
5 -- -- -- --
Hispanic or Latino 3 81 80 98.8 27.5
4 88 83 94.3 21.7
5 68 66 97.1 37.9
Native Hawaiian or Pacific Islander
4 -- -- -- --
5 -- -- -- --
White 3 -- -- -- --
Two or More Races 4 -- -- -- --
5 -- -- -- --
Socioeconomically Disadvantaged 3 86 84 97.7 29.8
4 85 83 97.7 21.7
5 70 69 98.6 40.6
English Learners 3 64 62 96.9 14.5
4 60 55 91.7 9.1
5 38 37 97.4 13.5
Students with Disabilities 3 24 24 100.0 8.3
4 14 14 100.0
5 13 13 100.0 7.7

2015-16 School Accountability Report Card for A.J Dorsa Elementary School Page 7 of 13
Student Group Grade
Number of Students Percent of Students
Enrolled Tested Tested Standard Met or
Exceeded
Students Receiving Migrant Education Services
5 -- -- -- --
Foster Youth 3 -- -- -- --
4 -- -- -- --
5 -- -- -- --
Note: ELA test results include the Smarter Balanced Summative Assessment and the CAA. The “Percent Met or Exceeded” is calculated by taking the total number of students who met or exceeded the standard on the Smarter Balanced Summative Assessment plus the total number of students who met the standard on the CAAs divided by the total number of students who participated in both assessments. Double dashes (--) appear in the table when the number of students is ten or less, either because the number of students in this category is too small for statistical accuracy or to protect student privacy. Note: The number of students tested includes all students who participated in the test whether they received a score or not; however, the number of students tested is not the number that was used to calculate the achievement level percentages. The achievement level percentages are calculated using only students who received scores.
CAASPP Test Results in Mathematics by Student Group Grades Three through Eight and Grade Eleven (School Year 2015-16)
Student Group Grade
Number of Students Percent of Students
Enrolled Tested Tested Standard Met or
Exceeded
All Students 3 91 91 100.0 29.7
4 99 99 100.0 15.2
5 78 78 100.0 20.5
Male 3 52 52 100.0 17.3
4 57 57 100.0 15.8
5 36 36 100.0 16.7
Female 3 39 39 100.0 46.1
4 42 42 100.0 14.3
5 42 42 100.0 23.8
Black or African American 3 -- -- -- --
4 -- -- -- --
5 -- -- -- --
Asian 3 -- -- -- --
4 -- -- -- --
5 -- -- -- --
Filipino 3 -- -- -- --
4 -- -- -- --
5 -- -- -- --
Hispanic or Latino 3 81 81 100.0 25.9
4 88 88 100.0 12.5
5 69 69 100.0 15.9
Native Hawaiian or Pacific Islander
4 -- -- -- --
2015-16 School Accountability Report Card for A.J Dorsa Elementary School Page 8 of 13
Student Group Grade
Number of Students Percent of Students
Enrolled Tested Tested Standard Met or
Exceeded
5 -- -- -- --
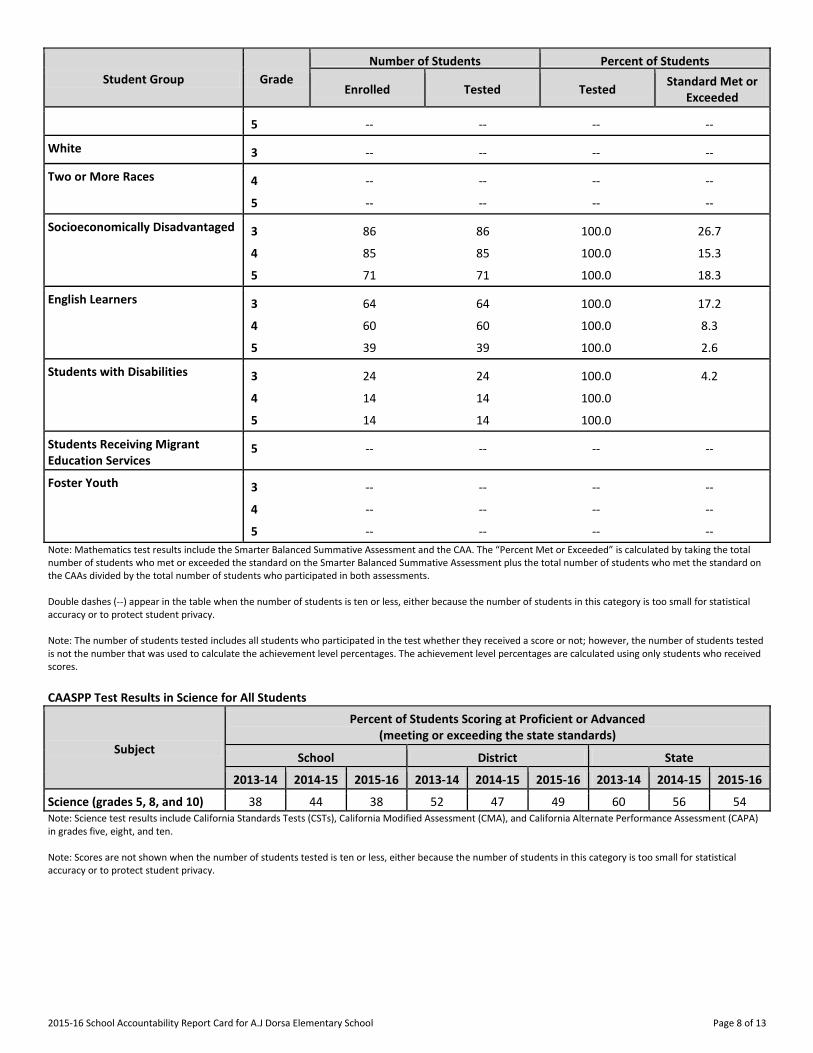
White 3 -- -- -- --
Two or More Races 4 -- -- -- --
5 -- -- -- --
Socioeconomically Disadvantaged 3 86 86 100.0 26.7
4 85 85 100.0 15.3
5 71 71 100.0 18.3
English Learners 3 64 64 100.0 17.2
4 60 60 100.0 8.3
5 39 39 100.0 2.6
Students with Disabilities 3 24 24 100.0 4.2
4 14 14 100.0
5 14 14 100.0
Students Receiving Migrant Education Services
5 -- -- -- --
Foster Youth 3 -- -- -- --
4 -- -- -- --
5 -- -- -- --
Note: Mathematics test results include the Smarter Balanced Summative Assessment and the CAA. The “Percent Met or Exceeded” is calculated by taking the total number of students who met or exceeded the standard on the Smarter Balanced Summative Assessment plus the total number of students who met the standard on the CAAs divided by the total number of students who participated in both assessments. Double dashes (--) appear in the table when the number of students is ten or less, either because the number of students in this category is too small for statistical accuracy or to protect student privacy. Note: The number of students tested includes all students who participated in the test whether they received a score or not; however, the number of students tested is not the number that was used to calculate the achievement level percentages. The achievement level percentages are calculated using only students who received scores.
CAASPP Test Results in Science for All Students
Subject
Percent of Students Scoring at Proficient or Advanced (meeting or exceeding the state standards)
School District State
2013-14 2014-15 2015-16 2013-14 2014-15 2015-16 2013-14 2014-15 2015-16
Science (grades 5, 8, and 10) 38 44 38 52 47 49 60 56 54 Note: Science test results include California Standards Tests (CSTs), California Modified Assessment (CMA), and California Alternate Performance Assessment (CAPA) in grades five, eight, and ten. Note: Scores are not shown when the number of students tested is ten or less, either because the number of students in this category is too small for statistical accuracy or to protect student privacy.

2015-16 School Accountability Report Card for A.J Dorsa Elementary School Page 9 of 13
CAASPP Test Results in Science by Student Group Grades Five, Eight, and Ten (School Year 2015-16)
Student Group
Total Enrollment
# of Students with Valid Scores
% of Students with Valid Scores
% of Students Proficient or
Advanced
All Students 78 78 100.0 38.5
Male 36 36 100.0 38.9
Female 42 42 100.0 38.1
Hispanic or Latino 69 69 100.0 31.9
Socioeconomically Disadvantaged 71 71 100.0 35.2
English Learners 39 39 100.0 12.8
Students with Disabilities 14 14 100.0 35.7 Note: Science test results include CSTs, CMA, and CAPA in grades five, eight, and ten. The “Proficient or Advanced” is calculated by taking the total number of students who scored at Proficient or Advanced on the science assessment divided by the total number of students with valid scores. Note: Scores are not shown when the number of students tested is ten or less, either because the number of students in this category is too small for statistical accuracy or to protect student privacy.
State Priority: Other Pupil Outcomes The SARC provides the following information relevant to the Other Pupil Outcomes State Priority (Priority 8): • Pupil outcomes in the subject areas of physical education. California Physical Fitness Test Results (School Year 2015-16)
Grade Level
Percent of Students Meeting Fitness Standards
Four of Six Standards Five of Six Standards Six of Six Standards
---5--- 20.8 14.3 19.5 Note: Percentages are not calculated when the number of students tested is ten or less, either because the number of students in this category is too small for statistical accuracy or to protect student privacy.
C. Engagement
State Priority: Parental Involvement The SARC provides the following information relevant to the Parental Involvement State Priority (Priority 3): • Efforts the school district makes to seek parent input in making decisions for the school district and each schoolsite. Opportunities for Parental Involvement (School Year 2016-17)
Increase Parent Engagement by Community Liaison, Rosalinda Marquez 408-928-7400:
• Parent/community involvement/Volunteer recognition: • Parent Coffees/Cafes • Beautification Day • Movie/Literacy Nights (monthly by grade-level)
Parent outreach and training by Community Liaison, Rosalinda Marquez:
• Partnership Outreach • PTA Volunteers
Additional translation/interpretation support by Community Liaison, Rosalinda Marquez and district interpreters:
• Spanish Interpretation at Conferences and Parent Coffees, IEPs, SSC

2015-16 School Accountability Report Card for A.J Dorsa Elementary School Page 10 of 13
State Priority: School Climate The SARC provides the following information relevant to the School Climate State Priority (Priority 6): • Pupil suspension rates; • Pupil expulsion rates; and • Other local measures on the sense of safety. Suspensions and Expulsions
Rate School District State
2013-14 2014-15 2015-16 2013-14 2014-15 2015-16 2013-14 2014-15 2015-16
Suspensions------- 0.9 1.1 1.1 2.3 3.2 3.1 4.4 3.8 3.7
Expulsions------- 0.0 0.0 0.0 0.0 0.0 0.0 0.1 0.1 0.1
School Safety Plan (School Year 2016-17)
Dorsa Elementary's School Safety Plan was revised and presented to the School Site Council and Instructional Leadership teams for approval in January 2015. Three Safety Goals were approved by the Safety Committee. GOAL 1: To improve student on-task behaviors in class and on the playground by implementing PeaceBuilders® and Positive Behavior Intervention Support System (PBIS) © School wide with consistency by 100% of all staff after trainings conducted by the Principal Strategy 1.1: Train all supervising playground staff on PeaceBuilders and PBIS. Also train Principal’s Peace Officers who will give out PeaceBuilder Praise notes on the playground. Strategy 1.2: All teaching staff will receive training conducted by Principal who has been trained in the researched based programs of PeaceBuilders and PBIS- Positive Behavior Intervention Support in order to ensure that each adult consistently uses positive language and a positive tone to directly teach behavior skills. Strategy 1.3: All Classrooms will use the same positive discipline system including rules, sequenced consequences and a color code chart to acknowledge and hold students accountable for behavior changes. All staff will provide recognition and reward students who exhibit desired behaviors using a common understanding of school rules which are: “Be nice, Be safe, Do your personal best” and all staff will promote these rules with motivational praise and rewards. Assessment 1.1: A 25% reduction in playground referrals for misbehavior during recess and lunch recess. Assessment 1.2: A 25% reduction in classroom referrals for misbehavior during classroom time. Assessment 1.3: A school wide Behavior Management System using Positive Behavior Methods will be observable in every classroom through color code charts, posted rules and points as measured by walkthroughs. GOAL 2: Create a more efficient and safer process for dropping off and picking up students on a daily basis by increasing supervision of ingress and egress and by improving the site security through a system to keep the gates locked. Strategy 2.1: Principal and Para Educator Campus Supervisors will provide additional supervision of pick up and drop off times. Teachers and parent volunteers will provide additional supervision at pick up times. will patrol dropping off areas in back and front Strategy 2.2: Parents will be asked to drop off their children and not live park in parking lot or across the sidewalks through newsletters, parent meetings and directly by supervising staff. Strategy 2.3: Volunteers will be stationed at every gate to ensure that all visitors have a pass after the bell rings, during morning drop offs. The back gates will be locked at 8:30 am. Strategy 2.4 The County Programs using the back gates will be given keys so that they can lock the gates after their participants have entered the school grounds.

2015-16 School Accountability Report Card for A.J Dorsa Elementary School Page 11 of 13
Assessment 2.1: The Supervision Schedule for front lot duty. Assessment 2.2: Number of drivers following guidelines Assessment 2.3: Back gate lock schedule and County Staff procedures Assessment 2.4: All visitors will have passes after signing into the office. GOAL 3: Provide on-going training to establish an efficient and safe process for disaster response, crisis management, and emergency preparedness. Strategy 3.1: A School Safety Team will meet on a regular basis with the Principal to review and improve drill responses and to plan for more training for all staff and students. Strategy 3.2: A Team of staff will be assigned to an Incident Command System. Team members will be assigned to roles and teams including a Security Team; A First Aid Team, A Search and Rescue Team; A Student Release Team, and a Communications Team. Assessment 3.1: Notes from Safety Team meetings will show plans for trainings and results of drills in responses to more complex challenges. Assessment 3.2: Notes from staff meetings and trainings will show that staff has been trained and that drill responses have improved.
D. Other SARC Information
The information in this section is required to be in the SARC but is not included in the state priorities for LCFF. Federal Intervention Program (School Year 2016-17)
Indicator School District
Program Improvement Status In PI In PI
First Year of Program Improvement 2013-2014 2004-2005
Year in Program Improvement* Year 1 Year 3
Number of Schools Currently in Program Improvement N/A 8
Percent of Schools Currently in Program Improvement N/A 38.1 Note: Cells with N/A values do not require data.
Average Class Size and Class Size Distribution (Elementary)
Grade Level
2013-14 2014-15 2015-16
Avg. Class Size
Number of Classes Avg. Class Size
Number of Classes Avg. Class Size
Number of Classes
1-20 21-32 33+ 1-20 21-32 33+ 1-20 21-32 33+
K
18 4 20 3 1 20 3 1
1
21 1 3 21 1 3 21 1 3
2
23 4 20 4 20 4
3
19 1 4 22 1 4 22 1 4
4
26 3 32 2 32 2
5
30 3 29 3 29 3 Number of classes indicates how many classes fall into each size category (a range of total students per class).

2015-16 School Accountability Report Card for A.J Dorsa Elementary School Page 12 of 13
Academic Counselors and Other Support Staff (School Year 2015-16)
Title Number of FTE
Assigned to School Average Number of Students per
Academic Counselor
Academic Counselor------- 0 0
Counselor (Social/Behavioral or Career Development) 0 N/A
Library Media Teacher (Librarian) 1 N/A
Library Media Services Staff (Paraprofessional) 2 N/A
Psychologist------- 1 N/A
Social Worker------- 0 N/A
Nurse------- 1 N/A
Speech/Language/Hearing Specialist 1 N/A
Resource Specialist------- 1 N/A
Other------- 0 N/A Note: Cells with N/A values do not require data. *One Full Time Equivalent (FTE) equals one staff member working full time; one FTE could also represent two staff members who each work 50 percent of full time.
Expenditures per Pupil and School Site Teacher Salaries (Fiscal Year 2014-15)
Level
Expenditures Per Pupil Average Teacher Salary Total
Supplemental/ Restricted
Basic/ Unrestricted
School Site------- $9,003 $2,472 $6,531 $72,000
District------- N/A N/A $6,466 $74,018
Percent Difference: School Site and District N/A N/A 1.0 -2.7
State------- N/A N/A $5,677 $75,137
Percent Difference: School Site and State N/A N/A 15.0 -4.2 Note: Cells with N/A values do not require data.
Types of Services Funded (Fiscal Year 2015-16)
City Year (1st-5th Grades) and YMCA (Kindergarten) Extended Learning Time

2015-16 School Accountability Report Card for A.J Dorsa Elementary School Page 13 of 13
Teacher and Administrative Salaries (Fiscal Year 2014-15)
Category District Amount State Average for Districts In Same Category
Beginning Teacher Salary $48,684 $44,573
Mid-Range Teacher Salary $75,792 $72,868
Highest Teacher Salary $88,464 $92,972
Average Principal Salary (Elementary) $106,896 $116,229
Average Principal Salary (Middle) $112,241 $119,596
Average Principal Salary (High) $121,883
Superintendent Salary $185,000 $201,784
Percent of Budget for Teacher Salaries 41% 39%
Percent of Budget for Administrative Salaries 6% 5% For detailed information on salaries, see the CDE Certificated Salaries & Benefits Web page at http://www.cde.ca.gov/ds/fd/cs/. Professional Development (Most Recent Three Years)
• Professional Development: Benchmark ELA/ELD Reading Comprehension Annotation Strategies • PDs are offered after school on weekdays, mostly during Thursday early release days • PDs are offered within Professional Learning Communities (PLCs) throughout the week, where a substitute teacher takes the
teacher's classroom for a day • Teachers are supported by Data Chats with the Principal and Resource Teacher/Instructional Coach. • Student performance data reporting is monitored within iReady, an Individualized Learning Path program that places students
based on a Diagnostic, and monitors Growth through Growth Monitoring.