recording and analyzing nucleic acid distance
TRANSCRIPT

Recording and Analyzing Nucleic AcidDistance Distributions with X-RayScattering Interferometry (XSI)Thomas Zettl,1,2 Rhiju Das,2,3 Pehr A. B. Harbury,2,6 Daniel Herschlag,2,4,6
Jan Lipfert,1,6 Rebecca S. Mathew,5 and Xuesong Shi2
1Department of Physics, Nanosystems Initiative Munich, and Center for Nanoscience,LMU Munich, Munich, Germany
2Department of Biochemistry, Stanford University, Stanford, California3Department of Physics, Stanford University, Stanford, California4Department of Chemical Engineering, Stanford University, Stanford, California5Department of Cell Biology, Harvard Medical School, Harvard University, Boston,Massachusetts
6Corresponding authors: [email protected], [email protected],[email protected]
Most structural techniques provide averaged information or information about asingle predominant conformational state. However, biological macromoleculestypically function through series of conformations. Therefore, a complete un-derstanding of macromolecular structures requires knowledge of the ensemblesthat represent probabilities on a conformational free energy landscape. Herewe describe an emerging approach, X-ray scattering interferometry (XSI),a method that provides instantaneous distance distributions for molecules insolution. XSI uses gold nanocrystal labels site-specifically attached to a macro-molecule and measures the scattering interference from pairs of heavy metallabels. The recorded signal can directly be transformed into a distance distri-bution between the two probes. We describe the underlying concepts, present adetailed protocol for preparing samples and recording XSI data, and provide acustom-written graphical user interface to facilitate XSI data analysis. C© 2018by John Wiley & Sons, Inc.
Keywords: ensemble determination � energy landscape � gold nanocrystals� molecular ruler � structure determination � small angle X-ray scattering �
X-ray scattering interferometry
How to cite this article:Zettl, T., Das, R., Harbury, P. A. B., Herschlag, D., Lipfert, J.,
Mathew, R. S., & Shi, X. (2018). Recording and analyzing nucleicacid distance distributions with X-ray scattering interferometry(XSI). Current Protocols in Nucleic Acid Chemistry, e54. doi:
10.1002/cpnc.54
INTRODUCTION
Richard Feynman famously said “everything that is living can be understood in termsof the jiggling and wiggling of atoms” (Feynman, Leighton, & Sands, 1977, p. 3–6).Biological macromolecules such as unfolded or partially folded RNAs or intrinsicallydisordered proteins, are especially dynamic, given the noncovalent forces that hold themtogether, their aqueous surroundings, and physiological temperature that provides thermalenergy. Moreover, significant conformational changes of molecules can be triggered byexternal stimuli and are typically integrally involved in the functions of biomolecules
Current Protocols in Nucleic Acid Chemistry e54Published in Wiley Online Library (wileyonlinelibrary.com).doi: 10.1002/cpnc.54Copyright C© 2018 John Wiley & Sons, Inc.
Zettl et al.
1 of 22
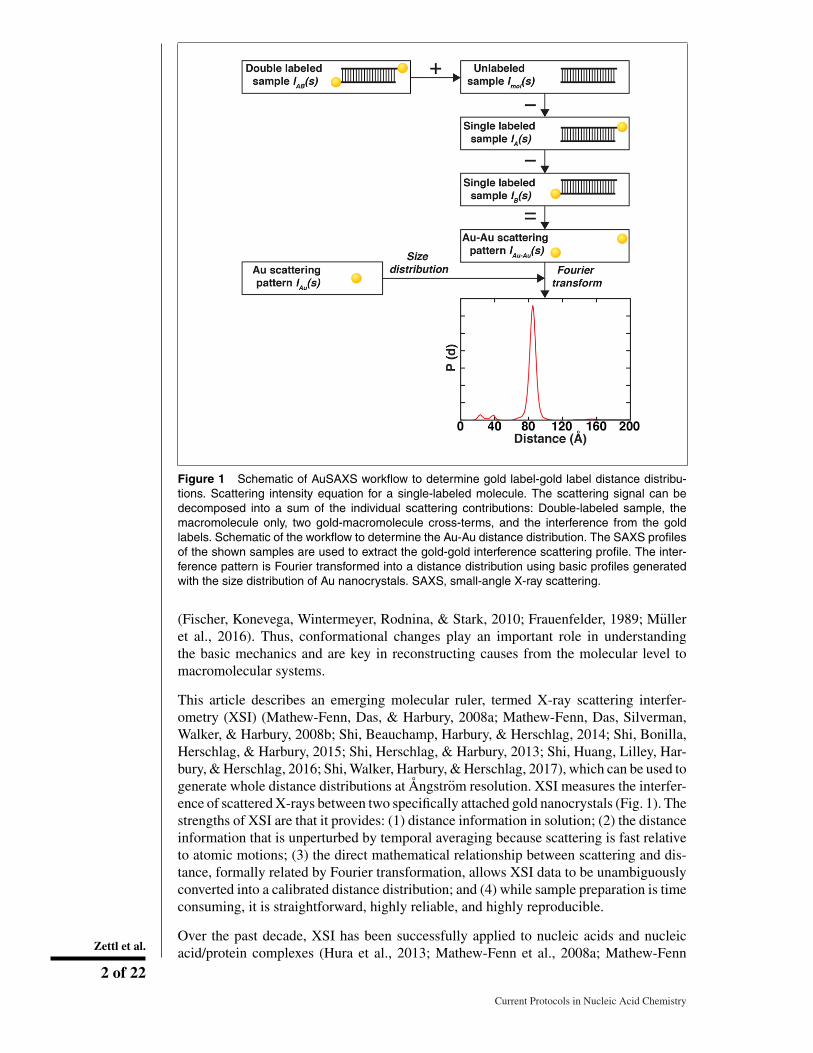
Figure 1 Schematic of AuSAXS workflow to determine gold label-gold label distance distribu-tions. Scattering intensity equation for a single-labeled molecule. The scattering signal can bedecomposed into a sum of the individual scattering contributions: Double-labeled sample, themacromolecule only, two gold-macromolecule cross-terms, and the interference from the goldlabels. Schematic of the workflow to determine the Au-Au distance distribution. The SAXS profilesof the shown samples are used to extract the gold-gold interference scattering profile. The inter-ference pattern is Fourier transformed into a distance distribution using basic profiles generatedwith the size distribution of Au nanocrystals. SAXS, small-angle X-ray scattering.
(Fischer, Konevega, Wintermeyer, Rodnina, & Stark, 2010; Frauenfelder, 1989; Mulleret al., 2016). Thus, conformational changes play an important role in understandingthe basic mechanics and are key in reconstructing causes from the molecular level tomacromolecular systems.
This article describes an emerging molecular ruler, termed X-ray scattering interfer-ometry (XSI) (Mathew-Fenn, Das, & Harbury, 2008a; Mathew-Fenn, Das, Silverman,Walker, & Harbury, 2008b; Shi, Beauchamp, Harbury, & Herschlag, 2014; Shi, Bonilla,Herschlag, & Harbury, 2015; Shi, Herschlag, & Harbury, 2013; Shi, Huang, Lilley, Har-bury, & Herschlag, 2016; Shi, Walker, Harbury, & Herschlag, 2017), which can be used togenerate whole distance distributions at Angstrom resolution. XSI measures the interfer-ence of scattered X-rays between two specifically attached gold nanocrystals (Fig. 1). Thestrengths of XSI are that it provides: (1) distance information in solution; (2) the distanceinformation that is unperturbed by temporal averaging because scattering is fast relativeto atomic motions; (3) the direct mathematical relationship between scattering and dis-tance, formally related by Fourier transformation, allows XSI data to be unambiguouslyconverted into a calibrated distance distribution; and (4) while sample preparation is timeconsuming, it is straightforward, highly reliable, and highly reproducible.
Over the past decade, XSI has been successfully applied to nucleic acids and nucleicacid/protein complexes (Hura et al., 2013; Mathew-Fenn et al., 2008a; Mathew-FennZettl et al.
2 of 22
Current Protocols in Nucleic Acid Chemistry
et al., 2008b; Shi et al., 2014; Shi et al., 2015; Shi et al., 2013; Shi et al., 2016; Shiet al., 2017). Labeling strategies employing gold nanocrystals of various sizes, diversemacromolecules, and variable attachment positions have been reported. So far, demon-strated labeling strategies include: (1) end-labeled DNA nanocrystal conjugates (Ack-erson, Sykes, & Kornberg, 2005; Alivisatos et al., 1996; Mathew-Fenn et al., 2008a;Mathew-Fenn et al., 2008b; Shi et al., 2014; Shi et al., 2015; Shi et al., 2013), (2) end-labeled RNA molecules (Shi et al., 2015; Shi et al., 2016; Shi et al., 2017), (3) gold labelspositioned at defined internal sites of DNA or RNA helices (Mathew-Fenn et al., 2008a;Shi et al., 2014; Shi et al., 2015; Shi et al., 2013; Shi et al., 2016; Shi et al., 2017), and(4) protocols to form single-labeled protein constructs (Aubin-Tam & Hamad-Schifferli,2005; Aubin-Tam, Hwang, & Hamad-Schifferli, 2009; Azubel & Kornberg, 2016).
This article covers the design and preparation of end-labeled nucleic acid samples. Belowwe present the procedures required to prepare samples, to acquire XSI data, and togenerate ensemble distance distributions. Basic Protocol 1 describes sample preparationfor end-labeled nucleic acid gold conjugates and includes a protocol for gold nanocrystalsynthesis. Basic Protocol 2 describes the acquisition of a full data set at a synchrotronradiation facility for XSI analysis. Basic Protocol 3 describes the data analysis of XSI dataand the use of a custom-written graphical user interface (GUI) in MATLAB. The detailedprotocols and the user interface presented in this chapter will enable scientists interestedin molecular distance measurements to perform and analyze XSI measurements easily.
BASICPROTOCOL 1
SAMPLE PREPARATION
In this article, we focus on the preparation of end-labeled nucleic acid samples for XSI.An additional protocol on labeling proteins will be forthcoming.
Briefly, thioglucose-protected gold nanocrystals are synthesized using the method ofSchaaff and coworkers (Schaaff, Knight, Shafigullin, Borkman, & Whetten, 1998). DNAor RNA oligonucleotides are ordered with a C3-thiol modification, from a commer-cially available source, for end labeling or a C2 dT amino modification for internallabeling. High-performance liquid chromatography (HPLC), performed either in-houseor by the oligonucleotide vendor, is used to purify the oligonucleotides. In the case ofthe internal C2 dT amino modification, the amino group is converted to a thiol groupusing the commercially available N-succinimidyl 3-(2-pyridyldithio)propionate (SPDP)cross-linker. For a detailed protocol of internal label attachment see Shi et al., 2015. Thegold nanocrystals couple to thiol groups, forming stable conjugates. A second HPLCpurification step is used to purify 1:1 nanocrystal-nucleic-acid conjugates, eliminatingnanocrystals coupled to multiple oligonucleotides and excess gold particles. Finally,modified and unmodified single-stranded molecules are mixed in various combinationsto form a sample quartet, which consists of one unmodified construct, two complemen-tary single-labeled molecules with a single gold nanocrystal attached to one of the twolabeling sites respectively, and one double-labeled construct. After HPLC purificationand desalting, these duplexed constructs can be stored at –20°C for several months. Afull set of samples is required for the data analysis to work as explained in detail in BasicProtocol 3.
The protocol below describes: (1) the synthesis of monodisperse, thiol-passivated goldnanocrystals with 0.7 nm radius; (2) the preparation of end-labeled gold-oligonucleotideconjugates; and (3) the preparation of a sample quartet that is ready for XSI data acqui-sition. The concentrations cited below are based on ordering a 200 nmol scale nucleicacid synthesis, and can be adjusted for alternate quantities of starting material.
Zettl et al.
3 of 22
Current Protocols in Nucleic Acid Chemistry

CAUTION: Some of the chemicals and reagents used are flammable. Refer to materialsafety data sheets prior to use. Conduct reactions in a well-ventilated fume hood and usestandard laboratory protective equipment.
NOTE: Use ultrapure water in all solutions and protocol steps.
Materials
Fast protein liquid chromatography (FPLC) cleaning solution (see recipe)Size exclusion running buffer (see recipe)IsopropanolMethanolAcetic acidHydrogen tetrachloroaurate(III) hydrate (Sigma Aldrich, cat. no. 50790)1-Thio-β-D-glucose (Sigma Aldrich, cat. no. T6375)Sodium borohydride3ʹ-Thiol modified oligonucleotides [Integrated DNA Technologies (IDT) or
Stanford Protein and Nucleic Acid (PAN) Facility]Oligonucleotides2 M ammonium acetate, pH 5.6Low salt borate buffer (see recipe)High salt borate buffer (see recipe)EthanolMagnesium chloride (MgCl2)1 M Tris·Cl, pH 9.0Low salt ammonium acetate buffer (see recipe)High salt ammonium acetate buffer (see recipe)
G25 column, 26/10 housing (Sigma Aldrich, cat. no. GE17-5087)FPLC system (dual wavelength detector recommended)Superdex 30 column, 16/600 housing (Sigma Aldrich, cat. no. GE28-9893-31)250-mL round-bottom flaskOptional: Addition funnel with metering valve (e.g., Chemglass Life Sciences, cat.
no. CG-1714)Magnetic stirrer/hotplateVortexer0.22-μm syringe filter units3 kDa and 10 kDa Amicon spin filtration units (Sigma Aldrich)Dionex DNAPac Pa200 column, 9/250 housing (Thermo Fisher Scientific, cat. no.
063421)HPLC system (dual wavelength detector recommended)Rotary evaporator equipped with water bath, dry ice condenser, and connected to
an oil pump–20° or –80°C freezerNanodrop ND-1000 spectrophotometer or other UV spectrophotometer
Preparation of FPLC columns (start 2 days in advance)
1. Using a flow rate of 2 mL/min, wash G25 column with two column volumes water,followed by four column volumes FPLC cleaning solution. Equilibrate column withfour column volumes water.
2. Using a flow rate of 0.75 mL/min, wash Superdex 30 column with two columnvolumes water, followed by five column volumes FPLC cleaning solution. RemoveFPLC cleaning solution with five volumes water. Finally, equilibrate Superdex 30with two column volumes size exclusion running buffer.
Zettl et al.
4 of 22
Current Protocols in Nucleic Acid Chemistry

The gold nanocrystals cause the column resin to turn brown. This coloration is reversedby the DTT in the cleaning solution. If the resin does not revert to off-white after fivecolumn volumes, apply additional cleaning solution before equilibrating the column.Start the cleaning and equilibration of both columns at least 1 day before the synthesis.
Synthesis of gold nanocrystals (4 hr)
3. Rinse a 250-mL round-bottom flask with isopropanol, dry in a heated oven, and cool(to room temperature). Add stir bar, cap flask with Parafilm, and mount flask abovea magnetic stir plate.
4. Prepare 72 mL 5:1 (v/v) methanol/acetic acid (60 mL methanol, 12 mL acetic acid).
5. Weigh 0.544 g hydrogen tetrachloroaurate(III) hydrate and immediately transfer toround-bottom flask. Add 36 mL 5:1 methanol/acetic acid solution to the flask; colorshould be a clear, bright orange.
6. Dissolve 1 g 1-thio-β-D-glucose in 36 mL 5:1 methanol/acetic acid mixture andvortex solution until the powder is fully dissolved.
7. Add dissolved 1-thio-β-D-glucose to the 250-mL round-bottom flask; solution shouldturn cloudy. Stir mixture 20 min at room temperature.
8. Weigh 0.9 g sodium borohydride and dissolve in 20 mL water (H2O) by vortexing.
9. Carefully add sodium borohydride solution dropwise to reaction flask over 12 to15 min. Use a 1-mL pipet for this step or alternatively an addition funnel with ametering valve. Set the stirring rate to allow rapid intermixing of the droplets.
It is critical to keep the addition rate and droplet volume constant to ensure monodisperseand high-quality gold nanocrystals.
10. Stir mixture 30 min at room temperature.
11. Concentrate resulting solution (�92 mL) to 12 to 20 mL using a rotary evaporator.Maintain water bath at room temperature.
Purification of gold nanocrystals (10 hr)
12. Filter crude nanocrystal solution using a 0.22-μm filter unit and store solution onice.
13. Desalt filtered nanocrystals with the prepared G25 column. Split total volume intotwo to three runs. Load 1 aliquot solution (at most 5 mL with a standard sampleloop) while applying a flow rate of 2 mL/min using water as the running buffer. SetFPLC system up to monitor 260 or 280 nm to detect Au nanocrystals.
Particles should elute between 8 and 14 min (see Fig. 2). Also monitor conductance ofthe solution to detect the salt peak, which elutes after the nanocrystals.
Repeat desalting procedure for additional aliquots.
The desalted Au nanocrystals are stable and can be stored at 4°C up to a few days or at–20°C for months.
14. Concentrate desalted Au nanocrystal solution to 10 mL with centrifugal filter units(3 kDa cutoff, 15 mL, 3000 × g, 40 min) at 4°C.
The flow through should be clear.
15. Purify a monodisperse population of Au nanocrystals on Superdex 30 size exclusioncolumn (see Fig. 3). Set up FPLC system to monitor 260 or 280 nm to detectthe nanocrystals; up to 5 mL of sample can be injected per run. After loading
Zettl et al.
5 of 22
Current Protocols in Nucleic Acid Chemistry

Figure 2 A sample FPLC chromatogram of Au nanocrystal desalting. The absorption of the Aunanocrystals (blue) is monitored at 260 nm and separated from the salt front (red) observed bya peak in conductivity. The sample eluting between the two dashed lines was used. FPLC, fastprotein liquid chromatography.
Figure 3 A sample FPLC chromatogram of Au nanocrystal size exclusion. The absorption of theAu nanocrystals (blue) is monitored at 260 nm. The sample between the two dashed lines can beused for a highly uniform particle size distribution. FPLC, fast protein liquid chromatography.
an aliquot of filtered, desalted, and concentrated nanocrystal solution, apply sizeexclusion running buffer at 0.75 mL/min for at least 210 min. Collect only thecenter of largest Au nanocrystal elution peak (see Fig. 3), and discard lower andupper shoulders. Immediately desalt solution using H2O and centrifugal filter units(3 kDa cutoff, 15 mL) at 3000 × g, 4°C. Repeat centrifugal desalting three timesand pool concentrated particles after the final run.
16. Determine final gold nanocrystal concentration by measuring UV absorption; ex-tinction coefficient is 0.076 μm/cm at 360 nm. Store solution at –20°C.
Typically one synthesis yields 3 to 10 µmol of purified gold nanocrystals.
Preparation of gold nanocrystal-nucleic acid conjugates
17. Prepare oligonucleotides (�8 hr for four oligonucleotides): Purchase 3ʹ-thiol mod-ified oligonucleotides (C3-S-S) and unmodified oligonucleotides with the samesequences.Zettl et al.
6 of 22
Current Protocols in Nucleic Acid Chemistry

It is critical to use the short three-carbon linker for end-labeled samples to ensurehigh-quality results for the measurements of the distance distributions.
Design construct such that the terminating bases are GC base pairs to minimize endfraying.
18. Purify ordered oligonucleotides using the Dionex DNAPac 200 and anion exchangeHPLC. Inject up to 100 nmol oligonucleotide onto the column and apply a flow rateof 3 mL/min.
The salt gradient is formed from low salt borate buffer and high salt borate buffer.
Tune the period of the gradient according to the length of your oligonucleotide.Perform an analytical run before the preparative runs to determine elution time ofthe product. For analytical runs, adjust injected sample according to the instrumentdetection sensitivity.
19. Desalt purified oligonucleotides by buffer exchange into water using centrifugalfilter units and H2O (3 kDa cutoff, 4 mL, 4,000 × g in a swinging basket centrifugeor 7500 × g in a fixed angle rotor, 30 min, 4°C). Repeat this step three times. Reducevolume to �40 μL using centrifugal filter units (3 kDa cutoff, 0.5 mL, 14,000 × gusing a benchtop centrifuge, 30 min, 4°C).
Typically, �60 nmol of oligonucleotide remain after purification of a 200 nmol scalesynthesis.
To protect against loss of oligonucleotide from a broken filter unit, keep flow throughand check its absorbance at 260 nm; the oligonucleotides can be stored in a freezerat –20°C.
Thiol-modified oligonucleotides (�3 hr)
20. Immediately before coupling oligonucleotides to gold nanocrystals, ensure pendantthiols are fully reduced by adding 150 μL 200 mM DTT and 50 mM Tris·Cl,pH 9.0. Incubate 30 min, 60°C for DNA or 50°C for RNA.
The DTT can be replaced by immobilized TCEP Reducing Gel (Thermo Fisher Scientific,cat. no. 77712). Follow the manual provided by the vendor to reduce and extract theoligonucleotides and proceed with step 23.
21. Purify oligonucleotide by ethanol precipitation. Add 2 μL 2 M MgCl2 and 1 mLcold ethanol and mix solution. Incubate mixture on dry ice 40 min. Spin mixture(15,000 × g, 30 min, 4°C). Remove supernatant and wash with 1 mL ethanol. Spinmixture again (15,000 × g, 15 min, 4°C) and remove supernatant. Be careful not todisturb the precipitated pellet on the bottom.
22. Dissolve precipitated pellet in 500 μL H2O and add it to a filter unit (3 kDa,0.5 mL). Spin solution (14,000 × g, 30 min, 4°C) to remove residual DTT anddetermine final concentration of oligonucleotide by UV absorption at 260 nm. Useextinction coefficient provided by the manufacturer or calculate it using the nucleicacid sequence (e.g., OligoAnalyzer 3.1 http://www.idtdna.com/calc/analyzer). If astrong absorbance at 230 nm and a shoulder peak above 300 nm is observed, repeatthis step to remove excess DTT. Keep flow-through to test for broken filter units.Immediately proceed to step 23.
Conjugate oligonucleotides and nanocrystals (�8 hr)
23. Add a 6-fold molar excess purified and desalted gold nanocrystals to the reducedoligonucleotide and vortex mixture (i.e., add 300 nmol Au particles to 50 nmololigonucleotides). Add 20 μL 1 M Tris·Cl, pH 9.0 and vortex again. Incubatesolution 2 hr at room temperature.
Zettl et al.
7 of 22
Current Protocols in Nucleic Acid Chemistry

Figure 4 Example scattering profiles of XSI samples. (A) Buffer-only scattering profile usedfor buffer subtraction (blue), scattering profile of an unlabeled sample without (brown) and withbuffer subtraction (red). (B) Ten individual exposures for a double-labeled sample recorded inone run. All profiles match and thus radiation damage can be excluded. These scattering profilesare buffer subtracted. (C) One full set of samples including one double-labeled sample (red), twoorthogonal single-labeled samples (green, gray), bare gold nanocrystals (yellow), and unlabeledsample (blue). All scattering profiles are buffer subtracted. XSI, X-ray scattering interferometry.
24. Add 15 μL 2 M ammonium acetate, pH 5.6 to stop reaction and store mixture onice.
25. Purify solution using the Dionex DNAPac 200 and anion exchange HPLC. Eluteconjugates with a salt gradient using a low salt acetate buffer and a high salt acetatebuffer. Tune period of gradient according to the length of your oligonucleotide.
Typically, 15-mer DNA-gold nanocrystal conjugates elute at around 40% high salt buffer.
Set flow to 3 mL/min and monitor absorbance at 260 and 360 nm.
The oligonucleotides only absorb at 260 nm whereas the gold nanocrystals absorb at bothwavelengths. Typically, oligonucleotides with a single gold nanocrystal elute earlier thanunlabeled oligonucleotides of the same length. Free gold nanocrystals elute very earlyand gold nanocrystals with multiple oligonucleotides elute later than 1:1 conjugates. Fora detailed chromatogram see Shi et al., 2015.
Use a small amount of sample to perform an initial analytical run, so that you canto make adjustments to the salt gradient if required.
26. Desalt gold-oligonucleotide conjugates using centrifugal filter units (3 kDa, 4000 ×g, 35 to 40 min, 4°C) and H2O. Repeat this step three times. Determine concentrationof purified conjugate by measuring absorption at 360 nm (0.076 μM/cm).
The desalted conjugates are stable and can be stored at –20°C for months. Typically,12 nmol of sample can be recovered.
Preparation of final duplex conjugates for a sample quartet (�5 hr)
27. Mix pairs of complementary single-stranded oligonucleotides in equimolar ratio andincubate DNA at room temperature or RNA at 40°C, 30 min.
A samples quartet consists of a double-labeled sample with two modified strands, twosingle-labeled samples with a single modified strand, and an unlabeled sample (seeFig. 1 and Fig. 4). Use unmodified oligonucleotides for unlabeled sample or as thecomplementary strand for single-labeled samples.
Use desalted oligonucleotides from step 26. If your structure does not form in H2O androom temperature only, add the required buffer and salt to the solution and performthermal annealing.
Zettl et al.
8 of 22
Current Protocols in Nucleic Acid Chemistry

28. Purify annealed constructs by anion exchange HPLC using the same approach as instep 25. Use a small amount of sample to perform an initial analytical run to allowadjustments to salt gradient if required.
The duplex constructs typically elute later then single-stranded conjugates.
29. Collect desired HPLC fractions and immediately desalt them using centrifugal filterunits (10 kDa, 4000 × g, 15 min, 4°C) and H2O. Repeat this step three times. De-termine concentration of purified conjugate by measuring the absorption at 360 nm(0.076 μM/cm for single-labeled samples and 0.152 μM/cm for double-labeledsamples).
Typically, 2 to 3 nmol of each final duplexed construct should be obtained. The desaltedconjugates are stable and can be stored at –20°C for months.
BASICPROTOCOL 2
COLLECTING X-RAY SCATTERING INTERFEROMETRY DATA
To date, XSI data has been successfully recorded at beamline 4-2 of the Stanford Syn-chrotron Radiation Lightsource (SSRL; Mathew-Fenn et al., 2008a; Mathew-Fenn et al.,2008b; Shi et al., 2014; Shi et al., 2013; Shi et al., 2016; Shi et al., 2017), beamline 12-IDof the Advanced Photon Source (APS; Mathew-Fenn et al., 2008a; Mathew-Fenn et al.,2008b), the SIBLYS beamline of the Advanced Light Source (ALS; Hura et al., 2013),and the BM29 beamline of the European Synchrotron Radiation Facility (ESRF; seeFig. 5). In general, measurements can be carried out at any synchrotron with beam linesset up for small-angle X-ray scattering (SAXS) measurements that meet the followingrequirements:
(1) S-range: 0.0015 to 0.11 A−1 (optimal, for details see below) corresponding to aq-range 0.01 to 0.7 A−1
(2) X-ray energy: 9 to 15 keV (9 to 11 keV is optimal). This is the tested energy rangeused in experiments to date, for details see below.
(3) Sample volumes: 16 to 40 µL is the typical amount used at state-of-the-art syn-chrotrons (Lipfert, Millett, Seifert, & Doniach, 2006). This amount allows for tenindependent exposures without requiring large quantities of sample.
It is important to pay attention to the definition of the magnitude of the momentumtransfer vector S as two different conventions are used. In this protocol S is defined asS = 2sin(θ /λ), q is defined as 4·π ·sin(θ /λ), where λ is the X-ray wavelength and θ is halfthe total scattering angle. S is alternatively reported in units of A−1 and nm−1. We reportS in A−1 in this protocol. Set up a sample-to-detector distance that covers an S-range
Figure 5 Maximum entropy analysis of XSI data. (A) Radius distribution of gold nanocrystalsused to generate basis profiles I(S,D). (B) Calculated interference pattern for the example dataset, and (C) final distance distribution averaged over 10 maximum entropy fitting runs. XSI, X-rayscattering interferometry. Zettl et al.
9 of 22
Current Protocols in Nucleic Acid Chemistry

from 0.0015 to 0.11 A−1 (for example, this corresponds to a sample-to-detector distanceof 1.1 meter for the Pilatus 300K detector at 11 keV on Stanford beamline 4-2). Typically,the sample and detector configuration must be arranged with beamline scientists well inadvance of data collection, since it requires hardware alignment and calibration. If thebeamline cannot cover the full “optimal” S-range (0.0015 to 0.11 A−1), Smax should notbe <0.095 A−1 as the labeled samples and the bare gold particles contribute scatteringintensities up to 0.085 A−1. This is crucial for obtaining a valid interference profile bythe analysis procedure described below. If the chosen beamline cannot reach this Smax forlower X-ray energies, one solution is to extend the S-range by selecting higher energies(for example, using 15 keV instead of 11 keV). However, X-ray energies close to goldabsorption edges (L-III at 11.92 keV, L-II at 13.73 keV, and L-I at 14.35 keV) shouldbe avoided and energies below L-III are preferable to minimize X-ray fluorescence fromthese edges. Be aware that important details of the scattering profile can be lost in thelow S-range for X-ray energies chosen too low or depleted by a low signal-to-noise ratioat X-ray energies set too high. (For general protocols on SAXS sample preparation, datacollection, and data analysis see Burke & Butcher, 2012; Doniach & Lipfert, 2012; Dyeret al., 2014; Grishaev, 2012; Hura et al., 2013; Jeffries et al., 2016; Lipfert & Doniach,2007; Rozners, 2010; Lipfert & Doniach, 2007; Tuukkanen, Spilotros, & Svergun, 2017.)
NOTE: Use ultrapure water in all solutions and protocol steps.
Materials
Scattering standard sample (e.g., cytochrome c)Tris·Cl buffer, pH 7.4Sodium ascorbateSodium chloride (NaCl)Purified gold nanocrystal sample for titration series (10 nmol; see Basic Protocol 1)Purified double-labeled sample (1 nmol per buffer condition; see Basic Protocol 1)Purified 2× orthogonal single-labeled samples (1 nmol per buffer condition each;
see Basic Protocol 1)Purified unlabeled sample (1 nmol per buffer condition; see Basic Protocol 1)Sample buffer (e.g., 10× buffer: 700 mM Tris·Cl, pH 7.4, 100 mM sodium
ascorbate, 1.5 M NaCl, and 10 mM MgCl2)MilliQ water
UV/vis spectrometerVortex mixer−20 or −80°C freezerMicrocentrifuge0.5 mL centrifugal filters (Amicon Ultra)
NOTE: The protocol below is a suggested workflow for data acquisition at a synchrotronfacility. It may vary based on the instrument set up at the facility.
Sample preparation and set up initialization
1. If you are not familiar with the beamline and settings, record data for a standard,e.g., cytochrome c (Lipfert et al., 2006) and compare it to benchmark profiles (seeSmall Angle Scattering Biological Data Bank, https://www.sasbdb.org/).
2. Prepare 10× buffer mixture containing Tris·Cl, pH 7.4, and sodium ascorbate to-gether with desired amount of additional salt and other components (e.g., ligands)required for the experiment.
An example 10× buffer solution for near-physiological conditions is 700 mM Tris·Cl,pH 7.4, 100 mM sodium ascorbate, 1.5 M NaCl, and 10 mM MgCl2.Zettl et al.
10 of 22
Current Protocols in Nucleic Acid Chemistry

Use Vortex mixer to ensure proper mixing of components.
It is important to use sodium ascorbate and Tris as radical scavengers in the buffersolution to capture free radicals and thus to reduce radiation damage to your sampleduring X-ray exposure; this allows longer total exposure times and therefore a bettersignal-to-noise ratio.
Replace sodium ascorbate stock solution every 3 hr to ensure good scavenger capa-bility. Cover sodium ascorbate with aluminum foil or store in a dark place.
3. Total exposure time depends on the flux at the synchrotron beamline used. In a typ-ical scheme used at beamline 4-2, set total exposure time to 30 sec as a series of tenindependent repeats of 3 sec each for data collection. Screen each trace for radiationdamage, which can be detected by a gradual change in scattering intensity espe-cially in the low S-range region in subsequent X-ray exposures. Exclude scatteringprofiles with oxidative damage determined from subsequent analysis; do not reusesamples that have been exposed to the X-ray beam. If photon flux is much less than1012 photons/sec, extend total exposure time.
4. Determine concentration of your sample using a UV/vis spectrometer (see BasicProtocol 1, step 29).
The extinction coefficient of the gold nanocrystals is 0.076 μM/cm at 360 nm.
5. Record a titration series of gold nanocrystal for every beam time as a scatteringstandard and to obtain nanocrystal size distribution required for further analysis.
A typical concentration series is 200, 100, 50, and 25 µM gold particles (include higherconcentrations if they are necessary for your experiment). The shape of the scatteringprofile should not change with concentration and the scattering profiles should be su-perimposable after normalization. Interparticle scattering should be avoided. It can bedetected by a concentration-dependent change in the scattering profile at low S.
6. Store gold-labeled samples on dry ice or in a freezer at −20°C until the beamline isset up for experiments. During data acquisition, store sample stock solutions on iceor in fridge.
7. Thaw required amount of sample to room temperature and vortex before measure-ments.
8. Combine 10× buffer, water, and concentrated sample to achieve a 30µM final sampleconcentration (e.g., 0.9 nmol sample in 30 µL). If it is not possible to prepare bufferas a 10× stock solution (e.g., due to solubility limitations) or if concentration ofcharge of the macromolecule is comparable to the concentration of counterionsin solution at very low ionic strength, prepare sample by buffer exchange usingcentrifugal filter units with a suitable molecular weight cutoff (e.g., 10 kDa Amicon,three repeats, 35 min each).
9. Spin final sample mixture 2 min at 10,000 × g at 4°C to sediment out any largecontaminant particles.
Large particles strongly perturb the scattering signal, as the forward scattering intensityof an object grows quadratically with its molecular mass.
Data recording
10. Prepare five samples for data collection.
The full set of samples consists of an unlabeled molecule sample, two complementarysingle-labeled samples, one double-labeled macromolecule sample, and a buffer-onlysample (Fig. 4). Again, the concentration of the macromolecule should be at least 30 µMin 1× buffer to provide a good signal-to-noise ratio. Zettl et al.
11 of 22
Current Protocols in Nucleic Acid Chemistry

Measure scattering profiles of the five samples on the same set up, in direct succes-sion, to keep conditions as similar as possible. Always record buffer-only scatteringprofile (at least) twice, once at the beginning of the acquisition sequence and once atthe end (e.g., buffer, unlabeled molecule sample, two complementary single-labeledsamples, double-labeled macromolecule sample, and buffer again).
An automated sample changer installed at the beamline can aid data collection for sucha series.
11. Repeat five-sample data acquisition sequence with each macromolecule constructand/or condition in your experiment (e.g., at varying salt concentrations, with andwithout ligand binding partners).
BASICPROTOCOL 3
ANALYZING X-RAY SCATTERING INTERFEROMETRY DATA
The data obtained at the beamline can be processed either by applying individual scriptsstep by step or using the custom written graphical user interface (GUI) in Matlab(au_saxs_gui.m, see Materials). The underlying principles are described in detail byMathew-Fenn et al. (2008b) and a brief summary follows.
After standard SAXS data processing, as outlined below, the radius distribution of thespherical gold nanocrystals is determined first, from scattering data of the unconjugatedgold labels. To accomplish this, the recorded scattering profile of the gold nanocrystalsis decomposed into a volume-weighted sum of scattering profiles of spheres with radiiranging from 1 to 100 A. Using the nanocrystal synthesis protocol described above,(Mathew-Fenn et al., 2008a; Mathew-Fenn et al., 2008b; Shi et al., 2015) the nanocrystalsize distribution should have a radius centered at 6 to 7 A. The obtained radius distribu-tion is then used to calculate the precise basis scattering functions I(S,D), which are thescattering interference patterns for two nanocrystals separated by a fixed center-to-centerdistance D, where D is varied from 1 to 200 A. These basis functions will be used to de-compose IAu-Au(S), which is the experimentally determined scattering interference patternfor the two gold nanocrystals attached to the macromolecule. Importantly, the measuredscattering profile from the double-labeled macromolecule includes contributions fromthe macromolecule itself and from the cross-scattering terms between the gold labels andthe macromolecule, in addition to IAu-Au(S).
To extract IAu-Au(S), the scattering profiles for the quartet of samples must be summedand the summation requires that the profile intensities are accurately scaled relative toeach other. The most difficult part of the data processing is finding the correct scalingfactors, denoted cU, cA+B, and cBuf (see Eqn. 2 and 3). To do this, the measured scatteringprofiles of the double-labeled, single-labeled, and unlabeled constructs and of the buffer(IAB(S), IA(S), IB(S), IU(S), and IBuf(S)) are first transformed into interatomic Pattersondistributions PAB(D), PA(D), PB(D), PU(D), and PBuf(D), using point-scatterer basis func-tions (see Eqn. 1). Using the measured scattering profiles and the Patterson distributions,the scaling factors are optimized to satisfy two constraints: (1) that the integral of thesinusoidal function S•IAu-Au(S) sums to zero (Eqn. 4), and (2) that none of the computedinteratomic distances between gold labels are negative, which should not be possible(Eqn. 5). Deviations from these constraints are summed together in a target function T(see Critical Parameters and Troubleshooting), and the scaling factors that minimize Tare determined. Using the optimized scaling factors, the measured profiles are summedto obtain IAu-Au(S).
I (S) =Dmax∑
Dmin
P (D) · sin (2π DS)
(2π DS)
Equation 1Zettl et al.
12 of 22
Current Protocols in Nucleic Acid Chemistry
IAu−Au (S) = IAB (S) + cU · IU (S) − cA+B · (IA (S) + IB (S)) + cBu f · IBu f (S)
Equation 2
PAu−Au (D) = PAB (D) + cU · PU (D) − cA+B · (PA (D) + PB (D)) + cBu f · PBu f (D)
Equation 3
Smax∑
Smin
IAu−Au (S) · S ≈ 0
Equation 4
PAu−Au (D) > 0 f or D ∈ [Dmin; Dmax]
Equation 5
Finally, IAu-Au(S) is decomposed into a sum of the I(S,D) basis functions using a maximumentropy algorithm, resulting in a center-to-center distance distribution between the twogold nanocrystals of the double-labeled sample (Eqn. 1). Alternatively, the IAu-Au(S)decomposition can be performed using non-negative least squares algorithms that areavailable in most scientific programming languages.
Some beamlines, such as the beamline 4-2 at SSRL and beamline BM29 at ESRF,provide beamline software packages that perform radial averaging and buffer subtractionof scattering profiles, which allows for immediate detection of radiation damage or othertechnical problems.
Materials
Data set including scattering profiles from:Gold nanocrystal sample (e.g., see Basic Protocol 2)Double-labeled sample (e.g., see Basic Protocol 2)Orthogonal single-labeled samples (two individual scattering profiles; e.g., see
Basic Protocol 2)Unlabeled sample (e.g., see Basic Protocol 2)Sample buffer (e.g., see Basic Protocol 2)Computer (minimum requirements: Any Intel or AMD x86-64 processor, 2.5 GB
Disk space, 2 GB RAM)MATLAB license, graphical user interface (GUI) support from version 2015b
guaranteedAu-SAXS graphical user interface (GUI)
(https://gitlab.physik.uni-muenchen.de/Jan.Lipfert/AuSAXSGUI.git)Example files (https://gitlab.physik.uni-muenchen.de/Jan.Lipfert/AuSAXSGUI.git)
A step-by-step guide on how to obtain the scattering interference pattern IAu-Au(S), in-cluding an example set of data (see exemplary files), is given below.
Data preparation
1. If it has not already been done automatically by the beamline software, reduce2D scattering matrix into a one-dimensional scattering profile by radial averaging:The output should be a matrix with three columns for scattering momentum trans-fer vector S, corresponding scattering intensity, and variance/standard deviation inscattering intensity at different radial positions.
If the incident X-ray beam is polarized, simple radial averaging cannot be performed.See Pauw, 2014 and Svergun & Koch, 2003 for further instruction on how to process theraw data into one-dimensional scattering profiles.
Zettl et al.
13 of 22
Current Protocols in Nucleic Acid Chemistry

Figure 6 GUI to analyze XSI data. Default values can be modified to adjust the data analysis.The GUI contains panels to specify the following: (1) storage path of the data; (2) adjust qmin;(3) adjust qmax; (4) specify the momentum transfer convention according to the scattering data;(5) specify the number of samples; and (6) specify the number of exposures per sample. GUI,graphical user interface; XSI, X-ray scattering interferometry.
2. Before starting the custom written au_saxs_gui.m GUI and loading data, renamedata files ‘*_i.dat’ where * is any name for the sample and i is the ith exposure, i.e.,ranging from 01 to 10 for 10 exposures per molecule (‘AB_01.dat’, ‘AB_02.dat’,‘AB_03.dat’, . . . , for double-labeled samples). Structure data files so that the scat-tering momentum vector occupies the first column, the corresponding recordedscattering intensity occupies the second column, and the variance/standard devia-tion occupies the third column. Separate column entries by a single blank space (seeexample files for comparison).
3. Initialize GUI by executing ‘au_saxs_gui.m’ script.
For proper execution, files ‘au_saxs_gui.m’, ‘au_saxs_gui.fig’, and folder ‘subroutines’have to be stored in the same directory to allow the main script to find the requiredsubroutines.
Data initialization
4. Enter the full path into the field ‘Data path’ (Fig. 6, panel 1).
5. Optional: Manipulate scattering momentum by setting the lower (qmin; Fig. 6,panel 2) and the upper (qmax; Fig. 6, panel 3) limit for the scattering angle.
The default input is the 35th data point of the initial data up to data point 500; however,this strongly depends on the settings of the beamline and type of sample.
6. Optional: Untick ‘Data is in q’ box (Fig. 6, panel 4) to switch scattering momentumvector to S [2sin(θ /λ) in A−1].
The scattering momentum vector is set to q per default [4π sin(θ /λ), in A−1] since q isthe common output format at synchrotrons.
7. Optional: Modify number of samples (Fig. 6, panel 5), if required.
Default is 5 for one full set of samples.Zettl et al.
14 of 22
Current Protocols in Nucleic Acid Chemistry

Figure 7 GUI to analyze XSI data. Sample and corresponding buffer filenames, sample concen-tration, and save as filename (optional) are entered for a full set of data (1). Initial files are loaded(2) and can be plotted (4–6; optional). Unified and truncated scattering profiles can be saved (3).All figures except for the main GUI can be closed (7). GUI, graphical user interface; XSI, X-rayscattering interferometry.
8. Optional: Change number of exposures (Fig. 6, panel 6) to number of files read persample.
Default is 10 as described in the protocol.
9. Press ‘Ok’ to initialize script.
New buttons and a table will appear on the left side of the window (see Fig. 7).
10. Enter all sample names in the first column of table (see Fig. 7).
11. Enter corresponding buffer in the second column.
12. Enter determined sample concentration (in µM) in the third column.
13. Optional: Enter save as filenames for all samples in the fourth column (see Fig. 7,panel 1).
14. Load data files by pressing ‘Load data files’ button (Fig. 7, panel 2).
If successful, a window indicating ‘All data was successfully imported!’ will be displayed.In case a file could not be found or a wrong sample name was entered a warning will begenerated noting the incorrect position. If the concentration was not entered properly, asimilar error message will be produced.
Data testing
15. Optional: Inspect scattering profiles for all samples either by plotting all exposuresper sample as individual traces into one figure per sample (Fig. 7, panel 4) or byplotting the averaged profile over all exposures (Fig. 7, panel 5).
16. Optional: Overlay these plots by pressing ‘Plot sample data’ first and ‘Plot meandata’ second.
17. Optional: Plot averaged buffer for each sample using ‘Plot buffer’ button (Fig. 7,panel 6). Zettl et al.
15 of 22
Current Protocols in Nucleic Acid Chemistry

Figure 8 GUI to analyze XSI data. Panels to set the sample type (1) according to the position inthe sample loading table (2). The choice of minimization function (3) and the number of individualmaximum entropy fitting runs (4) can be specified prior to starting the routine (5). Final distancedistributions [Au radius distribution and interference pattern I(S), optional] can be saved (6). GUI,graphical user interface; XSI, X-ray scattering interferometry.
18. Optional: In case too many MATLAB figures are open, close all except the mainGUI by pressing ‘Close Figures’ button (Fig. 7, panel 7).
19. Optional: Save scattering data for all loaded samples as ‘YOURFILENAME-HERE_scattering_data.mat’ files using ‘Save data’ (Fig. 7, panel 3).
Maximum entropy fitting
20. Set options by specifying sample positions according to row number in the table(see Fig. 8, panel 1), i.e., Gold sample position = 1, A-label sample position =2, B-label sample position = 3, Double-label sample position = 4, and Unlabeledsample position = 5.
21. Optional: Change number of runs for the maximum entropy fit (default is 10,Fig. 8, panel 3); the output is one high-resolution distance distribution per run.Average distributions over all runs to obtain the final distribution. Lower the numberto shorten the required computational time for test purposes.
22. Optional: Change minimization function option to extract gold-gold interferencepattern IAu-Au(S) (default is 5 ranging from 1 to 7, see Critical Parameters andTroubleshooting for more details, Fig. 8, panel 2).
23. Start maximum entropy fit by pressing ‘Max Entropy fit’ (Fig. 8, panel 4).
A progress bar in the lower left corner of the main GUI will display progress and vanishas soon as the calculations are finished. Three new figures showing the gold nanocrystalradius distribution, gold-gold scattering interference signal IAu-Au(S), and final distancedistribution determined via maximum entropy fit will appear (Fig. 5).
24. Enter a save as filename (e.g., ‘YOURSAMPLENAME’) for distance distribution(Save Max Entropy Data, right side, Fig. 8, panel 6).
This file has one column per maximum entropy run (10 as default) and a 1 A spaceddistance distribution ranging from 1 to 200 A.
Zettl et al.
16 of 22
Current Protocols in Nucleic Acid Chemistry

25. After setting the name, press ‘Save data’ (Save Max Entropy Data, right side); a filein the format of ‘YOURSAMPLENAME_Distance_Distribution.mat’ will be savedin your current folder.
Optional: Save gold nanocrystal radius distribution and/or the Au-Au interferencepatternIAu-Au(S) by checking individual boxes.
REAGENTS AND SOLUTIONS
Ammonium acetate stock buffer
2 M ammonium acetate (Sigma Aldrich, cat. no. A1542), pH 5.6, in ultrapure waterStore up to 1 month at 4°C
Fast protein liquid chromatography (FPLC) cleaning solution
100 mM dithiothreitol (DTT; Thermo Fisher Scientific, cat. no. R0861), 20 mMTris·Cl, pH 8.0
Prepare fresh
High salt ammonium acetate buffer
1.5 M NaCl, 20 mM ammonium acetate, pH 5.6, diluted from ammonium acetatestock buffer (see recipe)
Store up to 1 month at room temperature
High salt borate buffer
1.5 M NaCl, 20 mM sodium borate, pH 7.8Store up to 1 month at room temperature
Low salt ammonium acetate buffer
10 mM NaCl, 20 mM ammonium acetate, pH 5.6, diluted from ammonium acetatestock buffer (see recipe)
Store up to 1 month at room temperature
Low salt borate buffer
10 mM NaCl, 20 mM sodium borate, pH 7.8Store up to 1 month at room temperature
Size exclusion running buffer
150 mM ammonium acetate, pH 5.6, diluted from ammonium acetate stock buffer(see recipe)
Prepare fresh
COMMENTARY
Background Information
Basic principleX-ray scattering interferometry (XSI) mea-
sures the interference between X-rays scat-tered by two gold nanocrystals attached toa macromolecule or macromolecular com-plex. In addition to the desired nanocrystal-nanocrystal interference pattern, the recordedscattering profile includes signals from scat-tering interference between pairs of atoms inthe macromolecule, between pairs of atoms ina single gold nanocrystal, and between pairs ofatoms in the macromolecule and the nanocrys-
tal. It is critical to isolate the nanocrystal-nanocrystal interference pattern from the othersignals, since it alone contains direct informa-tion about the distribution of center-to-centerdistances between the nanocrystal probes. Thisdistance distribution is obtained by Fouriertransformation of the nanocrystal-nanocrystalinterference pattern. A limitation of XSI is thetime-consuming sample preparation, whichonly allows low throughput. The strengthof XSI is that it provides accurate ensem-ble distance distributions even for dynamicand rapidly interconverting macromolecules,with precise external distance calibration Zettl et al.
17 of 22
Current Protocols in Nucleic Acid Chemistry

from the wavelength of the incident X-rayradiation. These absolute distances can bedirectly compared to high-resolution atomicmodels from NMR spectroscopy, X-ray crys-tallography, electron microscopy, or molecu-lar simulations. XSI is very complementary tospectroscopic rulers such as fluorescence res-onance energy transfer (FRET), and combinedapplication of the two types of ruler presentsinteresting possibilities.
Application of XSI to nucleic acids andnucleic acid-protein complexes
Over the last decade, XSI has been success-fully applied to dsDNA (Mathew-Fenn et al.,2008a; Mathew-Fenn et al., 2008b; Shi et al.,2013), nucleic acid two-way junctions (Shiet al., 2014; Shi et al., 2017), and nucleic acid-protein complexes (Hura et al., 2013; Shi et al.,2016). It has been used to characterize thestretching (Mathew-Fenn et al., 2008a), twist-ing, and bending elasticity (Shi et al., 2013)of short DNA helices. Recently, DNAs andRNAs containing bulge sequences have beenstudied, revealing a complex multistate behav-ior that responds to the solution conditions(Shi et al., 2014; Shi et al., 2017). In addi-tion, an RNA-protein complex has been in-vestigated (Shi et al., 2016). The use of metalclusters as structural probes makes XSI scal-able. Clusters of a single or few metal atomsare suitable for smaller systems (Miake-Lye,Doniach, & Hodgson, 1983; Vainshtein et al.,1980), while clusters containing thousands ofatoms can be applied to large complexes (Huraet al., 2013). While small labels are desir-able for accurate position determination andto minimize the perturbation of the molec-ular structures of interest, for large macro-molecules noise from the macromoleculesignal can prevent accurate Au-Au distancedetermination and larger gold nanocrystals areneeded.
A variant of the XSI interference tech-nique has recently been demonstrated, whichuses anomalous SAXS to directly extract theIAu-Au(S) interference pattern from double-labeled samples without the need to recordany single- or unlabeled samples (Zettl et al.,2016). This approach will be in particu-lar relevant for samples where it is dif-ficult to prepare matching single-labeledconstructs.
Future directionsThe future challenges and possible applica-
tions of XSI are numerous. Using the labelingand measuring protocols described here, the
conformational ensembles of diverse nucleic-acid motifs and nucleic acid-protein com-plexes can be determined, including their de-pendence on environmental conditions. Theapplication of XSI to nanocrystal-labeled pro-teins will provide a new window into pro-tein conformational ensembles, especially forfolding intermediates and intrinsically disor-dered proteins (IDPs). Finally, the applica-tion of next-generation free electron laserswith very high brilliance could allow measure-ment of correlated and time resolved distancesbetween multiple sites in a macromolecule,with a time resolution of tens of femtoseconds(Arnlund et al., 2014; Bada, Walther, Arcan-gioli, Doniach, & Delarue, 2000; Ball, 2017;Doniach, 2000; Mendez et al., 2014; Mendezet al., 2016; Pile, 2010; Schenk et al., 2016;Smolsky et al., 2007).
Critical Parameters andTroubleshooting
A key aspect for successful determinationof intramolecular distance distributions usingXSI is sample preparation and sample qual-ity. The samples have to be highly homoge-neous (e.g., no free gold nanocrystals in so-lution) and free of degradation. Furthermore,buffer matching should be as precise as pos-sible. Given that XSI requires very pure sam-ples, it is crucial to monitor and adjust thesample quality in advance. To assess samplequality, non-denaturing polyacrylamide gelelectrophoresis (PAGE; Andrus & Kuimelis,2001) or ion exchange chromatography (Sinha& Jung, 2015) can be used. In addition, weadvise the user to perform additional exper-iments (e.g., UV melting curve analysis andcircular dichroism spectroscopy (see Mathew-Fenn et al., 2008b) to test whether the attachedgold nanocrystals perturb the macromolecularstructure and ideally to establish the absenceof such perturbations. In addition, G/C basepairs at the blunt ends of nucleic acids arerecommended to avoid fraying of nucleic acidhelices.
Another requirement of the XSI techniqueis high signal-to-noise SAXS measurementsof the set of double-labeled, single-labeled,and unlabeled samples. We recommend testingthe beamline set up with readily available andcharacterized samples, such as cytochromec, BSA, or unlabeled double-stranded DNA(see https://www.sasbdb.org/), prior to an XSIexperiment. The measurements of the scatter-ing standard samples should give the expectedscattering profiles and radii of gyration. Such
Zettl et al.
18 of 22
Current Protocols in Nucleic Acid Chemistry

control measurements should be repeated ev-ery time the SAXS set up is reconfigured andcan help to detect misalignment of the X-raybeam, problems with parasitic scattering, andissues in detector calibration and conversionof the detector image to the 1D scatteringprofile.
Sometimes, it is not possible to obtain ahigh-quality distance distribution even whenthe sample preparation and recording are per-formed correctly. Potential issues can be thescattering intensity ratio between the moleculeand the gold nanocrystals resulting in poorsignal-to-noise ratio for larger nucleic acidstructures or highly flexible molecules. Ad-ditionally, larger metal clusters should beconsidered in cases of insufficient signal-to-noise.
Some additional factors that can affect thedata analysis and the final distance distributionand how to address them are listed below:
(1) Parasitic X-ray scattering in the low S-range as well as high noise levels in the highS-range can occur and influence the normaliza-tion and calculation of the interference pattern.
Solution: We recommend measuring scat-tering standards to test and optimize the X-ray set up before running XSI samples. Inthe post-processing of recorded data sets, oneshould vary Smin and/or Smax multiple timesand test the impact on the resulting distancedistribution.
(2) The scattering profile can be distortedby various effects such as radiation damage orbubbles passing through the X-ray beam.
Solution: Carefully compare scattering pro-files from subsequent exposures of the samesample and exclude all traces differing fromthe majority.
(3) Choice of minimization function T toextract to gold-gold scattering interferencePatterson IAu-Au(S) where S is the scatteringmomentum vector, IU(S) the scattering in-tensity vector of the unlabeled sample, andPAu-Au(D) the label-label interatomic radialPatterson function. The gold-gold scatteringinterference Patterson IAu-Au(S) looks like asinc (i.e., a decaying oscillation) function (seeFig. 5B). If that is not the case, redo the anal-ysis with a different choice for T. For guid-ance and comparison, a multiple interferencepattern of static and dynamic systems can befound in the published literature (Mathew-Fenn et al., 2008a; Mathew-Fenn et al., 2008b;Shi et al., 2014; Shi et al., 2015; Shi et al.,2013; Shi et al., 2016; Shi et al., 2017) forcomparison.
Choice 1: Original function describedby Mathew-Fenn, Das, and coworkers(Equation 6; Mathew-Fenn et al., 2008b)
T =∑
S [IAu−Au(S) · S2]2
∑S [IU (S) · S2]2
+∑
PAu−Au (D)<0 P2Au−Au(D)
∑D P2
U (D)
Equation 6
The minimization function is similar toKratky analysis, dividing out the decay of thescattering intensity by weighting the interfer-ence pattern IAu-Au(S) by S2.
Choice 2 (Equation 7):
T =∑
S [IAu−Au(S) · S]2
∑S [IU (S) · S2]2
+∑
PAu−Au (D)<0 P2Au−Au(D)
∑D P2
U (D)
Equation 7
Au-Au interference pattern is onlyweighted by S, thus IAu-Au(S) minimization isdominated by values in the low S-region.
Choice 3 (Equation 8):
T =∑
S [IAu−Au(S) · S]2 · S∑
S [IU (S) · S2]2
+∑
PAu−Au (D)<0 P2Au−Au(D)
∑D P2
U (D)
Equation 8
The low S-region of IAu-Au(S) is weightedmore compared to choice 1, but less thanchoice 2 and the high S-region is weighted lesscompared to choice 1 and more than choice 2.
Choice 4 (Equation 9):
Smin = Min(S) for Si ∈ S ≥ 0.06 A−1
S2 = Si
Sminfor Si ∈ S < 0.06 A−1
S2 = 1 for Si ∈ S ≥ 0.06−1
T =∑
S2
[∑S [IAu−Au(S) · S]2 · S2
]
∑S
[IU (S) · S2
]2
+∑
PAu−Au (D)<0 P2Au−Au(D)
∑D P2
U (D)
Equation 9Zettl et al.
19 of 22
Current Protocols in Nucleic Acid Chemistry

Very similar to choice 3 in the high S-range,however the high S-range is weighted slightlyless.
Choice 5 (Equation 10):
Smin,1 = Min(Si ) for Si ∈ S < 0.06 A−1
Smin,2 = Min(Si ) for Si ∈ S ≥ 0.06 A −1
S2 = Si
Smin,2for Si ∈ S < 0.06 A −1
S2 = Smin,1
Smin,2for Si ∈ S ≥ 0.06 A −1
T =∑
S2[∑
S [IAu−Au(S) · S]2 · S2]∑
S [IU (S) · S2]2
+∑
PAu−Au (D)<0 P2Au−Au(D)
∑D P2
U (D)
Equation 10
Very similar to choice 3 in the high S-range,however the high S-range contributes verylittle.
Choice 6 (Equation 11):
T =∑
PAu−Au (D)<0 P2Au−Au(D)
∑D P2
U (D)
Equation 11
Only PAu-Au(D) is minimized such that itdoes not include negative values, however theoscillations in IAu-Au(S) are not minimized.
Choice 7 (Equation 12):
T =∑
S>0.06 A−1 [IAu−Au(S) · S]2
∑S [IU (S) · S2]2
Equation 12
Only the high S-region of IAu-Au(S) isminimized similar to a base line correc-tion. PAu-Au(D) is allowed to include negativevalues.
Anticipated ResultsThe protocols presented here guide exper-
imenters to synthesize gold nanocrystals, pre-pare and purify gold-labeled nucleic acid con-structs, measure a complete set of small-angleX-ray scattering (SAXS) profiles for the la-beled samples, and extract intra-molecular dis-tance distributions from the data.
Following the steps presented in BasicProtocol 1, the following yields are typi-cally achieved: The gold nanocrystal synthe-sis yields 3 to 10 µmol after final purificationand desalting; the gold nanocrystal attachmentprotocol results in a yield of 2 to 3 nmol of
each labeled and purified duplexed constructfor XSI measurements.
Basic Protocols 2 and 3 describe a reli-able procedure to obtain SAXS scattering pro-files and a step-by-step guide on how to usethe provided GUI to extract high-resolutiondistance distributions on an absolute scale(Fig. 5C). To study more complex macro-molecules that can undergo conformationalchanges or to disentangle complex geometriesand motions, multiple label pairs attached todifferent positions can be prepared and ana-lyzed to increase the information content.
Time ConsiderationsThe sample preparation should be per-
formed about 1 month in advance. The fi-nal purification (steps 28 and 29 in BasicProtocol 1) should be carried out shortly be-fore data collection to ensure the highest sam-ple quality. The overall data acquisition timevaries depending on the synchrotron facility.Typically, data collection for several samplescan take up to 1 day. The run time of thecustom-written Matlab routine to compute dis-tance distributions that is provided with thisprotocol is on the order of minutes on a stan-dard personal computer. The total time re-quired for data analysis, validation, and inter-pretation is variable and can take several days.
AcknowledgementsWe thank T. Matsui and T. Weiss at beam-
line 4-2 of the Stanford Synchrotron RadiationLab (SSRL) and Gabriele Giachin at beamlineBM29 of the European Synchrotron RadiationFacility (ESRF) for technical support in syn-chrotron small-angle X-ray scattering experi-ments, and Steffen Sedlak for helpful discus-sions and comments on the manuscript. Thiswork was supported by Sonderforschungs-bereich (SFB) 1032 and the National Institutesof Health (NIH) P01 GM066275 to D.H. andDP-DO000429 to P.A.B.H.
Literature CitedAckerson, C. J., Sykes, M. T., & Kornberg, R. D.
(2005). Defined DNA nanoparticle conjugates.Proceedings of the National Academy of Sci-ences of the United States of America, 102,13383–13385. doi: 10.1073/pnas.0506290102.
Alivisatos, A. P., Johnsson, K. P., Peng, X., Wilson,T. E., Loweth, C. J., Bruchez, M. P., & Schultz,P. G. (1996). Organization of ‘nanocrystalmolecules’ using DNA. Nature, 382, 609–611.doi: 10.1038/382609a0.
Andrus, A. & Kuimelis, R. G. (2001). Poly-acrylamide gel electrophoresis (PAGE) ofsynthetic nucleic acids. Current Protocols in
Zettl et al.
20 of 22
Current Protocols in Nucleic Acid Chemistry

Nucleic Acid Chemistry, 1, 10.4.1–10.4.10. doi:https://doi.org/10.1002/0471142700.nc1004s01.
Arnlund, D., Johansson, L. C., Wickstrand, C.,Barty, A., Williams, G. J., Malmerberg, E., . . .Neutze, R. (2014). Visualizing a protein quakewith time-resolved X-ray scattering at a free-electron laser. Nature Methods, 11(9), 923–926.doi: 10.1038/nmeth.3067.
Aubin-Tam, M. E., & Hamad-Schifferli, K. (2005).Gold nanoparticle-cytochrome c complexes:The effect of nanoparticle ligand charge on pro-tein structure. Langmuir, 21, 12080–12084. doi:10.1021/la052102e.
Aubin-Tam, M. E., Hwang, W., & Hamad-Schifferli, K. (2009). Site-directed nanopar-ticle labeling of cytochrome c. Proceedingsof the National Academy of Sciences of theUnited States of America, 106, 4095–4100. doi:10.1073/pnas.0807299106.
Azubel, M., & Kornberg, R. D. (2016). Synthesis ofwater-soluble, thiolate-protected gold nanopar-ticles uniform in size. Nano Letters, 16(5),3348–3351. doi: 10.1021/acs.nanolett.6b00981.
Bada, M., Walther, D., Arcangioli, B., Do-niach, S., & Delarue, M. (2000). Solutionstructural studies and low-resolution modelof the Schizosaccharomyces pombe sap1 pro-tein. Journal of Molecular Biology, 300(3),563–574. doi: 10.1006/jmbi.2000.3854 S0022-2836(00)93854-3 [pii]
Ball, P. (2017). Europe’s X-ray laser fires up. Na-ture, 548, 507–508. doi: 10.1038/548507a.
Burke, J. E. & Butcher, S. E. (2012). Nucleic acidstructure characterization by small angle x-rayscattering (SAXS). Current Protocols in Nu-cleic Acid Chemistry, 51, 7.18.1–7.18.18. doi:https://doi.org/10.1002/0471142700.nc0718s51.
Doniach, S. (2000). Fourth-generation X-raysources: Some possible applications to biol-ogy. Journal of Synchrotron Radiation, 7(Pt3), 116–120. doi: S0909049500004143 [pii]10.1107/S0909049500004143.
Doniach, S., & Lipfert, J. (2012). Small andwide angle X-ray scattering from biolog-ical macromolecules and their complexesin solution. Comprehensive Biophysics, 1,376–397. doi: 10.1016/B978-0-12-374920-8.00122-3.
Dyer, K. N., Hammel, M., Rambo, R. P.,Tsutakawa, S. E., Rodic, I., Classen, S.,. . . Hura, G. L. (2014). High-throughputSAXS for the characterization of biomoleculesin solution: A practical approach. Methodsin Molecular Biology, 1091, 245–258. doi:10.1007/978-1-62703-691-7_18.
Feynman, R. P., Leighton, R. B., & Sands, M.(1977). The Feynman lectures on physics:Mainly mechanics, radiation, and heat. Sixthedition. New York: Pearson.
Fischer, N., Konevega, A. L., Wintermeyer, W.,Rodnina, M. V., & Stark, H. (2010). Ri-bosome dynamics and tRNA movement bytime-resolved electron cryomicroscopy. Nature,466(7304), 329–333. doi: 10.1038/nature09206.
Frauenfelder, H. (1989). New looks at pro-tein motions. Nature, 338, 623-624. doi:10.1038/338623a0.
Grishaev, A. (2012). Sample preparation, datacollection, and preliminary data analysisin biomolecular solution X-ray scattering.Current Protocols in Protein Science, 70,17.14.1–17.14.18. doi: https://doi.org/10.1002/0471140864.ps1714s70.
Hura, G. L., Budworth, H., Dyer, K. N., Rambo,R. P., Hammel, M., McMurray, C. T., &Tainer, J. A. (2013). Comprehensive macro-molecular conformations mapped by quantita-tive SAXS analyses. Nature Methods, 10, 453.doi: 10.1038/nmeth.2453.
Hura, G. L., Tsai, C. L., Claridge, S. A., Mendillo,M. L., Smith, J. M., Williams, G. J., . . . Tainer,J. A. (2013). DNA conformations in mismatchrepair probed in solution by X-ray scatter-ing from gold nanocrystals. Proceedings of theNational Academy of Sciences of the UnitedStates of America, 110(43), 17308–17313. doi:10.1073/pnas.1308595110.
Jeffries, C. M., Graewert, M. A., Blanchet, C. E.,Langley, D. B., Whitten, A. E., & Svergun,D. I. (2016). Preparing monodisperse macro-molecular samples for successful biologicalsmall-angle X-ray and neutron scattering exper-iments. Nature Protocols, 11(11), 2122–2153.doi: 10.1038/nprot.2016.113.
Lipfert, J., & Doniach, S. (2007). Small-angle X-ray scattering from RNA, proteins, and pro-tein complexes. Annual Review of Biophysicsand Biomolecular Structure, 36, 307–327. doi:10.1146/annurev.biophys.36.040306.132655.
Lipfert, J., Millett, I. S., Seifert, S., & Doniach,S. (2006). Sample holder for small-angle X-rayscattering static and flow cell measurements. Re-view of Scientific Instruments, 77(4), 26–28. doi:10.1063/1.2194484.
Mathew-Fenn, R. S., Das, R., & Harbury, P. A.(2008a). Remeasuring the double helix. Science,322, 446–449. doi: 10.1126/science.1158881.
Mathew-Fenn, R. S., Das, R., Silverman, J. A.,Walker, P. A., & Harbury, P. A. (2008b). Amolecular ruler for measuring quantitative dis-tance distributions. PLoS One, 3(10), e3229. doi:10.1371/journal.pone.0003229.
Mendez, D., Lane, T. J., Sung, J., Sellberg,J., Levard, C., Watkins, H., . . . Doniach,S. (2014). Observation of correlated X-rayscattering at atomic resolution. PhilosophicalTransactions of the Royal Society B: Bio-logical Sciences, 369(1647), 20130315. doi:10.1098/rstb.2013.0315.
Mendez, D., Watkins, H., Qiao, S., Raines, K. S.,Lane, T. J., Schenk, G., . . . Doniach, S. (2016).Angular correlations of photons from solutiondiffraction at a free-electron laser encode molec-ular structure. IUCrJ, 3(Pt 6), 420–429. doi:10.1107/S2052252516013956.
Miake-Lye, R. C., Doniach, S., & Hodgson,K. O. (1983). Anomalous X-ray scatteringfrom terbium-labeled parvalbumin in solu-tion. Biophysical Journal, 41(3), 287–292.
Zettl et al.
21 of 22
Current Protocols in Nucleic Acid Chemistry

doi: S0006-3495(83)84440-3 [pii] 10.1016/S0006-3495(83)84440-3.
Muller, J. P., Lof, A., Mielke, S., Obser, T., Brutzel,L. K., Vanderlinden, W., . . . Benoit, M. (2016).pH-dependent interactions in dimers govern themechanics and structure of von Willebrand fac-tor. Biophysical Journal, 111(2), 312–322. doi:10.1016/j.bpj.2016.06.022.
Pauw, B. R. (2014). Everything SAXS: Small-angle scattering pattern collection and cor-rection. Journal of Physics: Condensed Mat-ter, 26, 239501. doi: 10.1088/0953-8984/26/23/239501.
Pile, D. F. P. (Editor) (2010). Building X-ray lasers.Interview with Paul Emma. Nature Photonics,4, 802–803. doi: 10.1038/nphoton.2010.276.
Rozners, E. (2010). Determination of nucleic acidhydration using osmotic stress. Current Pro-tocols in Nucleic Acid Chemistry, 43, 7.14.1–7.14.13. doi: 10.1002/0471142700.nc0714s43.
Schaaff, T. G., Knight, G., Shafigullin, M. N.,Borkman, R. F., & Whetten, R. L. (1998). Iso-lation and selected properties of a 10.4 kDagold:glutathione cluster compound. Journal ofPhysical Chemistry B, 102(52), 10643–10646.doi: 10.1021/jp9830528.
Schenk, G., Krajina, B., Spakowitz, A., & Do-niach, S. (2016). Potential for measurement ofthe distribution of DNA folds in complex en-vironments using correlated X-ray scattering.Modern Physics Letters B , 30(8), 1650117. doi:10.1142/S0217984916501177.
Shi, X., Beauchamp, K. A., Harbury, P. B., & Her-schlag, D. (2014). From a structural average tothe conformational ensemble of a DNA bulge.Proceedings of the National Academy of Sci-ences of the United States of America, 111(15),E1473–E1480. doi: 10.1073/pnas.1317032111.
Shi, X., Bonilla, S., Herschlag, D., & Har-bury, P. (2015). Quantifying nucleic acid en-sembles with X-ray scattering interferome-try. Methods in Enzymology, 558, 75–97. doi:10.1016/bs.mie.2015.02.001.
Shi, X., Herschlag, D., & Harbury, P. A. (2013).Structural ensemble and microscopic elastic-ity of freely diffusing DNA by direct mea-surement of fluctuations. Proceedings of theNational Academy of Sciences of the UnitedStates of America, 110(16), E1444–E1451. doi:10.1073/pnas.1218830110.
Shi, X., Huang, L., Lilley, D. M., Harbury, P. B.,& Herschlag, D. (2016). The solution struc-tural ensembles of RNA kink-turn motifs andtheir protein complexes. Nature Chemical Bi-ology, 12, 146–152. doi: 10.1038/nchembio.1997.
Shi, X., Walker, P., Harbury, P. A., & Herschlag,D. (2017). Determination of the conformational
ensemble of the TAR RNA by X-ray scatteringinterferometry. Nucleic Acids Research, 45(8),e64. doi: 10.1093/nar/gkw1352.
Sinha, N. D. & Jung, K. E. (2015). Anal-ysis and purification of synthetic nucleicacids using HPLC. Current Protocols in Nu-cleic Acid Chemistry, 61, 10.5.1–10.5.39. doi:10.1002/0471142700.nc1005s61.
Smolsky, I. L., Liu, P., Niebuhr, M., Ito, K.,Weiss, T. M., & Tsuruta, H. (2007). Biologi-cal small-angle X-ray scattering facility at theStanford synchrotron radiation laboratory. Jour-nal of Applied Crystallography, 40, S453–S458.doi: 10.1107/s0021889807009624.
Svergun, D., & Koch, M. (2003). Small-angle scattering studies of biological macro-molecules in solution. Reports on Progress inPhysics, 66, 1735–1782. doi: 10.1088/0034-4885/66/10/R05.
Tuukkanen, A. T., Spilotros, A., & Svergun,D. I. (2017). Progress in small-angle scatter-ing from biological solutions at high-brilliancesynchrotrons. IUCrJ, 4(Pt 5), 518–528. doi:10.1107/S2052252517008740.
Vainshtein, B. K., Feigin, L. A., Lvov, Y. M.,Gvozdev, R. I., Marakushev, S. A., &Likhtenshtein, G. I. (1980). Determinationof the distance between heavy-atom mark-ers in haemoglobin and histidine decarboxy-lase in solution by small-angle X-ray scat-tering. Febs Letters, 116(1), 107–110. doi:10.1016/0014-5793(80)80539-4.
Zettl, T., Mathew, R. S., Seifert, S., Do-niach, S., Harbury, P. A., & Lipfert, J.(2016). Absolute intra-molecular distance mea-surements with Angstrom-resolution usinganomalous small-angle X-ray scattering. NanoLetters, 16(9), 5353–5357. doi: 10.1021/acs.nanolett.6b01160.
Zettl, T., Mathew, R. S., Shi, X., Doniach, S., Her-schlag, D., Harbury, P. A. B., & Lipfert, J.,(2018). Gold nanocrystal labels provide a se-quence -to -3D structure map in SAXS recon-structions. Science Advances, 4, eaar4418. Inpress.
Internet Resourceshttps://eu.idtdna.com/calc/analyzerOnline tool to calculate melting temperature, ex-
tinction coefficient for a given DNA sequence.
https://www.sasbdb.org/Small Angle Scattering Biological Data Bank pro-
viding experimental, measured SAXS profiles.
https://gitlab.physik.uni-muenchen.de/Jan.Lipfert/AuSAXSGUI.git
Git repository providing the Matlab AuSAXS GUIand example data files.
Zettl et al.
22 of 22
Current Protocols in Nucleic Acid Chemistry