reconstructing features of thick objects from phase … · reconstructing features of thick objects...
TRANSCRIPT

Reconstructing Features of Thick Objects from Phase Images
Heidy Sierra1, Dana Brooks1 and Charles A. DiMarzio1,2
1 Department of Electrical and Computer Engineering2 Department of Mechanical and Industrial Engineering
Northeastern University, 360 Huntington Avenue, Boston, MA 02115.
ABSTRACT
Phase microscopy modalities are extensively used to image unstained transparent biological samples because oftheir ability to obtain high contrast images without exogenous agents. Quantitative phase techniques in particularprovide valuable information that can be interpreted easily when the imaged object is optically thin, that is,when the thickness of the object is much less than the depth of field of the imaging system. However, manybiological objects of interest have thicknesses comparable to or larger than the depth of field. This work focuseson the initial development of inversion techniques for phase images, in order to reconstruct features of thicktransparent samples. We use a shape based iterative approach that assumes that the index of refraction insidethe object can be approximated as piecewise constant. The case of thick homogeneous and inhomogeneous objectsis examined. We assume that the boundary location of all inhomogeneities is known or can be obtained by pre-processing the image. Our goal is to estimate their unknown indices of refraction. We analyze the performanceof the reconstruction when the thickness of the object is increased from 1 to 20 illumination wavelengths (0.633micrometers). We simulate experiments using a objective lens with a numerical aperture of 0.5. Simulationresults for objects with optical properties similar to real transparent biological samples are presented. Thereconstructed indices of refraction have an error less than 5% compared to the true value.
Keywords: Phase microscopy, Differential Interference Contrast, Optical Quadrature Microscopy (OQM),boundary based inversion techniques, thick objects.
1. INTRODUCTION
Phase microscopy has been used extensively to acquire information about unstained transparent biological ob-jects.1–4 These objects are visualized well by techniques such as differential interference contrast (DIC) mi-croscopy. However, standard DIC systems are qualitative in nature and do not provide quantitative phaseinformation. Several modalities have been developed to obtain quantitative complex field images of a sample,which can be used to extract the amplitude and phase distribution of the object.2–4 Quantitative phase imagesacquired with these modalities can provide specific information about the object, such as index of refractionmaps, when the thickness of the object is much less than the depth of field of the imaging system. However,many objects of interest are optically thick, with thickness comparable to or larger than the depth of field of theoptical system. Thus, it is our interest to extract thick object’s properties from quantitative phase images.
Research groups addressing the problem of reconstructing 3D objects structures have explored both theextension of existing imaging modalities and the development of new techniques. Contributions include several3D optical microscopy imaging methods that can visualize cellular and sub-cellular structures of biologicalsamples.3, 4 These approaches require the sample to be rotated or translated along the optical axis, the collectionof several images from different angles views or the use of scanning systems to reconstruct the imaged object.
Alternative approaches have focused on the development and application of theoretical models, image process-ing and inversion techniques to conventional phase microscopy images.5–7 Processed and modeled images provideinformation about the morphology and the image formation process that facilitate the analysis of collected im-ages and the solution of specific problems in biological applications. For example, the problem of counting thenumber of cells of live biological samples is generally addressed applying methods based on segmentation andedge detection algorithms to DIC images.5
In previous work we developed a forward model for phase microscopy to predict phase images of thicktransparent objects.7 In this work we explore the use of this model to reconstruct an index of refraction map of
Three-Dimensional and Multidimensional Microscopy: Image Acquisition and Processing XVII, edited by Jose-Angel Conchello, Carol J. Cogswell, Tony Wilson, Thomas G. Brown, Proc. of SPIE Vol. 7570, 757005
© 2010 SPIE · CCC code: 1605-7422/10/$18 · doi: 10.1117/12.842958
Proc. of SPIE Vol. 7570 757005-1
Downloaded from SPIE Digital Library on 23 Apr 2010 to 129.10.107.106. Terms of Use: http://spiedl.org/terms
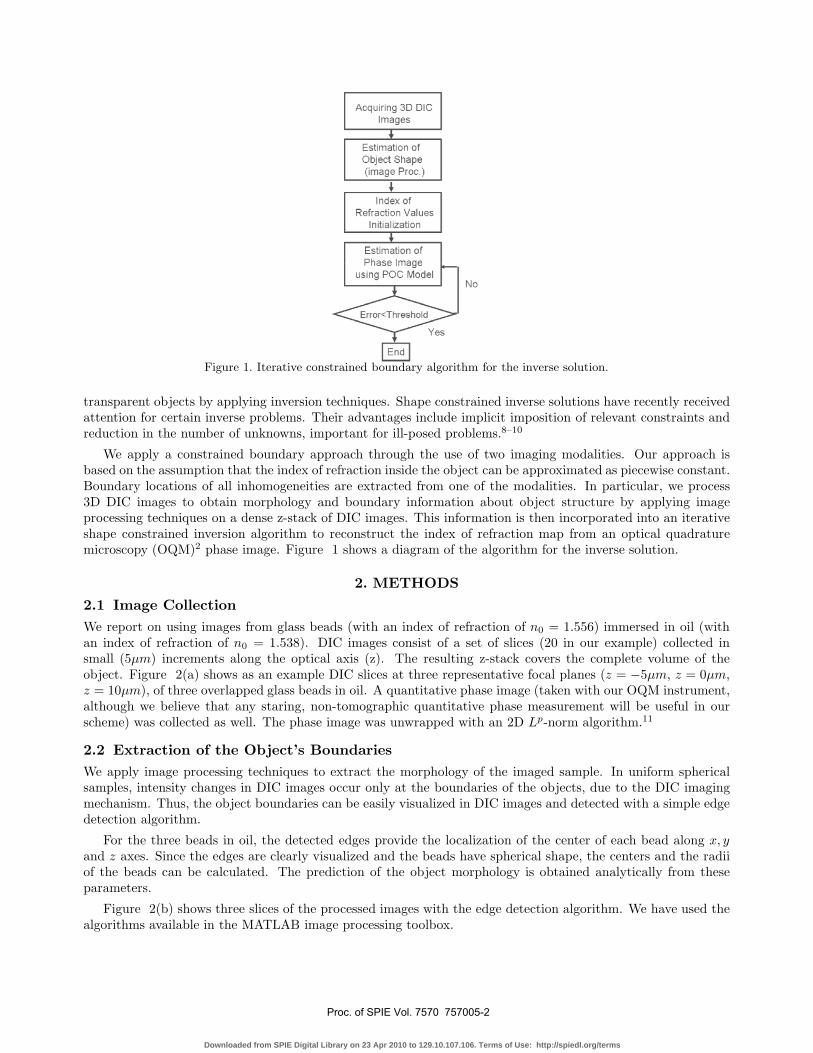
Figure 1. Iterative constrained boundary algorithm for the inverse solution.
transparent objects by applying inversion techniques. Shape constrained inverse solutions have recently receivedattention for certain inverse problems. Their advantages include implicit imposition of relevant constraints andreduction in the number of unknowns, important for ill-posed problems.8–10
We apply a constrained boundary approach through the use of two imaging modalities. Our approach isbased on the assumption that the index of refraction inside the object can be approximated as piecewise constant.Boundary locations of all inhomogeneities are extracted from one of the modalities. In particular, we process3D DIC images to obtain morphology and boundary information about object structure by applying imageprocessing techniques on a dense z-stack of DIC images. This information is then incorporated into an iterativeshape constrained inversion algorithm to reconstruct the index of refraction map from an optical quadraturemicroscopy (OQM)2 phase image. Figure 1 shows a diagram of the algorithm for the inverse solution.
2. METHODS
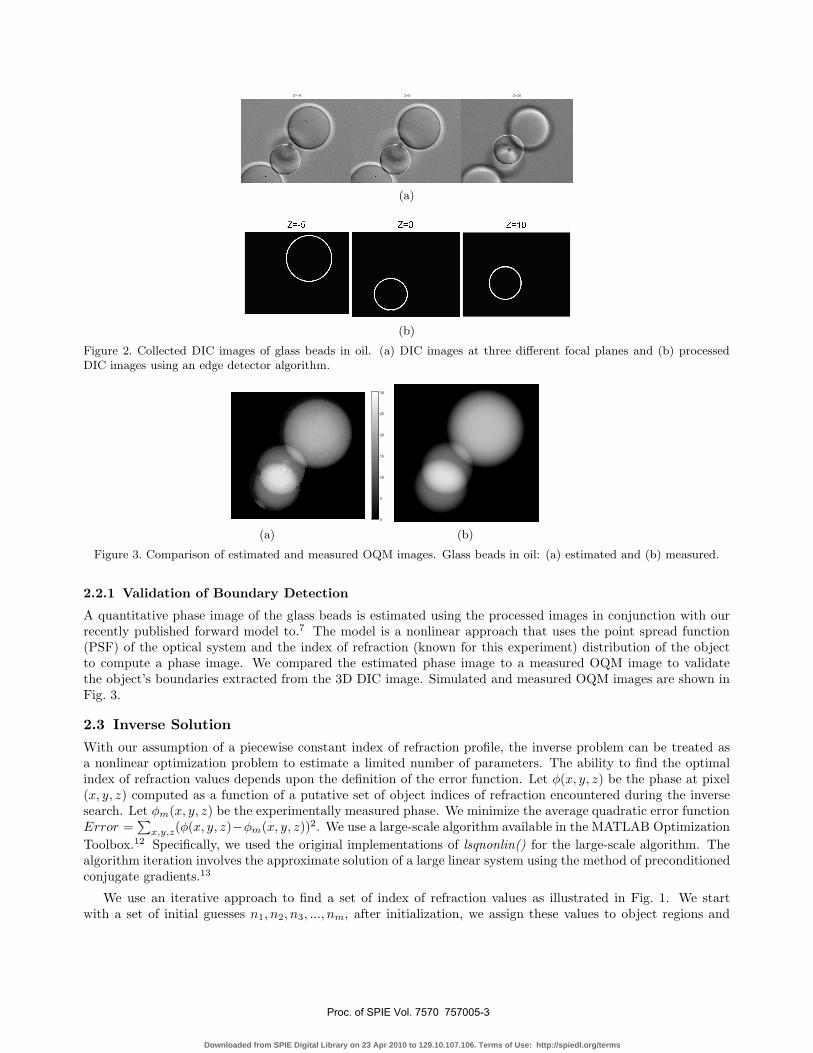
2.1 Image CollectionWe report on using images from glass beads (with an index of refraction of n0 = 1.556) immersed in oil (withan index of refraction of n0 = 1.538). DIC images consist of a set of slices (20 in our example) collected insmall (5μm) increments along the optical axis (z). The resulting z-stack covers the complete volume of theobject. Figure 2(a) shows as an example DIC slices at three representative focal planes (z = −5μm, z = 0μm,z = 10μm), of three overlapped glass beads in oil. A quantitative phase image (taken with our OQM instrument,although we believe that any staring, non-tomographic quantitative phase measurement will be useful in ourscheme) was collected as well. The phase image was unwrapped with an 2D Lp-norm algorithm.11
2.2 Extraction of the Object’s BoundariesWe apply image processing techniques to extract the morphology of the imaged sample. In uniform sphericalsamples, intensity changes in DIC images occur only at the boundaries of the objects, due to the DIC imagingmechanism. Thus, the object boundaries can be easily visualized in DIC images and detected with a simple edgedetection algorithm.
For the three beads in oil, the detected edges provide the localization of the center of each bead along x, yand z axes. Since the edges are clearly visualized and the beads have spherical shape, the centers and the radiiof the beads can be calculated. The prediction of the object morphology is obtained analytically from theseparameters.
Figure 2(b) shows three slices of the processed images with the edge detection algorithm. We have used thealgorithms available in the MATLAB image processing toolbox.
Proc. of SPIE Vol. 7570 757005-2
Downloaded from SPIE Digital Library on 23 Apr 2010 to 129.10.107.106. Terms of Use: http://spiedl.org/terms
Z=−5 Z=0 Z=10
(a)
(b)
Figure 2. Collected DIC images of glass beads in oil. (a) DIC images at three different focal planes and (b) processedDIC images using an edge detector algorithm.
(a)
0
5
10
15
20
25
30
(b)
Figure 3. Comparison of estimated and measured OQM images. Glass beads in oil: (a) estimated and (b) measured.
2.2.1 Validation of Boundary Detection
A quantitative phase image of the glass beads is estimated using the processed images in conjunction with ourrecently published forward model to.7 The model is a nonlinear approach that uses the point spread function(PSF) of the optical system and the index of refraction (known for this experiment) distribution of the objectto compute a phase image. We compared the estimated phase image to a measured OQM image to validatethe object’s boundaries extracted from the 3D DIC image. Simulated and measured OQM images are shown inFig. 3.
2.3 Inverse Solution
With our assumption of a piecewise constant index of refraction profile, the inverse problem can be treated asa nonlinear optimization problem to estimate a limited number of parameters. The ability to find the optimalindex of refraction values depends upon the definition of the error function. Let φ(x, y, z) be the phase at pixel(x, y, z) computed as a function of a putative set of object indices of refraction encountered during the inversesearch. Let φm(x, y, z) be the experimentally measured phase. We minimize the average quadratic error functionError =
∑x,y,z(φ(x, y, z)−φm(x, y, z))2. We use a large-scale algorithm available in the MATLAB Optimization
Toolbox.12 Specifically, we used the original implementations of lsqnonlin() for the large-scale algorithm. Thealgorithm iteration involves the approximate solution of a large linear system using the method of preconditionedconjugate gradients.13
We use an iterative approach to find a set of index of refraction values as illustrated in Fig. 1. We startwith a set of initial guesses n1, n2, n3, ..., nm, after initialization, we assign these values to object regions and
Proc. of SPIE Vol. 7570 757005-3
Downloaded from SPIE Digital Library on 23 Apr 2010 to 129.10.107.106. Terms of Use: http://spiedl.org/terms
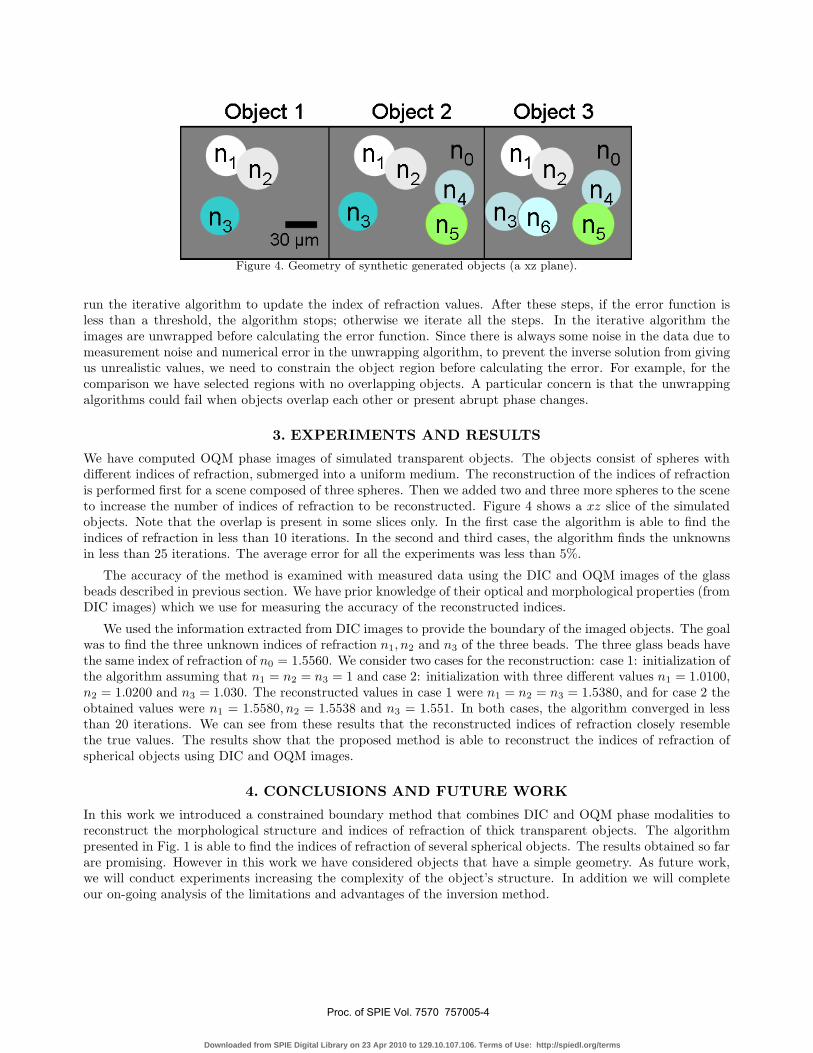
Figure 4. Geometry of synthetic generated objects (a xz plane).
run the iterative algorithm to update the index of refraction values. After these steps, if the error function isless than a threshold, the algorithm stops; otherwise we iterate all the steps. In the iterative algorithm theimages are unwrapped before calculating the error function. Since there is always some noise in the data due tomeasurement noise and numerical error in the unwrapping algorithm, to prevent the inverse solution from givingus unrealistic values, we need to constrain the object region before calculating the error. For example, for thecomparison we have selected regions with no overlapping objects. A particular concern is that the unwrappingalgorithms could fail when objects overlap each other or present abrupt phase changes.
3. EXPERIMENTS AND RESULTS
We have computed OQM phase images of simulated transparent objects. The objects consist of spheres withdifferent indices of refraction, submerged into a uniform medium. The reconstruction of the indices of refractionis performed first for a scene composed of three spheres. Then we added two and three more spheres to the sceneto increase the number of indices of refraction to be reconstructed. Figure 4 shows a xz slice of the simulatedobjects. Note that the overlap is present in some slices only. In the first case the algorithm is able to find theindices of refraction in less than 10 iterations. In the second and third cases, the algorithm finds the unknownsin less than 25 iterations. The average error for all the experiments was less than 5%.
The accuracy of the method is examined with measured data using the DIC and OQM images of the glassbeads described in previous section. We have prior knowledge of their optical and morphological properties (fromDIC images) which we use for measuring the accuracy of the reconstructed indices.
We used the information extracted from DIC images to provide the boundary of the imaged objects. The goalwas to find the three unknown indices of refraction n1, n2 and n3 of the three beads. The three glass beads havethe same index of refraction of n0 = 1.5560. We consider two cases for the reconstruction: case 1: initialization ofthe algorithm assuming that n1 = n2 = n3 = 1 and case 2: initialization with three different values n1 = 1.0100,n2 = 1.0200 and n3 = 1.030. The reconstructed values in case 1 were n1 = n2 = n3 = 1.5380, and for case 2 theobtained values were n1 = 1.5580, n2 = 1.5538 and n3 = 1.551. In both cases, the algorithm converged in lessthan 20 iterations. We can see from these results that the reconstructed indices of refraction closely resemblethe true values. The results show that the proposed method is able to reconstruct the indices of refraction ofspherical objects using DIC and OQM images.
4. CONCLUSIONS AND FUTURE WORK
In this work we introduced a constrained boundary method that combines DIC and OQM phase modalities toreconstruct the morphological structure and indices of refraction of thick transparent objects. The algorithmpresented in Fig. 1 is able to find the indices of refraction of several spherical objects. The results obtained so farare promising. However in this work we have considered objects that have a simple geometry. As future work,we will conduct experiments increasing the complexity of the object’s structure. In addition we will completeour on-going analysis of the limitations and advantages of the inversion method.
Proc. of SPIE Vol. 7570 757005-4
Downloaded from SPIE Digital Library on 23 Apr 2010 to 129.10.107.106. Terms of Use: http://spiedl.org/terms

ACKNOWLEDGMENTS
This work was supported in part by the Bernard M. Gordon Center for Subsurface Sensing and Imaging Systems(Gordon-CenSSIS), under the Engineering Research Centers Program of the National Science Foundation (AwardNo. EEC-9986821).
REFERENCES[1] Lang, W., “Nomarski differential interference contrast microscopy. ii. formation of the interference image,”
Zeiss Inform. 17, 12–16 (1969).[2] Hogenboom, D. O., DiMarzio, C. A., Gaudette, T. J., Devaney, A. J., and Lindberg, S. C., “Three-
dimensional images generated by quadrature interferometry,” Opt. Lett. 23(10), 783–785 (1998).[3] Barone-Nugent, E. D., Barty, A., and Nugent, K. A., “Quantitative phase-amplitude microscopy i: optical
microscopy,” J. Microsc. 206, 194–203 (2002).[4] Pavani, S. R. P., Libertun, A., King, S., and Cogswell, C., “Quantitative structured-illumination phase
microscopy,” Appl. Opt. 47, 15–24 (2008).[5] Warger, W. C., Laevsky, G. S., Townsend, D. J., Rajadhyaksha, M., and DiMarzio, C. A., “Multimodal
optical microscope for detecting viability of mouse embryos in vitro,” J. Biomed. Opt. 12, 044006–1 044006–7(2007).
[6] Dunn, A. and Richards-Kortum, R., “Three-dimensional computation of light scattering from cells,” J.Selected Topics in Quantum Electronics, IEEE 2(4), 898–905 (1996).
[7] Sierra, H., DiMarzio, C. A., and Brooks, D. H., “Modeling phase microscopy of transparent three-dimensional objects: a product-of-convolutions approach,” J. Opt. Soc. Am. A 26, 1268–1276 (2009).
[8] Roy, R. and Sevick-Muraca, E., “Three-dimensional unconstrained and constrained image-reconstructiontechniques applied to fluorescence, frequency-domain photon migration,” Appl. Opt. 40, 2206–2215 (2001).
[9] Munck, J. D., Faes, T., and Heethaar, R., “The boundary element method in the forward and inverseproblem of electrical impedance tomography,” IEEE Trans. Biomed. Eng. 47(6), 792–800 (2000).
[10] Babaeizadeh, S., Brooks, D., and Isaacson, D., “3-d electrical impedance tomography for piecewise constantdomains with known internal boundaries,” IEEE Trans. Biomed. Eng. 1, 2–10 (2007).
[11] Ghiglia, D. and Pritt, M., [Two-Dimensional Phase Unwrapping: Theory, Algorithms and Software ], Wiley,New York (1998).
[12] Inc., T. M., “The matlab optimizations toolbox.” http://www.mathworks.com/products/optimization/.[13] Coleman, T. and Li, Y., “An interior, trust region approach for nonlinear minimization subject to bounds,”
SIAM J. Optimization 6, 418–445 (1996).
Proc. of SPIE Vol. 7570 757005-5
Downloaded from SPIE Digital Library on 23 Apr 2010 to 129.10.107.106. Terms of Use: http://spiedl.org/terms