recommended procedures to assess critical state locus from
TRANSCRIPT

Review
Recommended Procedures to Assess Critical State Locus fromTriaxial Tests in Cohesionless Remoulded Samples
António Viana da Fonseca , Diana Cordeiro and Fausto Molina-Gómez *
�����������������
Citation: Viana da Fonseca, A.;
Cordeiro, D.; Molina-Gómez, F.
Recommended Procedures to Assess
Critical State Locus from Triaxial
Tests in Cohesionless Remoulded
Samples. Geotechnics 2021, 1, 95–127.
https://doi.org/10.3390/
geotechnics1010006
Academic Editor: Wen-Chieh Cheng
Received: 15 June 2021
Accepted: 23 July 2021
Published: 29 July 2021
Publisher’s Note: MDPI stays neutral
with regard to jurisdictional claims in
published maps and institutional affil-
iations.
Copyright: © 2021 by the authors.
Licensee MDPI, Basel, Switzerland.
This article is an open access article
distributed under the terms and
conditions of the Creative Commons
Attribution (CC BY) license (https://
creativecommons.org/licenses/by/
4.0/).
CONSTRUCT-GEO, Faculdade de Engenharia da Universidade do Porto (FEUP), Rua Dr. Roberto Frias s/n,4200-465 Porto, Portugal; [email protected] (A.V.d.F.); [email protected] (D.C.)* Correspondence: [email protected]; Tel.: +351-225-081-988
Abstract: The critical state theory is a robust conceptual framework for the characterisation of soilbehaviour. In the laboratory, triaxial tests are used to assess the critical state locus. In the last decades,the equipment and testing procedures for soil characterisation, within the critical state framework,have advanced to obtain accurate and reliable results. This review paper summarises and describesa series of recommended laboratory procedures to assess the critical state locus in cohesionlesssoils. For this purpose, results obtained in the laboratory from different cohesionless soils andtriaxial equipment configurations are compiled, analysed and discussed in detail. The procedurespresented in this paper reinforce the use of triaxial cells with lubricated end platens and an embeddedconnection piston into the top-cap, together with the verification of the full saturation conditionand the measurement end-of-test water content—preferable using the soil freezing technique. Theexperimental evidence and comparison between equipment configurations provide relevant insightsabout the laboratory procedures for obtaining a reliable characterisation of the critical state locus ofcohesionless geomaterials. All the procedures recommended herein can be easily implemented inacademic and commercial geotechnical laboratories.
Keywords: critical state; triaxial apparatus; laboratory tests; laboratory equipment; liquefaction
1. Introduction
Critical state soil mechanics (CSSM) has been successfully applied to describe thebehaviour of geomaterials. For this reason, it is the basis of several constitutive models,such as Cam-Clay [1] and NorSand [2]. The critical state locus (CSL) is independent ofits initial fabric, stress state and void ratio. The essential characteristics of the CSL are:(i) stable frictional state in a homogeneous granular body, in which the particles move witheach other without changing the volume of the soil; (ii) uniqueness and linearity for eachmaterial as long as its dimension, morphology and particle roughness are preserved; and(iii) stable effective stresses. Hence, the CSL is the condition in which the soil deformsunder constant volume and stable mean effective stress. The CSL is widely applied forflow liquefaction assessment [3–5], stress-dilatancy analyses [6–8] and characterisation ofmine tailings [9–12]. The conventional triaxial test is commonly used for determining theCSL in the three-dimensional invariant space of shear-confinement-volume state, that is, arepresentation in the e : p′ : q space. Nevertheless, for convenience, CSL can be expressedin terms of its 2D projection on the p′ : q space in terms of the strength parameter M andits 2D projection on the e : log p′ space in terms of the critical state parameters slope λand intercept Γ. Therefore, to define CSL, an accurate measurement of the applied load,volume changes and shear-induced pore pressure must be done during testing, mainlyduring shearing.
This review paper aims at summarising and describing a series of recommendedlaboratory procedures to assess the CSL in cohesionless soils (e.g., sands and non-plasticsilty tailings). Therefore, details regarding the sample preparation (for remoulding loose
Geotechnics 2021, 1, 95–127. https://doi.org/10.3390/geotechnics1010006 https://www.mdpi.com/journal/geotechnics

Geotechnics 2021, 1 96
specimens of cohesionless), improvements in the triaxial equipment and testing meth-ods are reviewed in detail. In addition, different experimental techniques and currentconfigurations of triaxial equipment are compiled to discuss their main advantages andlimitations for characterising the soil behaviour at the critical state condition. Such im-provements cover the implementation of oversized lubricated end platens [13] and anembedded top-cap loading ram connection [14,15]. However, the procedures presentedherein do not address the assessment of small-strain stiffness using advanced and highprecision systems, such as the local instrumentation [16], high-resolution fibre optic sensingtechnology [17,18], image analysis [19,20] and computerised tomography scan [21,22], sincethe critical state of soils occurs at large deformations.
On the other hand, experimental data and CSL parameters reported in the literatureof different cohesionless soils (with distinct origins and morphology) were used to com-pare the reliability and reproducibility of laboratory soil testing procedures. Comparisonsbetween different triaxial equipment configurations confirmed that the lubricated endplatens reduce the mobilised friction during undrained tests, providing a better definitionof the instability point of soils. The analyses of this review paper showed that the useof an embedded connection piston avoids the tilting of samples, resulting in a uniformshearing without the generation of shear bands during triaxial testing in contractile soilsand inducing higher compressibility. On the other hand, the use of end-of-test soil freezing,EOTSF, (originally proposed by Sladen and Handford [23]) demonstrated that the applica-tion this method led to reliable measurements of the specimen volume after testing. Theabove allows obtaining reliable results of the CSL when the soil is fully saturated. Theprocedures described in this paper provides guidance and relevant insights to researchersand practitioners attempting to accurately define the CSL of cohesionless geomaterials inthe laboratory.
2. Factors Affecting the Reliability of CSL2.1. Evolution of the Grain Size Distribution—Crushing
During consolidation or shear phases, the grain size distribution (GSD) of soil mayevolve due to particle breakage or crushing. Crushing increases the fines content andinduces changes in the particle shape. The increment of fines content causes additionalcompressibility and shifts down the CSL position [3,24], while changes of particle shapeadjust the critical state parameters M, λ and Γ [25]. Such effects generate uncertainties onthe position of CSL. However, to obtain reliable results, a stable GSD is expected along thetest path for reaching the CSL [26].
One-dimensional compression testing may help to identify the crushing stress thresh-old of soils. Nevertheless, the assessment of CSL must be done under representative condi-tions, that is, the likely stress state on the field. Bandini and Coop [27], Ghafghazi et al. [24]and Yu [28] reported an identifiable change in CSL slope associated with crushing fora range of stresses between 700 and 1000 kPa. Therefore, for tests conducted at thesestresses, grain size analyses must be carried out after testing to confirm changes in theGSD of soil and then validate the representability of CSL. Additionally, in some cases,complementary analyses to evaluate the evolution of particle morphology are necessary toidentify additional factors affecting the reliability of CSL.
2.2. Transitional Soil Behaviour
Transitional soil behaviour is characterised by non-unique CSL, their locations beinghighly dependent on the initial void ratio (e0). Mixed grading and structured soils arethe most susceptible to developing transitional soil behaviour [29–34]. These particularsoils have characteristics, including the evolution of GSD during testing, which results indifferent tests paths that do not tend to a unique CSL, as with conventional soils—this isnot consistent with the CSSM framework. The multiple CSL of transitional soil e : log p′
space are parallel but have a different position, that is, the same or very similar λ andnumerous Γ for all the e0. Figure 1 schematically illustrates the CSL of transitional soils

Geotechnics 2021, 1 97
compared against the CSL of a conventional soil. Transitional soil behaviour can be easilyidentified by assessing the convergence of the normal consolidation line (NCL) throughone-dimensional consolidation tests in soil samples with different e0 [35].
log p′
Transitional
Conventional soils
e
Figure 1. Schematic illustration of the CSL of transitional soils and conventional soils.
2.3. Non-Linearity of CSL
The CSSM framework states that the CSL corresponds to a straight line in bothp′ : q and e : log p′ spaces. However, several authors [36,37] recognise that in granularmaterials, a curve, with the form of the power-law e = A + B(p′/100)C, provides thebest fit to represent the CSL in the e : log p′ space. The curvature of CSL is mainlyrelated to flow instabilities and the crushing of soils or evolution of the morphology of theparticles [5,10,38], which are induced at low and higher stress states, respectively, as shownin the schematic diagram of Figure 2.
Flow instabilityor
compliance in the lab
Stable state
Grain changes
log p′
e = Γ − λ ln p′
e = A−B (p′/100)C
CSL
e
Figure 2. Schematic illustration of the non-linearity of CSL.
Figure 2 shows that at low stresses, the CSL becomes non-linear, tending to be flat-ter. The above is a consequence of flow instabilities, which in many cases lead to soilliquefaction in contractive materials under undrained conditions but also—and eventuallymore important—to uncertainties in soil testing under low stresses [10,39,40]. For someauthors [41,42], flow instabilities are due to a loss of stiffness and strength of soils, whichare characterised by effective stress close to zero. However, in some cases, these differ-ences are because of compliance issues during testing—that is, the use of unappropriated

Geotechnics 2021, 1 98
transducers for specific strain and stress levels that may induce significant errors in thetest results. On the other hand, at high stresses, the CSL becomes non-linear and increasesits slope because of grain changes (e.g., crushing or particle morphology evolution), asexplained before. Therefore, the phenomena and non-linearity effects are independent ofthe CSL, but they can be analysed and interpreted using the CSSM framework.
3. Triaxial Apparatus Improvements for CSL Assessment3.1. Oversized Lubricated End Platens
The oversized end platens were introduced by Rowe and Barden [13]. The use of over-sized lubricated end platens reduces the stress concentration due to the friction betweenthe soil specimen and the platen restraint to negligible amounts [7,40,43]. This reductionyields a uniform stress–strain behaviour and a reliable volume change or pore pressureresponse, as observed by Baldi et al. [14]. The lubricating ends prevent soil particles frombeing pressed through the sheets and develop frictional contacts with the end platens [44].Note that the friction between end platens and soil cannot be completely eliminated, evenby implementing oversized lubricated end platens. Lam and Tatsuoka [45] conducted aseries of direct shear test to assess the friction between the lubricated end platens withsoil particles using fine to medium sands, finding friction angles smaller than 0.25◦. Thesevalues are in accordance with observations reported by Kolymbas and Wu [46]. An ad-ditional advantage of using oversized lubricated platens is the improvement in loose tomedium soils that the methods used to perform the cross-sectional area correction requiredto calculate the deviatoric stress provide (q). The above assumes that the specimen de-forms as a right circular cylinder (RCC) to be more reliable until high deformations of thespecimens—usually necessary for the defamation at the critical state.
The lubricated end platens comprise a very stiff and smooth platen and two discs ofstandard triaxial latex membrane. Moreover, this includes a pair of thin layers of siliconegrease between the two latex discs and the surface platen. The silicone grease must becarefully applied to avoid interference with the sample drainage. Figure 3 shows theconfiguration of the oversized lubricated end platens.
(a) (b)
Figure 3. Oversized lubricated end platens for triaxial tests: (a) photo with the implementedconfiguration; (b) lateral view scheme.
On the other hand, an oversized platen corresponds to a configuration in which thediameter of the platen is bigger than the sample diameter (see Figure 3b). The oversizedplatens aim at ensuring the full support of the sample during shear, as in that phase, thespecimen may expand its volume radially, avoiding any overhang and allowing uniformradial strains in all samples. In tests without oversized lubricated end platens, most of theaxial strain and volume change occur at the middle portion of the specimen—whose valuesare both lower than the actual ones at the middle part—resulting a more uniform volumechange [47]. Therefore, the oversized lubricated end platens allow the soil specimen

Geotechnics 2021, 1 99
to deform as an almost perfect cylinder during shearing, causing uniform strains andstresses that ensure the measurement of the conceptually consistent soil behaviour in thelarge strains range (e.g., more than 15%). Figure 4 shows the differences between thedeformations at the end of shearing in triaxial cells with and without oversized lubricatedend platens.
Figure 4. Comparison of sample shape at the end of triaxial shearing: (a) lubricated end platens;(b) non-lubricated end platens.
There are no specific studies indicating the effect of an oversized configuration onsoil behaviour during triaxial shearing [48]. However, to guarantee the correct operationof the lubricated end platens, porous stone with the same diameter as the platens cannotbe used in triaxial testing to assess the CSL. Note that small porous stones may affectthe saturation process and drainage of the soil specimen, mainly in geomaterials suchas silts or mixed grading soils with high fines content (e.g., mine tailings). Therefore, anadequate proportion between the porous stone and the lubricated stone provides uniformstrains and ensures the correct drainage of the soil, in terms of flow rate. Figure 3apresents an optimal proportion between the lubricated and non-lubricated area, whereΦ(oversized platen) ≈ 76 mm, Φ(sample) ≈ 71 mm and Φ(porous stone) ≈ 33 mm.
The authors established the optimal proportion between the lubricated and non-lubricated areas based on the practical experience achieved in the geotechnical laboratoryof the University of Porto (UPorto) during a series of joint works with Golder Associates—Portugal—regarding the characterisation of cohesionless soils (including sandy and silty-sized tailings). Such a proportion was later outlined and reported by Jefferies and Been [7],demonstrating its applicability for assessing the CSL of sands, silts and tailings. As theseauthors stated, such a configuration guarantees the water flow during all testing phases(i.e., percolation, saturation, consolidation and shearing) and allows a uniform radialdeformation at the ends of the soil specimen. However, it does not allow for measuringof the coefficient of consolidation and the hydraulic conductivity during testing since thecentral porous disc modified the flow boundaries.
On the other hand, it is necessary to consider that the porous stone may be cloggeddue to the accumulation of fine soil particles or the transfer of silicon grease, which iswaterproof. Therefore, the porous stone must be regularly checked and replaced if needed.

Geotechnics 2021, 1 100
The use of filter paper (see Figure 3b) reduces the accumulation of fine soil particles intothe porous stone. The filter paper ideally should have a diameter slightly larger than theporous stone, that is, large enough to cover the porous stone but with a minimum coverageof the lubricated area.
3.2. Top-Cap Loading Ram Connection
One of the most serious errors during triaxial testing is due to the misalignmentbetween the triaxial cell and the soil specimen. The sources of this misalignment can betracked to the sample but also to the triaxial apparatus. Figure 5 illustrates some possiblealignments between the loading ram piston and the specimen axis during triaxial testing.This misalignment will result in a non-perpendicular and eccentric loading, and as aconsequence, the sample will produce non-uniform deformations and stresses duringshearing. These uncertainties in the characterisation of the stress–strain response of the soilwill affect the reliability of the CSL definition.
Figure 5. Examples of alignment between the loading ram piston and the specimen axis: (a) mis-alignment by bad positioning; (b) misalignment due to tilting; (c) perfect alignment.
Different alternatives to correctly apply the axial load during triaxial testing havebeen proposed in recent decades (e.g., [14,49]). The first alternative allowed for direct anduniform contact during the beginning of shearing, providing accurate measurements of thesmall-strain stiffness of soil. Pistons with flat plates were preferred to spherical caps, as theywould ensure the verticality of the loading. Moreover, in natural soils with heterogeneousfabrics—such as residual soils from granite—the horizontality of the top end platen mustbe guaranteed [50]. This permanent contact can be ensured with a flat piston with smallspherical caps inside, as illustrated in Figure 6. The use of such a configuration avoids theinclination of the top platen during triaxial testing.

Geotechnics 2021, 1 101
(a) (b) (c)
Figure 6. Horizontal alignment between loading ram and top end platen: (a) non-horizontality ofthe platen surfaces; (b) horizontality of the platen surfaces due to spherical caps; (c) photo with theimplemented configuration.
Another alternative to minimise the misalignment between the loading ram pistonand the specimen axis is to connect to the load cell and the top platen through a suctioncap before starting the consolidation phase. Figure 7 illustrates the suction top cap. Theconical extension—that is, screwed into the load cell—will enter into contact with thesuction cap, holding a sort of water cushion trapped between them. The drainage tubeconnected conical extension allows for the removal of the water, while full contact is notachieved. Such a tube is attached to an external pump until all the water is sucked awayand a vacuum is created between the suction cap and the conical extension.
(a) (b)
Figure 7. Connection of the load cell to the top platen through a suction cap: (a) parts and scheme;(b) photo with the implemented configuration.
However, this connection must be executed very slowly and carefully to avoid anysample disturbance. This aspect is especially critical in low confined and sensitive soils, asthe contact can induce volumetric strains or pore-water pressure that are not associated withany particularly triaxial stage. In the worst-case, the soil sample can trigger liquefactiondue to excess of induced pore-water pressure in undrained conditions generated duringthe contact of the soil sample with the top cap. Previous tests using this top-cap ramconnection also presented another complication. In very loose samples, the collapse duringthe flushing can be quite substantial and can induce a tilting of the sample, resulting

Geotechnics 2021, 1 102
in a very challenging top-ram connection. In addition, this method would require theadaptation of the triaxial cell to include a top drainage tube.
The use of an embedded top-cap guided ram connection in the triaxial apparatuswill transcend all the adversities mentioned above. This improvement was introduced byHettler and Vardoulakis [49] to reduce the load eccentricities during triaxial shearing. Yearsafter, Baldi et al. [14] showed the benefits of using such a system in the symposium onAdvanced Triaxial Testing of Soil and Rocks sponsored by ASTM. Based on these findings,the Geotechnical Laboratory of the University of Porto (UPorto), with the collaboration ofGolder Associates Portugal, developed and adapted the system illustrated in Figure 8.
The top-cap loading ram connection proposed by UPorto presents three main featuresthat will guarantee its effectiveness: (i) there is no actual fixed connection between theloading ram and the top cap, eliminating compliance errors and adjustments associatedwith the connection process; (ii) the top platen is made from a resistant acrylic plastic, alighter weight material that will reduce the collapse of very loose samples during flushing;and (iii) the top platen is trimmed, which will accommodate the embedded piston, signifi-cantly reducing the ‘tilting’ of the soil sample and assuring a perfect alignment betweenthe triaxial cell and the soil specimen. Note that the contact between the piston and thetop cap is only made at the beginning of the shearing phase (when the tip of the pistontouches the bottom of the trimmed top platen). After assembling the triaxial cell, the pistonis placed inside the trimmed top platen without loading the sample, allowing the specimento freely deform during the remaining stages without losing its alignment, as is guidedthrough a groove.
(a) (b)
(c)
Figure 8. Embedded top-cap loading ram connection: (a) parts and scheme; (b) implementation inthe triaxial apparatus; (c) individual components of the proposed method.
The use of an embedded top-cap loading ram connection guarantees a central andvertical loading, which will produce a uniform sample shearing behaviour and volume

Geotechnics 2021, 1 103
changes [48]—factors affecting the reliable assessment of the CSL. An additional featureof the embedded top-cap loading ram connection is the presence of guidelines in theembedded piston, which allow for registering the height changes of the soil specimenbefore the soil consolidation. In the UPorto design, there are eight guidelines separated by1.75 mm. The piston dimensions are Φ ≈ 19 mm and H ≈ 27.60 mm, and the groove in thetop cap is of about 18 mm depth by Φ ≈ 21 mm.
4. Specimen Preparation Method
Obtaining undisturbed high-quality samples of cohesionless soils is a challenge ingeotechnical engineering due to the sample disturbance during sampling and handling pro-cedures, which may affect the mechanical response of the soil. To circumvent these complica-tions, advanced equipment and demanding techniques are mandatory during the samplingprocess and laboratory testing, which have also been documented by Viana da Fonseca andPineda [51], Viana da Fonseca et al. [52] and Molina-Gómez et al. [53]. Moreover, the het-erogeneity between undisturbed samples or the inherent layering within the specimen canresult in a scattered definition of the CSL. Given these limitations, reconstitution methods ofspecimen preparation take on a significant importance for geomechanical characterisation.
The ideal method of remoulding samples has been an ongoing debate, and manystudies and contributions have been presented regarding different approaches [54–57]. Themoist tamping (MT) technique, widely used in the critical state approach, faces criticism asit can produce void ratios looser than the ones on-field and influence the static undrainedbehaviour of the soil, making it prone to liquefaction due to their metastable honeycombstructure. Water sedimentation (WS) methods and slurry deposition (SD) generally repli-cate a similar fabric as in situ conditions of natural alluvial and hydraulic fill deposits.However, the samples tend to show a dilative behaviour and some induced anisotropy.
Dense samples are not desirable when defining the CSL, as they may not reach theultimate state within the strain limitations of the triaxial apparatus, mainly due to thenon-uniform sample densities and strains that develop once shear localisation occurs.Further studies would be required, such as a state-dilatancy interpretation, which is not thescope of this work. Dry pluviation (DP) is an effective method of achieving a wide range oftarget densities in sandy soils once the technique is calibrated [58–60]. DP methods resultin a more contractive response and enhanced reverse behaviour than wet reconstitutionmethods [61]. However, DP cannot be applied to every type of soil, such as plastic soils.
The main concern of the method for remoulding specimens is its effect on soil be-haviour during testing, which should represent the field conditions. It is well-known thatthe remoulding method determines the structure or fabric of the soil [62,63]. Nevertheless,the CSL is reached after the initial structure is destroyed, as the sample reaches very dif-ferent particle arrangement at large strains [10,64–68]. Although its strong influence issmall to intermediate in strain level, the existence of induced soil fabric in the laboratoryis not relevant in ultimate states [7]. The method for remoulding specimens to assess theCSL aims to produce uniform samples with specific void ratios that represent the materialunder study. As this paper deals with cohesionless soils (sandy, silty and non-plasticgeomaterials) it is considered that the moist tamping technique simultaneously with theundercompaction method is able to produce uniform and reproducible soil specimens withthe widest void ratio range, including the soil testing from very loose to loose conditions.The soil specimens remoulded for such conditions tend to show contractile behaviour,which allows for a reliable measurement of the CSL.
4.1. Sample Size
Regarding the variability of parameters such as unit weights, elastic moduli valuesand shear strength, large-sized specimens tend to accommodate eventual induced non-homogeneous face during the preparation process in comparison to small specimens.Small-sized remoulded specimens are more likely to present significant variations in finalvoid ratio measurements. These variations in void ratio can be attributed to the loss of soil

Geotechnics 2021, 1 104
or water during the specimen removal, causing errors in the interpretation of test results.In addition, this may lead to inaccuracies in the estimation of specimen dimensions, suchas the diameter, which is a relevant factor for assessing the stress state during triaxialtesting due to its relevance on the deviatoric stress computation. Hence, large samplesare desirable since both reliable estimations of both e and p′ are crucial for the unbiaseddefinition of the CSL.
In this review, the equipment, schemes and results presented consider tests for soilspecimens of 70 mm diameter with an initial height-to-diameter ratio H/D ≈ 2. It is welldocumented [69,70] that this ratio helps to overcome the effects of end restraint due tofriction on the end platens (along with the use of lubricated ends), also allowing for thefree development of shear bands by avoiding interception with the end platens.
Some studies recommended H/D = 1 to overcome the effects of end restraints due tofriction (e.g., [46,71]). However, in dense soils with such a ratio, it is not appropriate due toshear bands developing freely because of their interception with the end platens [44]. Thiseffect occurs in both lubricated and non-lubricated end platens. Goto and Tatsuoka [43]observed that the friction angle measured in samples of H/D = 1.0 and H/D = 2.0 intriaxial devices with lubricated ends platens defers in about 1◦. Hence, H/D = 2.0, orpossibly slightly higher, is recommended herein.
4.2. Moist Tamping Technique and Undercompaction Method
In this paper, the moist tamping technique simultaneously with the undercompactionmethod is considered the appropriate reconstitution method for a clear definition of theCSL, as described above. With the moist tamping technique, the sample is assembled bydepositing and tamping damp material through several layers for better control of thepursued void ratio. The moist condition creates capillary forces (suction) between thesoil grains that allow for material compaction with low densities, which probably wouldnot be possible with other remoulding methods. However, when compacting in layers,these layers may have different void ratios, as the compaction of each succeeding layer canfurther densify the lower layers. The undercompaction method (see Ladd [72]) reducessoil grain segregation and ensures a uniform sample density throughout the specimen, afundamental aspect of sample remoulding. This method consists of compacting the layersto a lower density than the final desired value by a predetermined amount defined aspercent undercompaction (Un). Therefore, the weight of soil in each layer increases frombottom to top to accommodate the additional compaction that occurs in underlying layers,ensuring the same void ratio in all layers. The percent undercompaction in each layer iscalculated as
Un = Uni −[
Uni −Unt
nt − 1(n− 1)
](1)
where Uni is the percent undercompaction selected for the first bottom layer, and Unt is thepercent undercompaction for the final top layer (usually zero); nt is the total number oflayers, and n is the selected layer (note that the first layer to be compacted is the bottomone, which will correspond to n = 1). Although widely used, techniques to establish whatvalue of Uni should be adopted do not appear to have achieved a consensus [73]. Theauthors will further present their recommendations for the values of Uni.
Once the number of layers, sample density and water content to be used in the com-paction are defined, the total wet weight (WT) of material required for sample preparationis determined by
WT = γd(1−ω0)VT (2)
in which γd is the dry unit weight, ω0 the water content and VT the total volume of thespecimen. The moist weight of material required at each layer is given by Equation (3).Note that the Wn is the cumulative weight at the top of the nth layer. The weight per layerwill be deducted by subtracting the underlying layers’ weight.

Geotechnics 2021, 1 105
Wn =
(WTnt
)n(
1− Un
100
)(3)
4.3. Compaction Mould and Tamper
The specimen is remoulded inside the latex membrane, which is attached to thebase of the triaxial cell, resorting to an internal split mould and a tamper to compactthe sample. The non-standard compaction mould and tamper are based on the modelproposed by Jefferies and Been [7], which accommodates enlarged platens and other minormodifications. Such a mould can be used in different triaxial cells since lengthens canadjust the mould height to the lower platen. Figure 9 presents a scheme with the mouldand tamper components.
During sample preparation, the upper ring holds the membrane between the collarand the mould. A vacuum pressure of about 50 kPa is also applied to ensure the perfectadjustment of the latex membrane with the mould and, with that, a uniform diameterthroughout the sample. The upper ring has the same diameter as the top platen, so once thesample is fully remoulded, the bracelet is removed and the upper cap is carefully placed onthe notch to ensure a perfect arrangement. The cut-out of the mould assures a horizontalposition of the top platen and prevents an over-compaction of the upper part of the samplesince it stops the platen from being pushed beyond its position. The collar works as aninterface for tamping.
Figure 9. Elements for specimen remoulding: (a) split compaction mould; (b) compaction hammer.
The non-conventional compaction hammer (Figure 9b) controls the layer height whenreconstituting samples through the moist tamping technique. The height adjusters regulatethe drop height of the tamper inside the mould to a predefined level, providing the desiredlayer thickness and compaction. The upper and lower plate act as a stopping point on thecollar when tamping. Another particularity of this mould is the two points/locations toapply the vacuum, which allow for the attachment of the latex membrane to the mouldwall (Figure 9a). The upper input of the vacuum ensures that the membrane continues tofirmly stretch during the compaction of every layer. If a single vacuum inlet is used, oncethe layer that is located at the same level is compacted, the vacuum effect is suppressed andthe membrane tends to contract. When remoulding very loose samples, this could lead to

Geotechnics 2021, 1 106
diameter fluctuations along the specimen, decreasing from bottom to top, as illustrated inFigure 10a. This ‘mushroom’ effect will generate a non-uniform density along the specimenand the potential formation of shear bands due to the inconsistent response of the specimen(Figure 10b). Overall, shear localisation on specimens (even in medium loose samples)can induce unrepresentative measurements of volume change and induced pore pressureduring shear loading, on drained and undrained triaxial tests, respectively.
Figure 10. Irregular remoulding: (a) ‘mushroom’ effect; (b) localised shear bands on soil specimen.
5. Proposed Testing Procedures
The triaxial testing can be carried out according to the ASTM procedures D4767 [74]and D7181 [75] or other standards (e.g., CEN/ISO). The current paper aims to portray anundemanding procedure that could be easily implemented and accessible to any academicor commercial geotechnical laboratory. The test procedures recommended in this sectionseek to increase the accuracy and simplicity in the techniques used to define the CSL.Test methods will generally focus on the creation of loose cohesionless specimens takingadvantage of the improved components in the triaxial apparatus. The soil specimensremoulded for such conditions tend to show contractile behaviour, which allows a reliablemeasurement of the CSL.
5.1. Soil Preparation
One of the features that guarantee the representativeness of the CSL regards thematerial that is used to reconstitute the soil specimens in the laboratory. The materialmust not be reused between tests since the soil can present grain changes or transitionalbehaviour, which should be verified as described before. Therefore, all samples should beremoulded with original material.
In addition, it is crucial to guarantee the homogeneity between the soil specimensused to define the CSL. If the material is in a wet condition, it should be dried first tofacilitate user handling. Moreover, if the material has a high fines content (i.e., clods of siltand clay throughout the specimen), they must be carefully unbound without crushing thesoil particles and mixed up. Afterwards, the sample can be divided and reduced to testingsize using the quartering technique (e.g., standard testing procedure ASTM C702 [76]),
Geotechnics 2021, 1 107
which minimises the variations between the different fractions. All portions are stored andoven-dried before remoulding the sample. These steps ensure the homogeneity and therepresentativeness of the material used to assess the CSL. However, additional proceduresmay be needed if the soil contains dissolved solids or chemical products that may influencethe soil behaviour during testing.
5.2. Remoulding of Soil Specimens
The adopted procedure for specimen remoulding is described in this section. It followsthe moist tamping technique combined with the undercompaction method, previouslydescribed, adapted for six layers. The number of layers to be used in the preparation of thespecimen may vary accordingly to the specimen diameter and the required dry unit weight;however, the maximum thickness of the layers should not exceed 25 mm. The gravimetricwater content ω0 to be used in the compaction process may differ according to the studiedsoil (e.g., 5% for sands or 15% for silty mining tailings). Ultimately, the definition of ω0depends on the user sensibility to adopt a water content that can effortlessly achieve thepursued loose state. The same applies to the value of Un, which can fluctuate according tothe target void ratio (from 0% on dense samples to 15% on very loose samples) or to highvalues of specific gravity Gs (as the material self-weight can aggravate the densification ofthe lower layers).
The adopted procedure for remoulding soil specimens ensures a more uniform densitydistribution within the specimen. The exact internal variation in initial density seen ina particular sample is likely to depend both on the number of layers and on the under-compaction ratio used. However, regardless of the exact initial distribution of internalsample void ratio, Thomson and Wong [77] showed that there is a tendency for each zoneto tend towards a unique CSL. For this reason, the undercompaction ratio, number oflayers and water content selected when compacting a sample will not influence the CSLparameters. It is noteworthy that this statement is only valid when testing the ultimatestate in loose samples, as these remoulding conditions will influence the soil behaviour(e.g., compressibility parameters, stress/strain shearing paths and even cyclic or dynamictesting response).
The process starts with the preparation of the material and equipment. This phasecovers the preparation of the lubricated ends platens, the positioning of filter paper and theadjusting of the latex membrane to the bottom platen using two O-rings. Afterwards, thesplit mould is assembled and 50 kPa vacuum is applied to draw the membrane with themould, as previously illustrated in Figure 9a. Meanwhile, the soil is prepared. Knowingthe amount of material needed, the weight distribution by layers and the water content tobe used in the sample preparation, the soil can be properly mixed with de-aired water toobtain the moist content intended. Each material will require the use of a certain pore water,from tap water to distilled water or even deionised water if no particular liquid is specified(which is commonly the case with marine sediments or mining tailings). The wet materialmust be saved in a sealed recipient during the compaction process to avoid air drying. Thereal water content of the soil specimen is estimated by taking two samples of that mixture,one before placing the first layer and the second after finishing the compaction. The averagemoisture value corresponds to ω0 of the soil. Figure 11 illustrates the remoulding procedureusing the undercompaction moist tamping technique.

Geotechnics 2021, 1 108
Figure 11. Reconstitution of soil specimens: (a) layer deposition; (b) tamping process; (c) isolation ofthe sample; (d) fully remoulded sample.
The first portion of soil is poured into the mould and distributed around the base witha spoon (Figure 11a). The layer is lightly tamped using the compaction hammer until thetamper hits the stopping point in every simple stroke (Figure 11b). Before tamping, theheight adjuster is regulated so that the compaction foot tamps exactly at the top of thelayer, avoiding an over compaction of the soil. To avoid planar surfaces between layers, thetamped layer must be superficially scratched. Both layer deposition and tamping processare repeated for all layers until fully remoulding the soil specimen.
A uniform density profile is intended; however, because the tamping compactionis more effective on the upper part of the layer, the specimen can present a ‘zig-zag’pattern [78] due to higher densities near the top of each layer. Figure 12 shows a clear‘zig-zag’ pattern of a soil specimen in the triaxial equipment compared to a regular one.Thomson and Wong [77] showed that these samples’ uniformity improved significantlyduring shearing, allowing a reliable estimation of the CSL. However, this effect is animportant concern for the triaxial testing because the area correction method used in thisapproach (further described) considers the sample as a right cylinder. Even though the‘zig-zag’ effect does not influence the shearing behaviour, it can introduce a miscalculationon the volume changes during triaxial stages if the pattern is pronounced.
Figure 12. Soil specimens after remoulding: (a) specimen with a ‘zig-zag’ pattern; (b) regular specimen.

Geotechnics 2021, 1 109
After compacting all layers, the upper platen (also lubricated and using filter paper) isplaced, and the membrane is attached to the top cap using 2 O-rings (Figure 11c). Oncethe sample is isolated, the mould can be removed by applying vacuum (≈−10 kPa) to thesoil specimen through the drainage lines to help the soil specimen to keep its shape andthen its density (Figure 11d). The height and diameter of the sample are measured using acaliper rule to estimate the initial density, allowing the membrane thickness to be deduced.
At this point, the isolation and seal of the latex membrane can be verified. For thispurpose, the drainage lines are closed, and if the specimen starts losing its suction, thismay imply that the membrane was punctured or ripped during the reconstitution process.If the membrane is in good condition, the test may begin; otherwise, the sample mustbe disassembled because it will not reproduce the right behaviour in the forthcomingstages. If the conditions are appropriate for testing, the remainder of the triaxial cell is thenassembled, filled with de-aired water, and a cell pressure of 10 kPa is applied in order toremove the vacuum.
5.3. Sample Saturation
The saturation process is fundamental for a proper assessment of the CSL, as theconstant volume (or undrained) conditions cannot be assumed unless the soil is fullysaturated. In drained tests, the volume change is estimated by measuring the amount ofwater entering or leaving the saturated soil specimen. The importance of the full saturationof soil is more pronounced in undrained tests since the development of pore-water pressurestrongly depends on the stiffness of the pore fluid. Considering that the compressibility ofwater and air are significantly different, a small amount of air can have a large effect onthe soil response. Hence, the saturation of the samples is fundamental to provide reliablevalues of pore water pressure and volume change during testing.
5.3.1. Carbon Dioxide Method
The use of carbon dioxide (CO2) before the water flushing significantly aids the fullsaturation of the soil specimen, since this inert gas is more soluble in water than air is. Afterthe sample preparation, the CO2 is introduced with low pressure (≈3 kPa) from the bottomdrainage line, forcing the air to circulate upwards in the soil specimen. A tube connected tothe top drainage line, which is open and submerged under water, allows for monitoring thebubbling velocity and the percolated volume of CO2. During this phase, it is important tomonitor the gas pressure, to avoid any pore pressure build-up that could reduce the meaneffective stress and to prevent the CO2 from piping or flowing up in preferential pathwaysrather than displacing the air. Note that CO2 is denser and less compressible than air. Toensure complete replacement of the air, the flushing of CO2 is done for about 60 minutes oruntil the equivalent of one litre of the gas is displaced. The main advantage of using CO2 isto achieve the full saturation condition of cohesionless soils faster than other saturationmethods [7,44].
5.3.2. Water Flushing
Since this procedure aims to achieve a full saturation condition, the use of de-airedwater inside the specimen is essential, as most of the dissolved gas (mixture of air and CO2)present in the fluid was already removed. However, if the material tested contains somedissolved solids (such as salt), deionised water should be used instead to avoid any porefluid chemistry issues affecting the CSL definition [73].
5.3.3. Backpressure Increment
Small air bubbles may remain attached to the soil grains after water percolation andcan be difficult to flush out. The full saturation condition is then achieved by applyinghigh pressures to the pore fluid to cause the pore air to dissolve completely into the porewater. The backpressure is gradually increased to high values while keeping a low effectivestress (approximately 10 kPa). In the authors’ experience, a backpressure equal to 300 kPa

Geotechnics 2021, 1 110
together with the use of CO2 and water flushing provides a full saturation condition.Currently, some commercial triaxial chambers are designed for pressures up to 1700 kPa,and some controllers can apply 2000 kPa of pressure, which allows for implementingother backpressure values during soil saturation. However, for some plastic or fine soils,additional techniques to achieve full saturation may be needed, namely the double vacuumduring water flushing [79], and the increment of backpressure to even higher values or apercolation under pressure. These topics will be further discussed.
5.3.4. Evaluation of the Degree of Saturation
The saturation of the soil specimen can be determined by measuring the value of thepore pressure coefficient B, as defined by Skempton [80], where an increment in the cellpressure (∆CP) is applied under undrained conditions, and the corresponding increment ofpore pressure (∆u) is measured. In fully saturated conditions, ∆CP = ∆u, and the B-valueis of about 1.0. However, a high B-value does not always guarantee full saturation for everytype of soil [44], which is particularly important when undrained tests are preformed andespecially when liquefaction susceptibility is studied. For sandy soils, the B-value at fullsaturation condition varies from 0.90 to 0.99, but it can be lower than such a range in stiffand coarser geomaterials [81,82].
However, P-wave velocity (Vp) better indicates the full saturation of soil since itincreases harshly from 90% to 100% degree of saturation [83]. Due to this unreliabilityof the B-value, a correlation of this parameter with the P-wave velocity (Vp) provides atheoretical framework to validate the full saturation condition of the soil. In triaxial tests,the propagation time of the P-wave is measured by using bender/extender elements, whichare embedded in the platens of the triaxial chamber [84,85] or simply bender elements ifa proper analysis is conducted, as presented by Ferreira et al. [85]. However, the authorsdo not recommend using bender/extender elements when the end-of-test soil freezing isadopted, due to possible damages in the piezoelectric transducers.
For granular soils, a B-value of higher than 0.97 is recommended to indicate the fullsaturation condition. This recommendation of B-value > 0.97 is based on comparisonsbetween such a parameter against the P-wave velocity (Vp). In saturated soils, the Vpvalues are higher than 1482 m/s since the wave propagation is commanded by water [86].Theoretical models for describing the evolution of Vp and B-value as a function of thedegree of saturation (Sr) have been presented by [87–91]. All Sr, B-value and Vp relationsare based on continuum mechanics [92,93].
Figure 13 presents the evolution of both Vp and B-value as a function of the degree ofsaturation, together with the calibration of the B-value with Vp by applying the wave prop-agation theory in fluid-saturated porous media. Additionally, experimental data obtainedfrom TP-Lisbon sand—soil characterisation details in [94]—to contrast and corroborate thetheoretical model are also presented in Figure 13. From this figure, it can be observed thatthe full saturation condition (i.e., Vp > 1482 m/s) is achieved for a B-value of about 0.97,which is consistent with that observed by [81,83]. These findings allow for validating aproper consideration of the B-value, and then guaranteeing the full saturation conditionsof the soil specimens that will define the CSL.

Geotechnics 2021, 1 111
20 40 60 80 1000
250
500
750
1000
1250
1500
Full saturation
Degree of saturation, Sr (%)
P-w
avevelocity,Vp(m
/s)
n = 0.3
n = 0.5
n = 0.7
Experimental
20 40 60 80 1000
0.2
0.4
0.6
0.8
1
Full saturation
Degree of saturation, Sr (%)
B-value
n = 0.3
n = 0.5
n = 0.7
Experimental
a) b)
0.2 0.4 0.6 0.8 10
250
500
750
1000
1250
1500
B-Value > 0.97
B-value
P-w
avevelocity,Vp(m
/s)
n = 0.7
n = 0.5
n = 0.3
Experimental
c)
Figure 13. Application of the wave propagation theory to validate the degree of saturation: (a) Vp asa function of Sr; (b) B-value as a function of Sr; (c) relation between B-value with Vp.
5.3.5. Percolation under Pressure
In case the full saturation is not reached after the backpressure increment, an efficientsaturation procedure is to impose percolation under pressure. Different pressures are ap-plied at the ends of the sample, higher at the base than on the top, forcing the water to seepthrough and in and out of the specimen. The differential pressure must respect the internalequilibrium of the pore pressure (u ≈ 300 kPa) and maintain the effective confinement of10 kPa to avoid an overconsolidation of the sample (e.g., cell pressure ≈ 310 kPa, bottombackpressure ≈ 303 kPa and top-pressure ≈ 297 kPa). For low permeability soils, the pres-sure difference between the drainage ports can be increased. From the authors’ experience,this process involves the flushing of at least 100 cm3 and must be repeated until the fullsaturation condition is achieve. If needed, an additional back pressure increment (usuallyup to 500 kPa) will speed up the saturation process, provided that the post-consolidationstresses are compatible with the equipment capacity. In addition, extra time under highbackpressure can increase the degree of saturation.
5.4. Consolidation Phase
Laboratory testing aims at simulating the field stress conditions as close as possible;the applied consolidation pressures should correspond to a likely stress state on the fieldor defined by the project for specific purposes before shearing. The reference effectiveconfining pressure and the previous stress history of the soil establish all aspects of itsbehaviour. For that reason, different initial stress states are required to define the CSL ofany soil. However, for CSL definition, large ranges of confining pressures can be tested aslong as the limitations of such studies are recognised (such as flow instability or evolutionin grain size distribution or morphology).

Geotechnics 2021, 1 112
In addition, isotropic consolidation is often used in practice, although the stress statein the field is commonly anisotropic. It is well known that in the laboratory, the anisotropicconsolidation of soils requires advanced triaxial equipment, but the present work aims atan undemanding procedure that can be easily implemented and accessible to any academicor commercial geotechnical laboratory. Hence, isotropic consolidation is recommended toassess the critical state parameters due to the uniqueness of the CSL and independence ofinitial soil fabric [5,10,29]. For both isotropic and anisotropic consolidations, the drainagevalves are open to allow the drainage of the sample, avoiding the pore pressure excess. Anautomatic volume gauge instrumented with an electronic displacement transducer (e.g.,LVDT transducers) monitors the drainage of soil. Moreover, a gradual pressure ramp isrecommended to track the variation of void ratio.
5.5. Shear Phase
During triaxial testing, the specimens are loaded to failure by increasing the axialdeformation while keeping the cell pressure constant. For drained conditions, shear loadingby axial compression is imposed with an axial strain velocity compatible with the excesspore pressure dissipation rate that guarantees the effective stress. A suitable loading forensuring the complete drainage of soil can be defined using the consolidation parameters—t50 or t90 [95]. In undrained tests, the shearing velocity is not critical, but it should be lowenough to secure equalisation of the pore pressure at failure.
The undrained shearing stage begins by closing the drainage valves before shearloading. As no drainage is allowed, the tendency of the soil to change volume is reflectedby a variation in pore pressure. Because of the undrained condition, no volume changes inthe fully saturated sample are induced. Therefore, the water content and void ratio at theend of the test are the same at the end of consolidation. In drained shearing, the drainagevalves are open. The specimen will expel or absorb water to keep the effective stress of theconsolidation stage. A soil specimen changes volume during shearing in a drained test.Hence, the water content, the void ratio and the dry density of the sample at the end of thetest are distinct from the beginning of shearing.
During this stage, an automatic volume gauge measures the specimen volume changes,the axial displacement is quantified with an electronic displacement transducer and theload should be measured through a submersible internal load cell. Usually, the monotonicshearing is applied under strain control by increasing the deformation up to the ultimateor critical state. Following the end of the triaxial test, the specimen must be inspected forany localised shear band or other abnormalities that may affect the results and definitionof CSL. The recommended procedures to measure the final void ratio are detailed below.
5.6. Data Correction
For a proper interpretation of the results during the shearing phase, it may be necessaryto apply some corrections to the measured quantities. The corrections must be evaluatedrelative to their importance for the final values/results of the tests. Due to critical statetesting generally implying large strains, an area correction method and the membraneeffect should be quantified. When using lubricated end platens, the right circular cylinder(RCC) can be maintained for axial strains higher than 20%. Therefore, the reported stressesmust be corrected in terms of the sample cross-section evolution since the specimen iscompressed. Considering that the specimen deforms as a right cylinder, it can be assumedthat the corrected area of the sample (A) during shearing is given by
A = A0
(1− εv
1− εa
)(4)
where A0 is the initial cross-section area of the sample at the start of the shear (endof consolidation).
The main stresses can also be influenced by the presence of the rubber membrane.For this reason, the data should be corrected considering two major effects: (i) membrane

Geotechnics 2021, 1 113
penetration and (ii) membrane stiffness. When a triaxial test is performed on a granularsoil, the membrane enclosing the triaxial specimen tends to penetrate the voids betweenthe particles at the interface, which can cause an experimental error. In a drained test, the∆V measured is not only representative of the soil skeleton compression but also includesthe volume of water that is forced out due to the membrane penetration. In undrainedconditions, as the pore pressure increases, the water inside the sample tends to move to thelateral surface, refilling the voids. As a result, the measured ∆u is underestimated.
The membrane penetration effect depends mainly on the soil particle size but alsoon the specimen density and overall geometry, the range of effective confining stressesduring a given test and the modulus and thickness of the latex membrane. According toNicholson et al. [96], membrane-compliance effects may be negligible for sands and siltstested in conventional 71 mm diameter samples, since even very thin membranes cannotpenetrate significantly into the small surficial voids. Since this paper deals with granularsoils (sandy, silty and non-plastic geomaterials), the membrane penetration effect was nottaken into account. However, this effect must be considered for testing of gravels in largescale specimens—commonly used for the characterisation of geomaterials in transportationinfrastructures [97].
Another implication inherent to samples that, during shearing, reach high levels ofstrains is due to the rubber membrane stiffness. As deformation occurs, the membranetends to constrain the specimen laterally, making the radial stress truly applied higher thanthe one that is measured. Consequently, the axial stress is also influenced due to the loadtaken by the membrane. Therefore, the stresses acting on the specimen must be correctedconsidering the membrane stiffness. The literature presents many different correction meth-ods; however, the authors recommend the expressions given by Duncan and Seed [98,99]because these corrections can be applied to a large number of criteria (large strains, drainedand undrained conditions and compression and extension tests). This effect is more pro-nounced at lower stress levels [44]. The corrections to the axial (σa) and radial (σr) stressesare the following:
σa(corr) = σa −23
Em
[2εa + 1−
√1− εv
1− εa
]4T0
D0(1− εv)(5)
σr(corr) = σr −23
Em
[εa + 2− 2
√1− εv
1− εa
]2T0
D0(1− εv)(6)
where T0 is the initial thickness of the membrane, Em the elastic modulus for the membraneand D0 the initial diameter of the specimen. Standard triaxial latex membranes withT0 ≈ 0.30 mm and Em ≈ 1.3 MPa are used in UPorto.
5.7. Void Ratio Measurements
The measurement of the void ratio (e) of samples in triaxial tests is one of the mostimportant aspects in determining the CSL. Furthermore, it is one of the variables moresubject to be miscalculated, particularly in loose samples. While it is relatively simple toestimate the initial void ratio through the initial sample dimensions, dry weight and watercontent, the volume changes during sample saturation (including sample flushing andback pressure increasing) can lead to significant errors if ignored, as exposed by Sladenand Handford [23]. During saturation, samples experience deformations due to the soilcollapse or changes during the stresses’ ramp application and the release of surface tensioneffects in moist samples. However, volume changes during saturation are particularlydifficult to measure because of the air existence in the voids of the soil, the water lines andporous stones after water flushing. An accurate approach to overcome these challenges isto measure the sample volume at the end of the test and then calculate the volume changeduring saturation. Hence, the axial strain is estimated considering the direct measurementsof the LVDT, while the radial strain is estimated by applying the relations of volumetricand axial strains for a perfect cylinder.

Geotechnics 2021, 1 114
In this paper, the authors recommend the end-of-test soil freezing (EOTSF) techniqueproposed by Sladen and Handford [23] because of its precision and simplicity of void ratiomeasurement through the final gravimetric water content (GWC). The final volume is usedto calculate the void ratio at the ultimate state, and data processing is made from the endof the test to the beginning. This technique consists of freezing the specimen at the endof triaxial testing, ensuring that the final void ratio is accurately determined by keepingthe water volume inside the specimen at the end of the shear stage. Thus, once the test isfinished, the sample is isolated by closing the drainage valves (if not already done), the cellpressure is reduced to zero, the piston is unloaded and the cell chamber fluid is drained.The triaxial cell is disassembled as much as possible without breaking the ‘seal’ on thesample and placed in the freezer.
Once the sample is frozen, it can be removed intact and weighed without losing wateror soil. The weight from the adherent items (membrane, filter papers and lubricated ends)is deducted, and the water content is determined from the oven-dried weight of the sample.Note that by the end of the shearing phase, especially in loose samples with low confiningpressures under undrained conditions, the soil specimen is very unstable, as segregationoccurs due to liquefaction, resulting in a challenging sample recovery. The handling ofthe sample is significantly improved by freezing it, which will allow for a reliable watercontent measurement.
This method cannot be used if the platens are set up with electronic equipment suchas bender elements, as freezing will damage these components. In such cases, the voidratio can be determined through the direct measurement of end-of-test GWC, providingthat during the sample removal no water or soil is lost. The same can be applied to densersamples, as they will remain quite stable after shearing and will be easier to handle.
The final volume is determined by assuming a non-loss of the water in the specimenvoids, which is completely saturated using the relation Gs · ω = Sr · e, where Gs is thespecific gravity of the soil, ω is the water content and Sr is the degree of saturation. Withthis final void ratio and the continuous measurements of volume changes, the void ratio iseasily determined at the beginning of both consolidation and shear stages.
Moreover, during the percolation and saturation, the axial shortening of the samplecan be measured using the top guided piston guidelines (see Figure 7). The volumechange during these stages can be estimated by assuming that the volumetric strain isisotropic—that is, the total volumetric strain is three times the axial strain. This volumecan be included in additional approaches of void ratio measurement, as part of internalchecks by the laboratory. The authors also recognise other methods for obtaining accuratevoid ratios, such as cell calibration and Verdugo and Ishihara’s [36] methods. In the cellcalibration method, the ‘corrected’ cell volume change is assumed to be equal to the samplevolume change during saturation [100], while Verdugo and Ishihara’s [36] method covers,after shearing, the removing of additional water from the sample by increasing the cellpressure, allowing for an easier sample recovery. These methods, if used correctly, maybe equally accurate to the EOTSF. However, they are complicated, time-consuming anddepend on the operator expertise, which is not the intention of this paper.
6. Validation of the Proposed Procedures and Discussion6.1. Description of Tested Soils
The test procedures proposed herein were compared by compiling critical state pa-rameters reported in the literature for four cohesionless soils (two sub-angular and twosub-rounded with distinct origins). These soils correspond to a sandy silt gold tailing [48],a calibrated sand with uniform grain size distribution known as Coimbra sand [101], thehistorically liquefiable TP-Lisbon sand [94] and the well-characterised Hostun sand [102].The sandy silt gold tailing and Coimbra sand have already been studied within the scopeof a programme of two round robin tests, in which the University of Porto (UPorto) par-ticipated. The CSL results provided by [48,94,101] included experimental data obtainedfrom different test procedures and triaxial apparatus configurations, ideal for validating

Geotechnics 2021, 1 115
the proposed test procedures of this paper. Test results reported by [102] only included onetriaxial configuration; however, one of the tests that these authors considered represen-tative of CSL was replicated by applying the same state conditions but using the triaxialimprovements proposed in this paper. Table 1 summarises the physical properties of thestudied soils. Figure 14 presents the grain size distribution of the studied soils.
Table 1. Physical properties of studied soils.
Studied Gs D50 Fines Cc Cu emax emax Shape ofSoil ( – ) (mm) Content (%) ( – ) ( – ) ( – ) ( – ) Particles
Gold tailing 2.78 0.05 58.75 1.44 25 1.45 0.39 Sub-roundedCoimbra 2.65 0.28 1.80 1.37 1.69 0.81 0.48 Sub-rounded
TP-Lisbon 2.66 0.21 2.21 1.13 2.13 1.01 0.63 Sub-angularHostun 2.64 0.34 0.00 0.96 1.43 1.00 0.66 Sub-angular
6.2. Reproducibility of the Proposed Test Procedures
A series of triaxial tests were carried out under drained conditions on Coimbra sandto assess the reproducibility of the procedures addressed herein. Figure 15 presents theresults of three drained tests conducted on soil specimens with similar void ratio afteran isotropic consolidation of 20 kPa. A comparison between these results revealed verysimilar behaviour of soil and final values of deviatoric stress (q), mean effective stress (p′)and void ratio (e). Although the three tests showed small variations, they converged to thesame CSL. Therefore, these comparisons provided experimental evidence regarding thereproducibility of the unbiased procedures recommended in this paper.
0.001 0.01 0.1 1 100
10
20
30
40
50
60
70
80
90
100
Diameter of particle, D (mm)
Percentage
passingbyweigh
t(%
) Gold tailing
Coimbra
TP-Lisbon
Hostun
Figure 14. Grading curves of the studied soils.

Geotechnics 2021, 1 116
0 5 10 15 20 25 30 350
20
40
60
80
Axial strain, εa (%)
Deviatoricstress,q(kPa)
CID20-1
CID20-2
CID20-3
a)
0 5 10 15 20 25 30 350
10
20
30
40
Axial strain, εa (%)
Mea
neff
ecti
ve
stre
ss,p′
(kP
a)
0 5 10 15 20 25 30 350.6
0.65
0.7
0.75
0.8
Axial strain, εa (%)
Voi
dra
tio,e
b) c)
Figure 15. Reproducibility of tests: (a) comparison of deviatoric stresses; (b) comparison of meaneffective stresses; (c) comparison of void ratios.
6.3. Behavioural Consistency by Applying the Proposed Procedures
To assess the behavioural consistency of soil testing by applying the unbiased pro-cedures of this paper, a series of drained and undrained triaxial tests were compared.Reid et al. [48] observed a more conceptually consistent behaviour of soils during drainedtriaxial shearing when using an embedded top-cap loading piston, as adopted by UPorto.This effect has not been discussed in detail in the context of the potential impacts of theCSL assessment. Baldi et al. [14] stated that the use of an embedded top-cap loading pistonensures a perpendicular alignment between the soil specimen and triaxial cell during allphases of triaxial testing and leads to a more uniform shearing.
Figure 16 presents a series of direct comparisons between triaxial test results to high-light the effects of using the embedded top-cap loading piston. These results are comparedin terms of strain-softening and volumetric strains. Moreover, the test comparisons wereperformed in the three soils described in Section 6.1 under the same confinement pressureand very similar relative density (or void ratio) after consolidation. For gold tailing results,all tests were carried out in triaxial apparatuses with lubricated end platens, as reportedby [48]. For the other three studied soils, only the results of the recommended triaxialconfiguration herein were obtained in triaxial cells with lubricated end platens; thus, theother results were obtained from tests carried out in non-improved triaxial apparatuses.

Geotechnics 2021, 1 117
0 5 10 15 20 25 30 350
0.25
0.50
0.75
1.00
1.25
1.50
Axial strain, εa (%)
Stressratio,η=q/p′
0 5 10 15 20 25 30 350
1
2
3
4
5
6
7
Axial strain, εa (%)
Volumetricstrain,ε v
(%)
Strain softening?
a) b)
p′ = 100 kPa p′ = 100 kPa
0 5 10 15 20 25 300
0.25
0.50
0.75
1.00
1.25
1.50
Axial strain, εa (%)
Stressratio,η=q/p′
0 5 10 15 20 25 30
−3
−2
−1
0
1
Axial strain, εa (%)
Volumetricstrain,ε v:%
Recommended configuration
No improvements
Strain softening
c) d)
p′ = 150 kPa p′ = 150 kPa
0 5 10 15 20 25 30 350
0.25
0.50
0.75
1.00
1.25
1.50
Axial strain, εa (%)
Stressratio,η=q/p′
0 5 10 15 20 25 30 350
1
2
3
4
5
6
7
Axial strain, εa (%)
Volumetricstrain,ε v:%
Using embedded top-cap
No embedded top-cap
Strain softening
e) f)
p′ = 400 kPa
p′ = 400 kPa
0 5 10 15 20 25 300
0.25
0.50
0.75
1.00
1.25
1.50
Axial strain, εa (%)
Stressratio,η=q/p′
0 5 10 15 20 25 30
−3
−2
−1
0
1
Axial strain, εa (%)
Volumetricstrain,ε v:%
Recommended configuration
No improvements
Strain softening?
g) h)
p′ = 400 kPa
p′ = 400 kPa
Figure 16. Cont.
Geotechnics 2021, 1 118
0 5 10 15 20 25 30 350
0.25
0.50
0.75
1.00
1.25
1.50
Axial strain, εa (%)
Stressratio,η=q/p′
0 5 10 15 20 25 30 35
−2
−1
0
1
2
3
4
5
Axial strain, εa (%)
Volumetricstrain,ε v:%
Recommended configuration
No improvements
Strain softening?
i) j)
p′ = 500 kPa
p′ = 500 kPa
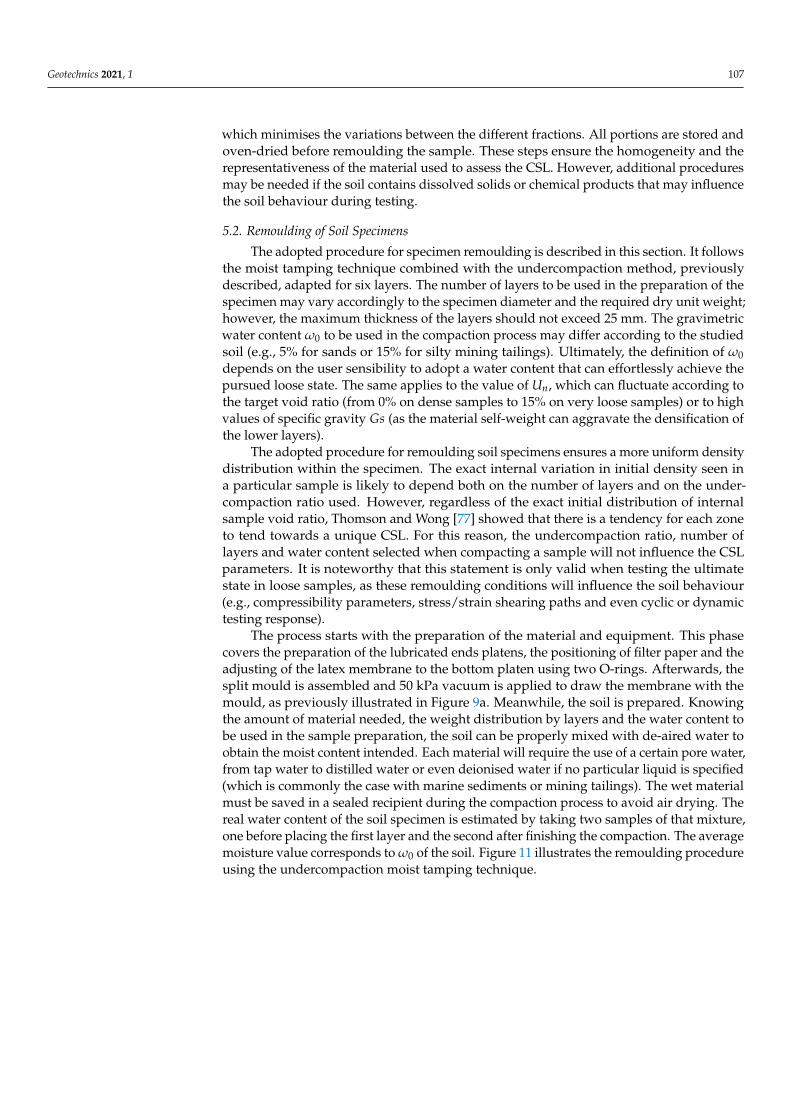
Figure 16. Comparisons of normalised behaviour: (a,b) stress ratio and volumetric strain of pairedtests of gold tailing for p′ = 100 kPa; (c,d) stress ratio and volumetric strain of paired tests of TP-Lisbon sand for p′ = 150 kPa; (e,f) stress ratio and volumetric strain of paired tests of gold tailing forp′ = 400 kPa; (g,h) stress ratio and volumetric strain of paired tests of Coimbra sand for p′ = 400 kPa;(i,j) stress ratio and volumetric strain of paired tests of Hostun sand for p′ = 500 kPa.
Figure 16 indicates that the strain-softening increased for higher values of meaneffective stress. Moreover, the comparisons of normalised behaviour in Figure 16 presentstrain softening in the tests carried out without the embedded top-cap loading pistonof gold tailing, which is conceptually inconsistent for soils with contractile behaviour.Likewise, comparisons showed the stabilisation of stress ratio after 25% axial strain. Thistendency was observed even for the soils with dilative behaviour, indicating that the soilspecimen did not develop strain softening after the maximum dilatancy. On the otherhand, the analysis of the tests revealed that the use of the embedded top-cap loadingpiston increases the volumetric strains in soil specimens with contractile behaviour (seeFigure 16b,f) and reduces the volumetric strains in soil specimens with dilative behaviour(see Figure 16d,h,j). This behaviour is conceptually coherent due to the reduction of shearbands—induced by the specimen ‘tilting’ during triaxial shearing. Experimental evidencedemonstrated that the unbiased procedure of this paper provides results conceptually moreconsistent, due to the fact that both strain softening and the stabilisation of the volumechange effects can induce relevant errors for defining the CSL.
From the paired results of Figure 16, the following main advantages of implementingthe embedded top-cap loading piston in triaxial apparatuses can be observed: (i) reductionof strain-softening and (ii) the stabilisation of the volume change. The reduction of thestrain-softening is related to the minimisation of eccentric loads, which can occur when thecoaxial position between the soil specimen and triaxial cell disappears. In addition, such aminimisation reduces the generation of shear bands to a minimum level. This reductionleads to the stabilisation of the volume change since shear bands concentrate the volumetricstrains in specific zones of the soil specimen during triaxial shearing [14,40,69]. Therefore,the use of an embedded top-cap loading piston in the triaxial apparatus is essential asit minimises progressive eccentric loading, conceptually assuring a more uniform soilcondition during loading, as it should always be.
On the other hand, the undrained triaxial tests were conducted on soil specimens onthe gold tailing. These specimens were isotropically consolidated under 20, 50 and 200 kPa.All samples showed a B-value > 0.98, which guaranteed the full saturation conditionsof the soil. Such conditions were achieved with a backpressure of 300 kPa. Moreover,all samples had the same state parameter (deduced from the CSL presented below inSection 6.4) at the beginning of triaxial shearing. Figure 17 presents the results of threeundrained tests carried out with the recommended procedures herein.

Geotechnics 2021, 1 119
0 50 100 150 200 2500
50
100
150
Mean effective stress, p′ (kPa)
Dev
iato
ric
stre
ss,q
(kP
a)
Test path
Instability pointCSL
ηL
Figure 17. Behavioural consistency of undrained tests.
From Figure 17, it can be observed that all soil specimens triggered flow liquefaction.This behaviour is consistent because all tests were carried out for soils in the contractiveside of the CSL. Furthermore, it was recognised that the instability points align to the sameηL, as expected for soil specimens tested with the same state parameter. On the other hand,after the triggering of liquefaction, the stress-path converged to the same frictional statedefined by the CSL. The consistency of the ultimate frictional state is a consequence of thefriction reduction provided by the lubricated end platens during triaxial shearing. Theresults of the undrained tests of Figure 17 validated the behavioural consistency of theunbiased procedures of this paper.
6.4. Comparisons of CSL Results against Other Procedures
A comparison using the data reported within the scope of a ‘round robin’ programmeto assess the CSL of a sandy silt gold tailing [48] was used to compare and validatethe testing procedure proposed herein. Test results obtained from the different triaxialapparatus configurations were considered, namely the use or not of lubricated end platensand the embedded top-cap loading ram connection. In all considered tests, the EOTSFwas applied because this method increases the reliability of void ratio measurementsafter testing [5,7,48]. Moreover, three aspects of the test results were compared: (i) thestrain softening and stabilisation of volumetric strain, (ii) the stress path under undrainedconditions and (iii) test path (TP) and state parameter of the inferred CSL using the methodproposed herein. Compiled results are from both academic and commercial laboratories,including the University of Porto (UPorto), the University of Western Australia (UWA),Golder–Perth (P) and Vancouver (V), BGC Engineering Inc. (BGC) and Klohn KrippenBerger (KCB). Table 2 summarises the conditions of the selected tests.
In this study, the CSL of the sandy silt gold tailing was inferred from the drainedtriaxial tests results of UPorto by applying the unbiased procedure of this paper. Theequation adopted to define the CSL in the e : log p′ space is the following:
ecs = 0.829− 0.046 ln(p′) (7)
Such an equation was obtained by the latest squares regression method under acorrelation coefficient, R2 = 0.999.
To examine the differences between test procedures, test-paths (TP) that started fromthe same mean effective stress of the tests used for inferring the CSL were paired. Figure 14presents a comparison between the TP of the procedure proposed herein tested against thecorresponding TP of other testing methods. From Figure 18, it can be observed that the TPsof the proposed method have the same shape, demonstrating the representativeness of thesoil specimens and consistency of the preparation and reconstitution method. However,
Geotechnics 2021, 1 120
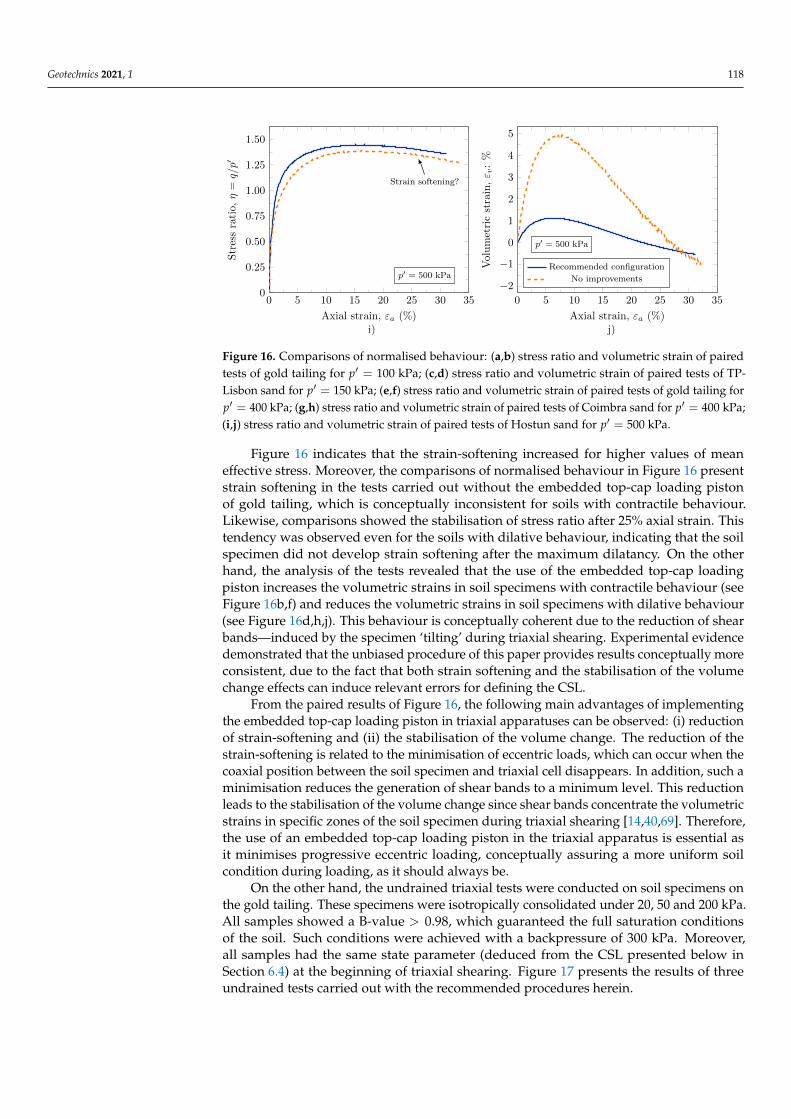
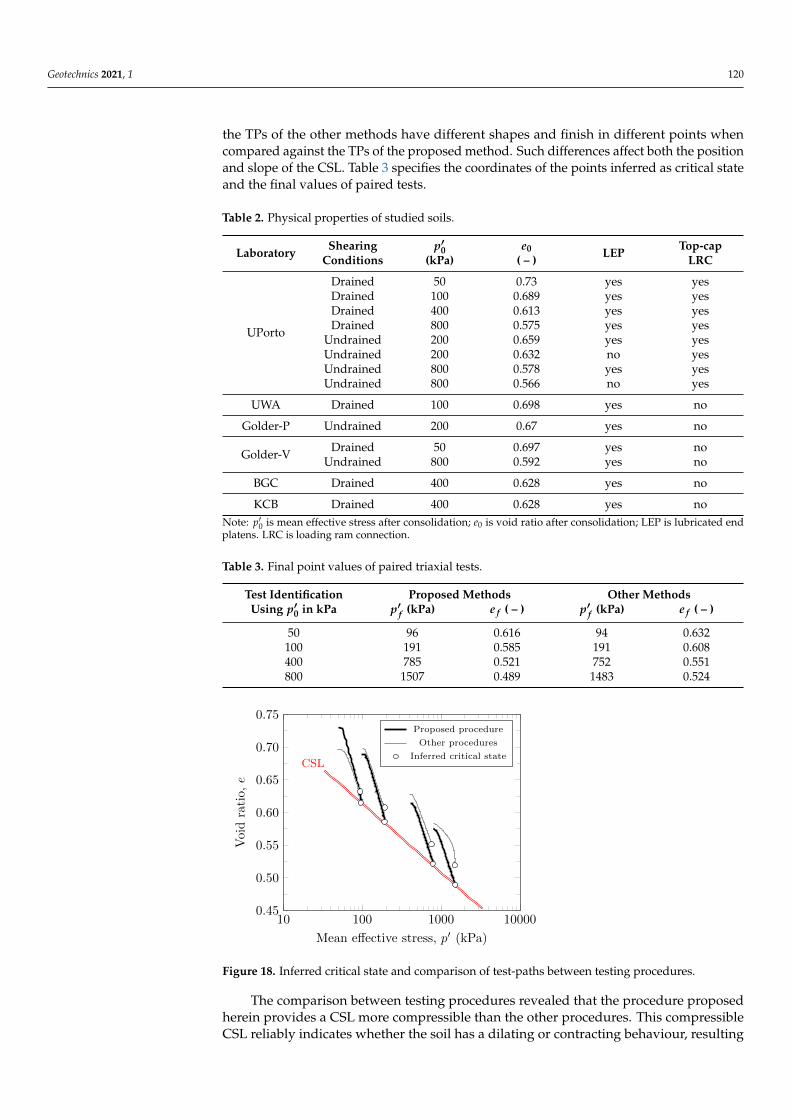
the TPs of the other methods have different shapes and finish in different points whencompared against the TPs of the proposed method. Such differences affect both the positionand slope of the CSL. Table 3 specifies the coordinates of the points inferred as critical stateand the final values of paired tests.
Table 2. Physical properties of studied soils.
Laboratory Shearing p′0 e0 LEP Top-cap
Conditions (kPa) ( – ) LRC
UPorto
Drained 50 0.73 yes yesDrained 100 0.689 yes yesDrained 400 0.613 yes yesDrained 800 0.575 yes yes
Undrained 200 0.659 yes yesUndrained 200 0.632 no yesUndrained 800 0.578 yes yesUndrained 800 0.566 no yes
UWA Drained 100 0.698 yes no
Golder-P Undrained 200 0.67 yes no
Golder-V Drained 50 0.697 yes noUndrained 800 0.592 yes no
BGC Drained 400 0.628 yes no
KCB Drained 400 0.628 yes noNote: p′0 is mean effective stress after consolidation; e0 is void ratio after consolidation; LEP is lubricated endplatens. LRC is loading ram connection.
Table 3. Final point values of paired triaxial tests.
Test Identification Proposed Methods Other MethodsUsing p′
0 in kPa p′f (kPa) e f ( – ) p′
f (kPa) e f ( – )
50 96 0.616 94 0.632100 191 0.585 191 0.608400 785 0.521 752 0.551800 1507 0.489 1483 0.524
10 100 1000 100000.45
0.50
0.55
0.60
0.65
0.70
0.75
Mean effective stress, p′ (kPa)
Voi
dra
tio,
e
Proposed procedure
Other procedures
Inferred critical stateCSL
Figure 18. Inferred critical state and comparison of test-paths between testing procedures.
The comparison between testing procedures revealed that the procedure proposedherein provides a CSL more compressible than the other procedures. This compressibleCSL reliably indicates whether the soil has a dilating or contracting behaviour, resulting

Geotechnics 2021, 1 121
in safer designs and analyses of geotechnical structures than the other testing procedures.The compressibility of CSL is validated by comparing the paired tests referred to in Table 3,which indicate that the differences between final values increase with the confining pressure.Figure 19 presents direct comparisons between all triaxial equipment improvements interms of undrained behaviour. These comparisons considered the undrained tests referredin Table 2, which were carried out under the same approximate conditions (i.e., similar p′0and e0). The potential differences were interpreted using the CSL in the p′ : q space, withM = 1.409 inferred from the same tests of Figure 17, and assuming an instability line (withthe stress ratio thereby represented, ηL) estimated by the maximum deviatoric stresses orpeak value points of the tests carried out by applying the unbiased procedure of this paper.
0 50 100 150 2000
25
50
75
100
125
150
Mean effective stress, p′ (kPa)
Dev
iato
ric
stre
ss,q
(kP
a)
0 200 400 600 8000
100
200
300
400
500
Mean effective stress, p′ (kPa)
Dev
iato
ric
stre
ss,q
(kP
a)
Proposed procedure
Only embedded top-cap
Only lubrified end patterns
Instability point
CSL
ηL
CSLηL
a) b)
Figure 19. Comparisons of undrained behaviour obtained using different triaxial configurations:(a) p′0 = 200 kPa; (b) p′0 = 800 kPa.
The comparisons between procedures revealed different stress-paths, which lead todifferent coordinates of the instability points. The instability points of the tests conductedwith only the embedded top-cap ram connection are closer to the CSL, validating thereduction of the strain-softening during the shear phase. In addition, the stress-path of teststhat involved the lubricated end platens converged to the CSL after reaching the instabilitypoint. Tests performed with only the lubricated end platens have instability points withthe lowest value of peak deviatoric stress (see Figure 19a), indicating a lower undrainedstrength and brittleness. On the other hand, it can be observed in Figure 19a that the resultsof non-lubricated end platens presented a higher friction than the results of lubricatedend platens after liquefaction. Tests conducted in the triaxial cells with lubricated endplatens follow a stable frictional state controlled by the movement of the soil particles. Thedifferences in the stress paths of the tests carried out without lubricated end platens aredue to the friction generated by the porous stones, which induced higher stresses at theend restraints during soil shearing.
7. Summary and Concluding Remarks
This paper described and detailed unbiased procedures to assess the critical statelocus of soils from triaxial testing. The combination of lubricated end platens, an em-bedded top-cap loading ram connection and the end-of-test soil freezing together withthe full saturation conditions of soil specimens in triaxial testing provides a reliable char-acterisation of the CSL. The triaxial results of different cohesionless soils (with distinctorigins and morphologies) and comparisons against other testing procedures led to thefollowing conclusions:
• A contrast between experimental data and the wave propagation theory [92,93] in-dicated that the full saturation condition is achieved when B-value > 0.97. Hence,measurements of B-value higher than 0.97 provide a reliable characterisation of theCSL and undrained behaviour in cohesionless soils.

Geotechnics 2021, 1 122
• The use of an embedded top-cap loading ram novel connection reduces the ‘tilting’of the soil specimen during all phases of triaxial testing, ensuring a perpendicularalignment between the loading ram with the axis of the soil specimen that leads to con-ceptually consistent soil behaviour. Such consistent soil behaviour was experimentallyvalidated by triaxial tests carried out in four cohesionless soils. Furthermore, the soilresponse is caused by a reduction of strain-softening and the stabilisation of the vol-ume change during triaxial loading, even for soil specimens with dilative behaviour.
• The combination of oversized lubricated end platens and an embedded top-cap load-ing ram connection in the triaxial apparatus results in a uniform shearing withoutthe generation of spurious shear bands, allowing for a reduction of strain softeningand the stabilisation of volumetric strain, which are determinant factors for the iden-tification of the CSL. However, the use of oversized lubricated end patterns is morerelevant during undrained shearing at low effective confinement stresses, whereasthe use of an embedded top-cap loading ram connection causes a more conceptuallyconsistent soil behaviour at the large strain range.
• The comparisons between triaxial configurations showed that the unbiased proceduresproposed herein have very low variability and have a notable reproducibility. Inaddition, they provide reliable results that often are non-conservative in comparisonto those obtained by means of other procedures. Hence, it is desirable that the unbiasedprocedures be implemented in geotechnical laboratories in which the characterisationof soils within the CSSM framework is conducted.
Author Contributions: Conceptualisation, A.V.d.F., D.C. and F.M.-G.; data curation, A.V.d.F.; formalanalysis, A.V.d.F., D.C. and F.M.-G.; funding acquisition, A.V.d.F.; investigation, A.V.d.F., D.C. andF.M.-G.; methodology, A.V.d.F., D.C. and F.M.-G.; resources, A.V.d.F.; supervision, A.V.d.F.; validation,A.V.d.F.; visualisation, D.C. and F.M.-G.; writing—original draft preparation, D.C.; writing—reviewand editing, A.V.d.F. and F.M.-G. All authors have read and agreed to the published version ofthe manuscript.
Funding: This work in FEUP was funded by: Base Funding—UIDB/04708/2020 of the CONSTRUCT—Institute of R&D in Structures and Construction funded by national funds through the FCT/MCTES(PIDDAC). The third author acknowledges the financially support of FCT through the grant SFRH/BD/146265/2019.
Acknowledgments: Acknowledgements are due to Ricardo Bahia—Director of Golder AssociatesPortugal—for the fruitful collaboration that led to these novel procedures. Acknowledgements areespecially due to David Reid from the UWA for providing the supplemental data with the test resultsof the ‘round robin’ programme of the silt sandy gold tailing. The authors also acknowledge PauloCoelho from the University of Coimbra for offering the data of the ‘round robin’ programme ofCoimbra sand and Ricardo Azeitero for offering their experimental results of Hostun sand. Theauthors also acknowledge the technical support given by Daniela Coelho and Armando Pintoof LabGeo.
Conflicts of Interest: The authors declare no conflict of interest.
NomenclatureThe following notation is used in this manuscript:A, B, C constants of the CSL power-law modelAc corrected area of the sampleA0 initial cross-section area of the sampleB pore pressure coefficientD0 initial diameter of the specimene void ratioe0 initial void ratioecs void ratio at critical stateEm elastic modulus for the membraneGs specific gravity of the soilH height

Geotechnics 2021, 1 123
M slope of critical state in p′ : q spacen selected layernt total number of layersn porosityp′ mean effective stressq deviatoric stressSr degree of saturationT0 initial thickness of the membranet50 time factor corresponding to 50% consolidationt50 time factor corresponding to 90% consolidationu pore pressureUn percent undercompactionUni percent undercompaction selected for the first bottom layerUnt percent undercompaction for the final top layerVp P-wave velocityVT total volume of the specimenWni moist weight of material required at each layerWT total wet weight of material required for sample preparationγd dry unit weightΓ intercept of critical state in e : log p´ space∆u increment in the pore pressure∆V volume change∆CP increment in the cell pressureεa axial strainεv volumetric strainηL instability lineλ slope of critical state in e : log p´ spaceσa axial stressσa radial stressΦ diameterω gravimetric water contentω0 initial gravimetric water content
AbbreviationsThe following abbreviations are used in this manuscript:ASTM American Society for Testing and MaterialsCO2 carbon dioxideCSL critical state locusCSSM critical state soil mechanicsDP dry pluviationEOTSF end-of-test soil freezingGSD grain size distributionGWC gravimetric water contentLEP lubricated end platensLRC loading ram connectionLVDT linear variable differential transformerMT moist tampingNCL normal consolidation lineSD slurry depositionTP test pathWS water sedimentation

Geotechnics 2021, 1 124
References1. Roscoe, K.H.; Schofield, A.N.; Thurairajah, A. Yielding of Clays in States Wetter than Critical. Géotechnique 1963, 13, 211–240.
[CrossRef]2. Jefferies, M. Nor-Sand: A simple critical state model for sand. Géotechnique 1993, 43, 91–103. [CrossRef]3. Bedin, J.; Schnaid, F.; Viana da Fonseca, A.; Costa Filho, L.D.M. Gold tailings liquefaction under critical state soil mechanics.
Géotechnique 2012, 62, 673–682. [CrossRef]4. Andrade, J.E. A predictive framework for liquefaction instability. Géotechnique 2012, 59, 673–682. [CrossRef]5. Soares, M.; Viana da Fonseca, A. Factors Affecting Steady State Locus in Triaxial Tests. Geotech. Test. J. 2016, 36, 20150228.
[CrossRef]6. Giretti, D.; Fioravante, V.; Been, K.; Dickenson, S. Mechanical properties of a carbonate sand from a dredged hydraulic fill.
Géotechnique 2018, 68, 410–420. [CrossRef]7. Jefferies, M.; Been, K. Soil Liquefaction: A Critical State Approach, 2nd ed.; Taylor & Francis; CRC Press: London, UK, 20158. Been, K.; Jefferies, M. Stress-dilatancy in very loose sand. Can. Geotech. J. 2004, 41, 972–989. [CrossRef]9. Torres-Cruz, L.A.; Santamarina, J.C. The critical state line of non-plastic tailings. Can. Geotech. J. 2020, 57, 1508–1517. [CrossRef]10. Carrera, A.; Coop, M.; Lancellota, R. Influence of grading on the mechanical behaviour of Stava tailings. Géotechnique 2011, 61, 935–946.
[CrossRef]11. Reid, D.; Fanni, R.; Koh, K.; Orea, I. Characterisation of a subaqueously deposited silt iron ore tailings. Geotech. Lett. 2018, 8, 278–283.
[CrossRef]12. Jamiolkowski, M. Soil mechanics and the observational method: Challenges at the Zelazny Most copper tailings disposal facility.
Géotechnique 2014, 64, 590–618. [CrossRef]13. Rowe, P.W.; Barden, L. Importance of Free Ends in Triaxial Testing. J. Soil Mech. Found. Div. 1964, 90, 1–25. [CrossRef]14. Baldi, G.; Hight, D.; Thomas, G. A Reevaluation of Conventional Triaxial Test Methods. In Advanced Triaxial Testing of Soils and
Rocks; Donaghe, R., Chaney, R., Silver M., Eds.; ASTM International: West Conshohocken, PA, USA, 1988; pp. 219–263.15. Germaine, J.; Ladd, C. Triaxial Testing of Saturated Cohesive Soils. In Advanced Triaxial Testing of Soils and Rocks; Donaghe, R.,
Chaney, R., Silver M., Eds.; ASTM International: West Conshohocken, PA, USA, 1988; pp. 421–45916. Koseki, J. Several challenges in advanced laboratory testing of geomaterials with emphasis on unconventional types of liquefaction
tests. Geomech. Energy Environ. 2021, 27, 100157. [CrossRef]17. Uchida, S.; Levenberg, E.; Klar, A. On-specimen strain measurement with fiber optic distributed sensing. Measurement 2015, 60,
104–113. [CrossRef]18. Viana da Fonseca, A.; Ferreira, C.; Soares, M.; Klar, A. Improved laboratory techniques for advanced geotechnical characterization
towards matching in situ properties. In Six International Symposium on Deformation Characteristics of Geomaterials; Rinaldi, V.A.,Zeballos, M.E., Clariá, J.J., Eds.; IOS Press: Buenos Aires, Argentina, 2015.
19. Sutton, M.; Orteu, M.A.; Schreier, H. image Correlation for Shape, Motion and Deformation Measurements—Basic Concepts,Theory and Applications, 1st ed.; Springer: Berlin/Heidelberg, Germany, 2009.
20. Dijkstra, J.; Broere, W. Combined full field stress and strain measurement methods for granular materials. EPJ Web Conf. 2010, 6, 22020.[CrossRef]
21. Desrues, J.; Chambon, R.; Mokni, M.; Mazerolle, F. Void ratio evolution inside shear bands in triaxial sand specimens studied bycomputed tomography. Géotechnique 1996, 46, 529–546. [CrossRef]
22. Oda, M.; Takemura, T.; Takahashi, M. Microstructure in shear band observed by microfocus X-ray computed tomography.Géotechnique 2004, 54, 539–542. [CrossRef]
23. Sladen, J.A.; Handford, G. A potential systematic error in laboratory testing of very loose sands. Can. Geotech. J. 1987, 24, 462–466.[CrossRef]
24. Ghafghazi, M.; Shuttle, D.; DeJong, J.T. Particle breakage and the critical state of sand. Soils Found. 2014, 54, 451–461. [CrossRef]25. Cho, G.-C.; Dodds, J.; Santamarina, J.C. Particle Shape Effects on Packing Density, Stiffness, and Strength: Natural and Crushed
Sands. J. Geotech. Geoenviron. Eng. 2006, 132, 591–602. [CrossRef]26. Luzzani, L.; Coop, M.R. On the relationship between particle breakage and the critical state of sands. Soils Found. 2002, 42, 71–82.
[CrossRef]27. Bandini, V.; Coop, M.R. The influence of particle breakage on the location of the critical state line of sands. Soils Found. 2002, 51, 591–600.
[CrossRef]28. Yu, F.W. Particle breakage and the critical state of sands. Géotechnique 2017, 67, 713–719. [CrossRef]29. Ferreira, P. M.V.; Bica, A.V.D. Problems in identifying the effects of structure and critical state in a soil with a transitional behaviour.
Géotechnique 2006, 56, 445–454. [CrossRef]30. Altuhafi, F.; Baudet, B.A.; Sammonds, P. The mechanics of subglacial sediment: An example of new “transitional” behaviour. Can.
Geotech. J. 2010, 56, 775–790. [CrossRef]31. Xu, L.; Coop, M.R. The mechanics of a saturated silty loess with a transitional mode. Géotechnique 2017, 67, 581–596. [CrossRef]32. Nocilla, A.; Coop, M.R.; Colleselli, F. The mechanics of an Italian silt: An example of “transitional” behaviour. Géotechnique 2006,
67, 261–271. [CrossRef]33. Rios, S.; Ciantia, M.; Gonzalez, N.; Arroyo, M.; Viana da Fonseca, A. Simplifying calibration of bonded elasto-plastic models.
Comput. Geotech. 2016, 67, 100–108. [CrossRef]

Geotechnics 2021, 1 125
34. Lade, P. V.; Trads, N. The role of cementation in the behaviour of cemented soils. Geotech. Res. 2014, 67, 111–132. [CrossRef]35. Ponzoni, E.; Nocilla, A.; Coop, M.R.; Colleselli, F. Identification and quantification of transitional modes of behaviour in sediments
of Venice lagoon. Géotechnique 2014, 67, 694–708. [CrossRef]36. Verdugo, R.; Ishihara, K. The Steady State of Sandy Soils. Soils Found. 1996, 36, 81–91. [CrossRef]37. Li, X.S.; Wang, Y. Linear Representation of Steady-State Line for Sand. J. Geotech. Geoenviron. Eng. 1998, 124, 1215–1217. [CrossRef]38. Schnaid, F.; Bedin, J.; Viana da Fonseca, A.; de Moura Costa Filho, L. Stiffness and Strength Governing the Static Liquefaction of
Tailings. J. Geotech. Geoenviron. Eng. 2013, 139, 2136–2144. [CrossRef]39. Altuhafi, F.N.; Coop, M.R.; Georgiannou, V.N. Effect of Particle Shape on the Mechanical Behavior of Natural Sands. J. Geotech.
Geoenviron. Eng. 2016, 142, 04016071. [CrossRef]40. Klotz, E.U.; Coop, M.R. On the identification of critical state lines for sands. Geotech. Test. J. 2002, 25, 289–302.41. Sladen, J.A.; D’Hollander, R.D.; Krahn, J. The liquefaction of sands, a collapse surface approach. Can. Geotech. J. 1985, 22, 564–578.
[CrossRef]42. Yamamuro, J.A.; Lade, P.V. Steady-State Concepts and Static Liquefaction of Silty Sands. J. Geotech. Geoenviron. Eng. 1998, 124, 868–877.
[CrossRef]43. Goto, S.; Tatsuoka, F. Effects of End Conditions on IHaxial Compressive Strength for Cohesionless Soils. In Advanced Triaxial
Testing of Soils and Rocks; Donaghe, R., Chaney, R., Silver M., Eds.; ASTM International: West Conshohocken, PA, USA, 1988;pp. 692–705.
44. Lade, P.V. Triaxial Testing of Soils, 1st ed.; John Wiley & Sons, Ltd.: Chichester, UK, 2016.45. Lam, W.-K.; Tatsuoka, T. Triaxial Compressive and Extension Strength of Sand Affected by Strength Anisotropy and Sample
Slenderness. In Advanced Triaxial Testing of Soils and Rocks; Donaghe, R., Chaney, R., Silver M., Eds.; ASTM International: WestConshohocken, PA, USA, 1988; pp. 655–666.
46. Kolymbas, D.; Wu, W. Recent results of triaxial tests with granular materials. Powder Technol. 1990, 60, 99–119. [CrossRef]47. Ueng, T.-S.; Tzou, Y.-M.; Lee, C.-J. The Effect of End Restraint on Volume Change and Partide Breakage of Sands in THaxial Tests.
In Advanced Triaxial Testing of Soils and Rocks; Donaghe, R., Chaney, R., Silver M., Eds.; ASTM International: West Conshohocken,PA, USA, 1988; pp. 679–691.
48. Reid, D.; Fourie, A.; Ayala, J.L.; Dickinson, S.; Ochoa-Cornejo, F.; Fanni, R.; Garfias, J.; Viana da Fonseca, A.; Ghafghazi, M.; et al.Results of a critical state line testing round robin programme. Géotechnique 2021, 71, 616–630. [CrossRef]
49. Hettler, A.; Vardoulakis, I. Behaviour of dry sand tested in a large triaxial apparatus. Géotechnique 1984, 34, 183–630. [CrossRef]50. Viana da Fonseca, A. Load Tests on Residual Soil and Settlement Prediction on Shallow Foundation. J. Geotech. Geoenviron. Eng.
2001, 124, 868–877.51. Viana da Fonseca, A., Pineda, J. Getting high-quality samples in ‘sensitive’ soils for advanced laboratory tests. Innov. Infrastruct.
Solut. 2017, 2, 34. [CrossRef]52. Viana da Fonseca, A.; Ferreira, C.; Ramos, C.; Molina-Gómez, F. The geotechnical test site in the greater Lisbon area for liquefaction
characterisation and sample quality control of cohesionless soils. AIMS Geosci. 2019, 5, 325–343. [CrossRef]53. Molina-Gómez, F.; Ferreira, C.; Ramos, C.; Viana da Fonseca, A. Performance of Gel-Push sampling in liquefiable soils. Geotech.
Lett. 2020, 10, 256–261. [CrossRef]54. Been, K.; Jefferies, M.G.; Hachey, J. Discussion: The critical state of sands. Géotechnique 1992, 42, 655–663. [CrossRef]55. Vaid, Y.P.; Sivathayalan, S.; Stedman, D. Influence of Specimen-Reconstituting Method on the Undrained Response of Sand.
Geotech. Test. J. 1999, 22, 187–195.56. Chang, N.; Heymann, G.; Clayton, C. The effect of fabric on the behaviour of gold tailings. Géotechnique 2011, 61, 187–197.
[CrossRef]57. Reid, D.; Fanni, R. A comparison of intact and reconstituted samples of a silt tailings. Géotechnique 2020, in press. [CrossRef]58. Yamashita, S.; Kawaguchi, T.; Nakata, Y.; Mikamt, T.; Fujiwara, T.; Shibuya, S. Interpretation of international parallel test on the
measurement of Gmax using bender elements. Soils Found. 2009, 49, 631–650. [CrossRef]59. Miranda, L.; Caldeira, L.; Serra, J.; Gomes, R.C. Dynamic behaviour of Tagus River sand including liquefaction. Bull. Earthq. Eng.
2020, 18, 4581–4604. [CrossRef]60. Molina-Gómez, F.; Viana da Fonseca, A.; Ferreira, C.; Camacho-Tauta, J. Dynamic properties of two historically liquefiable sands
in the Lisbon area. Soil Dyn. Earthq. Eng. 2020, 132, 106101. [CrossRef]61. Yamamuro, J.A.; Wood, F.M. Effect of depositional method on the undrained behavior and microstructure of sand with silt. Soil
Dyn. Earthq. Eng. 2004, 24, 751–760. [CrossRef]62. Ladd, R.S. Specimen preparation and cyclic stability of sands. J. Geotech. Geoenviron. Eng. 1977, 103, 535–547.63. Clayton, C.R.I. Stiffness at small strain: Research and practice. Géotechnique 2011, 61, 5–37. [CrossRef]64. Been, K.; Jefferies, M.G.; Hachey, J. The critical state of sands. Géotechnique 1991, 41, 365–381. [CrossRef]65. Ishihara, K. Liquefaction and flow failure during earthquakes. Géotechnique 1993, 43, 351–451. [CrossRef]66. Shipton, B.; Coop, M.R. On the compression behaviour of reconstituted soils. Soils Found. 2012, 52, 668–681. [CrossRef]67. Li, W.; Coop, M.R.; Senetakis, K.; Schnaid, F. The mechanics of a silt-sized gold tailing. Eng. Geol. 2018, 241, 97–108. [CrossRef]68. Papadimitriou, A.G.; Dafalias, Y.F.; Yoshimine, M. Plasticity modeling of the effect of sample preparation method on sand
response. Soils Found. 2005, 45, 109–123. [CrossRef]69. Lade, P.V.; Yamamuro, J.A.; Skyers, B.D. Effects of shear band formation in triaxial extension tests. Geotech. Test. J. 1999, 19, 398–410.

Geotechnics 2021, 1 126
70. Wang, Q.; Lade, P.V. Shear Banding in True Triaxial Tests and Its Effect on Failure in Sand. J. Eng. Mech. 2001, 127, 754–761.[CrossRef]
71. Wichtmann, T.; Triantafyllidis, T. An experimental database for the development, calibration and verification of constitutivemodels for sand with focus to cyclic loading: Part I—tests with monotonic loading and stress cycles. Acta Geotech. 2016, 11,739–761. [CrossRef]
72. Ladd, R. Preparing Test Specimens Using Undercompaction. Geotech. Test. J. 1978, 1, 16–23.73. Reid, D.; Fourie, A.; Moggach, S. Characterization of a gold tailings with hypersaline pore fluid. Can. Geotech. J. 2020, 57, 482–496.
[CrossRef]74. D4767—Standard Test Method for Consolidated Undrained Triaxial Compression Test for Cohesive Soils; ASTM International: West
Conshohocken, PA, USA, 2020.75. D7181—Standard Test Method for Consolidated Undrained Triaxial Compression Test for Soils; ASTM International: West Conshohocken,
PA, USA, 2020.76. C702—Standard Practice for Reducing Samples of Aggregate to Testing Size; ASTM International: West Conshohocken, PA, USA, 2018.77. Thomson, P.R.; Wong, R.C.K. Specimen nonuniformities in water-pluviated and moist-tamped sands under undrained triaxial
compression and extension. Can. Geotech. J. 2008, 45, 939–956. [CrossRef]78. Frost, J.D.; Park, J.Y. A critical assessment of the moist tamping technique. Geotech. Test. J. 2003, 26, 57–70.79. Ampadu, S.K.; Tatsuoka, F. Effect of setting method on the behaviour of clays in triaxial compression from saturation to undrained
shear. Soils Found. 1993, 33, 14–34. [CrossRef]80. Skempton, A.W. The Pore-Pressure Coefficients A and B. Géotechnique 1954, 4, 143–147. [CrossRef]81. Leong, E.C.; Cheng, Z.Y. Effects of Confining Pressure and Degree of Saturation on Wave Velocities of Soils Int. J. Geomech. 2016,
16, D4016013.82. Kokusho, T. Correlation of pore-pressure B-value with P-wave velocity and Poisson’s ratio for imperfectly saturated sand or
gravel. Soils Found. 2000, 40, 95–102. [CrossRef]83. Kumar, J.; Madhusudhan, B.N. Dynamic properties of sand from dry to fully saturated states. Géotechnique 2012, 62, 45–54.
[CrossRef]84. Viana da Fonseca, A.; Ferreira, C.; Fahey, M. A Framework Interpreting Bender Element Tests, Combining Time-Domain and
Frequency-Domain Methods. Geotech. Test. J. 2009, 32, 100974.85. Ferreira, C.; Díaz-Durán, F.; Viana da Fonseca, A.; Cascante, G. New approach to concurrent Vs and Vp measurements using
bender elements. Geotech. Test. J. 2021, accepted.86. Santamarina, J.C.; Klein, K.A.; Fam, M.A. Soils and Waves, 1st ed.; ohn Wiley & Sons, Ltd.: Chichester, UK, 2001.87. Yang, J. Liquefaction resistance of sand in relation to P-wave velocity. Géotechnique 2002, 52, 295–298. [CrossRef]88. Yoshimi, Y.; Tanaka, K., Tokimatsu, K. Liquefaction resistance of a partially saturated sand. Soils Found. 1989, 52, 295–298.
[CrossRef]89. Tsukamoto, Y.; Ishihara, K.; Nakazawa, H.; Kamada, K.; Huang, Y. Resistance of partly saturated sand to liquefaction with
reference to longitudinal and shear wave velocities. Soils Found. 2002, 42, 93–104. [CrossRef]90. Tamura, S.; Tokimatsu, K.; Abe, A.; Sato, M. Effects of air bubbles on B-value and P-wave velocity of a partly saturated sand. Soils
Found. 2002, 42, 121–129. [CrossRef]91. Emerson, M.; Foray, P. Laboratory P-wave measurements in dry and saturated sand. Acta Geotech. 2006, 1, 167–177. [CrossRef]92. Biot, M.A. Theory of Propagation of Elastic Waves in a Fluid-Saturated Porous Solid I. Low-Frequency Range. J. Acoust. Soc. Am.
1956, 28, 168–178. [CrossRef]93. Biot, M.A. Theory of Propagation of Elastic Waves in a Fluid-Saturated Porous Solid II. Higher Frequency Range. J. Acoust. Soc.
Am. 1956, 28, 179–191. [CrossRef]94. Molina-Gómez, F.; Viana da Fonseca, A. Key geomechanical properties of the historically liquefiable TP-Lisbon sand. Soils Found.
2021, in press. [CrossRef]95. Head, K.H. Manual of Soil Laboratory Testing—Volume 2—Permeability, shear strength and compressibility tests, 3rd ed.; Pentech Press
Limited: London, UK, 2006.96. Nicholson, P.G.; Seed, R.B.; Anwar, H.A. Elimination of membrane compliance in undrained triaxial testing. I. Measurement and
evaluation. Can. Geotech. J. 1993, 30, 727–738. [CrossRef]97. Delgado, B.G.; Viana da Fonseca, A.; Fortunato, E.; Maia, P. Mechanical behavior of inert steel slag ballast for heavy haul rail
track: Laboratory evaluation. Transp. Geotech. 2019, 20, 100243. [CrossRef]98. Duncan, J.M.; Seed, H.B. Errors in Strenght Tests and Recommended Corrections; Institute of Transportation Studies, University of
California Berkeley: Berkley, CA, USA, 196599. Duncan, J.M.; Seed, H.B. Corrections for Strength Test Data J. Soil Mech. Found. Div. 1967, 93, 121–137. [CrossRef]100. Fourie, A.B.; Papageorgiou, G. Defining an appropriate steady state line for Merriespruit gold tailings. Can. Geotech. J. 2001, 38, 695–706.
[CrossRef]101. Santos, J.A.; Gomes, R.C.; Lourenço, J.C.; Marques, F.; Coelho, P.; Azeiteiro, R.; Santos, L.A.; Marques, V.; da Fonseca, A.V.; Soares,
M.; et al. Coimbra Sand—Round Robin tests to evaluate liquefaction resistance. In Proceedings of the 15th World Conference onEarthquake Engineering, Lisbon, Portugal, 24–28 September 2012.

Geotechnics 2021, 1 127
102. Azeiteiro, R.J.N.; Coelho, P.A.L.F.; Taborda, D.M.G.; Grazina, J.C.D. Critical State–Based Interpretation of the Monotonic Behaviorof Hostun Sand. J. Geotech. Geoenviron. Eng. 2017, 143, 04017004-1–04017004-14. [CrossRef]
Short Biography of AuthorsAntónio Viana da Fonseca PhD, Professor in Geotechnical Engineering in the Civil EngineeringDepartment at the University of Porto (FEUP), Director of the Geotechnical Laboratory. His expertisehas focus in advanced experimental soil mechanics and modelling of natural and artificial soils,including non-conventional materials, such as mine tailings. He is the Chairman of ISSMGE TC-102,“Ground Property Characterization by In-Situ Tests”, 2013–2021. He is a fellow and former Presidentof the College of Geotechnical Specialists of the Portuguese Institution of Engineers. He is a consultantand practitioner specialising in the areas of lab and in situ testing of soils, foundations and deepexcavations of soil structure interaction analyses and earthquake design of geotechnical structures,including soil liquefaction induced damages and mitigation. He is also an advisor for the riskassessment and safety improvement of more than 50 tailings dams in Brazil; among other researchprojects, he serves for the H2020 project LIQUEFACT, leading the WP: “Structural liquefactionresilience and vulnerability assessment methodologies”.
Diana Cordeiro, MSc, is a researcher in CONSTRUCT-GEO of the Faculdade de Engenharia daUniversidade do Porto (FEUP), Portugal. She received her master’s degree in Civil Engineering fromFEUP in 2018 with an emphasis in Geotechnics. Her experimental work on LabGEO (at FEUP) beganwith her master’s project on desaturation as an effective measure of liquefaction mitigation followedby a scholarship for the research project LIQ2PROEARTH, assessing liquefaction susceptibilitythroughout in situ and laboratory tests. Currently, her main research is focused on the geomechanicalbehaviour of tailing materials within the critical state framework by laboratory testing.
Fausto Molina-Gómez is a PhD researcher in CONSTRUCT-GEO of the Faculdade de Engenhariada Universidade do Porto (FEUP), Portugal. He received his BScEng in Civil Engineering in 2014from the Universidad Militar Nueva Granada (Colombia) and his MSc in Civil Engineering withan emphasis in Geotechnics in 2016 from the Universidad de los Andes (Colombia). His researchinterests and expertise are in geomechanics, geotechnical earthquake engineering (in particular,problems associated with liquefaction), soil testing, wave propagation, critical state soil mechanicsand statistical data interpretation.