recent trends in project controls · 1 about the recent trends in project controls survey report as...
TRANSCRIPT

Recent Trends in
Project Controls:
A Survey from LogiKal Projects
2016
1
About the Recent Trends in Project Controls Survey Report
As a consultancy dedicated to supporting clients with the successful delivery of projects
through the use of project controls, we have always held the belief that organisations
which operate to high standards in this area are more likely to be successful in their
project delivery. However, there is limited research evidence to back up this assertion
and we decided to conduct our own survey to solicit views from those working in projects.
Our objective was to seek to understand how effectively project control disciplines are
considered to be working and the extent to which their effectiveness appears to co-relate
with project success. A survey questionnaire was sent out to our contact groups and at
the time of publishing, we have received 334 responses. In publishing this data, we fully
recognise that the information is biased towards the sectors and geographical areas in
which we operate and does not necessarily represent a universally accurate picture.
Nevertheless, we believe that the consistency of findings enables us to be confident that
the findings are reliable.
It should also be recognised that this is a survey of opinion and not necessarily fact. Whilst
we would hope that there is a strong relationship between the two, there will inevitably
be some subjectivity in the responses. That said, we are confident that the response
group provides a clear collective view of many people currently or recently engaged in
the delivery of projects.
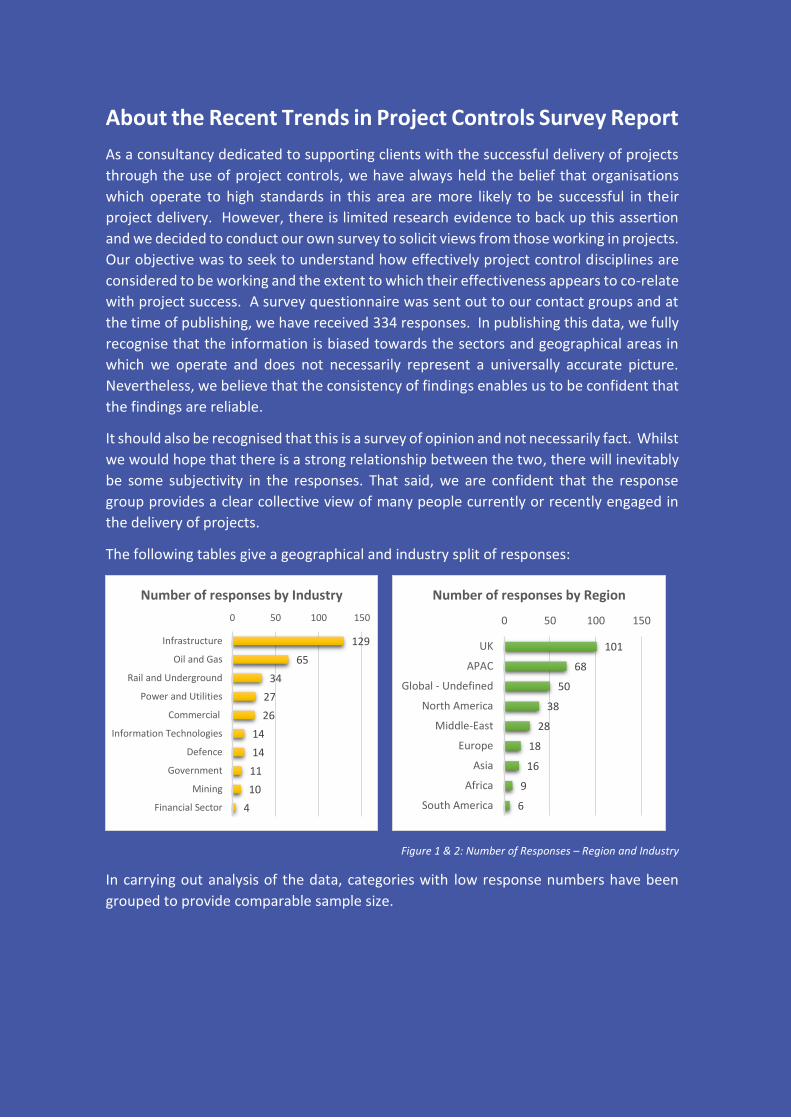
The following tables give a geographical and industry split of responses:
Figure 1 & 2: Number of Responses – Region and Industry
In carrying out analysis of the data, categories with low response numbers have been
grouped to provide comparable sample size.
129
65
34
27
26
14
14
11
10
4
0 50 100 150
Infrastructure
Oil and Gas
Rail and Underground
Power and Utilities
Commercial
Information Technologies
Defence
Government
Mining
Financial Sector
Number of responses by Industry
101
68
50
38
28
18
16
9
6
0 50 100 150
UK
APAC
Global - Undefined
North America
Middle-East
Europe
Asia
Africa
South America
Number of responses by Region

2
HIGHLIGHTS ............................................................................................................................... 3
DATA ANALYSIS ......................................................................................................................... 4
GENERAL STATUS OF PROJECT CONTROLS ............................................................................ 4
PEOPLE .................................................................................................................................. 10
PROCESSES ........................................................................................................................... 14
SYSTEMS ............................................................................................................................... 20
CONCLUSION ........................................................................................................................... 27
CONTENTS
Copyright Statement
Copyright to the information contained in this survey is reserved
by LogiKal Limited.
Information may not be used for commercial purposes without
our prior written consent.
LogiKal Limited gives no warranty as to the reliability of the
information provided and disclaims any liability to any party using
the information for any purpose whatsoever.

3
In order to establish current status and recent trends in project controls
LogiKal Projects have conducted a survey
334 responses have been received at the time of publishing. The data
has been analysed and indicates:
o A high degree of importance being attached to project controls
o Broadly satisfactory ratings but with an acknowledged need to
improve in some areas
o Strong correlation between high standards in project controls and
positive project outcomes
o Weak integration in processes and systems in the majority of
cases
o Many key processes continuing to be operated through Excel
spreadsheets
o A general need to enhance practitioner skills
o Low use of analytic tools and a perceived requirement for better
data to be demanded from the top of organisations
o Little integration currently between BIM processes and project
controls
Organisations and managers may wish to consider this information in
formulating their plans for developing capabilities to enhance project
outcomes
HIGHLIGHTS
4
How important are project controls?
At the front end of the survey we were keen to gain an understanding of how important the
topic area is in the management systems of the organisations which respondents are working
in – so we asked the following question.
How does your organisation currently rate the importance of Project Controls in the
management of projects and portfolios?
This question was framed to get a view on how the organisation as a whole views the
importance of project controls, rather than the individual responding to the survey
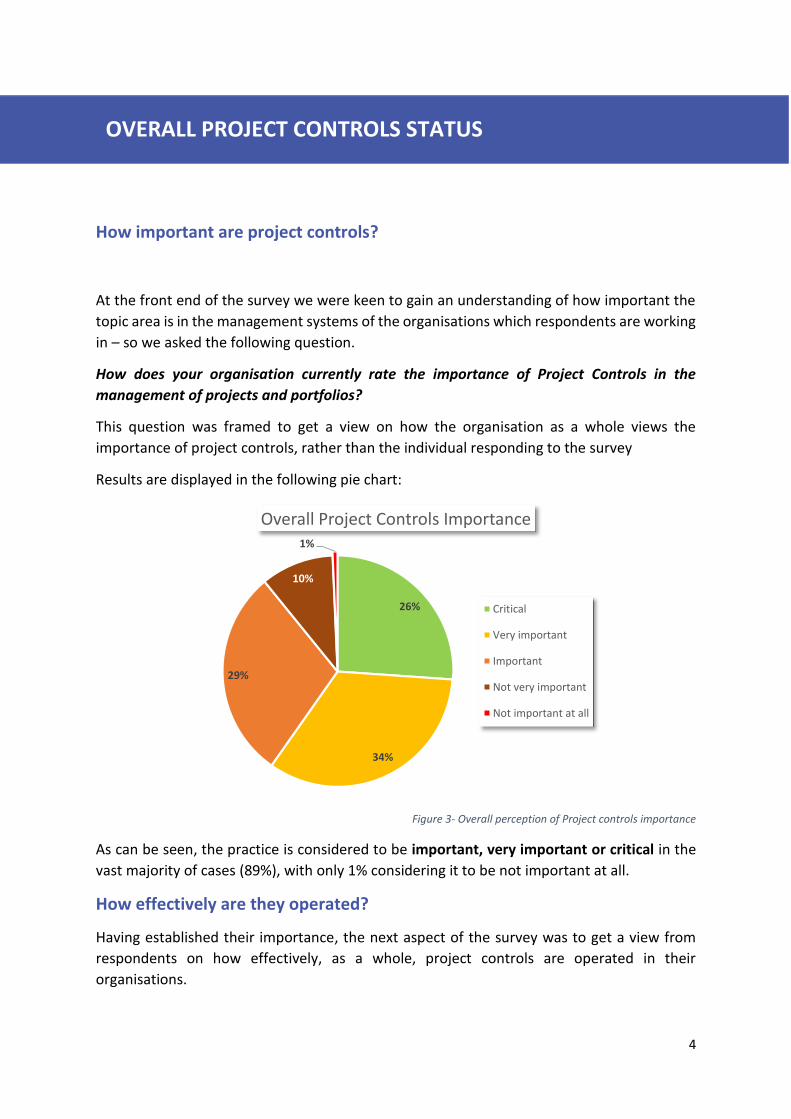
Results are displayed in the following pie chart:
Figure 3- Overall perception of Project controls importance
As can be seen, the practice is considered to be important, very important or critical in the
vast majority of cases (89%), with only 1% considering it to be not important at all.
How effectively are they operated?
Having established their importance, the next aspect of the survey was to get a view from
respondents on how effectively, as a whole, project controls are operated in their
organisations.
26%
34%
29%
10%
1%
Overall Project Controls Importance
Critical
Very important
Important
Not very important
Not important at all
OVERALL PROJECT CONTROLS STATUS
GENERAL STATUS OF PROJECT CONTROLS
5
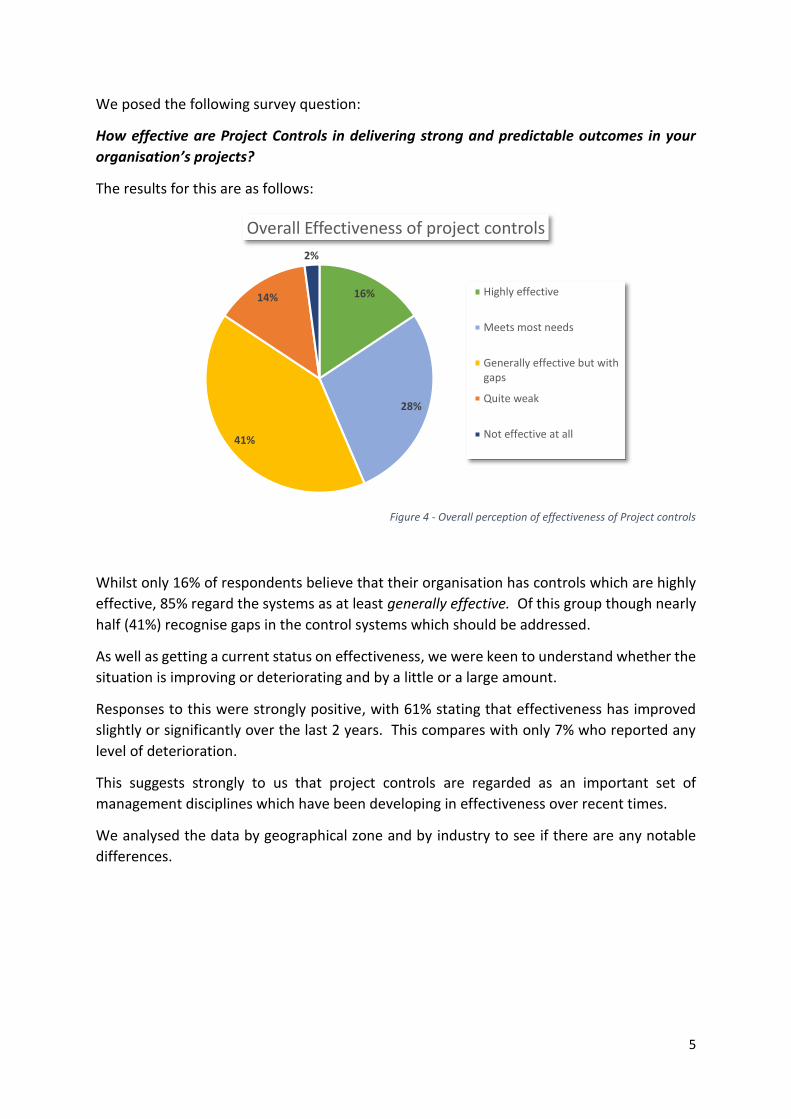
We posed the following survey question:
How effective are Project Controls in delivering strong and predictable outcomes in your
organisation’s projects?
The results for this are as follows:
Figure 4 - Overall perception of effectiveness of Project controls
Whilst only 16% of respondents believe that their organisation has controls which are highly
effective, 85% regard the systems as at least generally effective. Of this group though nearly
half (41%) recognise gaps in the control systems which should be addressed.
As well as getting a current status on effectiveness, we were keen to understand whether the
situation is improving or deteriorating and by a little or a large amount.
Responses to this were strongly positive, with 61% stating that effectiveness has improved
slightly or significantly over the last 2 years. This compares with only 7% who reported any
level of deterioration.
This suggests strongly to us that project controls are regarded as an important set of
management disciplines which have been developing in effectiveness over recent times.
We analysed the data by geographical zone and by industry to see if there are any notable
differences.
16%
28%
41%
14%
2%
Overall Effectiveness of project controls
Highly effective
Meets most needs
Generally effective but withgaps
Quite weak
Not effective at all
6
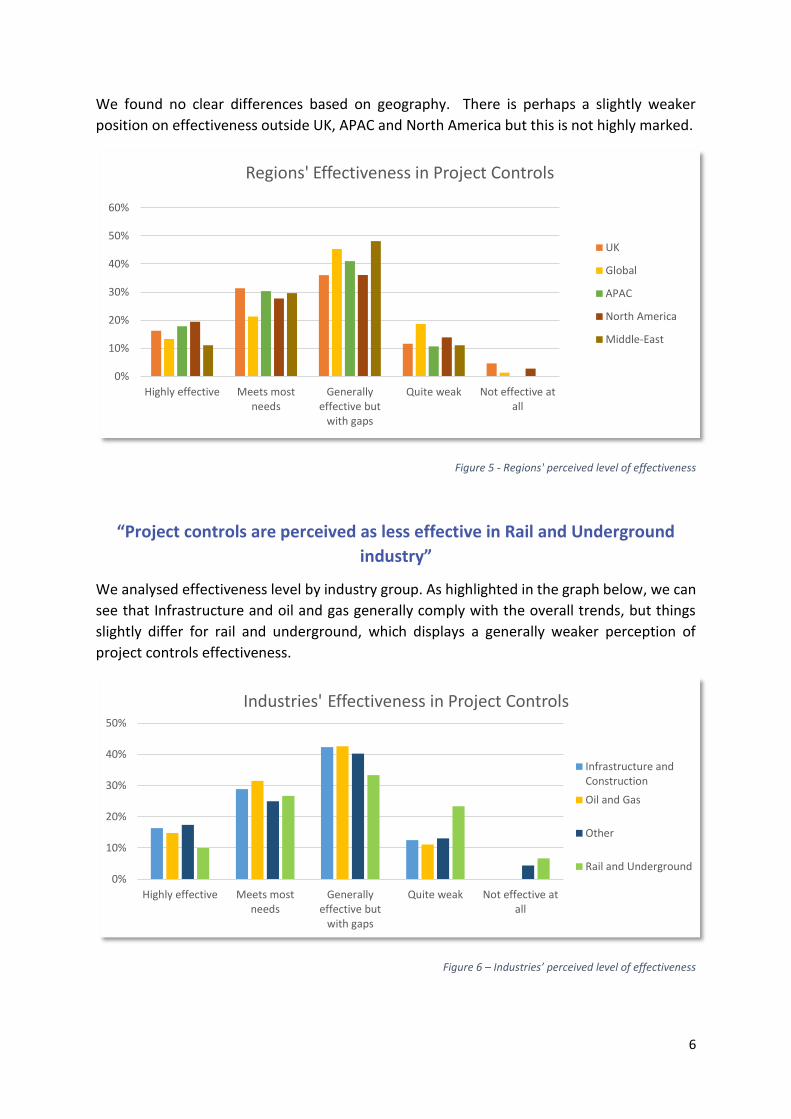
We found no clear differences based on geography. There is perhaps a slightly weaker
position on effectiveness outside UK, APAC and North America but this is not highly marked.
Figure 5 - Regions' perceived level of effectiveness
“Project controls are perceived as less effective in Rail and Underground
industry”
We analysed effectiveness level by industry group. As highlighted in the graph below, we can
see that Infrastructure and oil and gas generally comply with the overall trends, but things
slightly differ for rail and underground, which displays a generally weaker perception of
project controls effectiveness.
Figure 6 – Industries’ perceived level of effectiveness
0%
10%
20%
30%
40%
50%
60%
Highly effective Meets mostneeds
Generallyeffective but
with gaps
Quite weak Not effective atall
Regions' Effectiveness in Project Controls
UK
Global
APAC
North America
Middle-East
0%
10%
20%
30%
40%
50%
Highly effective Meets mostneeds
Generallyeffective but
with gaps
Quite weak Not effective atall
Industries' Effectiveness in Project Controls
Infrastructure andConstruction
Oil and Gas
Other
Rail and Underground

7
“Less effective project controls practices are associated with
underperforming projects”
One of the primary purposes of the survey is to establish whether there is a perceived
relationship between the effectiveness of project controls and the outcome of projects.
In order to seek to establish this, we asked respondents about the level of success which had
been achieved on recent projects
When considering the ‘successfulness’ of projects, we refer to the respondents who reported
their project controls outcomes (time, cost, quality) to have achieved all or the majority of
the project objectives.
The data indicates:
A combined 57% considered their projects to have underperformed or failed to meet
targets
The remaining 43% regarded their projects as successful. This group becomes key for
the analysis of the survey, and will serve as a sample of comparison to highlight
elements of success in project controls.
Figure 7 - Overall successfulness of project controls
5%
37%
38%
19%
0%
10%
20%
30%
40%
50%
60%
70%
Successful Unsuccessful
Project control outcomes success
Projects generally failed
Some projects underperformed
Most projects have metobjectives
All projects have met objectives

8
Perception of project controls importance is not clearly related to whether projects are
successful or not, as can be seen from the graph below:
However, things are different when perceived project outcomes are compared with the
effectiveness of project controls.
The following graph shows project outcomes for organisations compared with respondents’
perceived effectiveness of project controls
Figure 9 - Impact of Project control effectiveness on Project success
This graph demonstrates a very clear relationship. In the group reporting effective controls,
59% also reported that all or most project objectives were met. This compares with only 11%
for respondents reporting ineffective controls. This appears to provide strong evidence of a
relationship. Of course, there are likely to be many factors in play in determining whether
projects are successful, other than project controls. We cannot conclude that investing in
controls will necessarily lead to project success. However, this is sufficient evidence to
suggest that organisations who are dependent on successful outcomes for projects would be
wise to review their capability in this area.
Ineffective
Generally effective but with gaps
Highly effective or meets most needsMost ObjectivesFailed
Mixed results
Most ObjectivesMet
All Objectives Met
Project controls effectiveness Level of Project Success
95%
5%
86%
14%
0% 20% 40% 60% 80% 100%
Very Important
Non Important
Project Controls Importance
Successful Projects Unsuccessful Projects
Figure 8 - Project Controls importance compared by successful and unsuccessful projects
9
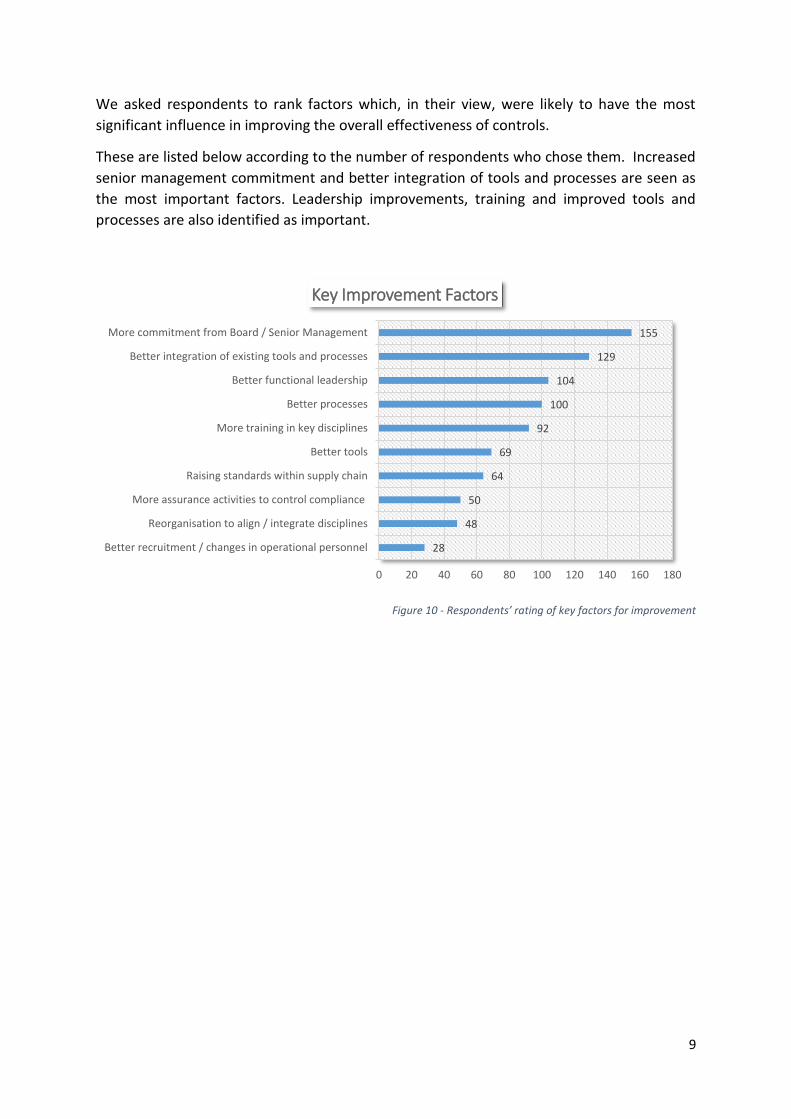
We asked respondents to rank factors which, in their view, were likely to have the most
significant influence in improving the overall effectiveness of controls.
These are listed below according to the number of respondents who chose them. Increased
senior management commitment and better integration of tools and processes are seen as
the most important factors. Leadership improvements, training and improved tools and
processes are also identified as important.
Figure 10 - Respondents’ rating of key factors for improvement
28
48
50
64
69
92
100
104
129
155
0 20 40 60 80 100 120 140 160 180
Better recruitment / changes in operational personnel
Reorganisation to align / integrate disciplines
More assurance activities to control compliance
Raising standards within supply chain
Better tools
More training in key disciplines
Better processes
Better functional leadership
Better integration of existing tools and processes
More commitment from Board / Senior Management
Key Improvement Factors

10
Apart from looking at the overall position on controls, we also used the survey to solicit views
on the different elements which support solution effectiveness. In this section, we look
specifically at the people aspects of the project controls solution.
Skills
Clearly, good controls practice is dependent on having a team of practitioners with the right
skills and capabilities. We asked respondents to give us their views on the current skill levels
in their organisations.
This is reported below:
Figure 11 - Perceived level of project control practitioners’ skills
This result suggests something of a skills gap, with only 10% reporting that they have all of
the necessary skills available. A further 31% report generally good skills, leaving 59%
reporting mixed or weak skill levels. This is consistent with project controls being an emerging
profession, currently developing inside many organisations.
The results are consistent with many respondents (92) choosing training and skills
development as being a key factor in developing capability in their organisations.
As with project controls effectiveness as a whole, we used the data set to compare reported
project outcomes with skill levels and this comparison can be seen in the following graph:
10%
31%
48%
7%4%
Skill level of Project Controls practitioners
The whole team has thenecessary skills
Most have good skills butsome need further training
Some have good skills butothers don't
Need to increase skills in theteam
Standards are poor
PEOPLE
11
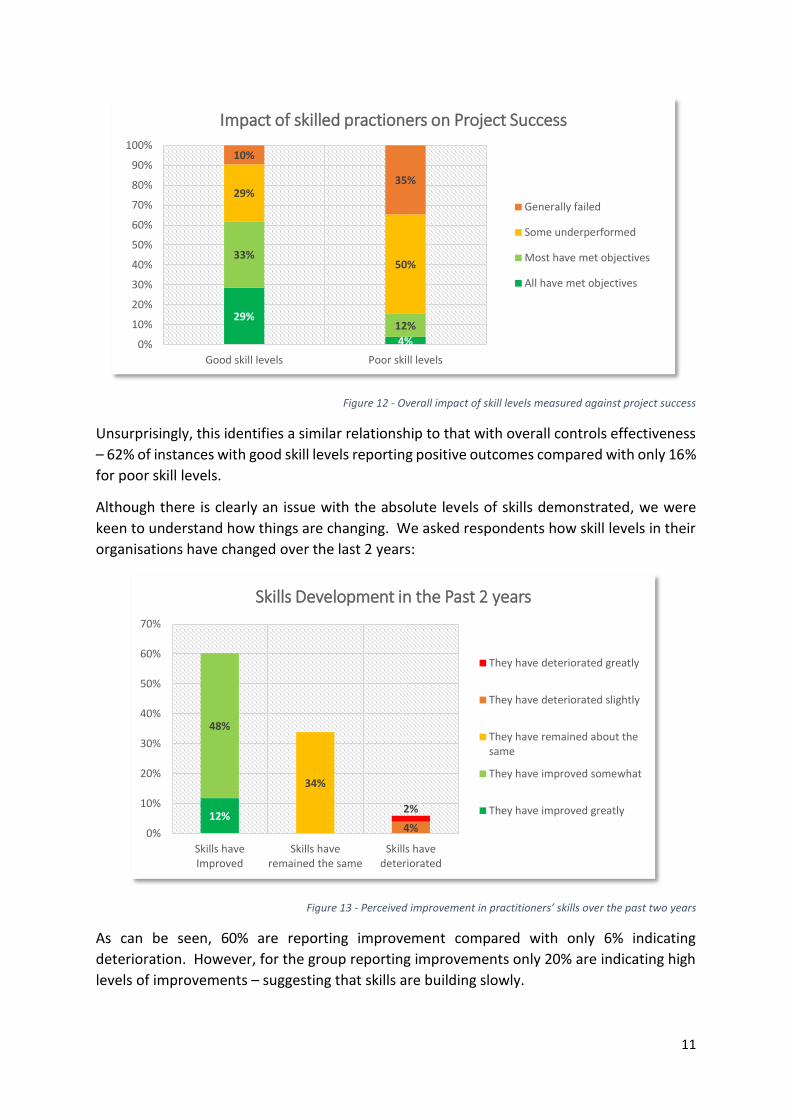
Figure 12 - Overall impact of skill levels measured against project success
Unsurprisingly, this identifies a similar relationship to that with overall controls effectiveness
– 62% of instances with good skill levels reporting positive outcomes compared with only 16%
for poor skill levels.
Although there is clearly an issue with the absolute levels of skills demonstrated, we were
keen to understand how things are changing. We asked respondents how skill levels in their
organisations have changed over the last 2 years:
Figure 13 - Perceived improvement in practitioners’ skills over the past two years
As can be seen, 60% are reporting improvement compared with only 6% indicating
deterioration. However, for the group reporting improvements only 20% are indicating high
levels of improvements – suggesting that skills are building slowly.
29%
4%
33%
12%
29%
50%
10%
35%
0%
10%
20%
30%
40%
50%
60%
70%
80%
90%
100%
Good skill levels Poor skill levels
Impact of skilled practioners on Project Success
Generally failed
Some underperformed
Most have met objectives
All have met objectives
12%
48%
34%
4%
2%
0%
10%
20%
30%
40%
50%
60%
70%
Skills haveImproved
Skills haveremained the same
Skills havedeteriorated
Skills Development in the Past 2 years
They have deteriorated greatly
They have deteriorated slightly
They have remained about thesame
They have improved somewhat
They have improved greatly

12
Is the controls information used?
We are aware that there is a wide variation in the extent to which controls information is used
in the management of projects. Sometimes the information is just used for status updates,
sometimes it is only provided to meet contractual requirements.
We were keen to understand how many respondents believe that their organisations make
good use of controls information in the management of projects, regardless of the quality of
that information. The survey asked respondents to categorise information use.
Surprisingly, despite the consensus on the importance of project controls, only 27% of
respondents thought that good use was made of controls information. This suggests that
management systems are weaker than they might be through the failure to review and act
on performance information.
As indicated by the graph below though, successful projects are 2.5 times as likely to be
making good use of the controls information as those considered to be unsuccessful, but still
only 41% of cases appear to make good use of the information.
Figure 14 - Comparison of data usage between successful and unsuccessful projects
This suggests to us that increasing the use of controls information may provide a major
opportunity for performance enhancement.
Further analysis makes it clear though that practitioner skill levels are closely associated with
the likelihood of the data being used.
9%
31%
50%
53%
41%
16%
0% 20% 40% 60% 80% 100%
Successful Projects
Unsuccessful Projects
Usage of Project Controls Data
Data rarely made use of Mixed Results Data made good use of

13
The following graph shows this relationship:
Figure 15 - Impact of quality data on information usage
It is not clear from the data whether it is practitioner skills or propensity of managers to utilise
the information which is driving this relationship. Our belief is that it is likely to be the latter,
since managers who insist on good data for the management of their projects will take steps
to drive up standards where this is necessary.
3%
39%35%
23%
4%
40%
48%
8%
0%
10%
20%
30%
40%
50%
60%
Always madegood use
Mostly Madegood use
Sometimes used Rarely made use Not really used
Skills levels compared with Data usage
Low Skill levels
High Skill Levels

14
Process quality
Respondents were asked to give a quality rating out of ten for each of nine key project control
processes.
The graph below shows average score for each process segregated between respondents
reporting successful and unsuccessful project outcomes.
From the overall results, the lowest rated process was Risk Management with an average of
5.2 out of 10, Schedule management was the highest with 6.6.
Overall ratings averaged 6.8 for projects meeting most objectives and 5.4 for ones failing to
do so.
Figure 16 - Processes quality rating compared by successfulness of projects
The relative differences in the process ratings are interesting and are explored further in this
section.
Process integration
The survey asked respondents to give an opinion on whether processes, as identified above,
are proportionate to the needs of the organisation and well integrated with each other for
efficiency and consistency. The responses received highlight a large majority believing that
their processes are not ‘match fit’ and need improvement. Only 7% of respondents consider
their processes to be both well drafted and well integrated.
5.5
5.1
6.0
6.0
4.8
5.3
4.6
6.1
5.8
6.9
6.4
7.2
7.3
6.7
7.1
6.1
7.4
6.9
0 2 4 6 8 10
Baseline setting
Change management
Cost management
Gateway financial approval
Performance management
Performance measurement
Risk management
Schedule management
Scope management
Processes quality rating - Average
Successful Projects Unsuccessful Projects
PROCESSES

15
The results again show a significant leaning towards higher process quality for successful
projects, as can be seen in the following graph:
Figure 17 - Correlation between project success and good quality and well integrated processes
“Stronger process integration correlates with improved project controls
effectiveness”
The survey asked a specific question about the level of integration between different controls
processes. Responses were calibrated with successful reported outcomes as follows:
Figure 18 - Impact of process Integration on Project success
At first glance, the data appears to indicate that organisations with fully integrated processes
have a high instance of project success. However, as only 2% of respondents reported that
processes are fully integrated, we would not consider this to be a reliable conclusion.
This low level of process integration suggests that this remains a key area to be tackled in
most organisations, including those which are currently performing well.
17%
35%
29%
16%
2%1%
22%
36% 35%
6%
0%
5%
10%
15%
20%
25%
30%
35%
40%
They are welldrafted and well
integrated
They are welldrafted but lack
integration insome areas
They fulfil manyneeds but not all
They needsignificant
improvement tobe effective
They need acomplete redraft
Process status compared with Project Success
Successful Projects
Unsuccessful Projects
Fully integrated
Reasonably integrated
Some aspects are integrated
Mainly operating in silos
Most ObjectivesFailedMixed Results
Most ObjectivesMetAll ObjectivesMet
Level of Process Integration Level of Project Success

16
Figure 19 - Results for overall process integration
“Rail and underground fails to meet average levels of process effectiveness”
We carried out an analysis of these results by geographical area and by industry. Whilst the
geographical results were very consistent, we noted some differences in the industry position
as shown in the following graph:
Figure 20 - Processes efficiency levels as reported by different industries
Again, Rail and Underground results show a particular weakness. No respondents rated
current processes in the top category and a massive 57% identified the need for significant
improvement. However, we also ascertained that the relationship between process quality
and project success remains as strong in this sector as in any other industry.
2%
38%
43%
17%
Process integration
Fully integrated
Reasonably integrated
Some aspects areintegrated
Mainly operating insilos
0%
10%
20%
30%
40%
50%
60%
They are welldrafted and
well integrated
Well draftedbut lack
integration insome areas
They fulfil manyneeds but not
all
They needsignificant
improvement tobe effective
They need acomplete
redraft
Processes Efficiency by Industry
Infrastructure andConstruction
Oil and Gas
Other
Rail and Underground

17
“Failure to control risk and manage performance may be significant reasons
why many projects fail to meet objectives”
We noted at the start of this section that there are significant differences in process quality
ratings between responses indicating strong projects outcome and those which didn’t.
Further analysis shows that the differences are particularly marked for risk management and
performance management processes. These were the lowest rated processes for
unsuccessful projects, with scores of 4.6 and 4.8 respectively.
It is probably intuitive to suggest that projects which control their risks and manage
performance well are likely to have better outcomes, and this is corroborated by the survey
results. It suggests to us that organisations which are not achieving strong project outcomes
will benefit from putting particular focus into improving in these areas.
On the more positive side, it is interesting to note that respondents reporting successful project outcomes also reported strong processes for schedule management, performance measurement, gateway financial approval and cost management, all of which achieved an average score above seven in this category of respondents.
To explore this concept further we took subsets of the response data, selecting only responses which rated individual processes highly, at eight or more out of ten. For each subset of the data, the following charts show the relationship with reporting of successful outcomes:
Figure 21 - Comparison of different high quality processes and their correlation with project success
The correlation is highest for performance management, with 71% of these cases reporting successful outcomes, closely followed by risk management with 68% success rate. Scores for cost management and schedule management are 61% and 66% respectively. Remembering

18
that these scores are to be compared with a reported success rate of 43% in the total survey data, the association between the quality of these processes and project outcomes is clearly significant.
Process compliance
Having well-structured and integrated processes is one thing, ensuring they are consistently
followed by all involved in the project is another.
Regardless of the current quality of processes, we were keen to get a view from respondents
on the extent to which their process are followed. The results are shown below.
Figure 22 – reported levels of compliance
Again, there is a clear differential between the results for those reporting successful and
unsuccessful projects – substantial compliance being reported in 63% of cases for the former,
compared with less than half of that (31%) for the latter.
We then wanted to ascertain the extent to which organisations monitor process compliance
through audits or process compliance reviews.
“Compliance reviews have a role to play in securing improvements in project
controls practice”
The overall results were balanced, with 25% of respondents citing that their organisations
carry out frequent reviews, 25% reporting that they do not conduct them at all, and 50%
having some level of infrequent process.
11%
52%
33%
4%1%2%
29%
46%
19%
3%
0%
10%
20%
30%
40%
50%
60%
Processes arefollowed to the
letter
Most processesare followed
Compliance isvariable
Compliance isweak
Processes are notfollowed
Process compliance
Successful projects
Unsuccessful projects

19
Again, as we might have anticipated, there is a tendency towards better outcomes from those
situations where reviews are carried out, as demonstrated in the following chart:
Figure 23 - Correlation between frequency of compliance reviews and project success
Whilst the association with project success is a little less marked than it is for process quality,
it is still significant, which suggests to us that a compliance monitoring / management regime
should form an essential part of the requirements for any organisation concerned to optimise
outcomes.
Yes – frequently
Yes – but not regularly
Rarely or not at all
Most ObjectivesFailedMixed Results
Most ObjectivesMetAll ObjectivesMet
Frequency of Compliance reviews
Level of Project Success

20
Having looked at the people and process dimensions, the survey then focussed on the systems
solution, with a view to understanding what type of tools are in use and how effectively
integrated they are.
“Unlike schedule management, organisations seem to lack the use of
sophisticated tools for Risk and Cost management”
Schedule
Respondents reported the largest use of database tools in the areas of schedule management,
with Primavera P6 being identified as the key software by 77% of the respondents who named
a specific tool.
Figure 24 - Respondents' usage of schedule management tools
For those using CPM databases, there was a high instance of those databases being controlled and
managed centrally.
Figure 25 – Levels of CPM implementation
82
6
3
2
1
1
1
0 20 40 60 80 100
P6
MS Project
Asta
Microplanner X-Pert
EPM
CMT
ADePT
Schedule Management tools
58%
11%
25%
6%
Schedule Management Database Usage
Use Critical Path Method in asingle Integraterd database
Use CPM in multiple databasesfor different projects
Each project has CPM data heldlocally
Do not use CPM tools
SYSTEMS
21
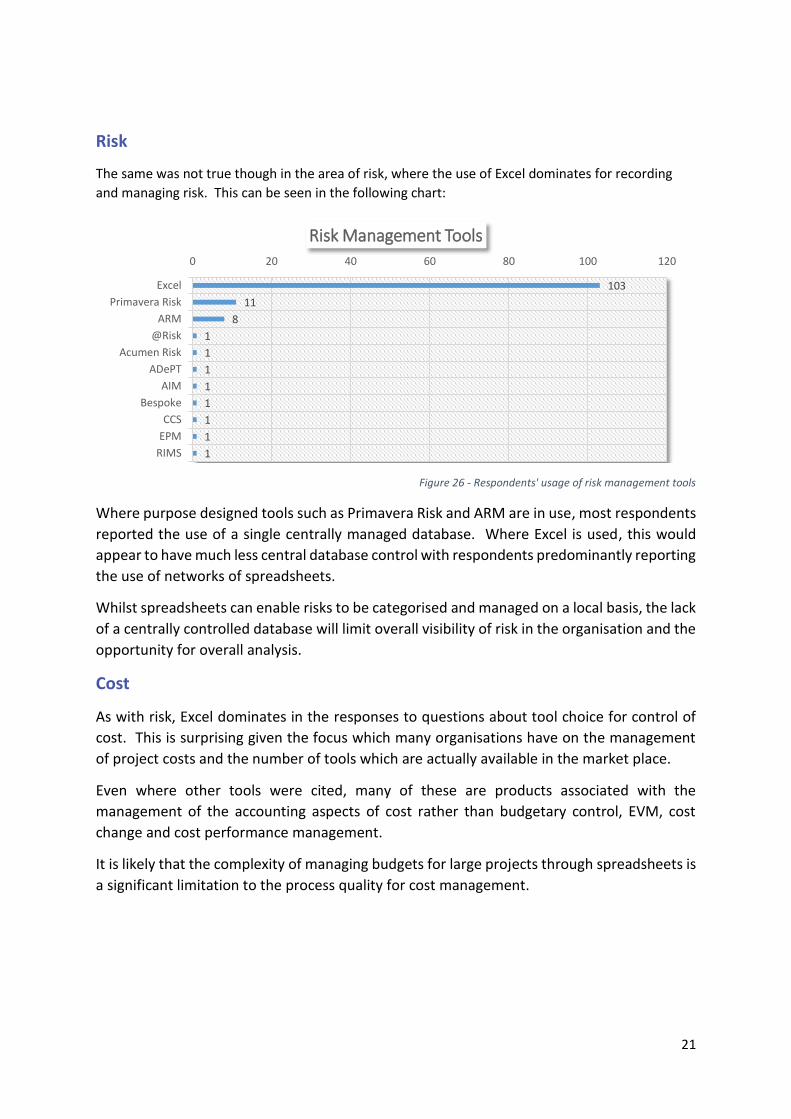
Risk
The same was not true though in the area of risk, where the use of Excel dominates for recording
and managing risk. This can be seen in the following chart:
Figure 26 - Respondents' usage of risk management tools
Where purpose designed tools such as Primavera Risk and ARM are in use, most respondents
reported the use of a single centrally managed database. Where Excel is used, this would
appear to have much less central database control with respondents predominantly reporting
the use of networks of spreadsheets.
Whilst spreadsheets can enable risks to be categorised and managed on a local basis, the lack
of a centrally controlled database will limit overall visibility of risk in the organisation and the
opportunity for overall analysis.
Cost
As with risk, Excel dominates in the responses to questions about tool choice for control of
cost. This is surprising given the focus which many organisations have on the management
of project costs and the number of tools which are actually available in the market place.
Even where other tools were cited, many of these are products associated with the
management of the accounting aspects of cost rather than budgetary control, EVM, cost
change and cost performance management.
It is likely that the complexity of managing budgets for large projects through spreadsheets is
a significant limitation to the process quality for cost management.
103
11
8
1
1
1
1
1
1
1
1
0 20 40 60 80 100 120
Excel
Primavera Risk
ARM
@Risk
Acumen Risk
ADePT
AIM
Bespoke
CCS
EPM
RIMS
Risk Management Tools

22
Figure 27 - Respondents' usage of cost management tools
Integration
“The use of unsophisticated tools across the profession leads to less
opportunities for system integration”
At the first level of integration, we were interested to understand from the survey how many
respondents have organisations which integrate the individual tools over their projects or
portfolios.
As could be expected from the conclusions drawn above, schedule management comes across
as the most integrated system, with the majority, 57%, using a single integrated database.
Cost and risk management, due to the lower usage of professional tools, show inferior system
integrated database usage, 28% for cost, and an even lower 24% for risk.
966
44
322
11111111111111111111
0 10 20 30 40 50 60 70 80 90 100
Excel
Inhouse System
JDE
P6
cCS
CMiC
Cobra
COINS
Costrac
Ellipse
ERP
IFS
Oracle
RIB itwo
Cost Management Tools
23
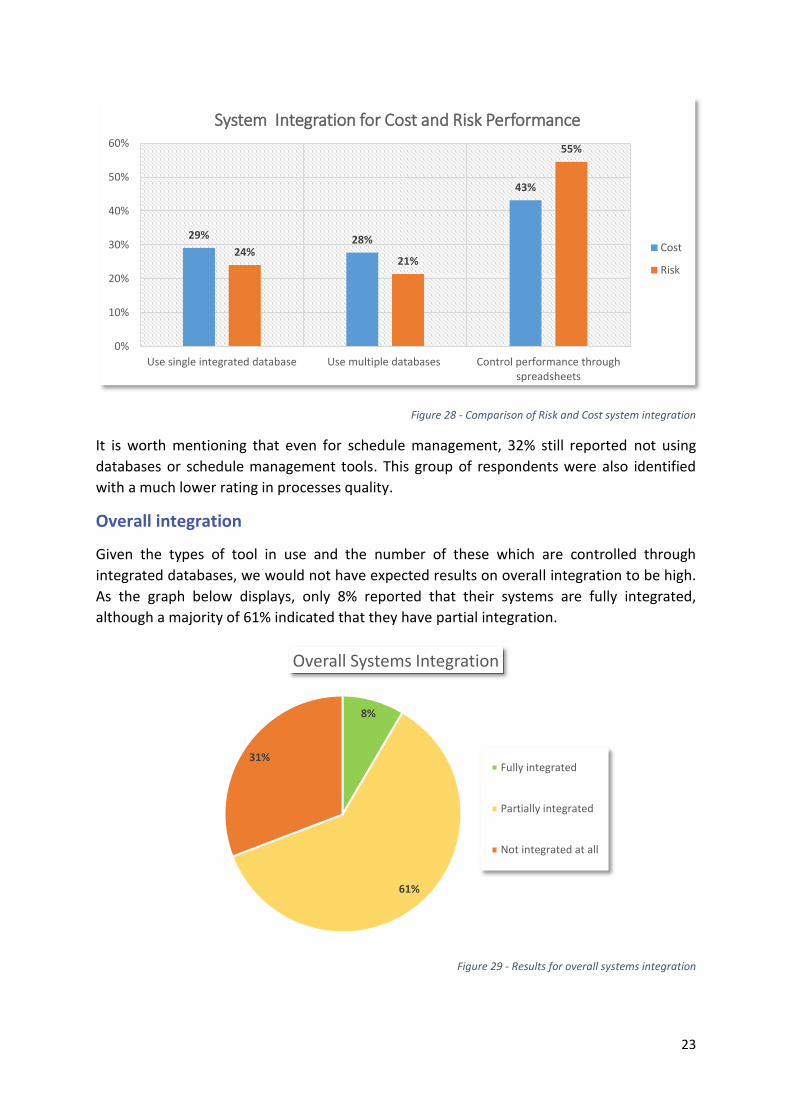
Figure 28 - Comparison of Risk and Cost system integration
It is worth mentioning that even for schedule management, 32% still reported not using
databases or schedule management tools. This group of respondents were also identified
with a much lower rating in processes quality.
Overall integration
Given the types of tool in use and the number of these which are controlled through
integrated databases, we would not have expected results on overall integration to be high.
As the graph below displays, only 8% reported that their systems are fully integrated,
although a majority of 61% indicated that they have partial integration.
Figure 29 - Results for overall systems integration
29% 28%
43%
24%21%
55%
0%
10%
20%
30%
40%
50%
60%
Use single integrated database Use multiple databases Control performance throughspreadsheets
System Integration for Cost and Risk Performance
Cost
Risk
8%
61%
31%
Overall Systems Integration
Fully integrated
Partially integrated
Not integrated at all

24
We disaggregated this information by geographical area and by industry sector. The picture,
which is displayed by the following graphs, is remarkably similar in both cases.
Figure 30 - Levels of system integration as reported by different Region groups
Figure 31 - Levels of system integration as reported by different Industry groups
As with people and processes, we were keen to understand how well the integration of
project control systems correlates with successful project outcomes. The following graph
describes this relationship:
Figure 32 - Impact of System Integration on Project success
0%
10%
20%
30%
40%
50%
60%
70%
Fully integrated Partially integrated Not integrated at all
System Integration by Region
UK
Global
APAC
North America
Middle-East
0%
10%
20%
30%
40%
50%
60%
70%
Fully integrated Partially integrated Not integrated at all
System Integration by Industry
Infrastructure andConstruction
Oil and Gas
Other
Rail and Underground
Fully integrated
Partially integrated
Not integrated at all
Most ObjectivesFailed
Mixed Results
Most ObjectivesMet
Level of Systems Integration Level of Project Success
25
As can be seen, respondents reporting fully integrated systems also reported high levels of
project success. Since this is only 8% of the survey population, it is unlikely that it is the
systems integration itself which is driving that success. The data indicated that this state is
achieved by organisations with a stronger overall solution, such that systems integration is
just one of the factors leading to better outcomes.
Use of Business Intelligence Tools
Business intelligence tools are increasingly being used in business to analyse and mine data.
We were interested to find out the extent to which this phenomenon is being utilised in
projects.
The results indicate that this concept is only now starting to emerge, with only 15% of
respondents reporting a level of BI use. This situation is likely to be associated with the levels
of data usage and perhaps the noted requirement for more drive from the top of
organisations to achieve visibility of project performance.
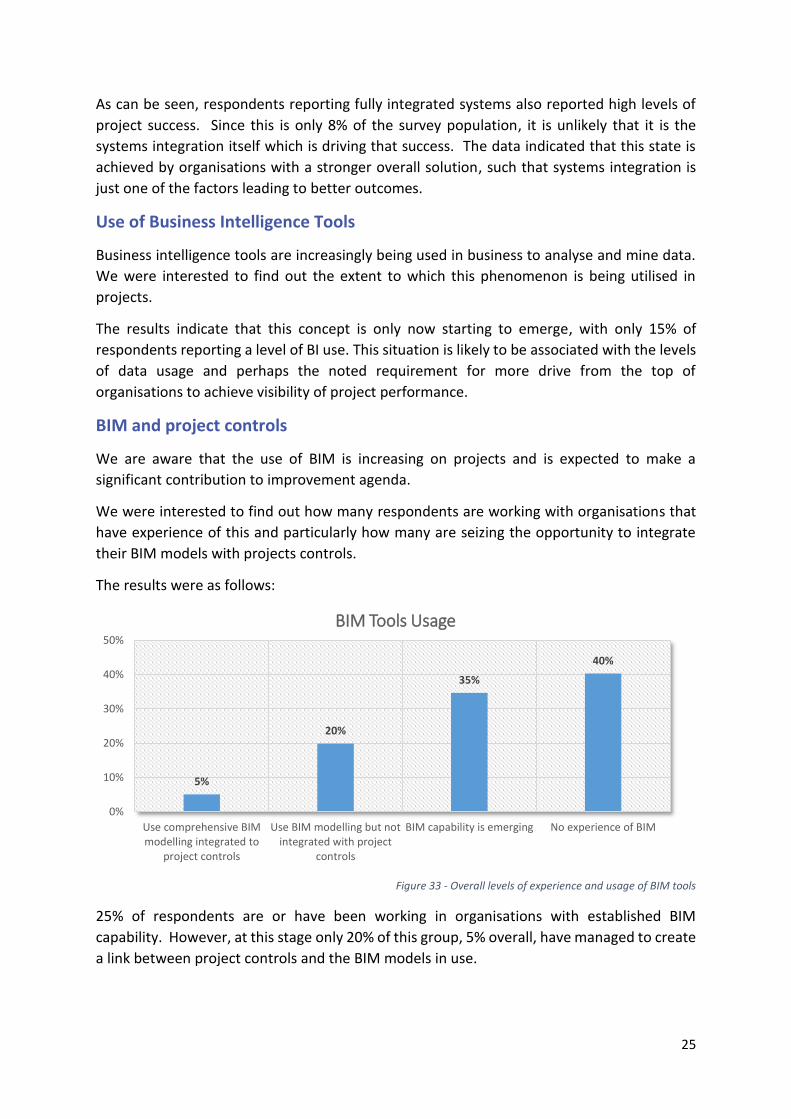
BIM and project controls
We are aware that the use of BIM is increasing on projects and is expected to make a
significant contribution to improvement agenda.
We were interested to find out how many respondents are working with organisations that
have experience of this and particularly how many are seizing the opportunity to integrate
their BIM models with projects controls.
The results were as follows:
Figure 33 - Overall levels of experience and usage of BIM tools
25% of respondents are or have been working in organisations with established BIM
capability. However, at this stage only 20% of this group, 5% overall, have managed to create
a link between project controls and the BIM models in use.
5%
20%
35%
40%
0%
10%
20%
30%
40%
50%
Use comprehensive BIMmodelling integrated to
project controls
Use BIM modelling but notintegrated with project
controls
BIM capability is emerging No experience of BIM
BIM Tools Usage

26
Building out control plans from BIM models has obvious advantages in terms of consistency
of information. We would expect, as both BIM and project controls develop in their
application, that opportunities to align these disciplines will increase.

27
Whilst data has a bias towards the industries and geographical areas in which we operate, it
is sufficiently generalised to enable us to draw some significant conclusions on the current
status of project controls practice.
Importance and effectiveness
The vast majority of respondents (89%) indicated that their organisations regard
project controls as important, very important or critical
The majority of respondents regard the current situation on controls as at least
‘generally satisfactory’, although around half of these recognise significant gaps which
need to be addressed
Standards appear to be increasing gradually, with 61% of respondents reporting
improvement over the last 2 years compared with only 7% indicating a deterioration
With the exception of the rail and underground industries, which report poorer
standards, the position is consistent over different sectors and geographical areas
Relationship with project outcomes
The data suggests a significant tendency for organisations operating effective project
controls to also record more positive project outcomes
This effect is consistent across the 3 dimensions of People, Processes and Systems
Weaker project outcomes appear to be strongly associated with weak risk
management and performance management processes
Conversely, strong outcomes are particularly associated with good processes for
schedule management, performance management, gateway approvals and cost
management
High levels of integration in both processes and tools are clearly associated with better
project outcomes
Tools
With the exception of the tools used for schedule control, where P6 based databases
dominate, other tools appear less sophisticated, with Excel being reported by many as
the primary tool used for controlling risk and cost
Levels of integration between tools are generally low, with only 8% of respondents
claiming that their tool sets are well integrated
Use of BI tools is very limited, with only 15% of respondents indicating that these are
used for project management
BIM capability is emerging in respondent’s organisations, but the link with controls
appears still to be in its infancy
CONCLUSIONS

28
From the information provided, we believe that organisations which are dependent on
successful outcomes from projects may wish to further review whether addressing capability
gaps in projects controls may help to increase their chances of project / programme success.
In looking at driving improvements in this area, leadership at both senior level and within
relevant functions are seen by respondents as critical areas to address.

29
Contact Details
London
3rd Floor 27-29 Cursitor Street London EC4A 1LT United Kingdom
+44 20 7404 4826
Perth
8th Floor 41-43 St Georges Terrace Perth WA 6000 Australia
+61 8 6140 2577
Hong Kong
9th Floor 303 Hennessy Road Wan Chai Hong Kong
+ 852 8197 8088
Melbourne
5th Floor 412 Collins Street Melbourne VIC, 3000 Australia
Brisbane
320 Adelaide Street Brisbane QLD 4000 Australia
+61 7 3182 1179
If you would like to discuss the survey analysis in more detail
please contact our Consulting Team on [email protected]
or +44 20 7404 4826