recent transactions & case studies 8 fintech m&a & capital
TRANSCRIPT

INVESTMENT BANKING JULY 2020
FINTECH INSIGHTMERGERS AND ACQUISITIONS, PUBLIC AND PRIVATE FINANCINGS & FINANCIAL ADVISORY SERVICES
FOR INSTITUTIONAL USE ONLY
IN THIS ISSUE
About Us 2
Recent Transactions & Case Studies 8
FinTech M&A & Capital Raising Activity 14
Recent FinTech Transaction Activity 16
FinTech Trading Analysis 33

FINTECH INSIGHT
RAYMOND JAMES INVESTMENT BANKING 2
JULY 2020
Leading FinTech Franchise on Wall Street
Deep & Experienced Team
14 Senior Bankers
+4 Equity Research Analysts
+4 Dedicated Equity Capital Markets Professionals
Extensive Transaction Experience
~190 Transactions Since 2010
~155M&A / Private Placement Transactions with $12+ Billion in Total Deal Value Since 2010
+30 Public Offering Transactions Raising $8+ Billion Since 2010
Sector Coverage
• Asset / Wealth Management Technology
• Bank Technology
• Benefits / Payroll
• Capital Markets Technology
• Financial SaaS
• Information Services
• Insurance Technology
• Outsourced Solutions
• Payments
• Real Estate / Mortgage Solutions
• Tech-Enabled Lending Platforms
• Transactional Marketing Services
Networks and Business Model Coverage
SaaS
Online / Mobile
Transactional
Data / Information
Tech-Enabled Solutions

FINTECH INSIGHT
RAYMOND JAMES INVESTMENT BANKING 3
JULY 2020
Advisory Equities
Venture CapitalPrivate Equity
Blue-Chip Clients

FINTECH INSIGHT
RAYMOND JAMES INVESTMENT BANKING 4
JULY 2020
Premier FinTech Investment Banking Team
BRENDAN RYANGroup Co-Head
+1.617.470.5671
EXPERIENCE
JON STEELEGroup Co-Head
+1.617.519.7114
EXPERIENCE
PAUL FRICILONEManaging Director
+1.708.334.3376
EXPERIENCE
STUART SWEENEYManaging Director, Europe
stuart.sweeney@
raymondjames.com
+44.20.3798.5726
EXPERIENCE
JAPHET WUENSCHManaging Director, Europe
japhet.wuensch@
raymondjames.com
+49.89.2323.7738
EXPERIENCE
SEBASTIAN KNACKFUSSVice President, Europe
sebastian.knackfuss@
raymondjames.com
+49.89.2323.7765
EXPERIENCE
KAIDI KUUSKVice President, Europe
kaidi.kussk@
raymondjames.com
+44.20.3798.5721
EXPERIENCE
LAURA MADDISONManaging Director, Europe
+44.20.3798.5705
EXPERIENCE
SEAN MARTINManaging Director, Canada
+1.416.777.6375
EXPERIENCE
STUART SPARKESManaging Director, Europe
+44.20.3798.5600
EXPERIENCE
CONRAD REUSCHVice President
conrad.reusch@
raymondjames.com
+1.415.583.4480
CHRISTIAN CLIFFORDVice President
christian.clifford@
raymondjames.com
+1.508.498.0095
EXPERIENCE
GRAHAM HURTTVice President
graham.hurtt@
raymondjames.com
+1.203.887.3952
EXPERIENCE
NATHAN LAMBERTVice President
nathan.lambert@
raymondjames.com
+1.603.913.5152
EXPERIENCE EXPERIENCE

FINTECH INSIGHT
RAYMOND JAMES INVESTMENT BANKING 5
#1 FinTech Investment Banking PracticeOur FinTech practice is the premier investment banking platform for companies seeking industry knowledge, buyer relationships and execution capabilities.
2010-2019 U.S. Deal Rankings1 2019 U.S. Deal Rankings1
1. Note: Represents transactions involving U.S.-based targets2. General range of deal values
~190Deals Since 2010
~155M&A / Private Placement Deals Since 2010
14Senior Bankers Across the Globe
$100 MILLION – $2 BILLION“Sweet Spot”2
12+ Year Track Record
EXTENSIVE EXPERIENCEAcross All FinTech Sectors
74
9
1052015
1242016
1412017
1692018
1892019
#1 PRACTICE in cumulative FinTech deals
completed over the last five years
189 20
92
71 7
6
88
10
91
11
10
59
70
6
80
7
11
87

JULY 2020FINTECH INSIGHT
Recent Awards & Accolades
RAYMOND JAMES INVESTMENT BANKING 6Note: Criteria for the awards can be found at www.raymondjames.com/corporations-and-institutions/accolades.
2019 PRIVATE EQUITY DEAL OF THE YEAR (OVER $1B)Sale of Millennium Trust Company to ABRY Partners
2019 TECHNOLOGY DEAL OF THE YEAR($500M - $1B)Majority Investment in Invoice Cloud by General Atlantic
2018 PRIVATE EQUITY DEAL OF THE YEAR($250MM TO $500MM)Sale of Sage Payment Solutions to GTCR
2017 FINANCIALS DEAL OF THE YEAR (UNDER $250MM)Sale of BISAM Technologies to FactSet
2017 CROSS BORDER DEAL OF THE YEAR ($100MM TO $500MM)Sale of BISAM Technologies to FactSet
2017 AMERICA INSURANCE DEAL OF THE YEARSale of Jefferson National to Nationwide Mutual
2017 FINANCIALS DEAL OF THE YEARSale of AssetMark to Huatai Securities Co., Ltd.
2016 INVESTMENT BANKING FIRM OF THE YEAR
2015 FINANCIAL TECH & SERVICES DEAL OF THE YEARSale of Columbus Data Services to Cardtronics
The M&A Advisor
M&A Atlas Awards
2017 PRIVATE EQUITY DEAL OF THE YEARGrowth Investment in PaySimple by Providence Equity
2015 CORPORATE & STRATEGIC ACQUISITION OF THE YEAR (OVER $100M TO $500M)Sale of PayChoice, Inc. to Sage Group Plc

FINTECH INSIGHT
RAYMOND JAMES INVESTMENT BANKING 7
FinTech Coverage Universe Advisory Capabilities
Capital Raising Capabilities
Private Placements
Initial Public Offerings
Follow-On Offerings
Debt Capital
Restructuring
Outsourced Solutions
Capital Markets Technology
Transactional Marketing Services
Payments
Bank Technology
Insurance Technology
Benefits / Payroll
Tech-EnabledLending Platforms
Financial SaaS
Asset / Wealth Management Technology
Information Services
Real Estate / Mortgage Solutions
Sales / Recaps
Acquisitions
Divestitures
Strategic Advisory
Fairness Opinions
RAYMOND JAMES INVESTMENT BANKING 7

FINTECH INSIGHT
RAYMOND JAMES INVESTMENT BANKING 8
RECENT TRANSACTIONS & CASE STUDIES

FINTECH INSIGHT JULY 2020
More FinTech Transactions Completed Since 2010 Than Any Other Firm
View our full transaction history here >
June 2019 June 2019 June 2019
$117,500,000Follow-On OfferingBookrunning Manager
June 2019
$249,500,000Follow-On OfferingCo-Manager
June 2019
$183,000,000Follow-On OfferingCo-Manager
April 2019 March 2019
July 2019
October 2019 September 2019 September 2019
$91,600,000Follow-On OfferingBookrunning Manager
September 2019
October 2019
December 2019
$112,500,000Follow-On OfferingCo-Lead
January 2020February 2020February 2020
July 2019
$316,250,000Initial Public OfferingCo-Manager
July 2019August 2019
March 2020April 2020April 2020June 2020

FINTECH INSIGHT JULY 2020
More FinTech Transactions Completed Since 2010 Than Any Other Firm
View our full transaction history here >
June 2018
June 2018
$99,417,500Initial Public OfferingBookrunning Manager
August 2018August 2018
June 2018 May 2018
$1,005,000,000Initial Public OfferingCo-Manager
May 2018
May 2018 May 2018 May 2018 May 2018
September 2018
September 2018September 2018October 2018October 2018
November 2018December 2018December 2018January 2019
February 2019February 2019March 2019March 2019

FINTECH INSIGHT
RAYMOND JAMES INVESTMENT BANKING 11
JULY 2020FINTECH INSIGHT
Investment Banking Role
Raymond James served as exclusive financial advisor to Orion on the merger with
Brinker and the Genstar and TA investment. Provided strategic advice in regards to
potential transaction opportunities in wake of volatility created by COVID-19 and
executed to align with key objectives.
On June 29, 2020, Orion (the “Company”) entered into a definitive agreement to merge with Brinker Capital with support from TA Associates and Genstar Capital
Advisory Case Study: Orion & Brinker merge with recapitalization by TA & Genstar
CLIENT DESCRIPTIONWealth management technology and turnkey asset management platform
DEAL SIZENot Announced
DATE ANNOUNCEDJune 29, 2020
Successful Outcome
The acquisition will allow SS&C to simplify wealth managers' operations with a one-
stop-shop for wealth and trust accounting and reporting. The transaction delivered a
quality outcome for Innovest’s shareholders.
Company Background
Orion Advisor Solutions, the premier provider of the tech-enabled fiduciary
framework that empowers financial advisors to Prospect, Plan, Invest and Achieve
within a single, connected experience; and Brinker Capital, a premier investment
management company serving advisors at insurance broker-dealers and independent
broker-dealers; will join forces to create a combined technology and TAMP provider
enabling independent financial advisors to grow their businesses, serve their clients
and win in the marketplace. Genstar Capital, a San Francisco-based private equity
firm, will invest in the combined business, as will Orion’s existing financial partner,
global growth private equity firm TA Associates.

FINTECH INSIGHT
RAYMOND JAMES INVESTMENT BANKING 12
JULY 2020FINTECH INSIGHT
Company Background
Innovest is a provider of scalable, SaaS-based solutions enabling trust companies,
banks, wealth managers and other asset stewards to invest, monitor, analyze and
service investment portfolios. Innovest’s flagship product, InnoTrust, offers
comprehensive accounting and tax reporting for assets held in trust, wealth and
retirement accounts, while seamlessly integrating with third-party software and
internal systems. The Company’s other products include InnoPay and Unique Assets.
The Company was founded in 2000 and is headquartered in New York, NY, with more
than 150 employees.
Investment Banking Role
Raymond James served as the exclusive financial advisor to Innovest in this
transaction. Worked closely with the Company's management team and shareholders
to execute a transaction that aligned with key objectives.
On April 30, 2020, Innovest (the “Company”) entered into a definitive agreement to be acquired by SS&C Technologies
Advisory Case Study: Innovest sale to SS&C
Successful Outcome
The acquisition will allow SS&C to simplify wealth managers' operations with a one-
stop-shop for wealth and trust accounting and reporting. The transaction delivered a
quality outcome for Innovest’s shareholders.
CLIENT DESCRIPTIONSaaS-based, trust accounting and investment management platform
DEAL SIZE$120,000,000
DATE ANNOUNCEDApril 30, 2020

FINTECH INSIGHT
RAYMOND JAMES INVESTMENT BANKING 13
JULY 2020FINTECH INSIGHT
Company Background
Docupace is the leading provider of SaaS-based, enterprise-grade solutions to digitize
wealth management operations for broker-dealers, RIAs (Registered Investment
Advisors) and financial advisors. Through its comprehensive suite of automation
solutions for front-to-back office operations, the Company helps wealth management
firms improve efficiency, increase margins and profits and ensure compliance with
state and federal regulations. The Company serves 90+ enterprise clients, including 7
of the top 10 U.S. independent brokers and 13 of the top 20 wealth management
advisors. Founded in 2002, Docupace is based in Los Angeles, California.
Investment Banking Role
Raymond James served as the exclusive financial advisor to Docupace in this
transaction. Worked closely with Docupace’s management team and board members
to design a customized process aligned with key objectives.
On April 28, 2020, Docupace (the “Company”) entered into a definitive agreement to be acquired by FTV Capital
Advisory Case Study: Docupace sale to FTV capital
Successful Outcome
This transaction will enable Docupace to invest in it’s product roadmap and penetrate
additional financial services markets. The sale process represents a quality outcome
for shareholders.
CLIENT DESCRIPTIONSaaS-based, enterprise-grade solutions to digitize wealth management operations
DEAL SIZENot Announced
DATE ANNOUNCEDApril 28, 2020

FINTECH INSIGHT
RAYMOND JAMES INVESTMENT BANKING 14
FINTECH M&A & CAPITAL RAISING ACTIVITY
FINTECH INSIGHT
RAYMOND JAMES INVESTMENT BANKING 15
JULY 2020
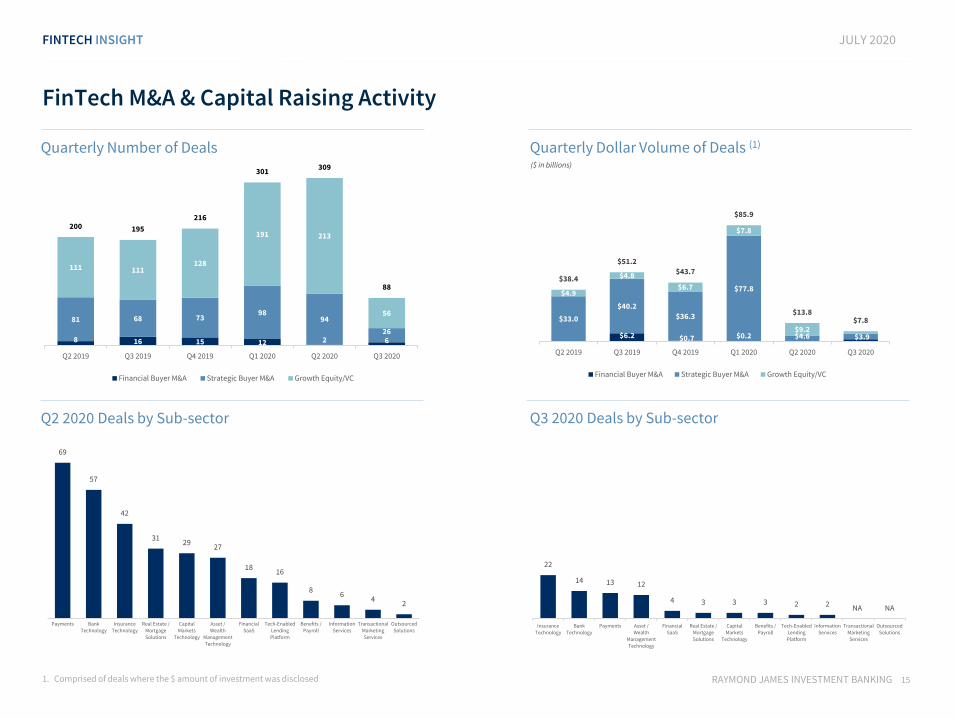
$6.2 $0.7 $0.2
$33.0
$40.2
$36.3
$77.8
$4.6 $3.9
$4.9
$4.8
$6.7
$7.8
$9.2
$38.4
$51.2
$43.7
$85.9
$13.8 $7.8
Q2 2019 Q3 2019 Q4 2019 Q1 2020 Q2 2020 Q3 2020
Financial Buyer M&A Strategic Buyer M&A Growth Equity/VC
8 16 15 12 2 6
81 68 73 98
94
26
111 111 128
191 213
56
200 195
216
301 309
88
Q2 2019 Q3 2019 Q4 2019 Q1 2020 Q2 2020 Q3 2020
Financial Buyer M&A Strategic Buyer M&A Growth Equity/VC
FinTech M&A & Capital Raising Activity
Quarterly Number of Deals Quarterly Dollar Volume of Deals (1)
($ in billions)
1. Comprised of deals where the $ amount of investment was disclosed
Q2 2020 Deals by Sub-sector Q3 2020 Deals by Sub-sector
69
57
42
3129
27
1816
86
42
Payments BankTechnology
InsuranceTechnology
Real Estate /MortgageSolutions
CapitalMarkets
Technology
Asset /Wealth
Management
Technology
FinancialSaaS
Tech-EnabledLendingPlatform
Benefits /Payroll
InformationServices
TransactionalMarketingServices
OutsourcedSolutions
22
14 13 12
4 3 3 3 2 2 NA NA
InsuranceTechnology
BankTechnology
Payments Asset /Wealth
Management
Technology
FinancialSaaS
Real Estate /MortgageSolutions
CapitalMarkets
Technology
Benefits /Payroll
Tech-EnabledLendingPlatform
InformationServices
TransactionalMarketingServices
OutsourcedSolutions

FINTECH INSIGHT
RAYMOND JAMES INVESTMENT BANKING 16
RECENT FINTECH TRANSACTION ACTIVITY

FINTECH INSIGHT
RAYMOND JAMES INVESTMENT BANKING 17
JULY 2020
ANNOUNCED DATE
BUYER TARGET SECTORTRANSACTION SIZE ($M)
COMMENTS
Jul-20Asset / Wealth Management Technology
ND
• Advisor Software provides wealth management cloud platforms for financial advisors and institutions
• The acquisition further enhances Refinitiv’s digital assets with digital portfolio analysis and advisory capabilities for the Wealth Management industry
Jul-20 Bank Technology ND
• Joust provides a banking platform that directly provides merchant services and business banking for the self-employed
• The acquisition expands the ZenBusiness service offering
Jul-20 Bank Technology ND
• Cognitect provides open source platform and customized solutions to businesses
• The acquisition allows Nubank to leverage Cognitect's expertise in remote work and gives it an edge in hiring more engineers and other professionals across geographies
Jul-20 Bank Technology ND
• Instantor provides data to help banks and financial technology firms improve their credit decisions through patented account aggregation technology
• The acquisition allows Tink to continue its European expansion and diversify their product offerings, as it makes Instantor’s products and services available to all its customers
Jul-20 Bank Technology ND
• AllTrust provides biometric check cashing software and services like electronic deposits, government compliance, bill payment services, maker research and check guarantee solutions
• The acquisition allows Valsoft to expand its financial services portfolio by entering the check cashing vertical
Jul-20Capital Markets Technology
$288
• NINE provides users with a digital currency trading platform
• The acquisition will allow Digital Currency Group leverage NINE's platform technology to improve its platform efficiency
Jul-20Capital Markets Technology
ND
• FormulaFolios provides financial management and investment advisory solutions
• The acquisition will allow Brookstone to create one of the largest RIAs catering to independent retirement advisors
Selected Recent Strategic Buyer M&A Activity

FINTECH INSIGHT
RAYMOND JAMES INVESTMENT BANKING 18
JULY 2020
ANNOUNCED DATE
BUYER TARGET SECTORTRANSACTION SIZE ($M)
COMMENTS
Jul-20Capital Markets Technology
ND
• Sustainalytics provides investment research services regarding environmental, social and governance (ESG) and corporate governance rating, research and analysis
• The acquisition will widen the opportunity set of Morningstar for sustainable investing at every level and across asset classes to drive meaningful, long-term outcomes for investors
Jul-20Insurance Technology
$365
• EPSi provides financial decision support and planning tools for hospitals and health systems
• The acquisition will accelerate Strata Decision's innovation to provide broader and deeper solutions to help its customers
Jul-20Insurance Technology
ND
• HK Financial Services provides technology-enabled financial solutions to consumers, small businesses and tax professionals
• The acquisition significantly increase Blucora’s total addressable market, extending the Company’s presence in the fast-growing captive RIA segment and improving conversion of CPA prospects
Jul-20Information Services
ND
• Ansonia provides Business credit reporting services and related technology products
• The acquisition provides Equifax with a source of customized intelligence to meet the needs of capital providers who extend credit to transportation and logistics companies
Jul-20AI Insurance Business
Insurance Technology
$400
• Tulco's AI Insurance business provides insurance brokerage services by using a combination of data science, AI and machine learning
• The acquisition allows Acrisure to leverage Tulco's AI capabilities to innovate its product development and insurance sales and marketing across its portfolio of Agency Partners
Jul-20Insurance Technology
$20
• Delphi Technology provides software solutions to property & casualty (P&C) insurers
• The acquisition will accelerate Sapien's North American expansion in the medical professional liability market
Jul-20Insurance Technology
ND
• Brolly helps customers consolidate and manage all of their insurances in one easy to use mobile application
• The acquisition will accelerate Direct Line Group's transformation to become a leading digital player in insurance
Selected Recent Strategic Buyer M&A Activity

FINTECH INSIGHT
RAYMOND JAMES INVESTMENT BANKING 19
JULY 2020
ANNOUNCED DATE
BUYER TARGET SECTORTRANSACTION SIZE ($M)
COMMENTS
Jul-20Insurance Technology
ND
• Virtual MGA provides cloud based binding authority underwriting and distribution solutions
• The acquisition expands Insurity’s cloud based system offerings for the managing general agent (MGA) and broker markets
Jul-20Insurance Technology
$600
• SulAmérica provides both life and health insurance as well as pension plans
• The acquisition will advance Allianz's position in the South American Property Casualty market and will provide an opportunity to deploy digital technologies for local brokers and customers
Jul-20Insurance Technology
$38
• Liveoak Technologies provides a secure agreement-collaboration and cloud-based platform
• The acquisition accelerates the launch of DocuSign Notary, a new product in the Agreement Cloud suite that focuses on remote online notarization
Jul-20Insurance Technology
$288
• DPO group provides a cloud based payment processing platform that support multiple transaction types with online and offline capabilities for consumers
• The acquisition of DPO Group will support Network International’s capabilities in Africa across online, mobile and alternative payments
Jul-20 Payments ND
• Burgess provides a payment integrity software that is focused on improving healthcare payment operations through technology
• The acquisition will allow HealthEdge to enter the large, high-growth market of payment integrity, helping address the estimated $1 trillion in wasteful spending in the US healthcare system
Jul-20 Payments ND
• Stitch Labs provides an operations management platform for brands to manage inventory and order management, channel management and fulfillment
• The acquisition will advance Square’s set of services and tools for merchants
Jul-20 Payments ND
• Paysafe pay Later provides white-labeled deferred payment solutions for online merchants and brick-and-mortar retailers
• The acquisition will help Heidelpay expand its European presence and deferred payments offering for merchants
Selected Recent Strategic Buyer M&A Activity

FINTECH INSIGHT
RAYMOND JAMES INVESTMENT BANKING 20
JULY 2020
ANNOUNCED DATE
BUYER TARGET SECTORTRANSACTION SIZE ($M)
COMMENTS
Jul-20 Payments ND
• Korta provides merchants with a range of in-store and digital payment acceptance solutions
• The acquisition will allow Rapyd to extend Korta’s existing capabilities by enabling Icelandic and European businesses to quickly and easily accept a broad range of international payment methods
Jul-20Real Estate / Mortgage Solutions
$1,800
• Optimal Blue provides an online mortgage marketplace that connects mortgage originators with secondary investors
• The acquisition will help Black Knight to expand Its origination offerings
Jul-20Real Estate / Mortgage Solutions
ND
• Vouch provides a fully automated web based system to improve efficiency in the tenant application process, including contract generation, digital payments, referencing, insurance and distribution of legal documents
• The acquisition will allow both Goodlord and Vouch to develop a wider choice of services, provide interoperability between their two platforms and integrate their API across all products
Jul-20Real Estate / Mortgage Solutions
ND
• LandTech provides real estate settlement software and closing applications for the title, escrow and financial industry
• The acquisition increases AccuTitle's client base to over 2,000 title organizations and adds key states to its offering
Jul-20Tech-Enabled Lending Platform
$90
• On Deck provides an online platform that offers term loans, line of credit loans and equipment finance loans to small businesses
• The acquisition will enable Enova to create a new company by combining the two complementary businesses with capabilities in consumer and small business online lending
Selected Recent Strategic Buyer M&A Activity
FINTECH INSIGHT
RAYMOND JAMES INVESTMENT BANKING 21
JULY 2020
ANNOUNCED DATE
BUYER TARGET SECTORTRANSACTION SIZE ($M)
COMMENTS
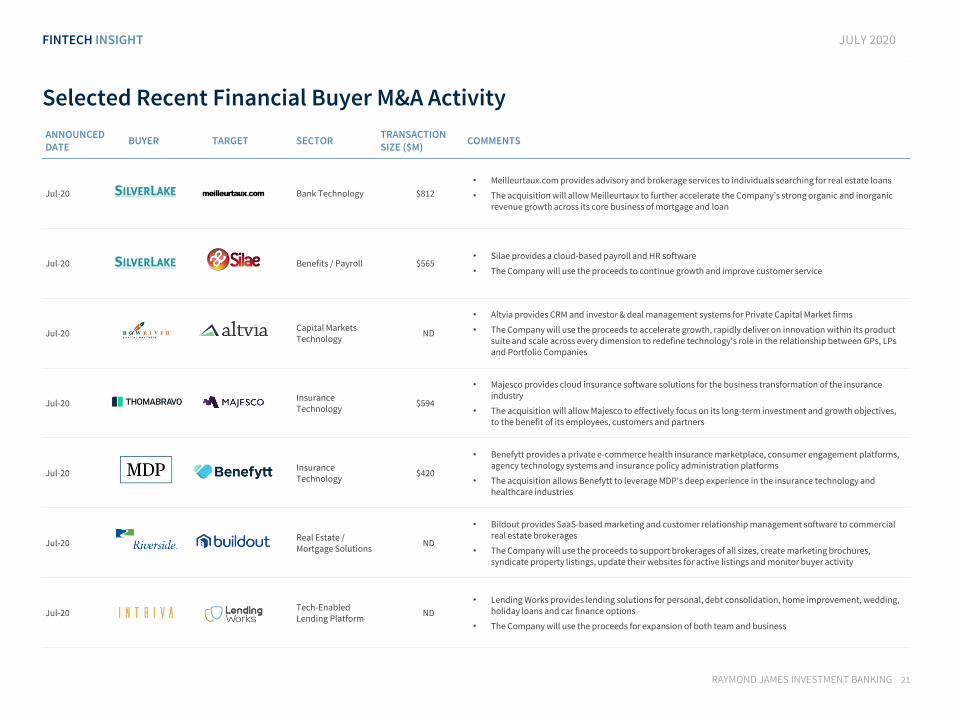
Jul-20 Bank Technology $812
• Meilleurtaux.com provides advisory and brokerage services to individuals searching for real estate loans
• The acquisition will allow Meilleurtaux to further accelerate the Company’s strong organic and inorganic revenue growth across its core business of mortgage and loan
Jul-20 Benefits / Payroll $565 • Silae provides a cloud-based payroll and HR software
• The Company will use the proceeds to continue growth and improve customer service
Jul-20Capital Markets Technology
ND
• Altvia provides CRM and investor & deal management systems for Private Capital Market firms
• The Company will use the proceeds to accelerate growth, rapidly deliver on innovation within its product suite and scale across every dimension to redefine technology's role in the relationship between GPs, LPs and Portfolio Companies
Jul-20Insurance Technology
$594
• Majesco provides cloud insurance software solutions for the business transformation of the insurance industry
• The acquisition will allow Majesco to effectively focus on its long-term investment and growth objectives, to the benefit of its employees, customers and partners
Jul-20Insurance Technology
$420
• Benefytt provides a private e-commerce health insurance marketplace, consumer engagement platforms, agency technology systems and insurance policy administration platforms
• The acquisition allows Benefytt to leverage MDP's deep experience in the insurance technology and healthcare industries
Jul-20Real Estate / Mortgage Solutions
ND
• Bildout provides SaaS-based marketing and customer relationship management software to commercial real estate brokerages
• The Company will use the proceeds to support brokerages of all sizes, create marketing brochures, syndicate property listings, update their websites for active listings and monitor buyer activity
Jul-20Tech-Enabled Lending Platform
ND
• Lending Works provides lending solutions for personal, debt consolidation, home improvement, wedding, holiday loans and car finance options
• The Company will use the proceeds for expansion of both team and business
Selected Recent Financial Buyer M&A Activity

FINTECH INSIGHT
RAYMOND JAMES INVESTMENT BANKING 22
JULY 2020
Selected Recent Growth Equity / Venture Capital Activity
ANNOUNCED DATE
INVESTOR TARGET SECTORTRANSACTION SIZE ($M)
COMMENTS
Jul-20Asset / Wealth Management Technology
$80
• Guideline provides technology solution that automates retirement plan administration and compliance for businesses
• The Company will use the proceeds to accelerate growth
Jul-20Asset / Wealth Management Technology
$11
• Magnetis provides a digital solutions for individuals to build long-term investment plans
• The Company will use the proceeds to launch its own brokerage and develop new functionalities that improve customer experience through goal-based investments
Jul-20Asset / Wealth Management Technology
$35
• True Link provides digital financial services to retirees by protecting and increasing their independence and quality of life
• The Company will use the proceeds to continue hiring mission-aligned talent, to serve more families and individuals and explore new products in the insurance and credit
Jul-20Asset / Wealth Management Technology
$16
• StashAway provides personalized investment and cash management portfolios for both retail and accredited investors
• The Company will use the proceeds to accelerate product development and deepen its wealth management offering
Jul-20 Multiple InvestorsAsset / Wealth Management Technology
$58
• Scalable Capital provides a digital investment service which uses proprietary software to offer portfolios which are dynamically optimized with a primary focus on risk management
• The Company will use the proceeds to expand its position as the market leader in digital wealth management and to reach new customer segments with the broker
Jul-20 Multiple InvestorsAsset / Wealth Management Technology
$38
• Moneybox provides a mobile application with a range of savings and investment products including lifetime ISAs and pensions
• The Company will use the proceeds to build on its product offering, invest in new technology and scale the team
Jul-20Asset / Wealth Management Technology
$13• CircleBlack provides enterprise software solutions for wealth management firms
• The Company will use the proceeds to accelerate its growth and expansion

FINTECH INSIGHT
RAYMOND JAMES INVESTMENT BANKING 23
JULY 2020
Selected Recent Growth Equity / Venture Capital Activity
ANNOUNCED DATE
INVESTOR TARGET SECTORTRANSACTION SIZE ($M)
COMMENTS
Jul-20Asset / Wealth Management Technology
$23
• Warren provides a digital platform that offers investment advice alongside the ability to self-service investment products
• The Company will use the proceeds to continue hiring staff and develop new solutions
Jul-20Asset / Wealth Management Technology
$320
• Robinhood provides online and mobile application-based discount stock brokerage services to self-directed investors
• The Company will use the proceeds to hire more employees, build new products and improve operations
Jul-20 Individual InvestorsAsset / Wealth Management Technology
$3 • Icon offers easy, low cost retirement savings plans for businesses and individuals
• The Company will use the proceeds to expand its operations and business reach
Jul-20Asset / Wealth Management Technology
$111
• Nest Wealth provides an online SaaS- based platform for investment advisory services to advisors, firms and employees
• The Company will use the proceeds to provide improved digital wealth solutions to its clients
Jul-20 Bank Technology $50 • ComplyAdvantage provides Artificial Intelligence-driven financial crime risk data and detection technology
• The Company will use the proceeds toward rapid product and market expansion across the globe
Jul-20 Bank Technology $42
• Thought Machine provides cloud native core banking technology platform
• The Company will use the proceeds to invest in growing its business at international scale, hiring key roles in APAC, US and Australia and develop new products and features, including its upcoming advanced payments solution
Jul-20 Bank Technology $80
• Revolut provides financial services that specializes in mobile banking, card payments, money remittance and foreign exchange
• The Company will use the proceeds to add new features in the U.S. and roll out banking operations across Europe
FINTECH INSIGHT
RAYMOND JAMES INVESTMENT BANKING 24
JULY 2020
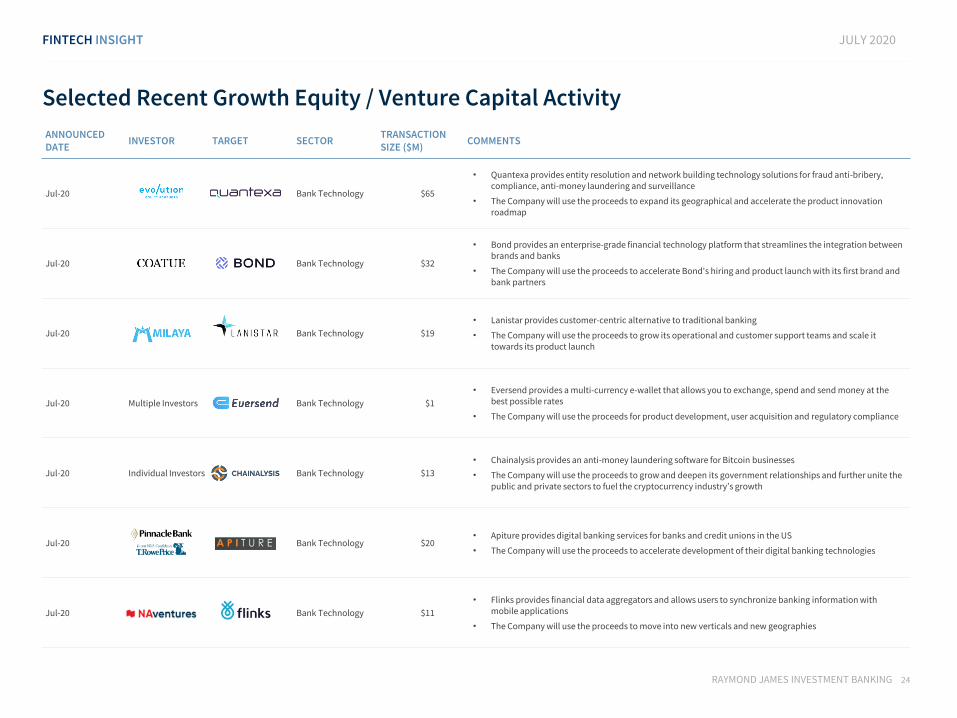
Selected Recent Growth Equity / Venture Capital Activity
ANNOUNCED DATE
INVESTOR TARGET SECTORTRANSACTION SIZE ($M)
COMMENTS
Jul-20 Bank Technology $65
• Quantexa provides entity resolution and network building technology solutions for fraud anti-bribery, compliance, anti-money laundering and surveillance
• The Company will use the proceeds to expand its geographical and accelerate the product innovation roadmap
Jul-20 Bank Technology $32
• Bond provides an enterprise-grade financial technology platform that streamlines the integration between brands and banks
• The Company will use the proceeds to accelerate Bond's hiring and product launch with its first brand and bank partners
Jul-20 Bank Technology $19
• Lanistar provides customer-centric alternative to traditional banking
• The Company will use the proceeds to grow its operational and customer support teams and scale it towards its product launch
Jul-20 Multiple Investors Bank Technology $1
• Eversend provides a multi-currency e-wallet that allows you to exchange, spend and send money at the best possible rates
• The Company will use the proceeds for product development, user acquisition and regulatory compliance
Jul-20 Individual Investors Bank Technology $13
• Chainalysis provides an anti-money laundering software for Bitcoin businesses
• The Company will use the proceeds to grow and deepen its government relationships and further unite the public and private sectors to fuel the cryptocurrency industry’s growth
Jul-20 Bank Technology $20 • Apiture provides digital banking services for banks and credit unions in the US
• The Company will use the proceeds to accelerate development of their digital banking technologies
Jul-20 Bank Technology $11
• Flinks provides financial data aggregators and allows users to synchronize banking information with mobile applications
• The Company will use the proceeds to move into new verticals and new geographies

FINTECH INSIGHT
RAYMOND JAMES INVESTMENT BANKING 25
JULY 2020
Selected Recent Growth Equity / Venture Capital Activity
ANNOUNCED DATE
INVESTOR TARGET SECTORTRANSACTION SIZE ($M)
COMMENTS
Jul-20 Benefits / Payroll $25
• Wagestream provides an app that allows employees to stream earned wages into their accounts, giving them the chance to monitor when they’re paid
• The Company will use the proceeds to continue to expand operations and its business reach internationally
Jul-20Capital Markets Technology
$25
• Circle provides stocks and securities underwriting services which is built on blockchain technology and powered by crypto assets
• The Company will use the proceeds to enhance its suite of products and launch some new ones
Jul-20 Financial SaaS $20
• EMQ provides a cross-border financial settlement solution for businesses around the world, while adhering to compliance standards in different markets operates
• The Company will use the proceeds to further accelerate its international growth, product development and licensing activities across Asia, Europe and the Americas
Jul-20 Financial SaaS $10 • Plum provides a artificial intelligence (AI) based money tracking application for customers
• The Company will use the proceeds to grow its workforce and expand its operation across Europe
Jul-20 Financial SaaS $8• Jirav provides a financial forecasting and analytics software for small business finance companies
• The Company will use the proceeds to improve its platform offerings
Jul-20Information Services
$19 • Mediant provides investor communications solutions to brokers, corporate issuers and funds
• The Company will use the proceeds to invest in its technology and solution offerings for clients
Jul-20Insurance Technology
$32
• Jupiter provides a platform which offer weather and climate data, trend visualizations, forecasts, weather models, climate models, analytics and risk assessments of weather and climate conditions
• The Company will use the proceeds for aggressive expansion of its operations and increase product development

FINTECH INSIGHT
RAYMOND JAMES INVESTMENT BANKING 26
JULY 2020
Selected Recent Growth Equity / Venture Capital Activity
ANNOUNCED DATE
INVESTOR TARGET SECTORTRANSACTION SIZE ($M)
COMMENTS
Jul-20Insurance Technology
$20• Sidecar Health provides customized health care insurance services and plans
• The Company will use the proceeds to accelerate its growth and make healthcare accessible to consumers
Jul-20 Multiple InvestorsInsurance Technology
$6
• Claim Genius provides AI-based claims solutions for the auto insurance industry using its patent-pending image analysis and predictive analytics tools
• The Company will use the proceeds to further scale its sales and development efforts and facilitate the launch of the new products for the auto claims market worldwide
Jul-20Insurance Technology
$5
• Safehub provides software solutions that offers real-time risk and damage assessment of buildings, as well as manages insurance programs and supports crisis management
• The Company will use the proceeds to accelerate deployment to Fortune 500 companies seeking to strengthen their business continuity and resilience efforts
Jul-20Insurance Technology
$24• Branch provides innovative Home and Auto Insurance technology solutions
• The Company will use the proceeds to expand operations and its business reach nationwide
Jul-20 Multiple InvestorsInsurance Technology
$150
• Hippo provides a home insurance products which come with a smart home device kit and coverage for possessions like appliances, electronics and home offices
• The Company will use the proceeds to accelerate expansion, make key hiring additions, invest in its technology operations and make a proposed acquisition of a national insurance carrier
Jul-20Insurance Technology
$12
• Sibros provides a platform that connects and manages all vehicle software inventory for the automotive and mobility companies
• The Company will use the proceeds to expand its product offerings, customer engagement and core teams in Silicon Valley and beyond
Jul-20Insurance Technology
$3 • Evertas provides insurance services to protect holders of cryptoassets and users of blockchain systems
• The Company will use the proceeds to support its growth plans

FINTECH INSIGHT
RAYMOND JAMES INVESTMENT BANKING 27
JULY 2020
Selected Recent Growth Equity / Venture Capital Activity
ANNOUNCED DATE
INVESTOR TARGET SECTORTRANSACTION SIZE ($M)
COMMENTS
Jul-20Insurance Technology
$6
• Concirrus provides a SaaS-based platform offering behavioral data analytics and risk assessment solutions for the insurance industry
• The Company will use the proceeds to expand operations and its business reach
Jul-20Insurance Technology
$10
• MākuSafe provides an insurtech SaaS/data & analytics platform to improve worker health, safety and productivity
• The Company will use the proceeds to grow their team and deploy technology to customers across North America
Jul-20Undisclosed Investor
Insurance Technology
$3
• Foxquilt provides small businesses and B2B networks with an insurance SaaS platform and a proprietary underwriting infrastructure
• The Company will use the proceeds to continue to innovate on their technology and data science offerings
Jul-20Insurance Technology
$6
• Verikai provides underwriters and brokers with risk reports designed to solve their underwriting problems and increase revenue
• The Company will use the proceeds to increase their sales and marketing resources
Jul-20Insurance Technology
$130
• Policybazaar provides insurance software which allows their customers to access life insurance, health insurance, car insurance, two-wheeler insurance and other insurance plans
• The Company will use the proceeds to accelerate growth
Jul-20 Multiple InvestorsInsurance Technology
$7
• FraudScope provides an automated intelligence software platform for healthcare fraud, waste and abuse applications
• The Company will use the proceeds to scale the team and expand product offerings
Jul-20Insurance Technology
$5
• AgencyKPI provides a business intelligence platform for insurance networks, independent agencies and insurers
• The Company will use the proceeds to hire more software developers and data scientists to accelerate the development of its additional business intelligence platforms
FINTECH INSIGHT
RAYMOND JAMES INVESTMENT BANKING 28
JULY 2020
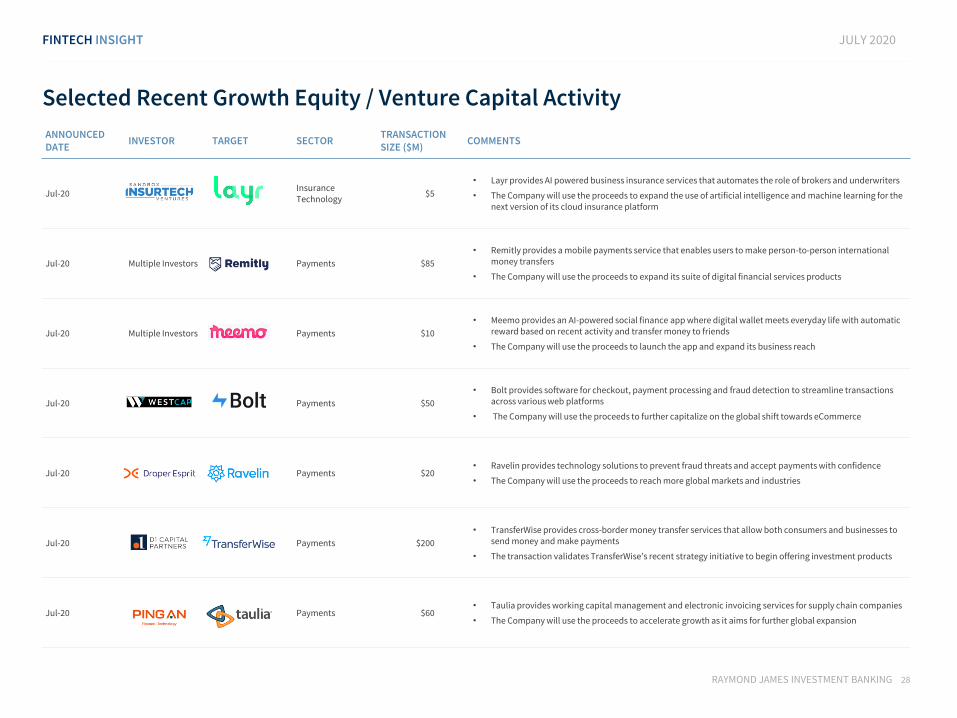
Selected Recent Growth Equity / Venture Capital Activity
ANNOUNCED DATE
INVESTOR TARGET SECTORTRANSACTION SIZE ($M)
COMMENTS
Jul-20Insurance Technology
$5
• Layr provides AI powered business insurance services that automates the role of brokers and underwriters
• The Company will use the proceeds to expand the use of artificial intelligence and machine learning for the next version of its cloud insurance platform
Jul-20 Multiple Investors Payments $85
• Remitly provides a mobile payments service that enables users to make person-to-person international money transfers
• The Company will use the proceeds to expand its suite of digital financial services products
Jul-20 Multiple Investors Payments $10
• Meemo provides an AI-powered social finance app where digital wallet meets everyday life with automatic reward based on recent activity and transfer money to friends
• The Company will use the proceeds to launch the app and expand its business reach
Jul-20 Payments $50
• Bolt provides software for checkout, payment processing and fraud detection to streamline transactions across various web platforms
• The Company will use the proceeds to further capitalize on the global shift towards eCommerce
Jul-20 Payments $20 • Ravelin provides technology solutions to prevent fraud threats and accept payments with confidence
• The Company will use the proceeds to reach more global markets and industries
Jul-20 Payments $200
• TransferWise provides cross-border money transfer services that allow both consumers and businesses to send money and make payments
• The transaction validates TransferWise’s recent strategy initiative to begin offering investment products
Jul-20 Payments $60 • Taulia provides working capital management and electronic invoicing services for supply chain companies
• The Company will use the proceeds to accelerate growth as it aims for further global expansion

FINTECH INSIGHT
RAYMOND JAMES INVESTMENT BANKING 29
JULY 2020
Selected Recent Growth Equity / Venture Capital Activity
ANNOUNCED DATE
INVESTOR TARGET SECTORTRANSACTION SIZE ($M)
COMMENTS
Jul-20 Payments $3
• Swap provides a basic infrastructure for financial players to easily create payments tools and compliantly issue prepaid cards
• The Company will use the proceeds to continue to expand operations and its development efforts
Jul-20 Multiple Investors Payments $1
• Payaut provides PSD2-compliant payment solutions for online marketplaces that allow customers to automate the payment process
• The Company will use the proceeds to help online businesses to easily comply with new regulations, while maintaining usage of multiple Payment Service Providers (“PSPs”)
Jul-20 Payments $53
• PAYFAZZ provides an agency-based financial platform that facilitates digital transactions and payments
• The Company will use the proceeds to expand its reach and give more Indonesians access to financial services
Jun-20 Payments $3 • Willa provides payments solutions that allow freelancers to easily accept payments in a timely manner
• The Company will use the proceeds to expand operations and fuel the sales and marketing engine
Jun-20Real Estate / Mortgage Solutions
$9• JetClosing provides a software application for the real estate closing process
• The Company will use the proceeds to fuel continued expansion
Jul-20Real Estate / Mortgage Solutions
$7
• MeetElise provides artificial intelligence-powered leasing agent software for real estate leasing industry
• The Company will use the proceeds for product innovation, expansion of the offering to small and midsize property management companies and recruiting efforts
Jun-20Tech-Enabled Lending Platform
$15
• Selina provides credit facilities up to £1 million which allow SMEs and consumers to borrow against the equity tied up in their homes or investment property
• The Company will use the proceeds to accelerate its growth plans and invest in technology

FINTECH INSIGHT
RAYMOND JAMES INVESTMENT BANKING 30
JULY 2020
CLOSEDDATE
INVESTOR COMPANY SECTOR PURPOSEOFFERING SIZE ($M)
OFFER PRICE
Jul-20 Payments Corporate Purposes $389 $155.91
Jun-20 Benefits / Payroll Corporate Purposes 80 15.00
May-20 Asset / Wealth Management Technology Corporate Purposes 100 NA
Apr-20 Payments Corporate Purposes 152 1,000.00
Apr-20 Bank Technology Corporate Purposes 100 NA
Mar-20 Multiple Investors Insurance Technology Corporate Purposes 82 13.26
Feb-20 Multiple Investors Capital Markets Technology (Trading) Corporate Purposes 101 8.78
Dec-19 Insurance Technology Corporate Purposes 252 7.61
Nov-19 Payments Corporate Purposes 135 225.03
Selected Recent PIPE Activity

FINTECH INSIGHT
RAYMOND JAMES INVESTMENT BANKING 31
JULY 2020
OFFER PRICE TO:
PRICING DATE COMPANY SECTOROFFER TYPE
OFFERING SIZE ($M)
OFFER PRICE ONE-DAY ONE-WEEKJUL
31, 2020
Jul-20 Payments IPO $266 $5.32 (1.7%) NA (0.2%)
Jul-20 Bank Technology IPO 250 28.95 216.4% 159.0% 173.2%
Jul-20 Information Services IPO 1,723 21.01 20.7% 26.1% 21.4%
Jun-20 Payments IPO 345 21.62 55.1% 60.7% 77.2%
May-20 Payments Follow-On 160 20.00 3.1% 18.4% 10.7%
May-20 Bank Technology Follow-On 813 9.23 8.5% 28.1% 37.1%
May-20 Insurance Technology IPO 570 18.90 42.9% 50.5% (5.3%)
May-20 Real Estate / Mortgage Solutions Follow-On 300 57.16 10.8% 17.5% 10.2%
Apr-20 Capital Markets Technology (Trading) Follow-On 560 48.79 5.0% 9.6% 10.8%
Apr-20 Payments Follow-On 102 0.08 4.8% 6.4% 174.2%
Apr-20 Information Services Follow-On 1,245 4.97 9.4% 6.5% (2.2%)
Apr-20 Insurance Technology Follow-On 760 5.14 8.3% (2.5%) 38.2%
Mar-20 Bank Technology Follow-On 99 0.97 33.2% 56.7% 65.7%
Mar-20 Payments IPO 1,395 10.17 (9.5%) (25.1%) (4.6%)
Mar-20 Insurance Technology Follow-On 238 115.00 4.3% 16.5% (39.9%)
Feb-20 Payments Follow-On 215 27.91 (7.2%) (12.4%) 1.2%
Jan-20 Real Estate / Mortgage Solutions IPO 94 13.00 3.9% 4.9% (71.5%)
Dec-19 Bank Technology IPO 312 10.00 0.0% (1.5%) 139.2%
Dec-19 Payments IPO 216 22.00 61.4% 73.6% 323.2%
Dec-19 Financial SaaS Follow-On 202 26.00 10.3% 0.3% 15.6%
Selected Recent Public Equity Activity

FINTECH INSIGHT
RAYMOND JAMES INVESTMENT BANKING 32
JULY 2020
Selected Recent Debt FinancingsRATINGS
ANNOUNCEMENTDATE
COMPANY SECTOR PURPOSE MOODY’S S&P SIZE ($M) COUPON
Jul-20 Payments Corporate Purposes NA NA $739 NA
Jun-20 Payments Corporate Purposes Baa2 BBB 563 NA
Jun-20 Financial SaaS Corporate Purposes NA NA 1,200 NA
May-20 Real Estate / Mortgage Solutions Corporate Purposes NA NA 345 NA
May-20 Bank Technology Corporate Purposes Baa2 BBB 2,000 T+170
May-20 Payments Corporate Purposes A3 BBB+ 4,000 T+115
May-20 Payments Corporate Purposes Baa3 BBB- 750 T+230
Apr-20 Bank Technology Corporate Purposes B3 B- 400 T+762
Mar-20 Payments Corporate Purposes Aa3 AA- 4,000 T+140
Mar-20 Payments Corporate Purposes A1 A+ 1,500 T+255
Dec-19 Asset / Wealth Management Technology Corporate Purposes Baa1 BBB+ 750 T+115
Dec-19 Information Services Corporate Purposes Ba2 BB+ 350 NA
Nov-19 Payments Corporate Purposes A1 A+ 750 T+43
Aug-19 Insurance Technology Acquisition B2 B 1,100 NA
Jul-19 Asset / Wealth Management Technology Corporate Purposes Ba3 BB- 1,153 L+250
Apr-19 Tech-Enabled Lending Platforms Corporate Purposes Aa2 AA 700 L+0
Oct-18 Asset / Wealth Management Technology Refinancing B1 BB+ 250 L+0
Sep-18 Information Services Buyout B3 BBB+ 13,500 L+400-425
Aug-18 Asset / Wealth Management Technology Corporate Purposes Ba3 BB- 310 NA
Aug-18 Payments Buyout B3 B 2,200 L+400
A credit rating of a security is not a recommendation to buy, sell or hold securities and may be subject to review, revisions, suspension, reduction or withdrawal at any time by the assigning rating agency.

FINTECH INSIGHT
RAYMOND JAMES INVESTMENT BANKING 33
FINTECH TRADINGANALYSIS

FINTECH INSIGHT
RAYMOND JAMES INVESTMENT BANKING 34
JULY 2020
Trading Analysis
(USD in millions)
Trading PerformanceEnterprise Value /
RevenueEnterprise Value /
EBITDA P / E Revenue Growth EBITDA Margin Long Term EPS
GrowthPEG
RatioSector1 YTD 1 Year 3 Year 5 Year 2020E 2021E 2020E 2021E 2020E 2021E 2020E 2021E 2020E 2021E
Information Services 13.5% 18.3% 77.7% 126.3% 8.5x 7.9x 21.0x 19.5x 31.6x 29.6x 4.6% 5.6% 34.3% 35.1% 10.2% 3.5
Capital Markets Technology (Liquidity Venues) 13.5% 25.2% 74.9% 112.2% 10.4x 9.9x 16.5x 16.1x 23.6x 23.2x 10.0% 3.1% 60.1% 60.4% 10.5% 2.9
Benefits / Payroll (8.0%) (7.3%) 49.4% 86.9% 6.6x 6.5x 18.9x 16.4x 36.9x 31.1x 2.4% 7.0% 26.1% 27.4% 12.4% 3.2
Bank Technology (3.3%) 9.8% 60.4% 142.5% 9.6x 8.9x 21.0x 18.4x 32.8x 27.6x 2.1% 8.6% 37.3% 39.2% 13.0% 2.9
Asset / Wealth Management Technology (6.6%) (5.0%) (6.8%) 74.2% 4.1x 3.9x 16.6x 14.8x 25.5x 22.6x 1.9% 7.2% 27.0% 29.2% 13.0% 1.7
Financial SaaS 10.1% 15.9% 123.3% 114.5% 10.2x 8.9x 27.7x 24.5x 40.7x 34.8x 12.1% 14.0% 25.4% 24.5% 17.5% 3.2
Insurance Technology 5.9% 18.0% 72.9% 115.1% 4.4x 4.0x 16.7x 14.9x 24.9x 22.8x 6.2% 6.6% 23.7% 24.2% 9.6% 2.9
Capital Markets Technology (Trading) (19.2%) (3.2%) 23.8% 5.5% 3.0x 4.7x 7.1x 9.3x 10.6x 11.5x 0.8% (1.0%) 42.2% 42.2% 10.0% 2.3
Payments (9.3%) (7.3%) 50.5% 67.0% 5.8x 5.3x 18.1x 13.8x 30.9x 22.2x 4.3% 10.4% 31.3% 32.5% 13.1% 2.5
Real Estate / Mortgage Solutions (9.5%) (13.2%) 5.4% (17.2%) 2.2x 2.0x 10.7x 9.1x 18.0x 16.8x 1.6% 7.8% 17.1% 19.6% 10.8% 2.1
Outsourced Solutions (4.4%) (0.1%) 26.0% 42.4% 2.1x 2.0x 12.0x 11.2x 18.4x 16.7x (0.1%) 4.0% 18.1% 18.7% 8.7% 2.3
Transactional Marketing Services (30.4%) (26.1%) (4.7%) (16.7%) 1.5x 1.8x 15.3x 12.0x 22.1x 24.5x 3.0% 4.3% 12.6% 14.7% 14.5% 1.4
Overall Median (5.5%) (1.7%) 50.0% 80.5% 5.1x 5.0x 16.6x 14.8x 25.2x 23.0x 2.7% 6.8% 26.6% 28.3% 11.6% 2.7
Sector Summary
Source: Capital IQ as of market close on Jul 31, 2020.
Note: Sectors sorted by Enterprise Value.
1. Denotes sector median value.

FINTECH INSIGHT
RAYMOND JAMES INVESTMENT BANKING 35
JULY 2020
Relative Stock Price Performance by Sector
Year-to-Date Performance One-Year Performance
Three-Year Performance Five-Year Performance
Source: Capital IQ as of market close on Jul 31, 2020.
Data represents median performance for each sector.
13.5% 13.5%10.1%
5.9%
(3.3%) (4.4%)(6.6%) (8.0%) (9.3%) (9.5%)
(19.2%)
(30.4%)
(50.0%)
(40.0%)
(30.0%)
(20.0%)
(10.0%)
0.0%
10.0%
20.0%
30.0%
40.0%
InformationServices
CapitalMarkets
Technology(LiquidityVenues)
Financial SaaS InsuranceTechnology
BankTechnology
OutsourcedSolutions
Asset / WealthManagement
Technology
Benefits /Payroll
Payments Real Estate /Mortgage
Solutions
CapitalMarkets
Technology(Trading)
TransactionalMarketing
Services
25.2%
18.3% 18.0%15.9%
9.8%
(0.1%)(3.2%) (5.0%)
(7.3%) (7.3%)
(13.2%)
(26.1%)
(50.0%)
(40.0%)
(30.0%)
(20.0%)
(10.0%)
0.0%
10.0%
20.0%
30.0%
40.0%
CapitalMarkets
Technology(LiquidityVenues)
InformationServices
InsuranceTechnology
Financial SaaS BankTechnology
OutsourcedSolutions
CapitalMarkets
Technology(Trading)
Asset / WealthManagement
Technology
Benefits /Payroll
Payments Real Estate /Mortgage
Solutions
TransactionalMarketing
Services
123.3%
77.7% 74.9% 72.9%
60.4%50.5% 49.4%
26.0% 23.8%
5.4%
(4.7%) (6.8%)
(60.0%)
(10.0%)
40.0%
90.0%
140.0%
190.0%
Financial SaaS InformationServices
CapitalMarkets
Technology(Liquidity
Venues)
InsuranceTechnology
BankTechnology
Payments Benefits /Payroll
OutsourcedSolutions
CapitalMarkets
Technology(Trading)
Real Estate /MortgageSolutions
TransactionalMarketingServices
Asset / WealthManagementTechnology
142.5%
126.3%115.1% 114.5% 112.2%
86.9%
74.2%67.0%
42.4%
5.5%
(16.7%) (17.2%)
(60.0%)
(10.0%)
40.0%
90.0%
140.0%
190.0%
BankTechnology
InformationServices
InsuranceTechnology
Financial SaaS CapitalMarkets
Technology(Liquidity
Venues)
Benefits /Payroll
Asset / WealthManagementTechnology
Payments OutsourcedSolutions
CapitalMarkets
Technology(Trading)
TransactionalMarketingServices
Real Estate /MortgageSolutions
FINTECH INSIGHT
RAYMOND JAMES INVESTMENT BANKING 36
JULY 2020
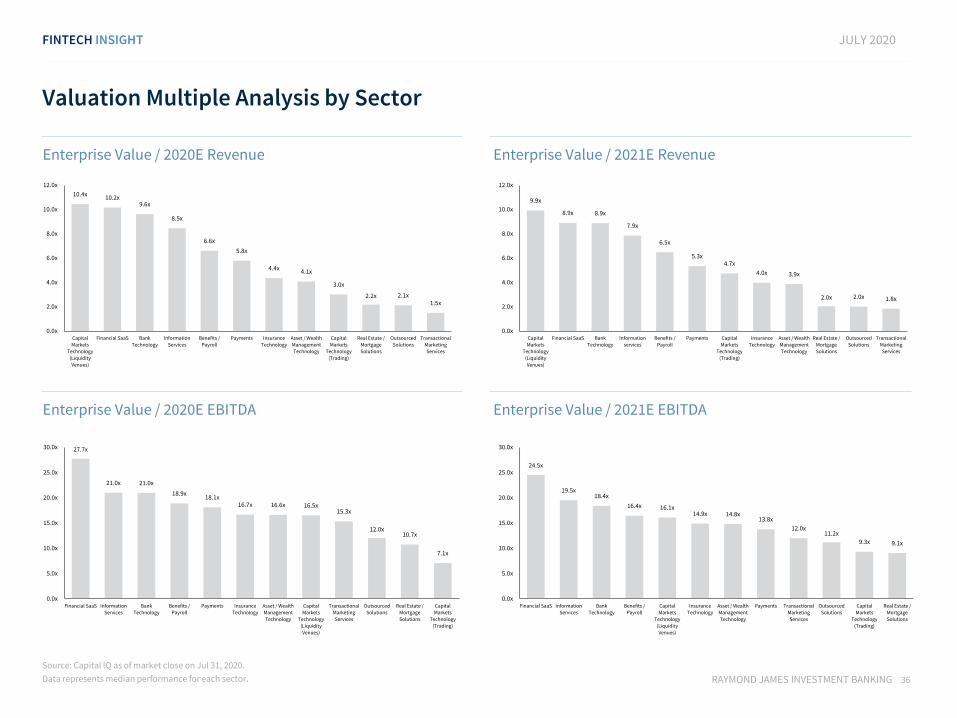
Valuation Multiple Analysis by Sector
Enterprise Value / 2020E Revenue Enterprise Value / 2021E Revenue
Enterprise Value / 2020E EBITDA Enterprise Value / 2021E EBITDA
Source: Capital IQ as of market close on Jul 31, 2020.
Data represents median performance for each sector.
10.4x10.2x
9.6x
8.5x
6.6x
5.8x
4.4x4.1x
3.0x
2.2x 2.1x1.5x
0.0x
2.0x
4.0x
6.0x
8.0x
10.0x
12.0x
Capital
MarketsTechnology
(Liquidity
Venues)
Financial SaaS Bank
Technology
Information
Services
Benefits /
Payroll
Payments Insurance
Technology
Asset / Wealth
ManagementTechnology
Capital
MarketsTechnology
(Trading)
Real Estate /
MortgageSolutions
Outsourced
Solutions
Transactional
MarketingServices
9.9x
8.9x 8.9x
7.9x
6.5x
5.3x4.7x
4.0x 3.9x
2.0x 2.0x 1.8x
0.0x
2.0x
4.0x
6.0x
8.0x
10.0x
12.0x
Capital
MarketsTechnology
(Liquidity
Venues)
Financial SaaS Bank
Technology
Information
services
Benefits /
Payroll
Payments Capital
MarketsTechnology
(Trading)
Insurance
Technology
Asset / Wealth
ManagementTechnology
Real Estate /
MortgageSolutions
Outsourced
Solutions
Transactional
MarketingServices
27.7x
21.0x 21.0x
18.9x18.1x
16.7x 16.6x 16.5x15.3x
12.0x10.7x
7.1x
0.0x
5.0x
10.0x
15.0x
20.0x
25.0x
30.0x
Financial SaaS InformationServices
BankTechnology
Benefits /Payroll
Payments InsuranceTechnology
Asset / WealthManagementTechnology
CapitalMarkets
Technology
(LiquidityVenues)
TransactionalMarketingServices
OutsourcedSolutions
Real Estate /MortgageSolutions
CapitalMarkets
Technology
(Trading)
24.5x
19.5x18.4x
16.4x 16.1x14.9x 14.8x
13.8x
12.0x11.2x
9.3x 9.1x
0.0x
5.0x
10.0x
15.0x
20.0x
25.0x
30.0x
Financial SaaS InformationServices
BankTechnology
Benefits /Payroll
CapitalMarkets
Technology
(LiquidityVenues)
InsuranceTechnology
Asset / WealthManagementTechnology
Payments TransactionalMarketingServices
OutsourcedSolutions
CapitalMarkets
Technology
(Trading)
Real Estate /MortgageSolutions

FINTECH INSIGHT
RAYMOND JAMES INVESTMENT BANKING 37
JULY 2020
Valuation Multiple Analysis by Sector (cont’d)
2020E Price / Earnings 2021E Price / Earnings
Price / Earnings to Growth Ratio
Source: Capital IQ as of market close on Jul 31, 2020.
Data represents median performance for each sector.
40.7x
36.9x
32.8x31.6x 30.9x
25.5x 24.9x23.6x
22.1x
18.4x 18.0x
10.6x
0.0x
5.0x
10.0x
15.0x
20.0x
25.0x
30.0x
35.0x
40.0x
45.0x
Financial SaaS Benefits /Payroll
BankTechnology
InformationServices
Payments Asset / WealthManagement
Technology
InsuranceTechnology
CapitalMarkets
Technology(LiquidityVenues)
TransactionalMarketing
Services
OutsourcedSolutions
Real Estate /Mortgage
Solutions
CapitalMarkets
Technology(Trading)
34.8x
31.1x29.6x
27.6x
24.5x23.2x 22.8x 22.6x 22.2x
16.8x 16.7x
11.5x
0.0x
5.0x
10.0x
15.0x
20.0x
25.0x
30.0x
35.0x
40.0x
45.0x
Financial SaaS Benefits /Payroll
InformationServices
BankTechnology
TransactionalMarketing
Services
CapitalMarkets
Technology(LiquidityVenues)
InsuranceTechnology
Asset / WealthManagement
Technology
Payments Real Estate /Mortgage
Solutions
OutsourcedSolutions
CapitalMarkets
Technology(Trading)
3.5
3.2 3.2
2.9 2.9 2.9
2.52.3 2.3
2.1
1.7
1.4
0.0
0.5
1.0
1.5
2.0
2.5
3.0
3.5
4.0
InformationServices
Benefits /Payroll
Financial SaaS InsuranceTechnology
CapitalMarkets
Technology
(LiquidityVenues)
BankTechnology
Payments CapitalMarkets
Technology
(Trading)
OutsourcedSolutions
Real Estate /MortgageSolutions
Asset / WealthManagementTechnology
TransactionalMarketingServices

FINTECH INSIGHT
RAYMOND JAMES INVESTMENT BANKING 38
JULY 2020
Growth and Margin Analysis by Sector
2020E Revenue Growth 2021E Revenue Growth
2020E EBITDA Margin 2021E EBITDA Margin
Source: Capital IQ as of market close on Jul 31, 2020.
Data represents median performance for each sector.
12.1%
10.0%
6.2%
4.6% 4.3%
3.0%2.4% 2.1% 1.9% 1.6%
0.8%
(0.1%) (2.0%)
0.0%
2.0%
4.0%
6.0%
8.0%
10.0%
12.0%
14.0%
16.0%
Financial SaaS CapitalMarkets
Technology(Liquidity
Venues)
InsuranceTechnology
InformationServices
Payments TransactionalMarketingServices
Benefits /Payroll
BankTechnology
Asset / WealthManagementTechnology
Real Estate /MortgageSolutions
CapitalMarkets
Technology(Trading)
OutsourcedSolutions
14%
10%
9% 8%
7% 7% 7%
6%
4% 4%
3%
(1%) (2.0%)
0.0%
2.0%
4.0%
6.0%
8.0%
10.0%
12.0%
14.0%
16.0%
Financial Saas Payments BankTechnology
Real Estate /MortgageSolutions
Asset / WealthManagementTechnology
Benefits /Payroll
InsuranceTechnology
InformationServices
TransactionalMarketingServices
OutsourcedSolutions
CapitalMarkets
Technology
(LiquidityVenues)
CapitalMarkets
Technology
(Trading)
60.1%
42.2%
37.3%34.3%
31.3%
27.0% 26.1% 25.4%23.7%
18.1% 17.1%
12.6%
0.0%
10.0%
20.0%
30.0%
40.0%
50.0%
60.0%
70.0%
Capital
MarketsTechnology
(LiquidityVenues)
Capital
MarketsTechnology
(Trading)
Bank
Technology
Information
Services
Payments Asset / Wealth
ManagementTechnology
Benefits /
Payroll
Financial SaaS Insurance
Technology
Outsourced
Solutions
Real Estate /
MortgageSolutions
Transactional
MarketingServices
60.4%
42.2%39.2%
35.1%32.5%
29.2%27.4%
24.5% 24.2%
19.6% 18.7%
14.7%
0.0%
10.0%
20.0%
30.0%
40.0%
50.0%
60.0%
70.0%
CapitalMarkets
Technology
(LiquidityVenues)
CapitalMarkets
Technology
(Trading)
BankTechnology
InformationServices
Payments Asset / WealthManagementTechnology
Benefits /Payroll
Financial SaaS InsuranceTechnology
Real Estate /MortgageSolutions
OutsourcedSolutions
TransactionalMarketingServices

FINTECH INSIGHT
RAYMOND JAMES INVESTMENT BANKING 39
JULY 2020
Trading Analysis by Sector
Note: Comparables are pro forma for acquisitions and divestitures.
Source: Capital IQ as of market close on Jul 31, 2020.
(USD in millions)
Capitalization Trading PerformanceEnterprise Value/
RevenueEnterprise Value/
EBITDA P / E Revenue Growth EBITDA Margin Long Term EPS
GrowthPEG
RatioCompanyEquity Value
Enterprise Value YTD 1 Year 3 Year 5 Year 2020E 2021E 2020E 2021E 2020E 2021E 2020E 2021E 2020E 2021E
Visa Inc. $406,019.8 $421,042.8 1.3% 7.0% 91.2% 152.7% 18.8x 16.8x 27.5x 24.1x 38.6x 30.9x (4.8%) 11.7% 68.5% 69.8% 14.5% 2.7
Mastercard Incorporated 310,743.3 311,792.3 3.3% 13.3% 141.4% 216.8% 19.9x 16.7x 34.9x 27.3x 46.2x 35.4x (7.2%) 19.2% 57.0% 61.1% 18.6% 2.5
PayPal Holdings, Inc. 234,101.2 234,771.2 81.3% 77.6% 234.9% 406.6% 10.7x 9.0x 38.4x 32.0x 52.6x 43.4x 21.5% 19.4% 27.9% 28.0% 21.3% 2.5
Fidelity National Information Services 91,914.6 111,108.6 5.2% 9.8% 60.4% 123.6% 8.9x 8.1x 20.9x 17.9x 26.7x 21.8x (1.8%) 9.2% 42.6% 45.6% 13.0% 2.1
Fiserv, Inc. 68,540.7 91,315.7 (13.7%) (5.3%) 55.3% 129.8% 6.1x 5.7x 16.3x 14.5x 22.7x 18.8x 4.1% 6.5% 37.3% 39.2% 16.1% 1.4
Global Payments Inc. 53,696.9 62,268.0 (2.5%) 6.0% 88.6% 217.6% 8.0x 7.3x 21.0x 17.5x 28.7x 22.7x 9.0% 10.3% 38.2% 41.6% 16.0% 1.8
Square, Inc. 61,112.9 60,799.6 107.6% 61.5% 392.8% NA 10.9x 8.5x NM NM NM NM 18.7% 28.0% 6.8% 8.5% 31.7% NA
Adyen N.V. 50,682.0 48,778.0 93.8% 106.3% NA NA NM 45.3x NM NM NM NM 38.0% 42.6% 55.5% 58.3% 40.1% NA
FLEETCOR Technologies, Inc. 22,431.6 26,617.3 (10.1%) (9.0%) 70.0% 67.0% 10.9x 9.6x 21.1x 17.3x 23.5x 19.8x (7.4%) 13.6% 51.3% 55.3% 12.4% 1.9
Discover Financial Services 15,288.3 24,407.3 (41.7%) (44.9%) (18.9%) (11.4%) 2.2x 2.2x 6.3x 6.4x 42.4x 8.5x (3.9%) 2.9% 34.9% 33.4% 10.5% 4.0
Alliance Data Systems Corporation 2,135.5 16,907.2 (60.5%) (71.7%) (81.6%) (83.9%) 3.8x 3.7x 15.8x 12.0x 6.9x 3.8x (1.7%) 2.1% 23.8% 30.6% 9.0% 0.8
Edenred SA 12,251.6 14,258.2 (8.6%) (7.3%) 89.8% 85.5% 8.2x 7.4x 20.9x 18.2x 37.6x 31.4x (1.5%) 10.5% 39.4% 40.8% 3.7% 10.2
The Western Union Company 10,171.4 12,398.2 (9.3%) 15.6% 22.9% 20.0% 2.6x 2.5x 10.6x 9.7x 14.5x 12.6x (11.0%) 4.8% 24.9% 25.9% 6.3% 2.3
WEX Inc. 7,307.3 10,194.7 (24.4%) (27.4%) 45.7% 55.2% 5.8x 5.2x 13.8x 11.5x 23.4x 18.2x (6.1%) 11.4% 41.9% 45.3% 15.0% 1.6
Bill.com Holdings, Inc. 7,454.1 7,074.0 144.7% NA NA NA 42.7x 34.9x NM NM NM NM 26.7% 22.1% NM NM 13.1% NA
Euronet Worldwide, Inc. 5,148.9 5,143.6 (39.0%) (38.3%) (0.5%) 40.4% 1.8x 1.9x 20.7x 9.6x 51.5x 17.1x 4.4% (3.2%) 8.6% 19.2% 10.0% 5.1
Cielo S.A. 2,804.8 4,185.3 (35.8%) (25.8%) (79.4%) (82.3%) 1.4x 1.3x 12.4x 8.6x 25.7x 14.6x 8.3% 5.7% 11.1% 15.0% NA NA
EVERTEC, Inc. 2,300.0 2,761.2 (8.8%) (3.0%) 73.9% 65.0% 5.9x 5.5x 13.5x 11.8x 19.1x 15.3x (3.7%) 7.1% 43.4% 46.5% 5.1% 3.7
EVO Payments, Inc. 1,885.8 2,472.1 (14.1%) (27.1%) NA NA 4.8x 4.4x 14.1x 13.0x 50.1x 32.5x 6.8% 7.5% 33.7% 34.1% 7.5% 6.7
Bottomline Technologies (de), Inc. 2,234.5 2,263.8 (10.0%) 14.7% 69.5% 75.7% 5.0x 4.5x 22.6x 20.5x 42.8x 32.1x 6.0% 9.1% 21.9% 22.2% 19.8% 2.2
Shift4 Payments, Inc. 1,578.5 2,259.9 14.2% NA NA NA 3.5x 2.1x 39.7x 17.1x NM 81.3x (11.9%) 65.1% 8.8% 12.4% NA NA
Repay Holdings Corporation 1,690.1 2,110.9 51.1% 90.4% NA NA 9.6x 8.2x 31.8x 26.0x 41.5x 35.2x 34.2% 17.8% 30.3% 31.5% NA NA
Cardtronics plc 1,013.2 1,804.4 (50.0%) (21.6%) (28.7%) (39.8%) 1.6x 1.4x 8.0x 6.0x 24.3x 12.2x (16.6%) 15.6% 20.0% 23.1% 2.1% 11.6
Everi Holdings Inc. 506.7 1,509.9 (57.7%) (52.7%) (23.9%) 12.5% 3.1x 3.0x 7.9x 6.5x NM NM (9.2%) 2.7% 39.6% 47.0% NA NA
Green Dot Corporation 2,779.4 1,347.1 117.6% 0.0% 26.0% 144.6% 1.3x 1.2x 7.8x 6.2x 31.1x 23.7x (6.1%) 5.7% 16.7% 19.7% 2.5% 12.5
EML Payments Limited 812.2 983.0 (30.6%) (2.8%) 94.4% 343.7% 6.4x 5.8x 19.9x 17.3x 47.0x 23.4x 20.2% 10.1% 32.3% 33.9% NA NA
Qiwi plc 1,236.4 869.2 (0.3%) (12.1%) 5.5% (36.9%) 2.7x 2.4x 6.3x 4.5x 12.3x 8.1x 6.8% 12.3% 43.1% 54.2% 31.5% 0.4
Newtek Business Services Corp. 415.4 830.9 (17.3%) (13.1%) 10.2% (1.6%) 12.0x 12.2x NA NA 8.1x 8.2x 16.4% (1.4%) NA NA NA NA
i3 Verticals, Inc. 363.9 549.2 (14.4%) (15.4%) NA NA 3.3x 3.1x 11.4x 10.3x 35.0x 23.2x 14.9% 9.0% 29.1% 29.6% 13.8% 2.5
USA Technologies, Inc. 467.8 463.9 (3.6%) 8.4% 28.5% 111.6% 2.3x 2.1x 46.2x 18.2x NM 76.0x 25.4% 10.6% 4.9% 11.4% NA NA
PaySign, Inc. 458.3 448.9 (8.0%) (33.8%) 1645.8% 2034.9% 9.9x 7.0x 35.9x 22.5x 65.8x 38.0x 30.9% 40.9% 27.6% 31.2% NA NA
GreenSky, Inc. 378.2 414.4 (36.6%) (50.6%) NA NA 0.9x 0.8x 5.5x 3.8x 30.8x 20.0x (11.7%) 16.5% 16.2% 20.2% NA NA
Cass Information Systems, Inc. 518.0 362.0 (37.9%) (29.6%) (28.3%) (10.1%) NA NA NA NA NA NA NA NA NA NA NA NA
Payments Median (9.3%) (7.3%) 50.5% 67.0% 5.8x 5.3x 18.1x 13.8x 30.9x 22.2x 4.3% 10.4% 31.3% 32.5% 13.1% 2.5
Payments

FINTECH INSIGHT
RAYMOND JAMES INVESTMENT BANKING 40
JULY 2020
(USD in millions)
Capitalization Trading PerformanceEnterprise Value/
RevenueEnterprise Value/
EBITDA P / E Revenue Growth EBITDA Margin Long Term EPS
GrowthPEG
RatioCompanyEquity Value
Enterprise Value YTD 1 Year 3 Year 5 Year 2020E 2021E 2020E 2021E 2020E 2021E 2020E 2021E 2020E 2021E
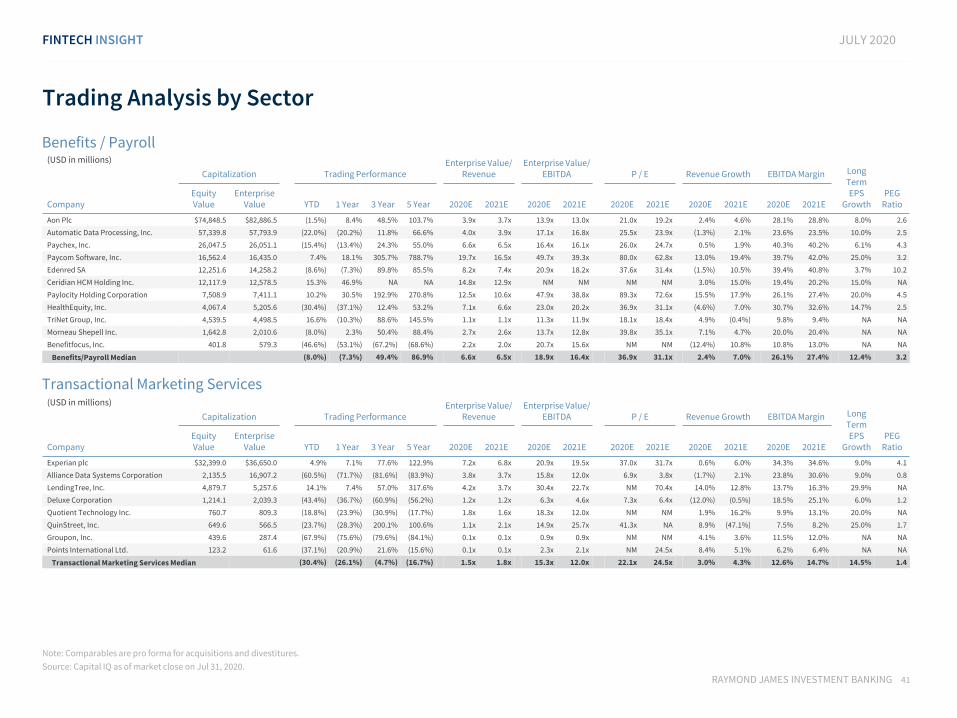
Aon Plc $74,848.5 $82,886.5 (1.5%) 8.4% 48.5% 103.7% 3.9x 3.7x 13.9x 13.0x 21.0x 19.2x 2.4% 4.6% 28.1% 28.8% 8.0% 2.6
Marsh & McLennan Companies, Inc. 60,113.7 73,837.7 4.7% 18.0% 49.5% 101.2% 4.4x 4.2x 17.4x 15.9x 24.7x 22.8x 1.7% 4.3% 25.0% 26.2% 5.9% 4.2
Verisk Analytics, Inc. 31,180.2 34,283.0 26.4% 24.4% 116.3% 141.6% 12.4x 11.7x 26.3x 24.4x 39.6x 35.8x 6.3% 6.0% 47.0% 47.8% 11.3% 3.5
Arthur J. Gallagher & Co. 20,801.2 25,530.8 12.9% 18.9% 82.8% 126.6% 3.3x 3.1x 15.9x 14.5x 25.1x 24.0x 8.3% 6.6% 20.7% 21.3% 10.1% 2.5
Brown & Brown, Inc. 13,436.7 14,641.6 15.2% 26.6% 103.9% 171.9% 5.8x 5.5x 19.1x 18.3x 29.8x 27.8x 6.2% 5.7% 30.2% 29.9% 9.2% 3.2
Guidewire Software, Inc. 10,133.0 9,525.6 7.2% 15.3% 63.1% 99.3% 13.0x 11.7x NM NM NM 93.1x 2.8% 11.2% 12.7% 19.7% NA NA
SelectQuote, Inc. 2,953.7 3,360.9 (33.7%) NA NA NA 5.3x 3.8x 21.1x 14.9x 31.3x 21.4x NA 38.9% 25.1% 25.7% NA NA
eHealth, Inc. 1,923.1 1,773.8 (28.0%) (33.4%) 306.5% 325.0% 2.7x 2.1x 12.1x 8.8x 16.6x 12.9x 29.1% 28.0% 22.3% 24.2% 25.0% 0.7
Sapiens International Corporation N.V. 1,555.6 1,623.3 32.9% 89.9% 156.2% 184.8% 4.4x 4.0x 24.8x 22.0x 35.7x 30.9x 14.6% 9.4% 17.6% 18.1% 5.0% 7.1
EverQuote, Inc. 1,655.3 1,604.8 58.5% 266.2% NA NA 4.9x 4.0x NM NM NM NM 31.3% 22.1% 4.9% 5.8% NA NA
Ebix, Inc. 673.0 1,342.1 (34.0%) (52.1%) (61.8%) (28.8%) 2.6x NA 9.8x NA 7.6x 5.4x (10.5%) NA 26.5% NA 10.0% 0.8
Crawford & Company 359.7 631.6 (34.5%) (29.0%) (25.9%) (3.9%) 0.7x 0.6x 6.5x 6.1x 14.9x 11.4x (4.6%) 2.3% 10.1% 10.6% NA NA
Insurance Technology Median 5.9% 18.0% 72.9% 115.1% 4.4x 4.0x 16.7x 14.9x 24.9x 22.8x 6.2% 6.6% 23.7% 24.2% 9.6% 2.9
Note: (1) ENV and AMK revenue calculated on a net revenue basis excluding pass-through asset-based cost of revenues; EBITDA margin calculated as a percentage of net revenue.
Comparables are pro forma for acquisitions and divestitures.
Source: Capital IQ as of market close on Jul 31, 2020.
Insurance Technology
Asset / Wealth Management Technology
Trading Analysis by Sector
(USD in millions)
Capitalization Trading PerformanceEnterprise Value/
RevenueEnterprise Value/
EBITDA P / E Revenue Growth EBITDA Margin Long Term EPS
GrowthPEG
RatioCompanyEquity Value
Enterprise Value YTD 1 Year 3 Year 5 Year 2020E 2021E 2020E 2021E 2020E 2021E 2020E 2021E 2020E 2021E
SS&C Technologies Holdings, Inc. $15,289.4 $22,262.6 (6.4%) 19.9% 48.3% 69.0% 4.7x 4.7x 12.2x 11.8x 14.0x 13.2x (0.2%) 1.7% 38.8% 39.4% 9.0% 1.6
Broadridge Financial Solutions, Inc. 15,812.3 17,816.3 8.7% 5.7% 77.1% 147.5% 3.9x 3.7x 18.6x 16.8x 25.8x 23.5x 3.4% 4.5% 20.9% 22.1% NA NA
Computershare Limited 5,222.5 7,106.0 (20.0%) (15.2%) (4.5%) 8.7% 3.2x 3.2x 11.7x 11.7x 19.4x 16.6x (2.4%) 0.1% 27.0% 27.0% NA NA
SEI Investments Company 7,773.8 7,059.0 (20.1%) (12.2%) (7.4%) (1.8%) 4.3x 4.0x 12.5x 11.2x 17.9x 15.7x 0.4% 6.4% 34.1% 35.7% 12.0% 1.5
Envestnet, Inc.(1) 4,553.0 5,180.0 16.6% 13.7% 107.9% 79.3% 7.3x 6.7x 24.9x 21.5x 38.5x 32.7x 3.9% 9.1% 29.6% 31.4% NA NA
SimCorp A/S 4,721.5 4,765.1 (2.8%) 20.6% 87.3% 154.2% 8.9x 7.9x 33.0x 25.1x 49.1x 35.2x 4.6% 12.5% 27.1% 31.6% 16.4% 3.0
AssetMark Financial Holdings, Inc.(1) 2,019.2 2,090.6 (4.0%) (1.6%) NA NA 7.4x 7.0x 18.6x 16.5x 28.5x 26.1x (1.0%) 4.6% 39.5% 42.6% NA NA
IRESS Limited 1,404.2 1,428.4 (21.2%) (26.6%) (20.4%) (1.3%) 3.5x 3.1x 15.1x 13.8x 26.2x 24.0x 13.6% 12.7% 23.2% 22.7% 7.3% 3.6
Sanne Group plc 1,198.6 1,352.2 (6.9%) 14.5% (8.8%) 140.0% 5.8x 5.2x 18.1x 15.8x 25.2x 21.7x 13.0% 10.7% 32.0% 33.0% 13.9% 1.8
First Derivatives plc 1,004.1 1,105.1 (1.5%) (8.5%) (6.8%) 80.6% 3.6x 3.4x 21.0x 18.7x 42.1x 36.7x (0.6%) 8.1% 17.3% 18.1% NA NA
Equiniti Group plc 610.1 1,057.7 (38.1%) (39.3%) (51.4%) NA 1.6x 1.5x 7.4x 6.7x 11.2x 9.7x (7.5%) 3.6% 20.9% 22.4% NA NA
Blucora, Inc. 580.1 1,048.4 (54.9%) (60.6%) (47.4%) (16.8%) 1.3x 1.2x 9.6x 6.8x 10.7x 6.4x 3.8% 9.3% 14.1% 18.2% 15.0% 0.7
Asset / Wealth Management Technology Median (6.6%) (5.0%) (6.8%) 74.2% 4.1x 3.9x 16.6x 14.8x 25.5x 22.6x 1.9% 7.2% 27.0% 29.2% 13.0% 1.7
FINTECH INSIGHT
RAYMOND JAMES INVESTMENT BANKING 41
JULY 2020
Trading Analysis by Sector
Note: Comparables are pro forma for acquisitions and divestitures.
Source: Capital IQ as of market close on Jul 31, 2020.
Benefits / Payroll
Transactional Marketing Services
(USD in millions)
Capitalization Trading PerformanceEnterprise Value/
RevenueEnterprise Value/
EBITDA P / E Revenue Growth EBITDA Margin Long Term EPS
GrowthPEG
RatioCompanyEquity Value
Enterprise Value YTD 1 Year 3 Year 5 Year 2020E 2021E 2020E 2021E 2020E 2021E 2020E 2021E 2020E 2021E
Aon Plc $74,848.5 $82,886.5 (1.5%) 8.4% 48.5% 103.7% 3.9x 3.7x 13.9x 13.0x 21.0x 19.2x 2.4% 4.6% 28.1% 28.8% 8.0% 2.6
Automatic Data Processing, Inc. 57,339.8 57,793.9 (22.0%) (20.2%) 11.8% 66.6% 4.0x 3.9x 17.1x 16.8x 25.5x 23.9x (1.3%) 2.1% 23.6% 23.5% 10.0% 2.5
Paychex, Inc. 26,047.5 26,051.1 (15.4%) (13.4%) 24.3% 55.0% 6.6x 6.5x 16.4x 16.1x 26.0x 24.7x 0.5% 1.9% 40.3% 40.2% 6.1% 4.3
Paycom Software, Inc. 16,562.4 16,435.0 7.4% 18.1% 305.7% 788.7% 19.7x 16.5x 49.7x 39.3x 80.0x 62.8x 13.0% 19.4% 39.7% 42.0% 25.0% 3.2
Edenred SA 12,251.6 14,258.2 (8.6%) (7.3%) 89.8% 85.5% 8.2x 7.4x 20.9x 18.2x 37.6x 31.4x (1.5%) 10.5% 39.4% 40.8% 3.7% 10.2
Ceridian HCM Holding Inc. 12,117.9 12,578.5 15.3% 46.9% NA NA 14.8x 12.9x NM NM NM NM 3.0% 15.0% 19.4% 20.2% 15.0% NA
Paylocity Holding Corporation 7,508.9 7,411.1 10.2% 30.5% 192.9% 270.8% 12.5x 10.6x 47.9x 38.8x 89.3x 72.6x 15.5% 17.9% 26.1% 27.4% 20.0% 4.5
HealthEquity, Inc. 4,067.4 5,205.6 (30.4%) (37.1%) 12.4% 53.2% 7.1x 6.6x 23.0x 20.2x 36.9x 31.1x (4.6%) 7.0% 30.7% 32.6% 14.7% 2.5
TriNet Group, Inc. 4,539.5 4,498.5 16.6% (10.3%) 88.6% 145.5% 1.1x 1.1x 11.3x 11.9x 18.1x 18.4x 4.9% (0.4%) 9.8% 9.4% NA NA
Morneau Shepell Inc. 1,642.8 2,010.6 (8.0%) 2.3% 50.4% 88.4% 2.7x 2.6x 13.7x 12.8x 39.8x 35.1x 7.1% 4.7% 20.0% 20.4% NA NA
Benefitfocus, Inc. 401.8 579.3 (46.6%) (53.1%) (67.2%) (68.6%) 2.2x 2.0x 20.7x 15.6x NM NM (12.4%) 10.8% 10.8% 13.0% NA NA
Benefits/Payroll Median (8.0%) (7.3%) 49.4% 86.9% 6.6x 6.5x 18.9x 16.4x 36.9x 31.1x 2.4% 7.0% 26.1% 27.4% 12.4% 3.2
(USD in millions)
Capitalization Trading PerformanceEnterprise Value/
RevenueEnterprise Value/
EBITDA P / E Revenue Growth EBITDA Margin Long Term EPS
GrowthPEG
RatioCompanyEquity Value
Enterprise Value YTD 1 Year 3 Year 5 Year 2020E 2021E 2020E 2021E 2020E 2021E 2020E 2021E 2020E 2021E
Experian plc $32,399.0 $36,650.0 4.9% 7.1% 77.6% 122.9% 7.2x 6.8x 20.9x 19.5x 37.0x 31.7x 0.6% 6.0% 34.3% 34.6% 9.0% 4.1
Alliance Data Systems Corporation 2,135.5 16,907.2 (60.5%) (71.7%) (81.6%) (83.9%) 3.8x 3.7x 15.8x 12.0x 6.9x 3.8x (1.7%) 2.1% 23.8% 30.6% 9.0% 0.8
LendingTree, Inc. 4,879.7 5,257.6 14.1% 7.4% 57.0% 317.6% 4.2x 3.7x 30.4x 22.7x NM 70.4x 14.0% 12.8% 13.7% 16.3% 29.9% NA
Deluxe Corporation 1,214.1 2,039.3 (43.4%) (36.7%) (60.9%) (56.2%) 1.2x 1.2x 6.3x 4.6x 7.3x 6.4x (12.0%) (0.5%) 18.5% 25.1% 6.0% 1.2
Quotient Technology Inc. 760.7 809.3 (18.8%) (23.9%) (30.9%) (17.7%) 1.8x 1.6x 18.3x 12.0x NM NM 1.9% 16.2% 9.9% 13.1% 20.0% NA
QuinStreet, Inc. 649.6 566.5 (23.7%) (28.3%) 200.1% 100.6% 1.1x 2.1x 14.9x 25.7x 41.3x NA 8.9% (47.1%) 7.5% 8.2% 25.0% 1.7
Groupon, Inc. 439.6 287.4 (67.9%) (75.6%) (79.6%) (84.1%) 0.1x 0.1x 0.9x 0.9x NM NM 4.1% 3.6% 11.5% 12.0% NA NA
Points International Ltd. 123.2 61.6 (37.1%) (20.9%) 21.6% (15.6%) 0.1x 0.1x 2.3x 2.1x NM 24.5x 8.4% 5.1% 6.2% 6.4% NA NA
Transactional Marketing Services Median (30.4%) (26.1%) (4.7%) (16.7%) 1.5x 1.8x 15.3x 12.0x 22.1x 24.5x 3.0% 4.3% 12.6% 14.7% 14.5% 1.4

FINTECH INSIGHT
RAYMOND JAMES INVESTMENT BANKING 42
JULY 2020
(USD in millions)
Capitalization Trading PerformanceEnterprise Value/
RevenueEnterprise Value/
EBITDA P / E Revenue Growth EBITDA Margin Long Term EPS
GrowthPEG
RatioCompanyEquity Value
Enterprise Value YTD 1 Year 3 Year 5 Year 2020E 2021E 2020E 2021E 2020E 2021E 2020E 2021E 2020E 2021E
London Stock Exchange Group plc $51,836.4 $65,450.8 9.5% 28.0% 126.4% 224.9% 7.6x 7.4x 16.4x 15.7x 39.7x 34.5x 3.4% 3.2% 46.5% 46.9% 12.4% 3.2
CME Group Inc. 59,835.8 61,814.2 (17.2%) (14.5%) 35.5% 73.0% 11.5x 11.3x 16.8x 16.5x 23.8x 23.5x 10.7% 1.9% 68.3% 68.5% 7.2% 3.3
Intercontinental Exchange, Inc. 53,053.1 60,991.1 4.6% 10.2% 45.1% 112.2% 10.8x 10.5x 16.5x 16.2x 22.0x 21.1x 9.0% 2.4% 65.0% 64.8% 10.5% 2.1
Deutsche Börse AG 33,548.0 36,664.9 10.3% 22.4% 74.9% 87.1% 9.5x 9.3x 15.6x 15.2x 23.4x 23.0x 4.5% 2.4% 60.8% 61.1% 7.0% 3.4
Nasdaq, Inc. 21,885.7 24,856.7 22.6% 36.3% 76.6% 157.3% 9.0x 8.9x 16.5x 16.5x 22.3x 22.3x 9.3% 1.3% 54.3% 53.7% 8.9% 2.5
B3 S.A. - Brasil, Bolsa, Balcão 24,995.9 24,171.8 47.6% 50.4% 209.6% 507.7% 17.0x 16.3x 22.1x 21.2x 30.3x 30.2x 34.8% 4.1% 77.1% 77.1% 10.5% 2.9
Hong Kong Exchanges and Clearing 60,618.5 23,837.9 46.3% 39.4% 66.2% 76.1% 10.2x 9.0x 13.3x 11.5x 43.6x 37.7x 11.9% 13.6% 76.7% 78.3% 19.4% 2.2
MarketAxess Holdings Inc. 19,870.9 19,539.8 36.3% 53.3% 154.7% 428.3% 28.9x 26.9x 49.0x 46.3x 68.2x 65.2x 32.1% 7.6% 59.1% 58.0% 17.8% 3.8
ASX Limited 11,471.3 10,695.1 5.4% (7.0%) 58.0% 85.9% 11.5x 10.9x 15.4x 14.5x 31.9x 32.1x 5.3% 5.5% 74.8% 75.1% 3.9% 8.2
Tradeweb Markets Inc. 10,148.7 10,434.0 16.7% 14.2% NA NA 12.0x 11.1x 24.8x 22.6x 43.0x 39.6x 12.5% 7.7% 48.3% 49.2% 15.3% 2.8
Cboe Global Markets, Inc. 9,587.9 10,217.9 (26.9%) (19.8%) (7.2%) 41.5% 8.0x 7.9x 11.7x 11.7x 16.8x 17.5x 11.8% 1.9% 68.8% 67.4% 4.9% 3.5
Euronext N.V. 8,014.8 8,794.7 33.4% 38.9% 96.2% 133.1% 10.7x 10.3x 19.0x 17.7x 20.7x 20.8x 8.0% 3.5% 56.4% 58.2% 12.0% 1.7
TMX Group Limited 5,817.5 6,407.2 21.8% 39.7% 107.1% 178.2% 9.8x 9.5x 16.5x 15.9x 22.7x 21.6x 17.9% 2.9% 59.4% 59.7% 9.1% 2.5
Singapore Exchange Limited 6,390.8 5,990.6 (7.8%) 3.2% 7.9% 2.5% 8.0x 7.9x 13.5x 13.7x 18.0x 21.2x 6.4% 1.0% 59.1% 57.6% NA NA
Capital Markets Technology (Liquidity Venues) Median 13.5% 25.2% 74.9% 112.2% 10.4x 9.9x 16.5x 16.1x 23.6x 23.2x 10.0% 3.1% 60.1% 60.4% 10.5% 2.9
(USD in millions)
Capitalization Trading PerformanceEnterprise Value/
RevenueEnterprise Value/
EBITDA P / E Revenue Growth EBITDA Margin Long Term EPS
GrowthPEG
RatioCompanyEquity Value
Enterprise Value YTD 1 Year 3 Year 5 Year 2020E 2021E 2020E 2021E 2020E 2021E 2020E 2021E 2020E 2021E
The Charles Schwab Corporation $62,770.0 $74,063.0 (30.3%) (23.3%) (22.7%) (5.0%) 4.9x 5.0x 11.6x 10.8x 15.1x 17.2x (8.3%) (1.0%) 42.2% 45.9% 5.0% 3.0
Interactive Brokers Group, Inc. 4,061.3 10,777.3 6.4% (3.2%) 23.8% 23.5% 5.1x 5.2x 6.9x 7.6x 22.7x 26.3x 6.7% (3.2%) 73.7% 68.5% 10.0% 2.3
Virtu Financial, Inc. 4,863.2 6,320.2 55.1% 14.4% 49.8% 5.5% 3.0x 4.7x 4.9x 11.2x 4.9x 11.5x 74.3% (36.7%) 60.8% 42.2% NA NA
BGC Partners, Inc. 1,484.0 3,044.2 (53.4%) (49.7%) (78.0%) (71.9%) 1.5x 1.4x 7.1x 5.9x 4.9x 4.4x (0.4%) 4.2% 21.2% 24.3% NA NA
goeasy Ltd.* 631.2 1,294.0 (19.2%) (0.9%) 101.2% 214.8% 2.7x 2.4x 11.5x 9.3x 10.6x 7.9x 0.8% 11.8% 23.9% 26.2% 20.8% 0.5
Capital Markets Technology (Trading) Median (19.2%) (3.2%) 23.8% 5.5% 3.0x 4.7x 7.1x 9.3x 10.6x 11.5x 0.8% (1.0%) 42.2% 42.2% 10.0% 2.3
Trading Analysis by Sector
Note: Comparables are pro forma for acquisitions and divestitures.
Source: Capital IQ as of market close on Jul 31, 2020.
• goeasy includes EBIT multiples and margins.
Capital Markets Technology (Liquidity Venues)
Capital Markets Technology (Trading)

FINTECH INSIGHT
RAYMOND JAMES INVESTMENT BANKING 43
JULY 2020
Trading Analysis by Sector
Note: (1) ENV revenue calculated on a net revenue basis excluding pass-through asset-based cost of revenues; EBITDA margin calculated as a percentage of net revenue.
Comparables are pro forma for acquisitions and divestitures.
Source: Capital IQ as of market close on Jul 31, 2020.
Bank Technology
Financial SaaS
(USD in millions)
Capitalization Trading PerformanceEnterprise Value/
RevenueEnterprise Value/
EBITDA P / E Revenue Growth EBITDA Margin Long Term EPS
GrowthPEG
RatioCompanyEquity Value
Enterprise Value YTD 1 Year 3 Year 5 Year 2020E 2021E 2020E 2021E 2020E 2021E 2020E 2021E 2020E 2021E
Fidelity National Information Services $91,914.6 $111,108.6 5.2% 9.8% 60.4% 123.6% 8.9x 8.1x 20.9x 17.9x 26.7x 21.8x (1.8%) 9.2% 42.6% 45.6% 13.0% 2.1
Fiserv, Inc. 68,540.7 91,315.7 (13.7%) (5.3%) 55.3% 129.8% 6.1x 5.7x 16.3x 14.5x 22.7x 18.8x 4.1% 6.5% 37.3% 39.2% 16.1% 1.4
Jack Henry & Associates, Inc. 13,713.0 13,726.5 22.4% 27.6% 66.1% 155.2% 7.9x 7.4x 24.5x 23.5x 45.8x 41.7x 7.3% 6.3% 32.2% 31.5% 10.2% 4.5
Black Knight, Inc. 11,793.9 12,192.3 16.2% 18.3% 76.3% NA 10.3x 9.6x 21.1x 18.9x 38.8x 33.5x 0.2% 7.6% 49.1% 50.7% 10.5% 3.7
Temenos AG 10,666.4 11,663.5 (11.9%) (23.3%) 44.4% 280.8% 12.4x 11.1x 27.6x 25.0x 40.8x 37.1x (9.5%) 11.2% 44.8% 44.4% 10.4% 3.9
nCino, Inc. 7,455.2 7,360.6 (13.6%) NA NA NA 40.9x 29.0x NM NM NA NA 34.0% 41.1% NM NM NA NA
Q2 Holdings, Inc. 5,313.8 5,674.4 16.0% 17.8% 141.8% 245.9% 14.3x 11.6x NM NM NM NM 25.5% 23.5% 4.4% 7.0% 23.5% NA
ACI Worldwide, Inc. 3,224.4 4,536.7 (29.3%) (20.2%) 15.6% 13.2% 3.3x 3.1x 13.3x 11.2x 22.1x 15.5x (0.7%) 7.9% 24.8% 27.3% 18.8% 1.2
Bank Technology Median (3.3%) 9.8% 60.4% 142.5% 9.6x 8.9x 21.0x 18.4x 32.8x 27.6x 2.1% 8.6% 37.3% 39.2% 13.0% 2.9
(USD in millions)
Capitalization Trading PerformanceEnterprise Value/
RevenueEnterprise Value/
EBITDA P / E Revenue Growth EBITDA Margin Long Term EPS
GrowthPEG
RatioCompanyEquity Value
Enterprise Value YTD 1 Year 3 Year 5 Year 2020E 2021E 2020E 2021E 2020E 2021E 2020E 2021E 2020E 2021E
Intuit Inc. $85,331.6 $85,573.6 17.0% 10.5% 123.3% 189.7% 9.6x 8.6x 30.6x 27.5x 42.9x 37.0x 11.1% 11.6% 31.3% 31.2% 11.8% 3.6
Workday, Inc. 45,101.7 44,602.6 10.0% (9.5%) 77.2% 114.5% 10.8x 9.2x 47.9x 40.1x 80.3x 66.0x 16.5% 16.5% 22.5% 23.0% 28.0% 2.9
SS&C Technologies Holdings, Inc. 15,289.4 22,262.6 (6.4%) 19.9% 48.3% 69.0% 4.7x 4.7x 12.2x 11.8x 14.0x 13.2x (0.2%) 1.7% 38.8% 39.4% 9.0% 1.6
Paycom Software, Inc. 16,562.4 16,435.0 7.4% 18.1% 305.7% 788.7% 19.7x 16.5x 49.7x 39.3x 80.0x 62.8x 13.0% 19.4% 39.7% 42.0% 25.0% 3.2
The Sage Group plc 10,452.9 10,749.2 (2.6%) 1.3% 8.2% 40.0% 4.3x 4.2x 17.1x 17.0x 26.4x 26.5x 3.2% 2.9% 25.4% 24.8% 1.0% 25.3
Coupa Software Incorporated 22,329.6 22,341.4 109.5% 125.8% 897.2% NA 46.3x 36.8x NM NM NM NM 30.1% 25.8% 14.8% 17.5% 32.5% NA
Xero Limited 9,163.6 9,140.5 12.4% 38.5% 261.6% 462.8% 17.2x 14.2x NM NM NM NM 27.4% 21.0% 21.8% 24.2% NA NA
Paylocity Holding Corporation 7,508.9 7,411.1 10.2% 30.5% 192.9% 270.8% 12.5x 10.6x 47.9x 38.8x 89.3x 72.6x 15.5% 17.9% 26.1% 27.4% 20.0% 4.5
Envestnet, Inc.(1) 4,553.0 5,180.0 16.6% 13.7% 107.9% 79.3% 7.3x 6.7x 24.9x 21.5x 38.5x 32.7x 3.9% 9.1% 29.6% 31.4% NA NA
BlackLine, Inc. 5,285.3 5,082.2 72.4% 99.3% 129.3% NA 14.9x 12.5x NM NM NM NM 17.7% 19.1% 10.9% 13.9% 25.0% NA
Zuora, Inc. 1,461.7 1,365.2 (18.8%) (22.5%) NA NA 4.6x 4.2x NM NM NM NM 8.2% 9.8% NM 2.1% NA NA
Blucora, Inc. 580.1 1,048.4 (54.9%) (60.6%) (47.4%) (16.8%) 1.3x 1.2x 9.6x 6.8x 10.7x 6.4x 3.8% 9.3% 14.1% 18.2% 15.0% 0.7
Financial SaaS Median 10.1% 15.9% 123.3% 114.5% 10.2x 8.9x 27.7x 24.5x 40.7x 34.8x 12.1% 14.0% 25.4% 24.5% 20.0% 3.2

FINTECH INSIGHT
RAYMOND JAMES INVESTMENT BANKING 44
JULY 2020
Trading Analysis by Sector
Note: Comparables are pro forma for acquisitions and divestitures.
Source: Capital IQ as of market close on Jul 31, 2020.
Information Services(USD in millions)
Capitalization Trading PerformanceEnterprise Value/
RevenueEnterprise Value/
EBITDA P / E Revenue Growth EBITDA Margin Long Term EPS
GrowthPEG
RatioCompanyEquity Value
Enterprise Value YTD 1 Year 3 Year 5 Year 2020E 2021E 2020E 2021E 2020E 2021E 2020E 2021E 2020E 2021E
S&P Global Inc. $84,862.0 $89,109.0 28.3% 43.0% 128.0% 244.2% 12.4x 11.9x 23.3x 22.4x 32.0x 30.4x 7.1% 4.2% 53.4% 53.1% 10.0% 3.2
Moody's Corporation 53,676.5 59,260.5 18.5% 31.2% 113.7% 154.7% 11.7x 11.2x 24.2x 23.1x 30.8x 28.8x 4.5% 5.1% 48.6% 48.4% 9.0% 3.4
RELX PLC 40,839.7 40,839.7 (15.2%) (17.3%) (2.2%) 44.5% 3.8x 3.6x 11.9x 10.6x 19.2x 16.8x 4.0% 3.7% 31.5% 34.1% 5.4% 3.6
IHS Markit Ltd. 32,804.1 38,386.7 7.1% 25.3% 73.1% 129.6% 8.9x 8.3x 20.8x 19.0x 29.4x 25.8x (2.0%) 7.2% 42.7% 43.7% 10.9% 2.7
Thomson Reuters Corporation 34,966.3 37,820.3 0.6% 5.4% 48.6% 60.2% 6.3x 6.1x 20.2x 18.8x 39.3x 35.5x 1.2% 4.1% 31.3% 32.3% 15.6% 2.5
Experian plc 32,399.0 36,650.0 4.9% 7.1% 77.6% 122.9% 7.2x 6.8x 20.9x 19.5x 37.0x 31.7x 0.6% 6.0% 34.3% 34.6% 9.0% 4.1
Verisk Analytics, Inc. 31,180.2 34,283.0 26.4% 24.4% 116.3% 141.6% 12.4x 11.7x 26.3x 24.4x 39.6x 35.8x 6.3% 6.0% 47.0% 47.8% 11.3% 3.5
MSCI Inc. 31,730.5 34,017.1 45.6% 65.5% 245.1% 451.6% 20.2x 18.5x 36.0x 32.5x 51.8x 46.1x 7.9% 9.6% 56.3% 56.8% 10.0% 5.2
CoStar Group, Inc. 33,849.8 31,796.5 42.0% 38.1% 208.4% 322.2% 18.8x 16.9x NM 48.5x 90.8x 72.8x 15.9% 11.1% 31.0% 34.9% 17.5% 5.2
Wolters Kluwer N.V. 20,884.4 23,372.4 2.8% 2.0% 77.7% 121.5% 4.2x 4.0x 14.4x 13.7x 22.8x 21.4x 8.5% 3.4% 29.0% 29.3% 7.0% 3.3
Equifax Inc. 19,950.4 23,019.0 16.0% 16.9% 11.8% 59.2% 6.0x 5.8x 17.6x 16.6x 28.2x 26.8x 8.8% 3.2% 34.2% 35.2% 6.6% 4.3
TransUnion 17,357.0 20,774.8 4.6% 8.2% 95.4% 256.9% 7.8x 7.3x 20.3x 18.5x 31.3x 28.0x 0.2% 6.7% 38.4% 39.5% 10.5% 3.0
Dun & Bradstreet Holdings, Inc. 10,786.5 15,851.1 0.6% NA NA NA 9.1x 8.7x 21.9x 20.4x 29.2x 27.0x 23.2% 4.1% 41.6% 42.9% 4.8% 6.0
Fair Isaac Corporation 13,498.8 14,405.3 17.2% 26.4% 208.1% 384.3% 11.5x 11.0x 34.6x 31.3x 49.0x 46.6x 5.8% 5.0% 33.4% 35.1% 14.2% 3.5
FactSet Research Systems Inc. 13,381.0 13,785.5 29.1% 24.9% 107.1% 109.0% 9.1x 8.7x 25.6x 24.7x 32.7x 31.6x 3.9% 4.4% 35.6% 35.4% 7.9% 4.1
NICE Ltd. 13,116.9 13,248.3 28.2% 28.4% 161.6% 194.7% 8.0x 7.4x 25.1x 22.9x NA NA 5.1% 8.1% 31.9% 32.4% NA NA
Black Knight, Inc. 11,793.9 12,192.3 16.2% 18.3% 76.3% NA 10.3x 9.6x 21.1x 18.9x 38.8x 33.5x 0.2% 7.6% 49.1% 50.7% 10.5% 3.7
Informa plc 7,300.4 11,105.3 (56.8%) (57.7%) (46.8%) (37.9%) 4.3x 3.4x 15.1x 9.8x 17.9x 10.7x (28.6%) 26.7% 28.7% 34.8% 33.0% 0.5
Morningstar, Inc. 7,272.3 7,556.2 11.1% 10.6% 103.5% 97.3% NA NA NA NA NA NA NA NA NA NA NA NA
CoreLogic, Inc. 5,529.6 7,108.3 55.9% 49.6% 49.6% 72.8% 3.9x 3.7x 13.0x 12.3x 18.5x 18.3x 4.6% 3.7% 29.6% 30.2% 11.0% 1.7
LiveRamp Holdings, Inc. 3,179.0 2,482.2 (5.2%) (13.5%) 69.0% 154.4% 6.0x 5.0x NM NM NM NM NA 18.8% NM 4.4% NA NA
Value Line, Inc. 237.1 215.2 (14.7%) (5.6%) 39.3% 80.9% NA NA NA NA NA NA NA NA NA NA NA NA
Information Services Median 13.5% 18.3% 77.7% 126.3% 8.5x 7.9x 21.0x 19.5x 31.6x 29.6x 4.6% 5.6% 34.3% 35.1% 10.2% 3.5

FINTECH INSIGHT
RAYMOND JAMES INVESTMENT BANKING 45
JULY 2020
Trading Analysis by Sector
Note: Comparables are pro forma for acquisitions and divestitures.
Source: Capital IQ as of market close on Jul 31, 2020.
Outsourced Solutions(USD in millions)
Capitalization Trading PerformanceEnterprise Value/
RevenueEnterprise Value/
EBITDA P / E Revenue Growth EBITDA Margin Long Term EPS
GrowthPEG
RatioCompanyEquity Value
Enterprise Value YTD 1 Year 3 Year 5 Year 2020E 2021E 2020E 2021E 2020E 2021E 2020E 2021E 2020E 2021E
Tata Consultancy Services Limited $114,258.3 $110,215.5 5.3% 3.4% 83.1% 81.7% 5.2x 4.9x 19.7x 18.0x 28.1x 24.8x 0.0% 7.3% 26.6% 27.0% 7.4% 3.8
Infosys Limited 54,687.7 52,553.7 31.1% 21.7% 91.1% 79.4% 4.1x 3.8x 16.3x 14.8x 23.5x 21.6x 5.4% 8.6% 25.2% 25.5% 9.4% 2.5
Cognizant Technology Solutions 37,578.8 36,463.8 10.2% 4.9% (1.4%) 8.3% 2.2x 2.1x 12.5x 11.3x 19.6x 17.3x (1.5%) 4.1% 17.7% 18.8% 8.7% 2.3
HCL Technologies Limited 25,552.0 25,290.3 23.3% 36.3% 58.0% 41.3% 2.6x 2.4x 10.6x 9.8x 16.1x 15.5x 5.3% 8.2% 24.5% 24.6% 9.3% 1.7
CGI Inc. 18,698.5 21,103.0 (12.0%) (5.8%) 45.3% 95.8% 2.3x 2.2x 11.7x 11.2x 19.7x 17.9x 1.2% 3.9% 19.6% 19.7% 7.8% 2.5
Wipro Limited 24,601.5 20,981.8 13.3% 5.7% 29.5% 31.5% 2.6x 2.5x 12.5x 12.2x 17.1x 17.2x (1.7%) 3.7% 20.7% 20.5% 6.2% 2.8
Genpact Limited 7,914.5 9,448.9 (5.6%) 0.4% 37.3% 79.3% 2.6x 2.4x 16.6x 13.8x 21.7x 17.7x 1.6% 10.5% 15.9% 17.4% 9.0% 2.4
Amdocs Limited 8,381.9 8,469.9 (14.0%) (3.0%) (7.5%) 5.9% 2.0x 2.0x 9.7x 9.1x 14.0x 13.1x 1.5% 2.5% 20.9% 21.7% 8.5% 1.6
Xerox Holdings Corporation 3,546.7 5,836.7 (54.8%) (48.1%) (45.7%) (62.2%) 0.9x 0.8x 6.9x 5.6x 12.9x 7.3x (24.3%) 1.9% 12.2% 14.9% 0.5% 25.9
FTI Consulting, Inc. 4,383.2 4,596.1 7.9% 14.4% 264.0% 191.9% 1.9x 1.7x 13.9x 11.5x 21.4x 18.3x 5.2% 7.1% 13.4% 15.0% 18.0% 1.2
WNS (Holdings) Limited 3,340.8 3,315.4 (3.3%) 1.5% 85.1% 114.6% 3.9x 3.6x 17.6x 15.4x 41.0x 31.5x (1.4%) 7.2% 22.0% 23.4% 8.5% 4.8
Mphasis Limited 2,883.4 2,774.1 24.8% 23.1% 90.6% 174.2% 2.2x 2.0x 12.0x 10.9x 17.3x 15.7x 8.0% 9.7% 18.5% 18.6% 11.9% 1.5
TTEC Holdings, Inc. 2,248.0 2,674.1 19.8% 1.2% 13.5% 74.9% 1.6x 1.5x 12.1x 11.2x 23.9x 22.3x 2.6% 4.2% 13.1% 13.6% 20.0% 1.2
ExlService Holdings, Inc. 2,261.0 2,341.6 (7.8%) (6.9%) 11.3% 65.2% 2.5x 2.3x 17.0x 13.2x 27.1x 20.2x (6.8%) 10.1% 14.9% 17.5% 8.8% 3.1
Deluxe Corporation 1,214.1 2,039.3 (43.4%) (36.7%) (60.9%) (56.2%) 1.2x 1.2x 6.3x 4.6x 7.3x 6.4x (12.0%) (0.5%) 18.5% 25.1% 6.0% 1.2
CSG Systems International, Inc. 1,391.6 1,740.1 (18.6%) (17.8%) 1.9% 35.5% 1.9x 1.9x 8.5x 8.1x 13.9x 12.6x (8.8%) 3.2% 22.4% 23.0% 8.0% 1.7
Virtusa Corporation 1,288.6 1,604.6 (10.4%) (9.1%) 22.5% (15.3%) 1.3x 1.3x 12.8x 12.9x 23.0x 16.1x (1.8%) (0.6%) 9.8% 9.8% 14.0% 1.6
Sykes Enterprises, Incorporated 1,140.2 1,309.3 (25.8%) (2.9%) (19.2%) 12.6% 0.8x 0.8x 8.3x 7.4x 14.8x 11.9x (0.2%) 3.8% 9.8% 10.6% 11.0% 1.3
Firstsource Solutions Limited 452.6 609.6 18.1% (0.6%) 33.7% 42.4% 1.1x 1.0x 8.1x 7.9x 10.3x 9.6x 4.3% 3.3% 13.2% 13.0% NA NA
Donnelley Financial Solutions, Inc. 191.9 551.2 (17.4%) (36.5%) (62.7%) NA 0.6x 0.7x 3.9x 3.7x 9.8x 9.1x (0.3%) (3.2%) 16.4% 17.9% 4.3% 2.3
Outsourced Solutions Median (4.4%) (0.1%) 26.0% 42.4% 2.1x 2.0x 12.0x 11.2x 18.4x 16.7x (0.1%) 4.0% 18.1% 18.7% 8.7% 2.3

FINTECH INSIGHT
RAYMOND JAMES INVESTMENT BANKING 46
JULY 2020
Trading Analysis by Sector
Note: Comparables are pro forma for acquisitions and divestitures.
Source: Capital IQ as of market close on Jul 31, 2020.
• MGIC, Close Brothers and Radian Group includes EBIT multiples and margins.
Real Estate / Mortgage Solutions(USD in millions)
Capitalization Trading PerformanceEnterprise Value/
RevenueEnterprise Value/
EBITDA P / E Revenue Growth EBITDA Margin Long Term EPS
GrowthPEG
RatioCompanyEquity Value
Enterprise Value YTD 1 Year 3 Year 5 Year 2020E 2021E 2020E 2021E 2020E 2021E 2020E 2021E 2020E 2021E
CoStar Group, Inc. $33,849.8 $31,796.5 42.0% 38.1% 208.4% 322.2% 18.8x 16.9x NM 48.5x 90.8x 72.8x 15.9% 11.1% 31.0% 34.9% 17.5% 5.2
Black Knight, Inc. 11,793.9 12,192.3 16.2% 18.3% 76.3% NA 10.3x 9.6x 21.1x 18.9x 38.8x 33.5x 0.2% 7.6% 49.1% 50.7% 10.5% 3.7
Fidelity National Financial, Inc. 10,571.1 11,836.3 (28.6%) (24.5%) (33.8%) (17.2%) 1.2x 1.1x 6.1x 5.2x 10.5x 9.3x (1.1%) 10.3% 18.9% 20.4% NA NA
Jones Lang LaSalle Incorporated 5,258.3 8,673.5 (43.2%) (32.1%) (22.3%) (44.4%) 0.5x 0.4x 9.6x 7.5x 12.9x 9.6x 3.1% 7.1% 4.9% 5.8% 9.0% 1.4
RealPage, Inc. 6,407.3 7,716.1 17.2% 0.8% 62.6% 228.2% 6.4x 5.9x 30.3x 24.8x 34.8x 30.1x 7.3% 7.8% 21.0% 23.8% 10.0% 3.5
CoreLogic, Inc. 5,529.6 7,108.3 55.9% 49.6% 49.6% 72.8% 3.9x 3.7x 13.0x 12.3x 18.5x 18.3x 4.6% 3.7% 29.6% 30.2% 11.0% 1.7
First American Financial Corporation 5,747.4 6,343.9 (12.5%) (11.8%) 5.4% 25.7% 1.1x 1.0x 9.5x 7.8x 12.0x 11.5x (5.8%) 7.8% 11.3% 12.8% NA NA
FirstService Corporation 5,195.9 5,908.5 32.5% 15.7% 99.4% 309.7% 2.3x 2.0x 25.7x 20.7x 41.5x 34.6x 8.8% 11.1% 8.8% 9.8% 16.0% 2.6
AppFolio, Inc. 4,851.4 4,920.8 26.6% 44.2% 298.3% 838.1% 15.6x 12.8x NM NM NM NM 23.3% 22.1% 14.5% 16.2% NA NA
Realogy Holdings Corp. 1,097.4 4,634.4 (6.4%) 73.9% (72.7%) (80.1%) 0.9x 0.9x 11.2x 9.1x 10.1x 8.7x (12.8%) 9.7% 8.4% 9.6% NA NA
Close Brothers Group plc* 2,148.9 3,673.8 (31.4%) (17.7%) (28.8%) (24.6%) 3.3x 3.3x 9.5x 9.5x 15.0x 11.3x 5.3% 0.3% 35.2% 36.1% 5.0% 3.0
ABM Industries Incorporated 2,447.2 3,292.2 (4.8%) (14.7%) (19.5%) 8.9% 0.5x 0.5x 10.2x 9.9x 19.2x 16.8x (4.2%) 2.7% 5.2% 5.3% 16.0% 1.2
MGIC Investment Corporation* 2,816.3 3,286.1 (41.6%) (35.6%) (29.1%) (25.3%) 3.5x 3.6x 5.9x 5.1x 7.2x 5.5x 6.7% (1.4%) 59.9% 70.6% NA NA
Radian Group Inc.* 2,892.5 3,045.6 (40.7%) (34.6%) (14.4%) (19.2%) 2.1x 2.1x 5.6x 3.5x 7.2x 5.6x (4.6%) 1.8% 37.1% 58.2% NA NA
Newmark Group, Inc. 746.3 2,729.2 (69.8%) (58.7%) NA NA 1.4x 1.2x 5.0x 4.8x 3.4x 2.9x (9.7%) 13.5% 27.3% 25.1% 10.0% 0.3
Real Matters Inc. 1,935.7 1,838.0 141.9% 246.5% 197.7% NA 11.4x 8.2x 27.6x 19.6x 38.0x 27.7x 42.4% 38.7% 41.2% 41.9% NA NA
Savills plc 1,424.4 1,741.3 (34.1%) (21.4%) (18.2%) (23.6%) 0.7x 0.7x 6.6x 6.4x 17.6x 12.2x (2.9%) 2.7% 10.7% 10.7% NA NA
Altus Group Limited 1,289.1 1,413.2 12.4% 27.3% 66.9% 156.7% 2.5x 2.2x 16.4x 11.9x 31.9x 25.2x 27.8% 13.2% 15.4% 18.8% 26.0% 1.2
Marcus & Millichap, Inc. 1,093.1 824.7 (26.9%) (18.0%) 6.4% (46.8%) 1.3x 1.0x 18.0x 8.0x 48.6x 17.6x (20.3%) 24.8% 7.1% 12.9% NA NA
Altisource Portfolio Solutions S.A. 217.7 415.9 (30.5%) (36.0%) (48.5%) (58.9%) 0.9x 0.9x 26.2x 6.8x NM 21.3x (29.2%) (4.0%) 3.5% 13.9% NA NA
Real Estate / Mortgage Solutions Median (9.5%) (13.2%) 5.4% (17.2%) 2.2x 2.0x 10.7x 9.1x 18.0x 16.8x 1.6% 7.8% 17.1% 19.6% 10.8% 2.1

FINTECH INSIGHT JULY 2020
Disclosures
Sources of data include Capital IQ, FactSet and other news organizations.
Information obtained from third-party sources is considered reliable, but
we do not guarantee that the information herein is accurate or complete.
This report was prepared within Raymond James & Associates’ Investment
Banking Department and is for information purposes only. This report is
not a product of Raymond James & Associates’ Research Department;
recipients of this report should not interpret the information herein as
sufficient grounds for an investment decision or any other decision. The
report shall not constitute an offer to sell or the solicitation of an offer to
buy any of the securities mentioned herein; past performance does not
guarantee future results.
This presentation includes logos or other words or devices that may be
registered trademarks of their respective owners. Such use is solely for
purposes of convenience in referring to the trademark owners and their
products/services. This presentation and its contents are not endorsed,
sponsored or affiliated with any trademark owner. Raymond James &
Associates, Inc. and its affiliates are not affiliated with any trademark
owner but may provide certain financial services to one or more
trademark owners or their affiliates.
Additional information is available upon request.
© 2020 Raymond James & Associates, Inc., member New York Stock Exchange/SIPC. Raymond James® is a registered trademark of Raymond James Financial, Inc.
INVESTMENT BANKING
LTM = Last Twelve MonthsEBITDA = Earnings Before Interest, Taxes, Depreciation and Amortization