recent reversal in loss of global terrestrial...
TRANSCRIPT
LETTERSPUBLISHED ONLINE: 30MARCH 2015 | DOI: 10.1038/NCLIMATE2581
Recent reversal in loss of globalterrestrial biomassYi Y. Liu1,2*, Albert I. J. M. van Dijk3,4, Richard A. M. de Jeu5, Josep G. Canadell6, Matthew F. McCabe7,Jason P. Evans1 and Guojie Wang8
Vegetation change plays a critical role in the Earth’s carbon(C) budget and its associated radiative forcing in response toanthropogenic and natural climate change1–4. Existing globalestimatesofabovegroundbiomasscarbon(ABC)basedonfieldsurvey data provide brief snapshots that are mainly limitedto forest ecosystems5–8. Here we use an entirely new remotesensing approach to derive global ABC estimates for bothforest and non-forest biomes during the past two decadesfrom satellite passive microwave observations. We estimatea global average ABC of 362PgC over the period 1998–2002,of which 65% is in forests and 17% in savannahs. Over theperiod 1993–2012, an estimated −0.07PgC yr−1 ABC was lostglobally, mostly resulting from the loss of tropical forests(−0.26PgC yr−1) and net gains in mixed forests over borealand temperate regions (+0.13 PgC yr−1) and tropical savannahsand shrublands (+0.05PgC yr−1). Interannual ABC patternsare greatly influenced by the strong response of water-limitedecosystems to rainfall variability, particularly savannahs. From2003 onwards, forest in Russia and China expanded andtropical deforestation declined. IncreasedABC associatedwithwetter conditions in the savannahs of northern Australia andsouthern Africa reversed global ABC loss, leading to an overallgain, consistent with trends in the global carbon sink reportedin recent studies1,3,9.
Over the past two decades, the terrestrial biosphere has acted asa sink for atmospheric CO2, removing on average approximately2.5 petagrams of carbon per year (PgC yr−1): equivalent to 25% offossil fuel emissions1–4. Additional emissions from land-use changereduce the global net land sink to approximately 1.5 PgC yr−1, withforests playing a dominant role5. Monitoring C stock changes overtime can be used to determine which ecosystems and processesdrive changes in C fluxes and to develop strategies for climatechange mitigation. The existing global ABC estimates based onfield survey data, such as the recent global synthesis by Pan et al.5,provide snapshots in time and are limited to forest ecosystems only.Estimating ABC using satellite remote sensing can provide a moreconsistent methodology and global coverage6. Although offeringhigh spatial resolution, current remote sensing products havelimited temporal frequency and record length at the global scale6–8.
Here, we derive global ABC estimates for all vegetation typesfor the past two decades using an entirely new approach that
uses satellite-based passive microwave data rather than the opticalor radar observations used previously. The intensity of naturalmicrowave radiation from the Earth is a function of its temperature,soil moisture and the shielding effect of water in abovegroundvegetation biomass, including canopy and woody components10–12.The biomass signal is captured in the vegetation optical depth(VOD; refs 13,14). A distinct advantage of passive microwave-derived VOD is that it remains sensitive to biomass variationsat a relatively high biomass density (for example, rainforests),whereas optical-based remotely sensed vegetation products rapidlysaturate14,15. ABC estimates can be derived for all vegetation types,not only forests, as a suitable harmonized global VOD record existsfrom the 1990s onwards14.
The main disadvantage of this technique is the relatively coarsespatial resolution (>10 km), which is a consequence of the lowenergy of the Earth’s natural microwave emissions. This means thatindividual plot measurements cannot be used directly to establisha relationship between VOD and ABC. Instead, we use an indirectcalibration method based on spatial ‘snapshot’ ABC estimates fromSaatchi et al.6, who combined three types of satellite observationswith plot-based measurements to estimate ABC in tropical regions(see Methods and Supplementary Information).
Global C stocksWe estimate total global ABC at 362 PgC with a 90% confidenceinterval (CI90) of 310–422 PgC circa 2000 (that is, 1998–2002;Fig. 1a). ABC values per region and biome and annual ABCchange rate are very close to values reported in other studieswhen the same categorization, definitions and assumptions areapplied5–7 (see Supplementary Information for details). Our ABCestimates for boreal forests (CI90 = 37–66 PgC) and temperateforests (CI90=24–39 PgC) circa 2000 overlap with inventory-basedestimates (44 and 36.4 PgC, respectively) by Pan and colleagues5.For tropical forests, our ABC estimates are comparable to Pan et al.5(205 versus our 195; CI90=180–208 PgC circa 2000), Saatchi et al.6(173–212 versus our 211; CI90 = 194–226 PgC for 10% treecover threshold circa 2000) and Baccini et al.7 (159 versus our157; CI90=146–166 PgC circa 2007/8). For the savannahs andshrublands of the pan-tropics (excluding Australia), Baccini et al.7reported 51 PgC ABC circa 2007/8, which is similar to our estimateof 49 (CI90=42–56) PgC (see Supplementary Information).
1ARC Centre of Excellence for Climate Systems Science & Climate Change Research Centre, University of New South Wales, Sydney, New South Wales2052, Australia. 2Water Research Centre, School of Civil and Environmental Engineering, University of New South Wales, Sydney, New South Wales 2052,Australia. 3Fenner School of Environment & Society, Australian National University, Canberra, Australian Capital Territory 0200, Australia. 4CSIRO Landand Water Flagship, Canberra, Australian Capital Territory 2601, Australia. 5Earth and Climate Cluster, Department of Earth Sciences, Faculty of Earth andLife Sciences, VU University Amsterdam, Amsterdam 1081 HV, Netherlands. 6Global Carbon Project, CSIRO Oceans and Atmosphere Flagship, Canberra,Australian Capital Territory 2601, Australia. 7Water Desalination and Reuse Center, Division of Biological and Environmental Sciences and Engineering,King Abdullah University of Science and Technology, Thuwal, 23955-6900, Saudi Arabia. 8School of Geography and Remote Sensing, Nanjing University ofInformation Science and Technology, Nanjing 210044, China. *e-mail: [email protected]
NATURE CLIMATE CHANGE | ADVANCE ONLINE PUBLICATION | www.nature.com/natureclimatechange 1© 2015 Macmillan Publishers Limited. All rights reserved.
LETTERS NATURE CLIMATE CHANGE DOI: 10.1038/NCLIMATE2581
Total ABC (PgC)
a b c
ABC density (Mg C ha−1) ABC trend (Tg C yr−1)
Boreal/temperate evergreenand deciduous forestsBoreal/temperate mixed forests
Shrublands
Woody savannahs
Savannahs
Grasslands
Croplands
Tropical forests
0 0 25 50 75 100 125 150 −300 −200 −100 0 100 200255075100125150175
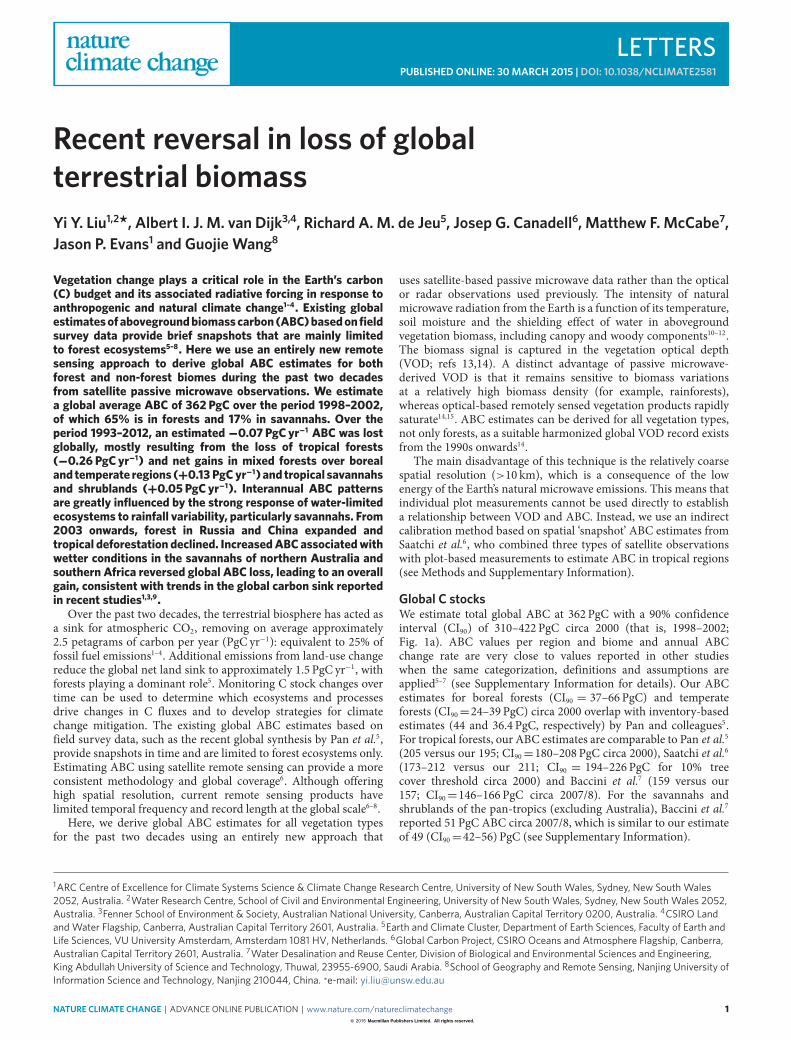
Figure 1 | Aboveground biomass carbon stores and density by biome. a, Total ABC in eight biomes circa 2000 (mean estimate; error bars indicate the90% confidence interval). ‘Tropical forests’ include those in Southeast Asia, Africa and the Americas (that is, South America, Caribbean countries andMexico); remaining forests are considered as ‘boreal/temperate’. ‘Shrublands’ includes both open and closed shrublands; ‘Croplands’ includes both‘croplands’ and ‘cropland/natural vegetation mosaic’ based on the MODIS IGBP land-cover map for 2001 (ref. 16). b, ABC density per unit area circa 2000.The bottom, middle and top band of the box represent the 25th, 50th (median) and 75th percentile, respectively, and the ends of the whiskers representthe 5th and 95th percentile for all corresponding grid cells. c, Annual trends in total biome ABC for 1993–2012 (mean estimate; error bars indicate the 90%confidence interval). The classification relates to year 2001 and grouping of di�erent biomes to the same colour is mainly based on woody vegetationcanopy cover, that is, 10–60% for shrublands, savannahs and woody savannahs and less than 10% for grasslands. Croplands with harvest and thusconsiderable variation in woody components are grouped with grasslands.
Applying the MODIS Collection 5 International GeosphereBiosphere Programme (IGBP) land-cover classificationproduct (MCD12C1; ref. 16) of 2001, tropical forests contain162 (CI90=151–172) PgC or 44% of global ABC, whereasthe remaining forests contain 73 (CI90 = 56–93) PgC or21%. Savannahs (including woody savannahs) make upanother 62 (CI90=53–74) PgC or 17%, whereas shrublands(15, CI90=11–20 PgC), grasslands (15, CI90=12–19 PgC) andcroplands (35, CI90 = 28–44 PgC, including vegetation mosaics)together account for the remaining 18%. We emphasize that ourrelatively coarse 0.25◦ resolution data represent biome-integratedvalues rather than values for component land-cover units. Forexample, at 0.25◦ resolution a considerable part of cropland ABCmay be contained in forests, woodlots and individual trees presentwithin the agricultural landscape. Also, because dynamic land-cover maps were not available before 2000, changes in area betweenland-cover types during this period are not explicitly accounted for.
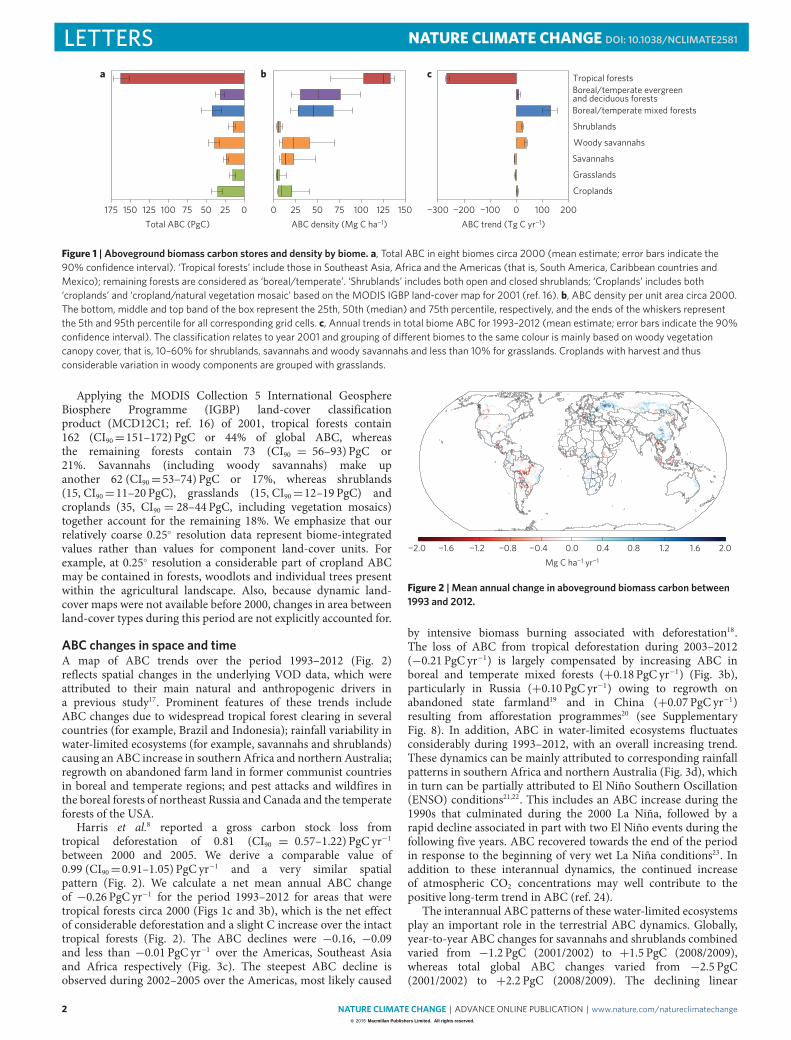
ABC changes in space and timeA map of ABC trends over the period 1993–2012 (Fig. 2)reflects spatial changes in the underlying VOD data, which wereattributed to their main natural and anthropogenic drivers ina previous study17. Prominent features of these trends includeABC changes due to widespread tropical forest clearing in severalcountries (for example, Brazil and Indonesia); rainfall variability inwater-limited ecosystems (for example, savannahs and shrublands)causing an ABC increase in southern Africa and northern Australia;regrowth on abandoned farm land in former communist countriesin boreal and temperate regions; and pest attacks and wildfires inthe boreal forests of northeast Russia and Canada and the temperateforests of the USA.
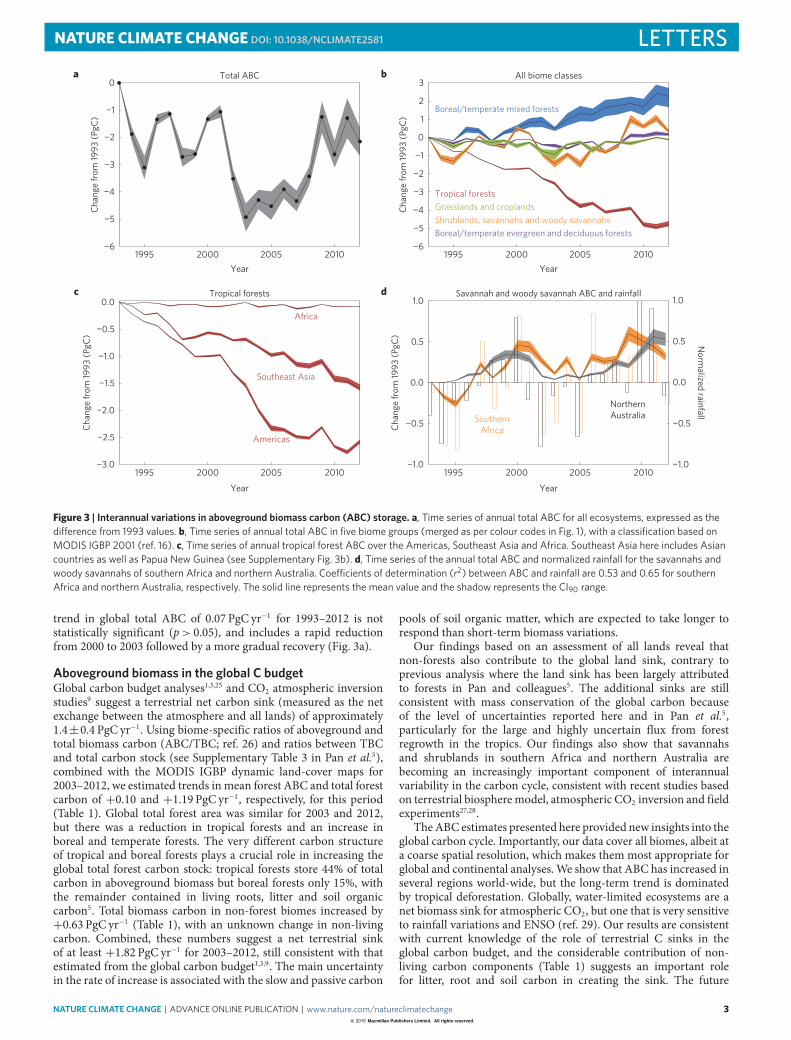
Harris et al.8 reported a gross carbon stock loss fromtropical deforestation of 0.81 (CI90 = 0.57–1.22) PgC yr−1between 2000 and 2005. We derive a comparable value of0.99 (CI90=0.91–1.05) PgC yr−1 and a very similar spatialpattern (Fig. 2). We calculate a net mean annual ABC changeof −0.26 PgC yr−1 for the period 1993–2012 for areas that weretropical forests circa 2000 (Figs 1c and 3b), which is the net effectof considerable deforestation and a slight C increase over the intacttropical forests (Fig. 2). The ABC declines were −0.16, −0.09and less than −0.01 PgC yr−1 over the Americas, Southeast Asiaand Africa respectively (Fig. 3c). The steepest ABC decline isobserved during 2002–2005 over the Americas, most likely caused
−2.0 −1.6 −1.2 −0.8 −0.4 0.0 0.4 0.8 1.2 1.6 2.0Mg C ha−1 yr−1
Figure 2 | Mean annual change in aboveground biomass carbon between1993 and 2012.
by intensive biomass burning associated with deforestation18.The loss of ABC from tropical deforestation during 2003–2012(−0.21 PgC yr−1) is largely compensated by increasing ABC inboreal and temperate mixed forests (+0.18 PgC yr−1) (Fig. 3b),particularly in Russia (+0.10 PgC yr−1) owing to regrowth onabandoned state farmland19 and in China (+0.07 PgC yr−1)resulting from afforestation programmes20 (see SupplementaryFig. 8). In addition, ABC in water-limited ecosystems fluctuatesconsiderably during 1993–2012, with an overall increasing trend.These dynamics can be mainly attributed to corresponding rainfallpatterns in southern Africa and northern Australia (Fig. 3d), whichin turn can be partially attributed to El Niño Southern Oscillation(ENSO) conditions21,22. This includes an ABC increase during the1990s that culminated during the 2000 La Niña, followed by arapid decline associated in part with two El Niño events during thefollowing five years. ABC recovered towards the end of the periodin response to the beginning of very wet La Niña conditions23. Inaddition to these interannual dynamics, the continued increaseof atmospheric CO2 concentrations may well contribute to thepositive long-term trend in ABC (ref. 24).
The interannual ABC patterns of these water-limited ecosystemsplay an important role in the terrestrial ABC dynamics. Globally,year-to-year ABC changes for savannahs and shrublands combinedvaried from −1.2 PgC (2001/2002) to +1.5 PgC (2008/2009),whereas total global ABC changes varied from −2.5 PgC(2001/2002) to +2.2 PgC (2008/2009). The declining linear
2 NATURE CLIMATE CHANGE | ADVANCE ONLINE PUBLICATION | www.nature.com/natureclimatechange© 2015 Macmillan Publishers Limited. All rights reserved.
NATURE CLIMATE CHANGE DOI: 10.1038/NCLIMATE2581 LETTERS
1995 2000 2005 2010−6
−5
−4
−3
−2
−1
0Ch
ange
from
1993
(PgC
)
Total ABCa
1995 2000 2005 2010
1995 2000 2005 2010 1995 2000
YearYear
YearYear
2005 2010
−6
−5
−4
−3
−2
−1
0
1
2
3
Chan
ge fr
om 19
93 (P
gC)
All biome classes
−3.0
−2.5
−2.0
−1.5
−1.0
−0.5
0.0
Chan
ge fr
om 19
93 (P
gC)
Tropical forests
−1.0
−0.5
0.0
0.5
1.0
Chan
ge fr
om 19
93 (P
gC)
Norm
alized rainfall
Savannah and woody savannah ABC and rainfall1.0
−0.5
−1.0
0.0
0.5
NorthernAustralia
Shrublands, savannahs and woody savannahs
Tropical forests
Boreal/temperate mixed forests
Grasslands and croplands
Americas
Southeast Asia
Africa
Boreal/temperate evergreen and deciduous forests
SouthernAfrica
b
c d
Figure 3 | Interannual variations in aboveground biomass carbon (ABC) storage. a, Time series of annual total ABC for all ecosystems, expressed as thedi�erence from 1993 values. b, Time series of annual total ABC in five biome groups (merged as per colour codes in Fig. 1), with a classification based onMODIS IGBP 2001 (ref. 16). c, Time series of annual tropical forest ABC over the Americas, Southeast Asia and Africa. Southeast Asia here includes Asiancountries as well as Papua New Guinea (see Supplementary Fig. 3b). d, Time series of the annual total ABC and normalized rainfall for the savannahs andwoody savannahs of southern Africa and northern Australia. Coe�cients of determination (r2) between ABC and rainfall are 0.53 and 0.65 for southernAfrica and northern Australia, respectively. The solid line represents the mean value and the shadow represents the CI90 range.
trend in global total ABC of 0.07 PgC yr−1 for 1993–2012 is notstatistically significant (p> 0.05), and includes a rapid reductionfrom 2000 to 2003 followed by a more gradual recovery (Fig. 3a).
Aboveground biomass in the global C budgetGlobal carbon budget analyses1,3,25 and CO2 atmospheric inversionstudies9 suggest a terrestrial net carbon sink (measured as the netexchange between the atmosphere and all lands) of approximately1.4±0.4 PgC yr−1. Using biome-specific ratios of aboveground andtotal biomass carbon (ABC/TBC; ref. 26) and ratios between TBCand total carbon stock (see Supplementary Table 3 in Pan et al.5),combined with the MODIS IGBP dynamic land-cover maps for2003–2012, we estimated trends inmean forest ABC and total forestcarbon of +0.10 and +1.19 PgC yr−1, respectively, for this period(Table 1). Global total forest area was similar for 2003 and 2012,but there was a reduction in tropical forests and an increase inboreal and temperate forests. The very different carbon structureof tropical and boreal forests plays a crucial role in increasing theglobal total forest carbon stock: tropical forests store 44% of totalcarbon in aboveground biomass but boreal forests only 15%, withthe remainder contained in living roots, litter and soil organiccarbon5. Total biomass carbon in non-forest biomes increased by+0.63 PgC yr−1 (Table 1), with an unknown change in non-livingcarbon. Combined, these numbers suggest a net terrestrial sinkof at least +1.82 PgC yr−1 for 2003–2012, still consistent with thatestimated from the global carbon budget1,3,9. The main uncertaintyin the rate of increase is associated with the slow and passive carbon
pools of soil organic matter, which are expected to take longer torespond than short-term biomass variations.
Our findings based on an assessment of all lands reveal thatnon-forests also contribute to the global land sink, contrary toprevious analysis where the land sink has been largely attributedto forests in Pan and colleagues5. The additional sinks are stillconsistent with mass conservation of the global carbon becauseof the level of uncertainties reported here and in Pan et al.5,particularly for the large and highly uncertain flux from forestregrowth in the tropics. Our findings also show that savannahsand shrublands in southern Africa and northern Australia arebecoming an increasingly important component of interannualvariability in the carbon cycle, consistent with recent studies basedon terrestrial biospheremodel, atmospheric CO2 inversion and fieldexperiments27,28.
TheABC estimates presented here provided new insights into theglobal carbon cycle. Importantly, our data cover all biomes, albeit ata coarse spatial resolution, which makes them most appropriate forglobal and continental analyses.We show that ABC has increased inseveral regions world-wide, but the long-term trend is dominatedby tropical deforestation. Globally, water-limited ecosystems are anet biomass sink for atmospheric CO2, but one that is very sensitiveto rainfall variations and ENSO (ref. 29). Our results are consistentwith current knowledge of the role of terrestrial C sinks in theglobal carbon budget, and the considerable contribution of non-living carbon components (Table 1) suggests an important rolefor litter, root and soil carbon in creating the sink. The future
NATURE CLIMATE CHANGE | ADVANCE ONLINE PUBLICATION | www.nature.com/natureclimatechange 3© 2015 Macmillan Publishers Limited. All rights reserved.

LETTERS NATURE CLIMATE CHANGE DOI: 10.1038/NCLIMATE2581
Table 1 | Linear trends in ABC (aboveground biomass carbon), TBC (above- and belowground biomass carbon combined) and totalcarbon stock for various biome classes during 2003–2012.
2003–2012
ABC trend TBC/ABC TBC trend Total C∗/TBC Total C trend(PgC yr−1) ratio (PgC yr−1) ratio (PgC yr−1)
Boreal forests +0.16a 1.24 +0.20a 5.18 +1.04a
Temperate forests +0.17b 1.24 +0.21b 3.19 +0.67b
Tropical forests −0.23c 1.26 −0.29c 1.80 −0.52c
Forest† +0.10a+0.12a
+1.19a
Shrublands +0.08b 2.78 +0.21b – >+0.21b
Woody savannahs +0.11b 1.82 +0.20b – >+0.20b
Savannahs +0.08b 2.38 +0.20b – >+0.20b
Grasslands −0.002b 3.45 −0.01c – <−0.01c
Croplands +0.02c 1.25 +0.03b – >+0.03b
Non-forest‡ +0.29b+0.63b >+0.63b
Total +0.39a+0.75b >+1.82a
The classification takes into account the land-cover dynamics during 2003–2012. a, b and c represents the uncertainty (that is, ratio between half range of CI90 and mean value) >25%, 10–25% and<10%, respectively. ∗Total C includes TBC and non-living carbon in dead wood, litter and soil organic matter for a soil depth of 1 m (see Supplementary Table 3 in Pan et al.5). †A grid cell is consideredas ‘forest’ if it is classified as ‘forest’ in any year during 2003–2012 according to the MODIS IGBP land-cover maps. Thus, the ABC trend reflects the net influence of forest changes (that is,deforestation, a�orestation and reforestation combined). ‡The ratios between total carbon and total living carbon for non-forest land-cover types are unknown.
of the terrestrial carbon sink may be particularly sensitive tothe evolution of tropical deforestation rates, the fate of Eurasia’sformer croplands, afforestation in China, and rainfall in sub-humidtropical savannahs.
MethodsThe ABC estimates were based on harmonized VOD data for 1993 onwardsderived from a series of passive microwave satellite sensors14, including SpecialSensor Microwave Imager (SSM/I), Advanced Microwave Scanning Radiometerfor Earth Observation System (AMSR-E), FengYun-3B Microwave RadiometerImager (MWRI) and Windsat. VOD values affected by the presence of inlandwater bodies were corrected by considering nearby grid cells with the samelandscape type. Values missing owing to frost conditions were estimated usingtwo alternative assumptions about ABC decreases in winter. An empiricalrelationship was established to convert VOD to ABC by calibrating against theaboveground biomass map for tropical regions from Saatchi et al.6 to predict themean and 90% confidence interval (CI90; see Section 2.1 in SupplementaryInformation). We combined these with the two frost corrections to produce sixABC estimates and report the mean and the CI90 range of the resulting analyses.Global estimates of ABC stocks and changes were compared to ABC valuesestimated from Pan et al.5, Baccini et al.7 and Harris et al.8; taking care to matchthe reported biome area, measurement period, and definition of countries andregions. Pan et al.5 reported TBC only, but we could infer ABC from thedescription of methods. A global land-cover map based on the MODIS Collection5 IGBP classification product (MCD12C1; ref. 16) was re-sampled to 0.25◦ bydominant land use to calculate ABC per biome. The Global PrecipitationClimatology Centre (GPCC) precipitation data for 1993–2012 were used ininterpretation30. To estimate the TBC from our ABC values, we applied theconversion factors used by Pan et al.5 for different forests and used literaturevalues for non-forest vegetation26. Further details are provided in theSupplementary Information. The aboveground biomass carbon (ABC)data set derived and used in this study over the period 1993–2012 can beaccessed at http://www.wenfo.org/wald/global-biomass andhttp://hydrology.unsw.edu.au/downloads/data/global-biomass
Received 12 May 2014; accepted 27 January 2015;published online 30 March 2015
References1. Le Quéré, C. et al. Global carbon budget 2013. Earth Syst. Sci. Data 6,
235–263 (2014).2. Le Quéré, C. et al. Trends in the sources and sinks of carbon dioxide. Nature
Geosci. 2, 831–836 (2009).3. Canadell, J. G. et al. Contributions to accelerating atmospheric CO2 growth
from economic activity, carbon intensity, and efficiency of natural sinks. Proc.Natl Acad. Sci. USA 104, 18866–18870 (2007).
4. Peters, G. P. et al. The challenge to keep global warming below 2 ◦C. NatureClim. Change 3, 4–6 (2013).
5. Pan, Y. D. et al. A large and persistent carbon sink in the world’s forests. Science333, 988–993 (2011).
6. Saatchi, S. S. et al. Benchmark map of forest carbon stocks in tropical regionsacross three continents. Proc. Natl Acad. Sci. USA 108, 9899–9904 (2011).
7. Baccini, A. et al. Estimated carbon dioxide emissions from tropical deforestationimproved by carbon-density maps. Nature Clim. Change 2, 182–185 (2012).
8. Harris, N. L. et al. Baseline map of carbon emissions from deforestation intropical regions. Science 336, 1573–1576 (2012).
9. Peylin, P. et al. Global atmospheric carbon budget: Results from an ensemble ofatmospheric CO2 inversions. Biogeosciences 10, 6699–6720 (2013).
10. Jackson, T. J. & Schmugge, T. J. Vegetation effects on the microwave emission ofsoils. Remote Sens. Environ. 36, 203–212 (1991).
11. Kerr, Y. H. & Njoku, E. G. A semiempirical model for interpreting microwaveemission from semiarid land surfaces as seen from space. IEEE Trans. Geosci.Remote Sensing 28, 384–393 (1990).
12. Guglielmetti, M. et al.Measured microwave radiative transfer properties of adeciduous forest canopy. Remote Sens. Environ. 109, 523–532 (2007).
13. Owe, M., De Jeu, R. & Walker, J. A methodology for surface soil moisture andvegetation optical depth retrieval using the microwave polarization differenceindex. IEEE Trans. Geosci. Remote Sensing 39, 1643–1654 (2001).
14. Liu, Y. Y., de Jeu, R. A. M., McCabe, M. F., Evans, J. P. & van Dijk, A. I. J. M.Global long-term passive microwave satellite-based retrievals of vegetationoptical depth. Geophys. Res. Lett. 38, L18402 (2011).
15. Sellers, P. J. Canopy reflectance, photosynthesis and transpiration. Int. J. RemoteSensing 6, 1335–1372 (1985).
16. Friedl, M. A. et al.MODIS Collection 5 global land cover: Algorithmrefinements and characterization of new datasets. Remote Sens. Environ. 114,168–182 (2010).
17. Liu, Y. Y., van Dijk, A. I. J. M., McCabe, M. F., Evans, J. P. & de Jeu, R. A. M.Global vegetation biomass change (1988–2008) and attribution toenvironmental and human drivers. Glob. Ecol. Biogeogr. 22, 692–705 (2013).
18. Koren, I., Remer, L. A. & Longo, K. Reversal of trend of biomass burning in theAmazon. Geophys. Res. Lett. 34, L20404 (2007).
19. Zamolodchikov, D. G., Grabovskii, V. I. & Kraev, G. N. A twenty yearretrospective on the forest carbon dynamics in Russia. Contemp. Probl. Ecol. 4,706–715 (2011).
20. Fang, J. et al. Forest biomass carbon sinks in East Asia, with special reference tothe relative contributions of forest expansion and forest growth. Glob. ChangeBiol. 20, 2019–2030 (2014).
21. Liu, Y., de Jeu, R. A. M., van Dijk, A. I. J. M. & Owe, M. TRMM-TMIsatellite observed soil moisture and vegetation density (1998–2005) showstrong connection with El Niño in eastern Australia. Geophys. Res. Lett. 34,L15401 (2007).
22. Miralles, D. G. et al. El Niño–La Niña cycle and recent trends in continentalevaporation. Nature Clim. Change 4, 122–126 (2014).
23. Kim, W., Yeh, S. W., Kim, J. H., Kug, J. S. & Kwon, M. The unique 2009–2010 ElNiño event: A fast phase transition of warm pool El Niño to La Niña. Geophys.Res. Lett. 38, L15809 (2011).
24. Bond, W. J. & Midgley, G. F. Carbon dioxide and the uneasy interactions oftrees and savannah grasses. Phil. Trans. R. Soc. B 367, 601–612 (2012).
4 NATURE CLIMATE CHANGE | ADVANCE ONLINE PUBLICATION | www.nature.com/natureclimatechange© 2015 Macmillan Publishers Limited. All rights reserved.

NATURE CLIMATE CHANGE DOI: 10.1038/NCLIMATE2581 LETTERS25. Friedlingstein, P. et al. Update on CO2 emissions. Nature Geosci. 3,
811–812 (2010).26. Robinson, D. Implications of a large global root biomass for carbon sink
estimates and for soil carbon dynamics. Phil. Trans. R. Soc. B 274,2753–2759 (2007).
27. Buitenwerf, R., Bond, W. J., Stevens, N. & Trollope, W. S. W. Increased treedensities in South African savannas: >50 years of data suggests CO2 as a driver.Glob. Change Biol. 18, 675–684 (2012).
28. Poulter, B. et al. Contribution of semi-arid ecosystems to interannual variabilityof the global carbon cycle. Nature 509, 600–603 (2014).
29. Zhao, M. & Running, S. W. Drought-induced reduction in global terrestrialnet primary production from 2000 through 2009. Science 329,940–943 (2010).
30. Schneider, U. et al. GPCC Full Data Reanalysis Version 6.0 at 1.0◦: MonthlyLand-Surface Precipitation from Rain-Gauges built on GTS-based and HistoricData (GPCC, 2011); http://dx.doi.org/10.5676/DWD_GPCC/FD_M_V6_100
AcknowledgementsY.Y.L. is the recipient of an Australian Research Council Discovery Early CareerResearcher Award (DECRA) Fellowship (project number DE140100200). J.G.C.
acknowledges the support of the Australian Climate Change Science Program. M.F.M. isfunded by the King Abdullah University of Science and Technology. G.W. is supported bythe National Natural Science Foundation of China (numbers 41375099 and 91337108).We thank Y. Pan for helping to interpret forest inventory data and S. Saatchi for providingthe aboveground biomass map for tropical regions.
Author contributionsAll authors contributed to the development of the paper. Y.Y.L. and A.I.J.M.v.D. designedthe study. R.A.M.d.J., Y.Y.L. and G.W. prepared the VOD data set. Y.Y.L. conducted theanalysis and wrote the Supplementary Information. A.I.J.M.v.D. and J.G.C. summarizedthe results and wrote the first draft of the paper, with subsequent addition andimprovement by all authors.
Additional informationSupplementary information is available in the online version of the paper. Reprints andpermissions information is available online at www.nature.com/reprints.Correspondence and requests for materials should be addressed to Y.Y.L.
Competing financial interestsThe authors declare no competing financial interests.
NATURE CLIMATE CHANGE | ADVANCE ONLINE PUBLICATION | www.nature.com/natureclimatechange 5© 2015 Macmillan Publishers Limited. All rights reserved.