recent estimates of exchange rate pass-through to …aei.pitt.edu/78919/1/cheikh.rault.pdfe-mail:...
TRANSCRIPT
1
Recent estimates of exchange rate pass-through to import prices in the euro area
Nidhaleddine Ben Cheikh - Christophe Rault
Abstract This paper provides an update on the exchange rate pass-through (ERPT) estimates for 12 euro area (EA) countries. First, based on quarterly data over the 1990-2012 period, our study does not find a significant heterogeneity in the degree of pass-through across the monetary union members, in contrast to previous empirical studies. As we use a longer time span for the post-EA era than existing studies, this is not surprising, since the process of monetary union has entailed some convergence towards more stable macroeconomic conditions across euro area (EA) member states. Second, when assessing the stability of pass-through elasticities, we find very weak evidence of a decline around the inception of the euro in 1999. However, our results reveal that a downtrend in ERPT estimates became apparent starting from the beginning of the 1990s. This observed decline was synchronous to the shift towards reduced inflation regimes in our sample of countries. Finally, we notice that the distinction between “peripheral” and “core” EA economies in terms of pass-through has significantly decreased over the last two decades. Keywords Exchange rate pass-through - Import prices - Euro area JEL classification E31 - F31 - F40 N.Ben Cheikh ESSCA School of Management 1 Rue Lakanal, 49000 Angers, France C. Rault University of Orléans (LEO, UMR CNRS 7322) Rue de Blois, B.P.6739, 45067 Orléans Cedex 2, France e-mail: [email protected] C. Rault CESifo and IZA, Germany We are grateful to an anonymous referee for helpful comments and suggestions on an earlier draft of this paper.
2
1 Introduction
The study of the degree of exchange rate pass-through (ERPT) into import prices is of great policy interest in the euro area (EA) context. As import prices are a principal channel through which movements in the euro affect domestic prices and hence also the variability of inflation and output, the issue of pass-through has important implications for variations in price level developments within the monetary union. A common exchange rate shock may impact EA member states differently depending on their respective relative patterns of external exposure and openness to trade outside the euro zone. Thus, in achieving its target of medium-term price stability for the whole EA, the single monetary policy of the European Central Bank (ECB) must factor in the extent to which euro exchange rate changes affect import prices.
It is of special significance that the continuous depreciation of the euro (about 20% on a trade-weighted basis in the first two years) since its introduction has raised concerns that it might increase risks to price stability. The weakening of the exchange rate of the euro is likely to put upward pressure on import costs and producer prices, which can lead to higher consumer prices. The concern about single currency depreciation affecting price stability has been clearly expressed by the monetary authority in the EA. In fact, the ECB cited the inflationary effects of a lower value of the euro as a factor behind its tightening of monetary policy in 2000.1 This outcome raised important questions regarding the magnitude and stability of ERPT since 1999, and, mainly, whether EA members will be differentially affected or not by changes in the common external exchange rate. There has been a growing interest in European ERPT in recent years. Studies conducted for the case of EA countries include Hüfner and Schröder (2002), Hahn (2003), Anderton (2003), Campa et al. (2005), Campa and Gonzàlez (2006), and Faruqee (2006). A common drawback of these studies is the short time span available since the adoption of the euro in 1999. Therefore, in our study, we propose an update to ERPT elasticities using a longer time period and more observations for the post-EA era.
Another important issue in the literature is the observed decline in the sensitivity of import prices to exchange rate movements in major industrialized countries. Although the creation of the single currency in the EA constituted a shift in both competition conditions and monetary policy, the European ERPT studies, including Campa et al. (2005) and Campa and Gonzàlez (2006), have failed to provide strong evidence of a reduction in pass-through. In fact, there are several factors which may lead to a change in the behavior of ERPT and thus would explain why the responsiveness of import prices has moved down markedly in the last two decades. An intriguing hypothesis was suggested by Taylor (2000), who explains that the shift towards more credible monetary policy and thus a low-inflation regime would reduce the transmission of exchange rate changes. This assumption is very appealing and has received strong empirical support in the recent literature (see e.g. Gagnon and Ihrig 2004; Bailliu and Fujii 2004; Choudhri and Hakura 2006). Nevertheless, the causes of the decline in pass-through are difficult to pin down with certainty, and there is an ongoing debate in this regard. In their sample of 23 OECD countries, Campa and Goldberg (2005) distinguish “micro-economic” from “macro-economic” explanations. The authors suggest that the product composition of a country’s imports is more important by far than macroeconomic factors such as the inflation environment. That is, the shift in the composition of imports towards goods whose prices are less sensitive to exchange rate movements, such as differentiated manufactured products, is the most important driver of the marked fall in pass-through. Given
1 See the statements given by the ECB in connection to Council monetary policy decisions between February and July 2000.

3
the variability of the empirical findings, we seek here to shed light on some of these issues by revisiting the euro zone case.
The purpose of this paper is to provide new up-to-date estimates of ERPT into import prices for 12 EA countries using quarterly data over the 1990-2012 period. First, we begin by estimating a benchmark ERPT equation and analyzing the main properties of the pass-through elasticities in our sample. This enables us to compare our results with those of the existing empirical literature on the EA, such as Campa et al. (2005), Campa and Gonzàlez (2006). These studies used a few observations only for the monetary union period (post-EA era); hence, their results are updated here. Following this individual estimate exercise, we assess the cross-country differences in our EA sample by investigating whether the inflation level and degree of openness of an economy, as potential macro determinants, determine the magnitude of the pass-through. Next, we verify the stability of the sensitivity of import prices to exchange rate movements over time. There are several reasons to believe that the degree of pass-through has changed since the inception of the euro in 1999. Among these explanations are the reduction of shares of imports exposed to exchange rate fluctuations and the increase of the choice of the euro as a currency of denomination. Unlike Gagnon and Ihrig (2004), we formally investigate for the decline of pass-through using structural break tests and rolling window regression approach.2 Finally, we estimate our pass-through equation over different time periods and compare results with those obtained over the benchmark period.
The rest of the paper is structured as follows: Section 2 briefly reviews the literature on ERPT. Section 3 provides some theoretical considerations. Section 4 explains the empirical strategy and data sets used. Section 5 reports estimates of ERPT to import prices, discusses the connection with some macroeconomic variables, and investigates the potential decline in pass-through elasticities. Section 6 offers some concluding remarks. 2 Overview of the literature
The mechanism of ERPT has long been of interest and has spawned many studies over the years. Acknowledging the significant economic literature, we survey only a few important studies concerning pass-through to import prices that are frequently cited. The early literature was mostly composed of papers dealing with ERPT into import prices from a microeconomic perspective.3 In that vein, industrial organization characteristics such as the presence of imperfect competition and price discrimination in international markets are the main factors explaining incomplete pass-through. In seminal papers, Dornbusch (1987) and Krugman (1987) justified incomplete pass-through as arising from firms that operate in a market characterized by imperfect competition and adjust their markup in response to an exchange rate shock. As is well-known, the markup depends on the elasticity of demand for a given product, which, in turn, is determined by competitor prices. Facing a change in the exchange rate, producers can decide whether and to what degree the markup should absorb these changes. When the currency of the importing country is depreciating, a foreign firm might cut its price by reducing its markup, in order to stabilize its price in terms of the importing country’s currency, in which case pass-through is less than complete. It is important to note
2 Also, contrary to our study, Gagnon and Ihrig (2004) focus on the transmission of the exchange rate movements to consumer prices. 3 It is noteworthy that most of the early pass-through literature focused on traded goods prices such as import or export prices and very little on consumer price ERPT.
4
that the micro-based literature has a partial-equilibrium approach; in other words, it focuses on the response of prices to an exogenous movement in the nominal exchange rate.4
Although the degree of pass-through has played a central role in debates in international economics for a long time, the question of whether pass-through can be influenced by the macroeconomic environment, and in particular, the role of monetary policy, is a more recent occurrence. The emerging macro literature has focused on the issue of the relatively widespread and on-going decline in ERPT. A popular view in this regard has been put forward by Taylor (2000) who provides a model where lower pass-through is caused by lower perceived persistence of inflation. The more persistent inflation is, the less exchange rate movements are perceived to be transitory and the more firms might respond via price adjustments. Thus, countries with credible and anti-inflationary monetary policies tend to experience lower ERPT.5 Several empirical studies were very supportive of Taylor’s view.6 For instance, Gagnon and Ihrig (2004) explore the relationship between pass-through to consumer prices and inflation stabilization in a sample of 20 industrialized countries over the period of 1972-2003. They find that pass-through generally declined in the 1990s and countries with low and stable inflation rates tend to have low estimated rates of pass-through.
Furthermore, Taylor’s hypothesis has been theoretically examined in the context of the new open-economy macroeconomics.7 In this type of framework, ERPT will depend on different pricing strategies, namely whether the foreign exporter follows a producer currency pricing (PCP) or local currency pricing (LCP) strategy. When prices are determined in the exporter’s currency (PCP), pass-through tends to be much greater than when prices are set in the importer’s currency (LCP). In the extreme case of a purely exogenous exchange rate shock, ERPT would be one under PCP and zero under LCP. It is worth noting that this literature connects macroeconomic and microeconomic factors. Devereux et al. (2003) developed a dynamic general equilibrium model linking the extent of pass-through to monetary policy. They conclude that countries with low relative exchange rate variability and relatively stable monetary policies would have their currencies chosen for transaction invoicing. In this case, prices are sticky in the currency of the importing country (LCP), and pass-through tends to be low. However, ERPT would be higher for importing countries with more volatile monetary policy. Prices will be preset in the currency of the exporter, which entails the prevalence of the PCP strategy, and then ERPT will tend to be high.8 However, Ihrig et al. (2006) warn against the LCP hypothesis. As a matter of fact, exporters may choose to invoice in the currency of the destination market to shield the price paid by their clients from exchange rate movements in the medium-term. However, over the long run, in the case of a protracted appreciation of the exporters’ currency, they will have to adjust their local currency price to keep their margins in the black.
However, there is a serious debate on the prevalence of macroeconomic factors vs. microeconomic factors. Goldberg and Tille (2008) provide empirical evidence suggesting that the choice of invoicing currency is influenced more by the product composition of trade than
4 As an alternative to this approach, structural vector autoregressions (VAR) have become increasingly popular as a method to estimate ERPT (see e.g. McCarthy, 2007). One reason for using the structural VAR approach is that it takes explicit account of the endogeneity of the exchange rate and allows for the estimation of pass-through to a set of prices, such as import prices, producer prices, and consumer prices, simultaneously. 5 This explanation seems to bear more on pass-through to consumer prices than on pass-through to import prices. 6 Most of these studies consider the pass-through to consumer prices. 7 This strand of literature is based mainly on the Obstfeld and Rogoff’s (1995) seminal Redux model incorporating imperfect competition and price inertia into a dynamic general equilibrium open-economy model. 8 A similar finding was obtained by Devereux and Engel (2002).
5
by macroeconomic factors. If trade is largely homogeneous, the role of macroeconomic variability in invoice currency choice is substantially damped. For producers, the most important driver of invoice currency selection will be the need to have their goods priced the same way as other competing producers price their products. The same view was emphasized by Campa and Goldberg (2005) in their studies of import-price pass-through in 23 OECD countries. According to the authors, macroeconomic variables - levels of inflation, money growth rates or country size - are weakly correlated with changes in pass-through, and are not of first order importance in explaining pass-through evolution within the OECD over the past 25 years. Furthermore, there is substantial evidence that the shift in the composition of imports towards goods whose prices are less sensitive to exchange rate movements has contributed to a fall in pass-through in many countries in the 1990s. Marazzi et al. (2005), however, take a somewhat different view. According to the authors, “the Campa-Goldberg compositional-change hypothesis” may explain some, but certainly not the lion’s share of the decline in pass-through in the United States. This phenomenon can only explain about one-third of the decline in pass-through to U.S. import prices. Marazzi et al. (2005) provide evidence suggesting that China’s surging exports to the United States may also be partly responsible for the low levels of observed pass-through in the U.S. economy.
A host of other hypotheses have also been put forward as factors causing incomplete or declining ERPT to import prices. Mann (1986) documented that the increased usage of exchange-rate hedges may shield a firm from exchange rate shocks, thus allowing the firm to avoid passing such shocks to consumers. Although hedging can allow firms to postpone passing through an exchange rate shock, in the long run, a sufficiently large and permanent exchange rate shock will have to be passed through to importers. Another argument for incomplete pass-through is related to cross-border production arrangements (Bodnar et al. 2002). If production takes place in several stages across many countries, the costs of producing the final good are incurred in several currencies. This can explain incomplete pass-through as long as all of these currencies do not experience a common appreciation against the currency of the export destination. Finally, a recent paper by Gust et al. (2010) suggests that the process of international globalization itself may induce a fall in pass-through. In their model, lower trade costs (interpreted broadly as increased globalization) increase the exporting firm’s relative markup, which in turn allows the firm’s prices to be less sensitive to exchange rates yielding lower pass-through. 3 Theoretical framework
The theoretical framework used here follows Feenstra (1989) and Coughlin and Pollard (2004). The model is set in the context of a price-discriminating monopolist, and it is a partial equilibrium. Let us consider a domestic importing country that imports a differentiated good �� from a monopolist foreign firm that is facing competition from a good substitute � in the importing country. Assuming that the differentiated product �� is weakly separable from other goods in the consumer’s utility function, import demand of good �� can be expressed as follows: ��(��, �� , ��), where �� denotes the import price of �� in the domestic currency, �� is the domestic currency price of � and �� is the income or expenditure on all goods in the importing country. At the same time, the foreign exporter firm produces good � for sale in its local market with the following local (foreign) demand: �(�, �) where � is the foreign currency price of the good and � is the income or expenditures on all goods in other countries.

6
In this economy, the good � is produced only in the foreign country, and inputs are allowed to come from both domestic and foreign countries. Thus, factor prices in the foreign country,�∗, will depend on the exchange rate, � (number of units of importing country’s currency per unit of foreign currency). The foreign firm’s cost function is given by �(�, �∗(�)), where � is the total quantity produced for both domestic and foreign markets (� = �� + �). Costs are assumed to be homogeneous in degree one in factor prices, so they can be written as���, �∗(�)� = �∗(�)�(�). The foreign firm maximizes profits in its own currency, treating � and �� as exogenous.9 Then, the profit maximization problem can be stated as: max��,��Π = �� + ������� − �∗(�)�(�) (1)
The first-order condition with respect to the price in the foreign market, �, yields:
� = � + � ���� − �∗�′ ���� = 0 (2) with respect to the import price in the importing country, ��, is:
�� = ����� + ����� ������ − �∗�′ ������ = 0 (3) Eq. (2) can be rewritten as:
� : ���� "� #1 − 1$%& − �∗�′ = 0 (4) and Eq. (3) as:
�� : ������ "����� #1 − 1$�%& − �∗�′ = 0 (5)
where $) = − *+,-+�- �-
,-. is the elasticity of demand with respect to price for / = 0, 1.
Knowing that markup over marginal cost is defined as 2) = * 3-3-��., the first order condition
regarding � becomes:
� : ���� "�2 − �∗�′& = 0 (6)
9 Foreign and domestic firms are assumed to act as Bertrand competitors.

7
and for ��:
�� : ������ 5�����2� − �∗�′6 = 0 (7) Then, according to Eq. (6) and (7), prices in each market can be expressed as: � = �∗�′. 2 (8) �� = �. �∗�′. 2� (9)
Solving profit maximization yields the standard condition that the price in each market, that is, foreign and domestic, is determined by a market specific markup, 2), over common marginal cost, �∗�′. Our primary focus is on Eq. (9). This equation shows that the import price �� (which is expressed in the importing country’s currency) depends on three factors: the bilateral exchange rate between importer and exporter, the marginal cost, and the markup of price over marginal cost. Note that the exporter’s marginal cost and markup may change independently of the exchange rate. For instance, a change in the cost of a locally provided input (in the foreign country) can shift the marginal cost. Also, adjustments in markups may occur in response to changes in variables specific to the importing country, namely, demand conditions �� and the price of the competing product ��, so that: 2� =2�(��, ��).
4 Econometric model and data In this section, we focus on the empirical model used to estimate the degree of pass-through, which stems from the analytical framework presented before. As stated by the import price Eq. (9), in estimating ERPT, it is necessary to isolate the exchange rate effect from other effects, namely the exporter’s cost shifter, the importer’s demand conditions, and the price of the domestic competitor. Thus, we can present the arguments of the import price Eq. (9) through a log-linear regression specification similar to that tested throughout the ERPT literature, namely �;� = <= + <��; + <>�;∗ + <?@; + $;, (10) where �;� t are domestic currency import prices, �; is the exchange rate, �;∗ denotes variable representing exporter costs, and @; is a vector including demand conditions and competitor prices in the importing country among other control variables, and $; is white noise. As discussed by Campa and Goldberg (2002), biased estimates of the pass-through coefficient could arise if foreign costs or proxies for markup are correlated with exchange rates but omitted from the regression. Variants of Eq. (10) are widely used as empirical specifications in the pass-through literature.10 While the general approach is very similar in pass-through studies, there are a few differences between them regarding the specification and the list of control variables. Our primary concern in this study is the pass-through elasticity which corresponds to the coefficient on the exchange rate <� in Eq. (10).
10 See for instance Goldberg and Knetter (1997) for a survey of this literature.
8
To better understand how the magnitude of ERPT elasticity is determined, the second order conditions for profit maximization (1) can be used to assess the effect of a change in the exchange rate on the import price. Supposing that marginal costs are constant, �∗�′′ = 0, ERPT elasticity can be derived as follows:11
ABCD = ����� ��� = 1 + EF∗G1 − EH� ≥ 0. (11)
where EF∗G = +F∗+G GF∗ ≤ 0 and EH� = +H�
+�� ��H� ≤ 0 are the elasticity of import prices with
regard to the exchange rate and the elasticity of the markup with regard to the price in domestic country currency, respectively. According to (11), pass-through elasticity crucially depends on the behavior of marginal cost and markup. In general, ERPT is positive in the sense that a depreciation in the importing country’s currency (↑ �) increases the import price of a good, while an appreciation of the currency value (↓ �) raises the price of the imported good.12 Eq. (11) suggests that full pass-through (ABCD = 1) is a special case. If marginal cost is not affected by exchange rate fluctuations (EF∗G = 0), i.e. the foreign producer uses only local inputs in the production process, and if markup is constant (EH� = 0), pass-through would be complete. In the case of higher sensibility of marginal costs to exchange rate, that is when EF∗G = −1, ERPT will be equal to zero. Besides, in the case of extreme sensibility of markup to domestic currency import price (EH� → −∞), foreign exporters offset exchange rate changes by adjusting markup, and then ERPT tends to zero.
Therefore, as regards our empirical specification Eq. (10), it is clear that ERPT
coefficient, <�, is expected to be bounded between 0 and 1. Specifically, a one-for-one pass-through to changes in import prices, known as a complete ERPT, is given by <� = 1. In this case, exporters let the domestic currency import prices affected by exchange rate fluctuations. However, when exporters adjust their markup, a partial or incomplete ERPT occurs and <� < 1. It is important to note that markup setting is in turn influenced by other factors, such as macroeconomic conditions in the importing country. For instance, recent empirical studies gave supportive evidence that pricing strategies of foreign firms depend on the inflation environment in the destination market. Countries with stable and low inflation levels would have their currencies chosen for transaction invoicing, leading to lower pass-through into import prices.13
In our investigation, the degree of pass-through into import prices is estimated for 12 EA countries: Austria, Belgium, Finland, France, Germany, Greece, Ireland, Italy, Luxembourg, Netherlands, Portugal, and Spain. We consider the same country sample as in Campa et al. (2005) and Campa and Gonzàlez (2006). However, for the latter studies, the time period estimation covers only up until mid-2004. In our analysis, we provide up-to-date ERPT estimates for the main members of the monetary union. The period of estimation corresponds to the interval that spans from 1990:3 to 2012:4 using quarterly data. This allows us to compare our estimates with existing results for EA countries. For each country, data was 11 The derivations of ERPT elasticity are given in more detail in Appendix A. 12 As explained by Coughlin and Pollard (2004), this can be generalized as long as marginal costs are non-decreasing in output, � ′′ ≥ 0. However, in the case of decreasing marginal costs (� ′′ < 0) and an elasticity of input costs with respect to exchange rate inferior to -1 (EF∗G < −1), ERPT may be negative. 13 Further discussion of this issue is provided in section 5. .
9
collected from the IMF’s International Financial Statistics and the OECD’s Main Economic Indicators and Economic Outlook.
Concerning our dependent variable, namely domestic import prices, we use the price of non-commodity imports of goods and services. This represents the import prices of core goods by excluding primary raw commodities because of their marked volatility. For the exchange rate of all the countries surveyed, we employ the nominal effective trade weighted series, with an increase meaning a depreciation of the national currency, and a decrease meaning an appreciation. Next, the marginal costs of foreign producers are difficult to measure since they are not directly observable, and thus need to be proxied. A conventional practice is to use a weighted average of trade partners’ costs as in Campa and Goldberg (2005) and Bailliu and Fujii (2004). Following this, the foreign costs of each EA country’s major trade partners are derived implicitly from the nominal and real effective exchange rate series as follows: �;∗ ≡ �; − �; + PQ�;, where PQ�; is the domestic unit labor cost (ULC) and �; is the ULC-based real effective exchange rate. Given that the nominal and real effective exchange rate series are trade weighted, this proxy provides a measure of trading partner costs, with each partner weighted by its importance in the importing country’s trade. As regards the foreign firm’s markup, in our benchmark specification, we use the output gap, as the difference between actual and HP-filtered gross domestic product (GDP), to proxy for changes in domestic demand conditions.14 To check the robustness of the benchmark model, in addition to the output gap, we have included the domestic producer prices ��/; as a proxy for the competitor prices in the importing country (similar to Olivei 2002; Bussière 2013, among others). Additionally, to check the reliability of the output gap as a suitable proxy for the domestic conditions, the real GDP (as in Campa et al. 2005) can be used instead. Furthermore, as is well-known, changes in the exchange rate also influence import prices indirectly through their effects on commodity prices. To consider such a channel as a robustness test, we have included oil prices R/Q; (in U.S. dollars) as an additional explanatory variable in the pass-through equation. As explained by Ihrig et al. (2006), when it was not possible to find the import prices of core goods that exclude all primary raw commodities, the inclusion of commodity prices indexes, such as oil prices, as independent variables should mitigate some of the noise generated by these volatile components. All the robustness tests with different specifications of ERPT equation are reported in Appendix D.15
Another concern in the ERPT equation is related to the fact that foreign costs and the exchange rate would have the same coefficient, namely<� = <>, as predicted by the theoretical framework in Hooper and Mann (1989). In practice, this restriction does not necessarily hold, since exchange rates are more variable than costs; thus, the extent to which they are passed onto prices may differ (see Athukorola and Menon 1995, for a discussion). To test for the restriction on whether parameters in the exchange rate and foreign costs are equal or not, Wald tests are subsequently conducted.
Finally, we check for the stationarity of our key variables. Augmented Dickey Fuller (ADF) and Zivot and Andrews (1992) stationary tests reported in Table A2 in Appendix C indicate that most of the variables are integrated in order one I(1), except the output gap which is by construction a stationary variable.16 Given that data are non-stationary, we
14 HP-filter of the GDP series (as an estimate of potential) was constructed using a smoothing parameter of 14.400. 15 The additional control variables, i.e. producer prices and oil prices, are not considered in our benchmark model in order to avoid multicollinearity issues. For instance, we found that the correlation between the output gap measure and the producer prices is quite high. 16 The Zivot and Andrews (1992) test allows for one single break under the alternative hypothesis.
10
investigate the possibility of cointegration between variables at different levels.17 To achieve this, in addition to the Engle and Granger (1987) test (EG hereafter), we also employ the Gregory and Hansen (1996) test (GH hereafter) that allows for structural breaks in the cointegrating vector. As reported in Table A3 in Appendix C, there is weak evidence of possible long-run equilibrium relationships among the variables; indeed, the residuals of the ERPT equation at all levels are non-stationary for most of the countries in our sample.18 This confirms the existing findings of the literature (see Campa and Goldberg 2005; Campa et al. 2005; Campa and Gonzàlez 2006, inter alia) but with a longer sample of data. Consequently, in what follows, first differences of variables are considered. Besides, since data are not seasonally adjusted, quarterly dummy variables are included to capture possible seasonal effects. Eventually, the import-price inflation equation has the following form: Δ�;� = <= + <�Δ�; + <>Δ�;∗ + <?TU�; + quarterly dummies + $;, (12) and is estimated using Generalized Least Squares (GLS) to take into account possible autocorrelation or heteroscedasticity in the residuals.19
5 Assessing ERPT into import prices
5.1 Results from the benchmark model
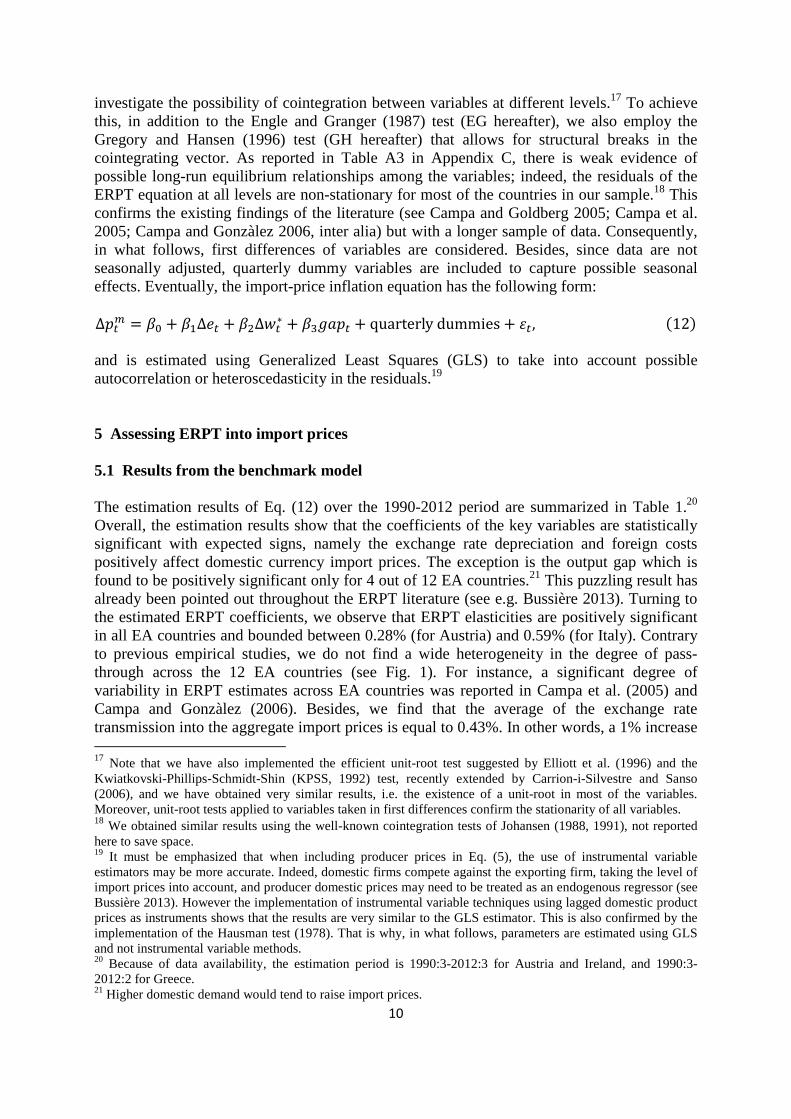
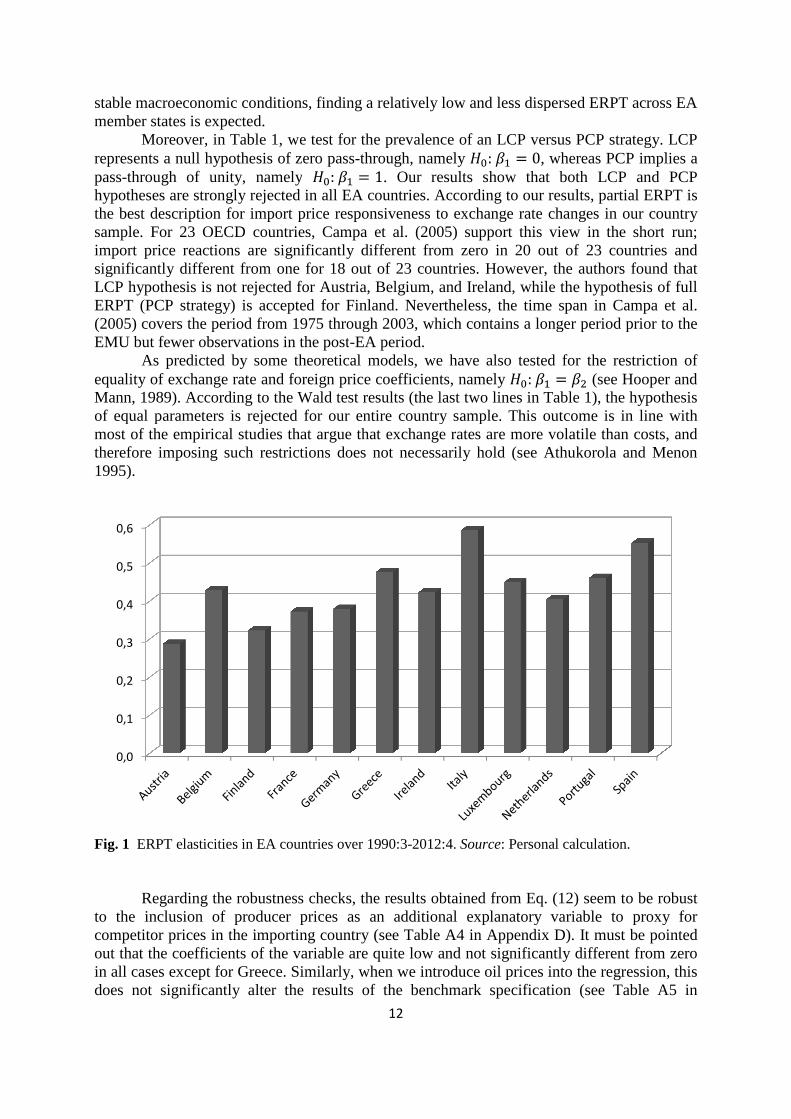
The estimation results of Eq. (12) over the 1990-2012 period are summarized in Table 1.20 Overall, the estimation results show that the coefficients of the key variables are statistically significant with expected signs, namely the exchange rate depreciation and foreign costs positively affect domestic currency import prices. The exception is the output gap which is found to be positively significant only for 4 out of 12 EA countries.21 This puzzling result has already been pointed out throughout the ERPT literature (see e.g. Bussière 2013). Turning to the estimated ERPT coefficients, we observe that ERPT elasticities are positively significant in all EA countries and bounded between 0.28% (for Austria) and 0.59% (for Italy). Contrary to previous empirical studies, we do not find a wide heterogeneity in the degree of pass-through across the 12 EA countries (see Fig. 1). For instance, a significant degree of variability in ERPT estimates across EA countries was reported in Campa et al. (2005) and Campa and Gonzàlez (2006). Besides, we find that the average of the exchange rate transmission into the aggregate import prices is equal to 0.43%. In other words, a 1% increase 17 Note that we have also implemented the efficient unit-root test suggested by Elliott et al. (1996) and the Kwiatkovski-Phillips-Schmidt-Shin (KPSS, 1992) test, recently extended by Carrion-i-Silvestre and Sanso (2006), and we have obtained very similar results, i.e. the existence of a unit-root in most of the variables. Moreover, unit-root tests applied to variables taken in first differences confirm the stationarity of all variables. 18 We obtained similar results using the well-known cointegration tests of Johansen (1988, 1991), not reported here to save space. 19 It must be emphasized that when including producer prices in Eq. (5), the use of instrumental variable estimators may be more accurate. Indeed, domestic firms compete against the exporting firm, taking the level of import prices into account, and producer domestic prices may need to be treated as an endogenous regressor (see Bussière 2013). However the implementation of instrumental variable techniques using lagged domestic product prices as instruments shows that the results are very similar to the GLS estimator. This is also confirmed by the implementation of the Hausman test (1978). That is why, in what follows, parameters are estimated using GLS and not instrumental variable methods. 20 Because of data availability, the estimation period is 1990:3-2012:3 for Austria and Ireland, and 1990:3-2012:2 for Greece. 21 Higher domestic demand would tend to raise import prices.
11
in the rate of depreciation of domestic currency raises import prices by 0.43% on average in our EA sample. Table 1 GLS estimation results from pass-through equation over 1990:3-2012:4 and Wald tests
Austria Belgium Finland France Germany Greece
Constant 0,028 -0,001 -0,006 -0,004 -0,004 0,009 (0,000) (0,808) (0,126) (0,018) (0,026) (0,001) bcd 0,287 0,428 0,323 0,372 0,379 0,476 (0,000) (0,000 (0,000) (0,000) (0,000) (0,000) [0,000] [0,000] [0,000] [0,000] [0,000] [0,000] Δ�;∗ 0,428 0,607 0,515 0,624 0,583 0,721 (0,000) (0,000) (0,000) (0,000) (0,000) (0,000) TU�; -0,014 0,311 0,039 0,061 0,024 0,090
(0,888) (0,003) (0,622) (0,480) (0,468) (0,266)
Observations 81 82 82 82 82 78
R2 0,891 0,572 0,320 0,653 0,703 0,607
Wald Test 10,363 19,308 10,338 72,496 35,429 42,168
p-value (0,002) (0,000) (0,002) (0,000) (0,000) (0,000)
Ireland Italy Luxembourg Netherlands Portugal Spain
Constant 0,006 0,005 0,011 -0,001 0,002 0,000 (0,114) (0,026) (0,010) (0,737) (0,467) (0,885) bcd 0,423 0,586 0,448 0,404 0,460 0,553 (0,000) (0,000) (0,000) (0,000) (0,000) (0,000) [0,000] [0,000] [0,000] [0,000] [0,000] [0,000] Δ�;∗ 0,329 0,771 0,656 0,637 0,693 0,664 (0,002) (0,000) (0,000) (0,000) (0,000) (0,000) TU�; 0,145 0,170 -0,088 0,119 0,019 0,100
(0,054) (0,048) (0,319) (0,032) (0,776) (0,359)
Observations 81 82 82 82 82 82
R2 0,422 0,795 0,292 0,734 0,649 0,590
Wald Test 2,783 29,763 9,756 94,667 50,018 5,647
p-value (0,099) (0,000) (0,003) (0,000) (0,000) (0,020) Note. Estimations are based on Eq. (12). Numbers in parentheses are p-values. For the exchange rate coefficient, p-values in parentheses are based on the null hypothesis of zero ERPT, i.e. e=: <� = 0, while p-values in square brackets corresponds to the null of full ERPT, i.e. e=: <� = 1. The Wald test is performed for e=: <� − <> = 0.
Our estimates of ERPT are slightly lower in comparison with Campa et al. (2005) and Campa and Gonzàlez (2006). In the latter papers, the short-run pass-through elasticities are close to 0.66% on average for 11 EA countries.22 This outcome is not surprising since the mentioned studies used fewer observations than we do for the Economic and Monetary Union (EMU) era (Campa et al. (2005) until mid-2004 and Campa and Gonzàlez (2006) until the end of 2001). Since the process of monetary union has entailed some convergence towards more
22 In Campa et al. (2005) and Campa and Gonzàlez (2006), Belgium and Luxembourg are treated as a single country.
stable macroeconomic conditions, findmember states is expected.
Moreover, in Table 1, we test for the prevalence ofrepresents a null hypothesis of zero passpass-through of unity, namelyhypotheses are strongly rejected in all EA countries. According to our results, partial ERPT is the best description for import price responsiveness to exchange rate changes in our country sample. For 23 OECD countries, import price reactions are significantly different from zero in 20 out of 23 countries and significantly different from one for 18 out of 23 countries. However, the authLCP hypothesis is not rejected for Austria, BelgiumERPT (PCP strategy) is accepted for Finland. Nevertheless, the time span in (2005) covers the period from 1975 through 2003, which cEMU but fewer observations in the post
As predicted by some theoretical modelsequality of exchange rate and foreign price coefficients, Mann, 1989). According to the of equal parameters is rejected for our entire country sample. This outcome is in line with most of the empirical studies therefore imposing such restriction1995).
Fig. 1 ERPT elasticities in EA countries over 1990:3
Regarding the robustness checkto the inclusion of producer prices as an additional explanatory variable to proxy for competitor prices in the importing country (see out that the coefficients of the variable are quite low and not significantly different from zero in all cases except for Greece. Similarly, when we introduce oil prices indoes not significantly alter the results of the benchmark specificati
0,0
0,1
0,2
0,3
0,4
0,5
0,6
12
stable macroeconomic conditions, finding a relatively low and less dispersed ERPT across EA
in Table 1, we test for the prevalence of an LCP versus PCP strategy. LCP represents a null hypothesis of zero pass-through, namely e=: <� � 0, whereas PCP implies a
namely e=: <� � 1. Our results show that both LCP and PCP hypotheses are strongly rejected in all EA countries. According to our results, partial ERPT is the best description for import price responsiveness to exchange rate changes in our country sample. For 23 OECD countries, Campa et al. (2005) support this view in the short
are significantly different from zero in 20 out of 23 countries and significantly different from one for 18 out of 23 countries. However, the authLCP hypothesis is not rejected for Austria, Belgium, and Ireland, while the hypothesis of full ERPT (PCP strategy) is accepted for Finland. Nevertheless, the time span in (2005) covers the period from 1975 through 2003, which contains a longer period prior toEMU but fewer observations in the post-EA period.
As predicted by some theoretical models, we have also tested for the restriction of equality of exchange rate and foreign price coefficients, namely e=: <� � <
the Wald test results (the last two lines in Table 1), the hypothesis of equal parameters is rejected for our entire country sample. This outcome is in line with
empirical studies that argue that exchange rates are more volatile than costs, and therefore imposing such restrictions does not necessarily hold (see Athukorola
ERPT elasticities in EA countries over 1990:3-2012:4. Source: Personal calculation.
stness checks, the results obtained from Eq. (12) seem to be robust to the inclusion of producer prices as an additional explanatory variable to proxy for competitor prices in the importing country (see Table A4 in Appendix D).
the coefficients of the variable are quite low and not significantly different from zero in all cases except for Greece. Similarly, when we introduce oil prices into
alter the results of the benchmark specification (see
s dispersed ERPT across EA
LCP versus PCP strategy. LCP , whereas PCP implies a
. Our results show that both LCP and PCP hypotheses are strongly rejected in all EA countries. According to our results, partial ERPT is the best description for import price responsiveness to exchange rate changes in our country
(2005) support this view in the short run; are significantly different from zero in 20 out of 23 countries and
significantly different from one for 18 out of 23 countries. However, the authors found that and Ireland, while the hypothesis of full
ERPT (PCP strategy) is accepted for Finland. Nevertheless, the time span in Campa et al. ontains a longer period prior to the
we have also tested for the restriction of <> (see Hooper and
lines in Table 1), the hypothesis of equal parameters is rejected for our entire country sample. This outcome is in line with
ange rates are more volatile than costs, and Athukorola and Menon
: Personal calculation.
(12) seem to be robust to the inclusion of producer prices as an additional explanatory variable to proxy for
). It must be pointed the coefficients of the variable are quite low and not significantly different from zero
to the regression, this on (see Table A5 in
13
Appendix D). However, we underline that ERPT coefficients are slightly lower when oil prices are introduced into Eq. (12). This is not surprising, since when commodity prices such as oil prices are excluded from the regression, the pass-through coefficients capture both the direct effect of the exchange rate on import prices and the indirect effect operating through changes in commodity prices. Thus, taking this into account, the latter channel would slightly lower ERPT elasticity (see Marazzi et al. 2005; Ihrig et al. 2006; Marazzi and Sheets 2007, for a discussion). Finally, we replaced the output gap by the rate of growth of real GDP in (12) as in Campa and Goldberg (2005). The results are still the same, namely the coefficients on output growth are insignificant in most cases, and even when it is the case, it does not affect the other coefficients. We can thus consider that our benchmark specification (12) successfully passed all standard robustness tests.
To give further insights on the role of inflation regime, we can explore the expected
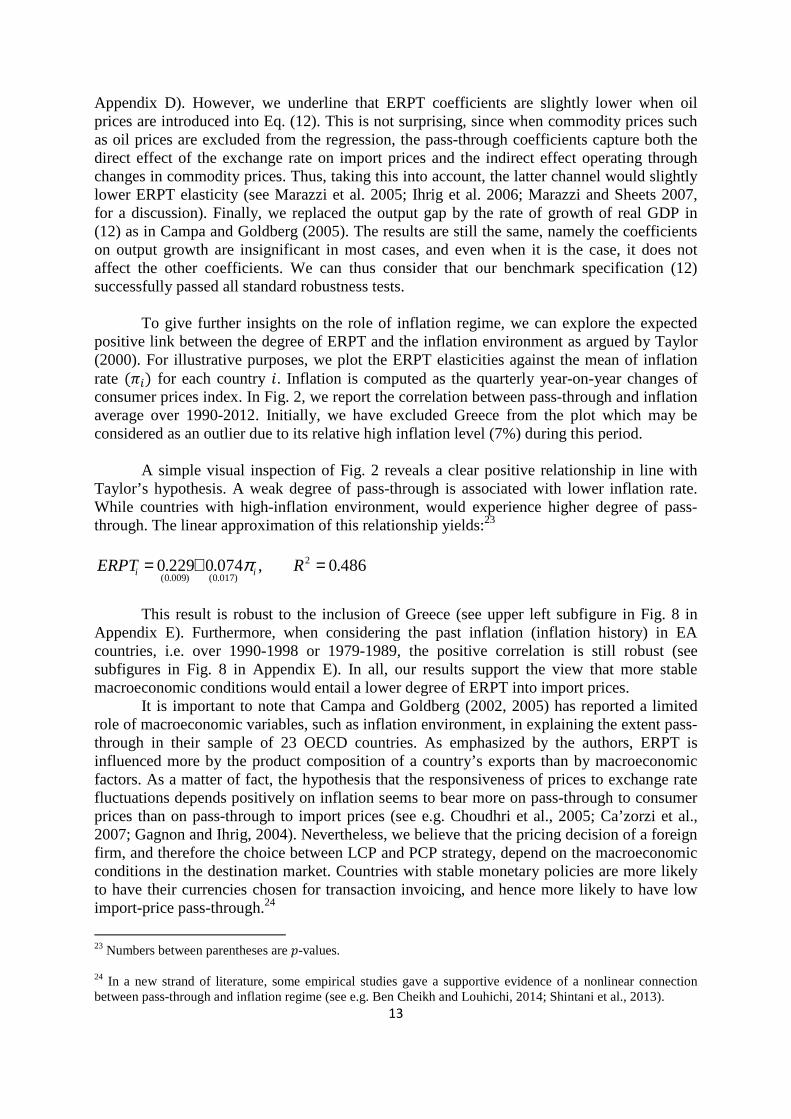
positive link between the degree of ERPT and the inflation environment as argued by Taylor (2000). For illustrative purposes, we plot the ERPT elasticities against the mean of inflation rate (f)) for each country /. Inflation is computed as the quarterly year-on-year changes of consumer prices index. In Fig. 2, we report the correlation between pass-through and inflation average over 1990-2012. Initially, we have excluded Greece from the plot which may be considered as an outlier due to its relative high inflation level (7%) during this period.
A simple visual inspection of Fig. 2 reveals a clear positive relationship in line with
Taylor’s hypothesis. A weak degree of pass-through is associated with lower inflation rate. While countries with high-inflation environment, would experience higher degree of pass-through. The linear approximation of this relationship yields:23
486.0,074.0229.0 2
)017.0()009.0(=+= RERPT ii π
This result is robust to the inclusion of Greece (see upper left subfigure in Fig. 8 in
Appendix E). Furthermore, when considering the past inflation (inflation history) in EA countries, i.e. over 1990-1998 or 1979-1989, the positive correlation is still robust (see subfigures in Fig. 8 in Appendix E). In all, our results support the view that more stable macroeconomic conditions would entail a lower degree of ERPT into import prices.
It is important to note that Campa and Goldberg (2002, 2005) has reported a limited role of macroeconomic variables, such as inflation environment, in explaining the extent pass-through in their sample of 23 OECD countries. As emphasized by the authors, ERPT is influenced more by the product composition of a country’s exports than by macroeconomic factors. As a matter of fact, the hypothesis that the responsiveness of prices to exchange rate fluctuations depends positively on inflation seems to bear more on pass-through to consumer prices than on pass-through to import prices (see e.g. Choudhri et al., 2005; Ca’zorzi et al., 2007; Gagnon and Ihrig, 2004). Nevertheless, we believe that the pricing decision of a foreign firm, and therefore the choice between LCP and PCP strategy, depend on the macroeconomic conditions in the destination market. Countries with stable monetary policies are more likely to have their currencies chosen for transaction invoicing, and hence more likely to have low import-price pass-through.24
23 Numbers between parentheses are �-values.
24 In a new strand of literature, some empirical studies gave a supportive evidence of a nonlinear connection between pass-through and inflation regime (see e.g. Ben Cheikh and Louhichi, 2014; Shintani et al., 2013).
14
Fig. 2 Correlation ERPT and inflation over 1990-2012 (Greece excluded). Notes: y-axis: ERPT to import prices estimated from Eq. (12) over 1990-2012; x-axis: average of inflation over the same estimation period.
Finally, we can explore another potential determinant of ERPT which is the degree of openness of a country. Intuitively, it is expected that the rate of pass-through is positively correlated with the openness of an economy. The larger presence of imports and exports in an economy, the larger the pass-through coefficient. The extent of trade openness can be measured as the ratio of exports and imports to domestic income or computed as the import penetration ratio, i.e. the participation of foreign firms in the domestic economy, measured by the share of imports in domestic consumption. However, few are studies who provide a strong evidence in this sense. For instance, in his VAR study, McCarthy (2007) find a little evidence that openness is positively correlated with ERPT to consumer prices, while no evidence of a statistically significant positive relationship with ERPT to import prices.25
In our EA sample, we aim to ascertain whether more open countries would experience
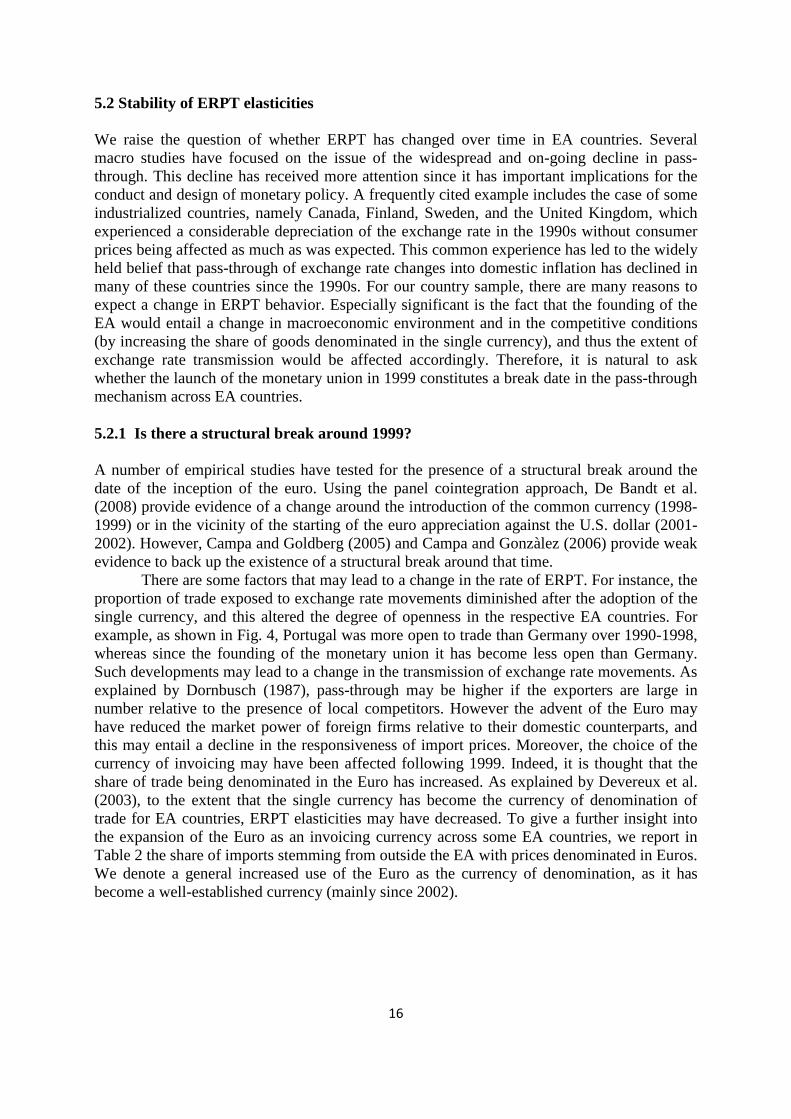
a higher ERPT into import prices. The degree of trade openness is computed as the share of imports of goods and services in GDP.26 Besides, it is known that since the creation of the single currency, the share of trade affected by exchange rate fluctuations has been changed. Therefore, for more relevancy, on one hand, we plot the correlation of ERPT with (total) imports share over 1990-1998; on the other hand, the correlation is set out with respect to the extra-EA imports share over 1999-2012 (see Fig. 3). In Fig 4, we report both total imports and imports coming from outside the EA as a share of GDP. It is important to note that there is a wide dispersion in terms of degree of openness in our sample. For the total imports share over 1990-1998, Belgium has the highest openness while Greece has the lowest. When considering the extra-EA imports over 1999-2012, the larger share is found in Netherlands, while the
25 Choudhri et al. (2005), Ca’zorzi et al. (2007), Gagnon and Ihrig (2004) found no statistical link between pass-through to consumer prices and openness. 26 The data on the ratio of imports of goods and services to GDP are obtained from Eurostat and OECD’s Economic Outlook.
15
lowest is recorded in Portugal. We see that the inception of the euro has constituted a changing in the part of trade exposed to exchange rate fluctuations which may have a consequence on the ERPT behavior after the creation of the euro zone in 1999.
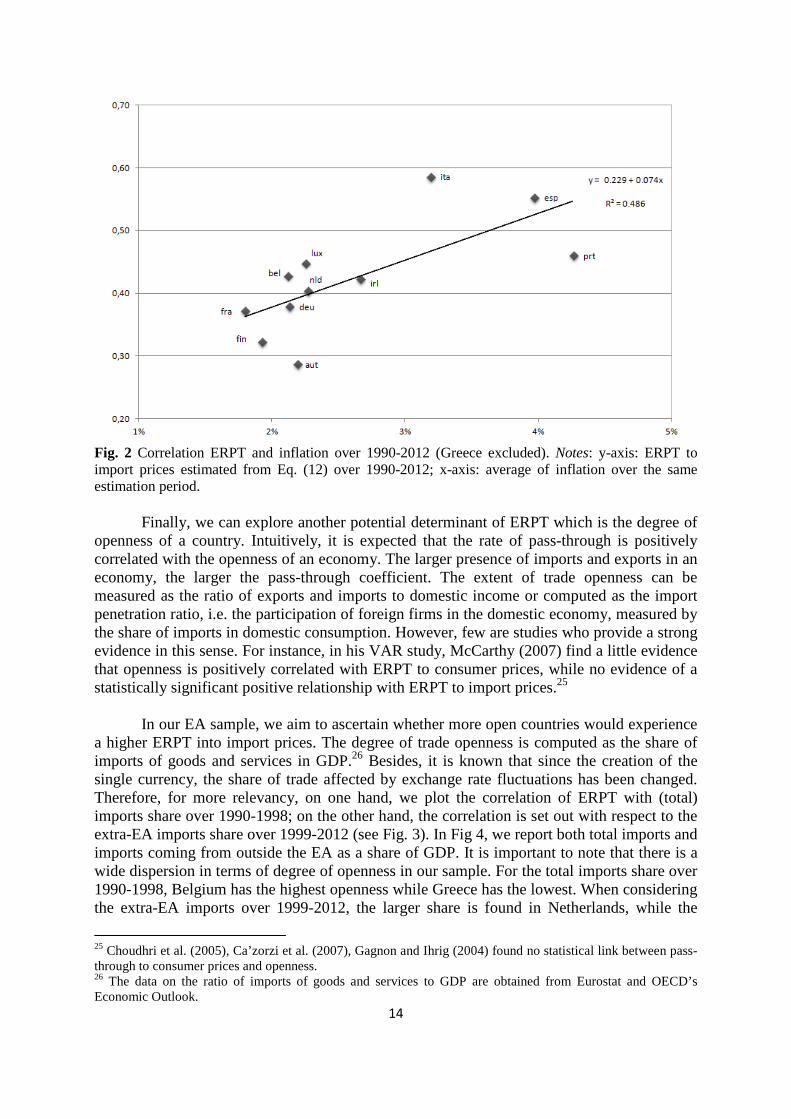
A cursory look to Fig. 3 shows that the statistical correlation between ERPT and openness is close to zero with a slight negative sign. A higher import share, as a proxy for the degree of openness (g)), does not seem to be associated with a higher extent of ERPT. The linear approximation of this relationship yields:
008.0,0003.0441.0 2
)780.0()000.0(=−= RERPT ii θ
when considering the total imports share over 1990-1998.
051.0,0019.0464.0 2
)479.0()000.0(=−= RERPT ii θ
when considering extra-EA imports share over 1999-2012.
As mentioned above, the presence of a positive link between import openness and pass-through finds only weak empirical support. One potential explanation is that greater imports penetration may imply higher degree of competition for market share, thus implying lower ERPT. In fact, as mentioned by Gust et al. (2010), the process of international globalization leading to high share of traded goods and high import content would induce a fall in pass-through. Following this reasoning, the authors explain that the higher trade integration has reduced the market power of U.S. producers at home and squeezed their U.S. profit margins.
EA total imports (1990-1998)
Extra-EA imports (1999-2012)
Fig. 3 Correlation between ERPT and degree of openness. Notes: y-axis: ERPT to import prices estimated from Eq. (12) over 1990-2012; x-axis: ratio of imports to GDP.
Along with this vein, Marazzi et al. (2005) explain that the increasing presence of China’s exports in the U.S. market may also be partly responsible for the low levels of observed pass-through in the American economy in recent years. Especially, competition from Chinese firms may have constrained exporters from other countries from raising their prices in response to the dollar’s depreciation, leading to lower degree ERPT than expected. Given these arguments, it is not surprising to find no evidence of strong association between pass-through into import prices and degree of trade openness.
16
5.2 Stability of ERPT elasticities
We raise the question of whether ERPT has changed over time in EA countries. Several macro studies have focused on the issue of the widespread and on-going decline in pass-through. This decline has received more attention since it has important implications for the conduct and design of monetary policy. A frequently cited example includes the case of some industrialized countries, namely Canada, Finland, Sweden, and the United Kingdom, which experienced a considerable depreciation of the exchange rate in the 1990s without consumer prices being affected as much as was expected. This common experience has led to the widely held belief that pass-through of exchange rate changes into domestic inflation has declined in many of these countries since the 1990s. For our country sample, there are many reasons to expect a change in ERPT behavior. Especially significant is the fact that the founding of the EA would entail a change in macroeconomic environment and in the competitive conditions (by increasing the share of goods denominated in the single currency), and thus the extent of exchange rate transmission would be affected accordingly. Therefore, it is natural to ask whether the launch of the monetary union in 1999 constitutes a break date in the pass-through mechanism across EA countries. 5.2.1 Is there a structural break around 1999?
A number of empirical studies have tested for the presence of a structural break around the date of the inception of the euro. Using the panel cointegration approach, De Bandt et al. (2008) provide evidence of a change around the introduction of the common currency (1998-1999) or in the vicinity of the starting of the euro appreciation against the U.S. dollar (2001-2002). However, Campa and Goldberg (2005) and Campa and Gonzàlez (2006) provide weak evidence to back up the existence of a structural break around that time.
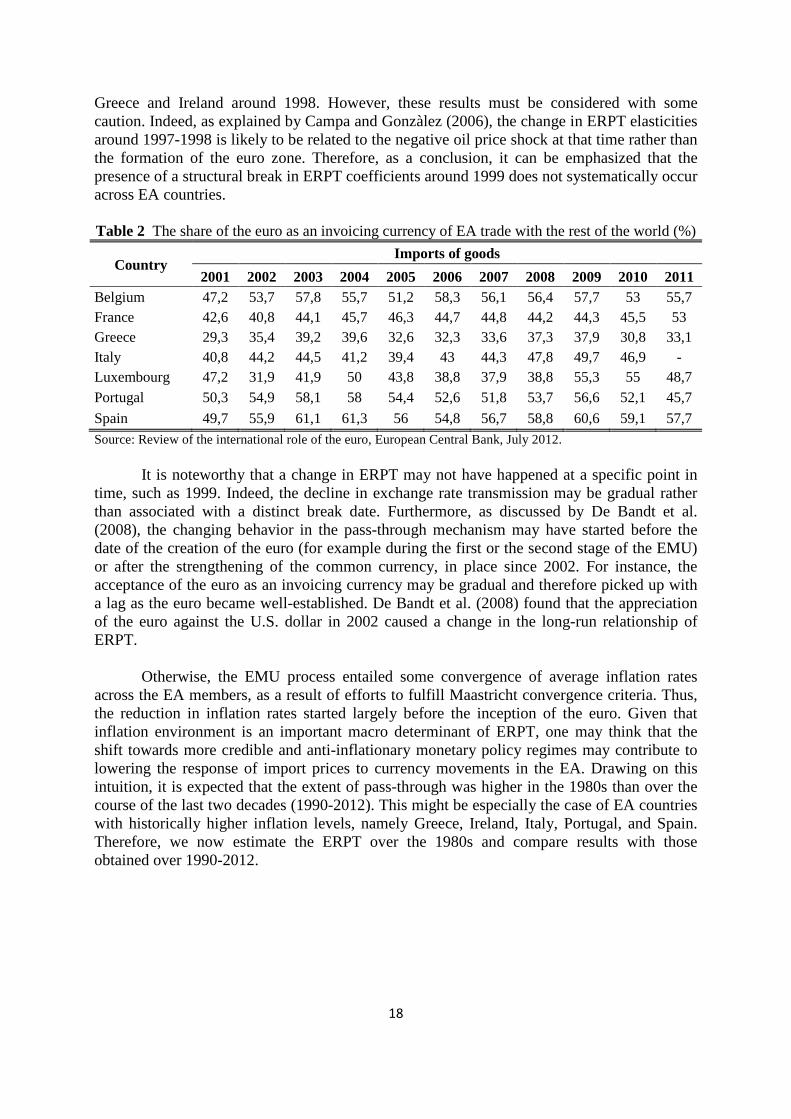
There are some factors that may lead to a change in the rate of ERPT. For instance, the proportion of trade exposed to exchange rate movements diminished after the adoption of the single currency, and this altered the degree of openness in the respective EA countries. For example, as shown in Fig. 4, Portugal was more open to trade than Germany over 1990-1998, whereas since the founding of the monetary union it has become less open than Germany. Such developments may lead to a change in the transmission of exchange rate movements. As explained by Dornbusch (1987), pass-through may be higher if the exporters are large in number relative to the presence of local competitors. However the advent of the Euro may have reduced the market power of foreign firms relative to their domestic counterparts, and this may entail a decline in the responsiveness of import prices. Moreover, the choice of the currency of invoicing may have been affected following 1999. Indeed, it is thought that the share of trade being denominated in the Euro has increased. As explained by Devereux et al. (2003), to the extent that the single currency has become the currency of denomination of trade for EA countries, ERPT elasticities may have decreased. To give a further insight into the expansion of the Euro as an invoicing currency across some EA countries, we report in Table 2 the share of imports stemming from outside the EA with prices denominated in Euros. We denote a general increased use of the Euro as the currency of denomination, as it has become a well-established currency (mainly since 2002).
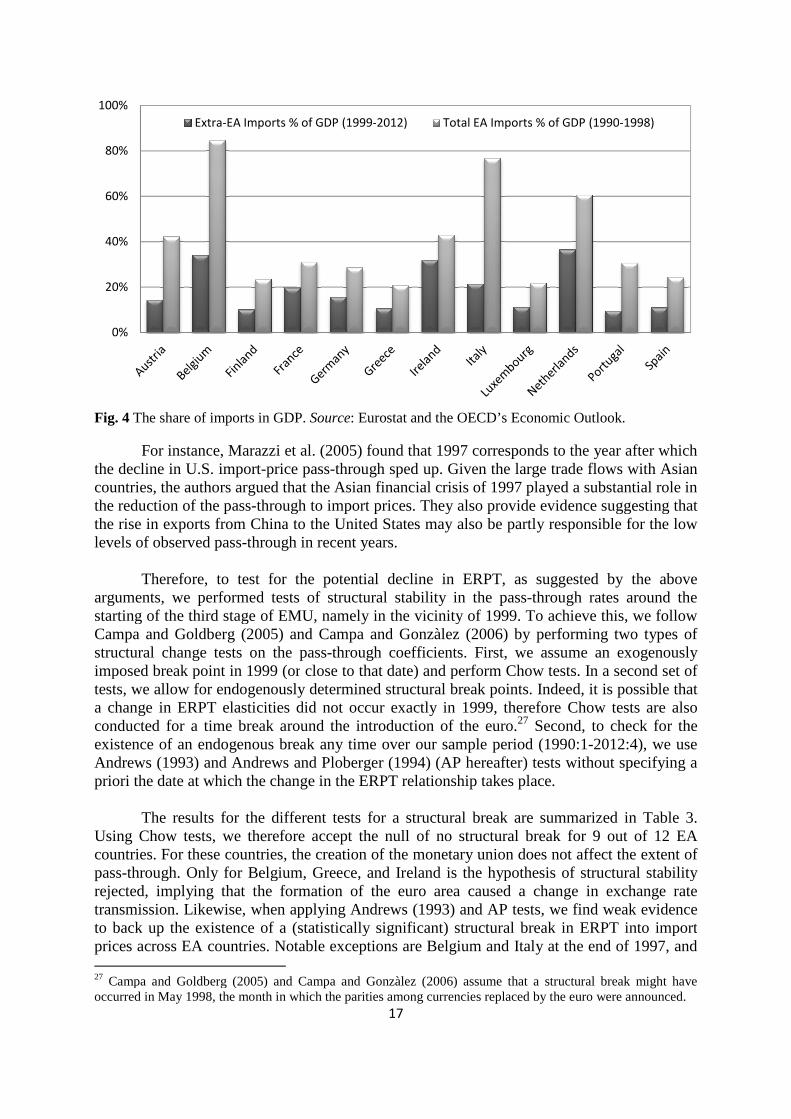
Fig. 4 The share of imports in GDP
For instance, Marazzi et al. the decline in U.S. import-price passcountries, the authors argued that the Asian financial crisisthe reduction of the pass-through to importthe rise in exports from Chinalevels of observed pass-through in recent years.
Therefore, to test for the potential decline in ERPT, as suggested by the above
arguments, we performed tests of structural stability in starting of the third stage of EMU, Campa and Goldberg (2005) and structural change tests on the passimposed break point in 1999 (ortests, we allow for endogenously determined structural break points. Indeed, it is possible that a change in ERPT elasticities dconducted for a time break around the introduction of the existence of an endogenous break any time over our sample periodAndrews (1993) and Andrews priori the date at which the change
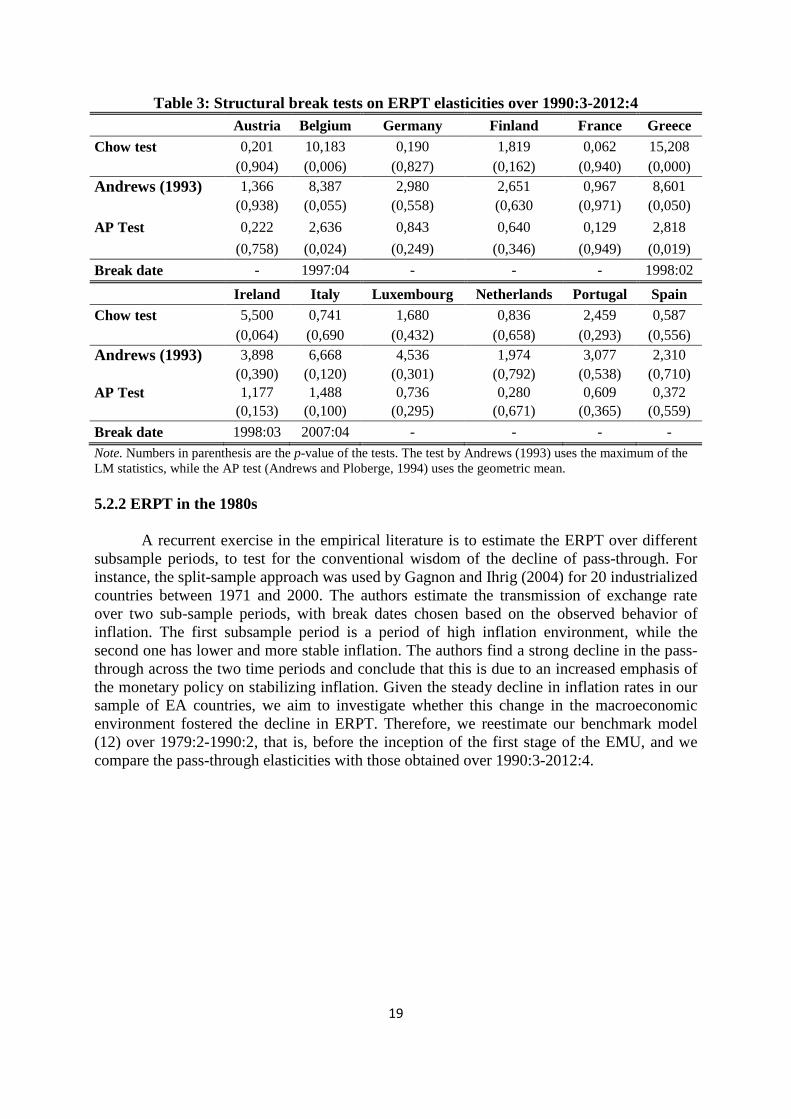
The results for the different tests Using Chow tests, we therefore countries. For these countries, the creation of the monetary unionpass-through. Only for Belgium, Greecerejected, implying that the formation oftransmission. Likewise, when applying to back up the existence of a (statistically significant) structural break in ERPT into importprices across EA countries. Notable 27 Campa and Goldberg (2005) and occurred in May 1998, the month in which the parities among currencies replaced by the
0%
20%
40%
60%
80%
100%
Extra-EA Imports % of GDP (1999
17
The share of imports in GDP. Source: Eurostat and the OECD’s Economic Outlook.
et al. (2005) found that 1997 corresponds to the yearprice pass-through sped up. Given the large trade flows with Asian
countries, the authors argued that the Asian financial crisis of 1997 played a substantial role in through to import prices. They also provide evidence suggesting that hina to the United States may also be partly responsible for the low
through in recent years.
Therefore, to test for the potential decline in ERPT, as suggested by the abovetests of structural stability in the pass-through rates around the
starting of the third stage of EMU, namely in the vicinity of 1999. To achieve(2005) and Campa and Gonzàlez (2006) by performing two types of
structural change tests on the pass-through coefficients. First, we assume an exogenously imposed break point in 1999 (or close to that date) and perform Chow tests. In a second set of
for endogenously determined structural break points. Indeed, it is possible that lasticities did not occur exactly in 1999, therefore Chow tests
time break around the introduction of the euro.27 Second, toexistence of an endogenous break any time over our sample period (1990:1
Andrews and Ploberger (1994) (AP hereafter) tests without specifying a priori the date at which the change in the ERPT relationship takes place.
The results for the different tests for a structural break are summarized in Tabletherefore accept the null of no structural break for 9
countries. For these countries, the creation of the monetary union does not affect the extent of through. Only for Belgium, Greece, and Ireland is the hypothesis of structural stability
rejected, implying that the formation of the euro area caused a change in exchange rate when applying Andrews (1993) and AP tests, we find weak evidence
the existence of a (statistically significant) structural break in ERPT into importprices across EA countries. Notable exceptions are Belgium and Italy at the end of
Campa and Goldberg (2005) and Campa and Gonzàlez (2006) assume that a structuraln which the parities among currencies replaced by the euro
EA Imports % of GDP (1999-2012) Total EA Imports % of GDP (1990
: Eurostat and the OECD’s Economic Outlook.
(2005) found that 1997 corresponds to the year after which trade flows with Asian
of 1997 played a substantial role in prices. They also provide evidence suggesting that
may also be partly responsible for the low
Therefore, to test for the potential decline in ERPT, as suggested by the above through rates around the
in the vicinity of 1999. To achieve this, we follow (2006) by performing two types of
coefficients. First, we assume an exogenously close to that date) and perform Chow tests. In a second set of
for endogenously determined structural break points. Indeed, it is possible that exactly in 1999, therefore Chow tests are also
Second, to check for the (1990:1-2012:4), we use
(1994) (AP hereafter) tests without specifying a
structural break are summarized in Table 3. the null of no structural break for 9 out of 12 EA
does not affect the extent of the hypothesis of structural stability
ea caused a change in exchange rate (1993) and AP tests, we find weak evidence
the existence of a (statistically significant) structural break in ERPT into import the end of 1997, and
structural break might have euro were announced.
Total EA Imports % of GDP (1990-1998)
18
Greece and Ireland around 1998. However, these results must be considered with some caution. Indeed, as explained by Campa and Gonzàlez (2006), the change in ERPT elasticities around 1997-1998 is likely to be related to the negative oil price shock at that time rather than the formation of the euro zone. Therefore, as a conclusion, it can be emphasized that the presence of a structural break in ERPT coefficients around 1999 does not systematically occur across EA countries. Table 2 The share of the euro as an invoicing currency of EA trade with the rest of the world (%)
Country Imports of goods
2001 2002 2003 2004 2005 2006 2007 2008 2009 2010 2011 Belgium 47,2 53,7 57,8 55,7 51,2 58,3 56,1 56,4 57,7 53 55,7 France 42,6 40,8 44,1 45,7 46,3 44,7 44,8 44,2 44,3 45,5 53 Greece 29,3 35,4 39,2 39,6 32,6 32,3 33,6 37,3 37,9 30,8 33,1 Italy 40,8 44,2 44,5 41,2 39,4 43 44,3 47,8 49,7 46,9 - Luxembourg 47,2 31,9 41,9 50 43,8 38,8 37,9 38,8 55,3 55 48,7 Portugal 50,3 54,9 58,1 58 54,4 52,6 51,8 53,7 56,6 52,1 45,7
Spain 49,7 55,9 61,1 61,3 56 54,8 56,7 58,8 60,6 59,1 57,7
Source: Review of the international role of the euro, European Central Bank, July 2012.
It is noteworthy that a change in ERPT may not have happened at a specific point in time, such as 1999. Indeed, the decline in exchange rate transmission may be gradual rather than associated with a distinct break date. Furthermore, as discussed by De Bandt et al. (2008), the changing behavior in the pass-through mechanism may have started before the date of the creation of the euro (for example during the first or the second stage of the EMU) or after the strengthening of the common currency, in place since 2002. For instance, the acceptance of the euro as an invoicing currency may be gradual and therefore picked up with a lag as the euro became well-established. De Bandt et al. (2008) found that the appreciation of the euro against the U.S. dollar in 2002 caused a change in the long-run relationship of ERPT.
Otherwise, the EMU process entailed some convergence of average inflation rates
across the EA members, as a result of efforts to fulfill Maastricht convergence criteria. Thus, the reduction in inflation rates started largely before the inception of the euro. Given that inflation environment is an important macro determinant of ERPT, one may think that the shift towards more credible and anti-inflationary monetary policy regimes may contribute to lowering the response of import prices to currency movements in the EA. Drawing on this intuition, it is expected that the extent of pass-through was higher in the 1980s than over the course of the last two decades (1990-2012). This might be especially the case of EA countries with historically higher inflation levels, namely Greece, Ireland, Italy, Portugal, and Spain. Therefore, we now estimate the ERPT over the 1980s and compare results with those obtained over 1990-2012.
19
Table 3: Structural break tests on ERPT elasticities over 1990:3-2012:4
Austria Belgium Germany Finland France Greece
Chow test 0,201 10,183 0,190 1,819 0,062 15,208
(0,904) (0,006) (0,827) (0,162) (0,940) (0,000)
Andrews (1993) 1,366 8,387 2,980 2,651 0,967 8,601
(0,938) (0,055) (0,558) (0,630 (0,971) (0,050)
AP Test 0,222 2,636 0,843 0,640 0,129 2,818
(0,758) (0,024) (0,249) (0,346) (0,949) (0,019)
Break date - 1997:04 - - - 1998:02
Ireland Italy Luxembourg Netherlands Portugal Spain Chow test 5,500 0,741 1,680 0,836 2,459 0,587
(0,064) (0,690 (0,432) (0,658) (0,293) (0,556)
Andrews (1993) 3,898 6,668 4,536 1,974 3,077 2,310
(0,390) (0,120) (0,301) (0,792) (0,538) (0,710)
AP Test 1,177 1,488 0,736 0,280 0,609 0,372
(0,153) (0,100) (0,295) (0,671) (0,365) (0,559)
Break date 1998:03 2007:04 - - - -
Note. Numbers in parenthesis are the p-value of the tests. The test by Andrews (1993) uses the maximum of the LM statistics, while the AP test (Andrews and Ploberge, 1994) uses the geometric mean. 5.2.2 ERPT in the 1980s
A recurrent exercise in the empirical literature is to estimate the ERPT over different subsample periods, to test for the conventional wisdom of the decline of pass-through. For instance, the split-sample approach was used by Gagnon and Ihrig (2004) for 20 industrialized countries between 1971 and 2000. The authors estimate the transmission of exchange rate over two sub-sample periods, with break dates chosen based on the observed behavior of inflation. The first subsample period is a period of high inflation environment, while the second one has lower and more stable inflation. The authors find a strong decline in the pass-through across the two time periods and conclude that this is due to an increased emphasis of the monetary policy on stabilizing inflation. Given the steady decline in inflation rates in our sample of EA countries, we aim to investigate whether this change in the macroeconomic environment fostered the decline in ERPT. Therefore, we reestimate our benchmark model (12) over 1979:2-1990:2, that is, before the inception of the first stage of the EMU, and we compare the pass-through elasticities with those obtained over 1990:3-2012:4.

20
Table 4 GLS estimation results over 1979:2-1990:2
Austria Belgium Finland France Germany Greece
Constant 0,007 0,009 0,008 0,006 0,002 0,021 (0,118) (0,010) (0,108) (0,145) (0,622) (0,006) bcd 0,427 0,330 0,602 0,606 0,470 0,650 (0,000 (0,000) (0,000) (0,000) (0,000) (0,000) [0,000] [0,000] [0,000] [0,000] [0,000] [0,000] Δ�;∗ 0,615 0,309 0,765 0,773 0,661 0,821 (0,000) (0,000) (0,000) (0,000) (0,000) (0,000) TU�; 0,099 0,570 0,040 0,528 -0,113 -0,051
(0,699) (0,000) (0,714) (0,007) (0,509) (0,712)
Observations 45 45 45 45 45 45 R2 0,712 0,636 0,594 0,772 0,747 0,679 Wald Test 3,567 0,030 5,504 2,935 6,178 1,569 p-value (0,067) (0,864) (0,024) (0,095) (0,017) (0,218) Chow test 3,419 3,631 5,475 8,510 1,484 8,551
p-value (0,033) (0,026) (0,004) (0,000) (0,227) (0,000)
Ireland Italy Luxembourg Netherlands Portugal Spain Constant -0,003 0,003 0,010 0,002 0,024 0,027
(0,574) (0,685) (0,001) (0,791) (0,001) (0,003) bcd 0,652 0,755 0,188 0,575 0,515 0,993 (0,000 (0,000) (0,000) (0,000) (0,000) (0,000) [0,000] [0,015] [0,000] [0,000] [0,000] [0,950] Δ�;∗ 0,884 0,897 0,160 0,774 0,631 1,314 (0,000) (0,000) (0,064) (0,000) (0,002) (0,000) TU�; 0,109 0,225 -0,067 -0,107 0,271 0,684
(0,571) (0,492) (0,518) (0,684) (0,112) (0,134)
Observations 45 45 45 45 45 45 R2 0,685 0,692 0,494 0,631 0,520 0,747 Wald Test 3,768 0,729 (0,189 (1,649 (0,643 (3,332 p-value (0,060) (0,398) (0,667) (0,207) (0,428) (0,076) Chow test 2,087 2,924 0,918 2,387 13,899 2,732
p-value (0,124) (0,054) (0,400) (0,092) (0,000) (0,065) Note. Estimations are based on Eq. (12) over 1979:1-1990:2. Numbers in parentheses are p-values. For the exchange rate coefficient, p-values in parentheses are based on the null hypothesis of zero ERPT, i.e. e=: <� = 0, while p-values in square brackets corresponds to the null of full ERPT, i.e. e=: <� = 1. The Wald test is performed for e=: <� − <> = 0. The Chow test is performed for the hypothesis that a structural break took place around 1990.
As reported in Table 4, there are more pronounced cross-differences in ERPT in this period than those recorded over 1990:3-2012:4. Indeed, there were divergent macroeconomic conditions across EA countries during the 1980s, especially between peripheral and core economies. Thus, it is expected that the general process of European convergence, which began before the introduction of the euro in 1999, would entail a reduction in the variability of pass-through within EA member states. Besides, the hypothesis of null ERPT is rejected for all countries in our sample, while the full ERPT hypothesis is accepted only for Spain. For

this country, we observe a higher responsiveness of importdepreciation increases by 1%, of pass-through is found in Luxembourg, where a to an increase in the rate of inflatestimated in the 1980s (over 1979:22012:4), we found a general declineexception of Belgium and Luxembourg (see Figthrough fell from 0.54% over the 1980s to 0.43% over 1990decrease of about 0.14% on average.Goldberg (2005) compared ERPT estimated over 1975found that short- and long-run ERPT elasticities declined for 15 out of 21 countries and increased for the other 6 countries. On average, the decline in the shortthrough is about 0.04 in Campa and Goldbergour study is three times as large.
Fig. 5 Decline of ERPT into import prices
To provide the statistical signifestimates of ERPT with 95% confidence indecline is more pronounced, especially for Spain, Finlandpass-through are considerablySpain had a prior history of high inflation,1970s and the 1980s, whereas in5% on average. We can posit to the lowering of Spanish pass
Moreover, it is noteworthyexogenously imposed break point around 1990, we found strongly rejected for most EA countriesin Table 4). These results appear ERPT mechanism over time. Although the changecountries, as reported in Fig.
0,0
0,2
0,4
0,6
0,8
1,0
21
country, we observe a higher responsiveness of import prices, namelyby 1%, Spanish import price inflation rises by 0.95%. The smallest rate
through is found in Luxembourg, where a 1% rise in exchange rate depreciation leads increase in the rate of inflation of import prices by 0.19%. When comparing elasticities
estimated in the 1980s (over 1979:2-1990:2) with those in the last two decades (over 1990:3:4), we found a general decline in the rate of pass-through in most EA countries,
Luxembourg (see Fig. 5). On average, the import0.54% over the 1980s to 0.43% over 1990-2012, which corresponds to a
of about 0.14% on average. For their sample of OECD countries, ERPT estimated over 1975-1989 with the ERPTrun ERPT elasticities declined for 15 out of 21 countries and
for the other 6 countries. On average, the decline in the short-run import price pCampa and Goldberg (2005); however, the average fall
our study is three times as large.
Decline of ERPT into import prices. Source: Personal calculation.
statistical significance of our results, in Fig. 6, we estimates of ERPT with 95% confidence intervals over the two periods. Wedecline is more pronounced, especially for Spain, Finland, and France,
considerably different between the two sample periods. It is of high inflation, namely a double-digit inflation rate during the
1970s and the 1980s, whereas in the last two decades, the increase in CPI has not exceed that this shift towards a stable inflation regime has contributed
lowering of Spanish pass-through.
noteworthy that when we performed Chow tests assumingexogenously imposed break point around 1990, we found the null of ERPstrongly rejected for most EA countries, except for Ireland and Luxembourg (see in Table 4). These results appear supportive, overall, of the hypothesis of a change inERPT mechanism over time. Although the change is not statistically significant for some EA
6, we can conclude that there has been a tendency toward
ERPT over 1979-1990 ERPT over 1990-2012
namely when the rate of price inflation rises by 0.95%. The smallest rate
in exchange rate depreciation leads When comparing elasticities
those in the last two decades (over 1990:3-through in most EA countries, with the ). On average, the import-price pass-
, which corresponds to a For their sample of OECD countries, Campa and
e ERPT in 1990-2003 and run ERPT elasticities declined for 15 out of 21 countries and
run import price pass-however, the average fall reported in
, we show the point tervals over the two periods. We see that the
where the rates of periods. It is noteworthy that
digit inflation rate during the the increase in CPI has not exceeded
that this shift towards a stable inflation regime has contributed
Chow tests assuming an the null of ERPT stability was
Luxembourg (see the last rows the hypothesis of a change in the tatistically significant for some EA
can conclude that there has been a tendency towards a
2012

22
decline in pass-through in our sample. The fact that the behavior of pass-through in the last two decades has been different than was the case before seems compelling.
Fig. 6 ERPT point estimates from Eq. (12). Source: Personal calculation.
5.2.3 Evidence from rolling regressions
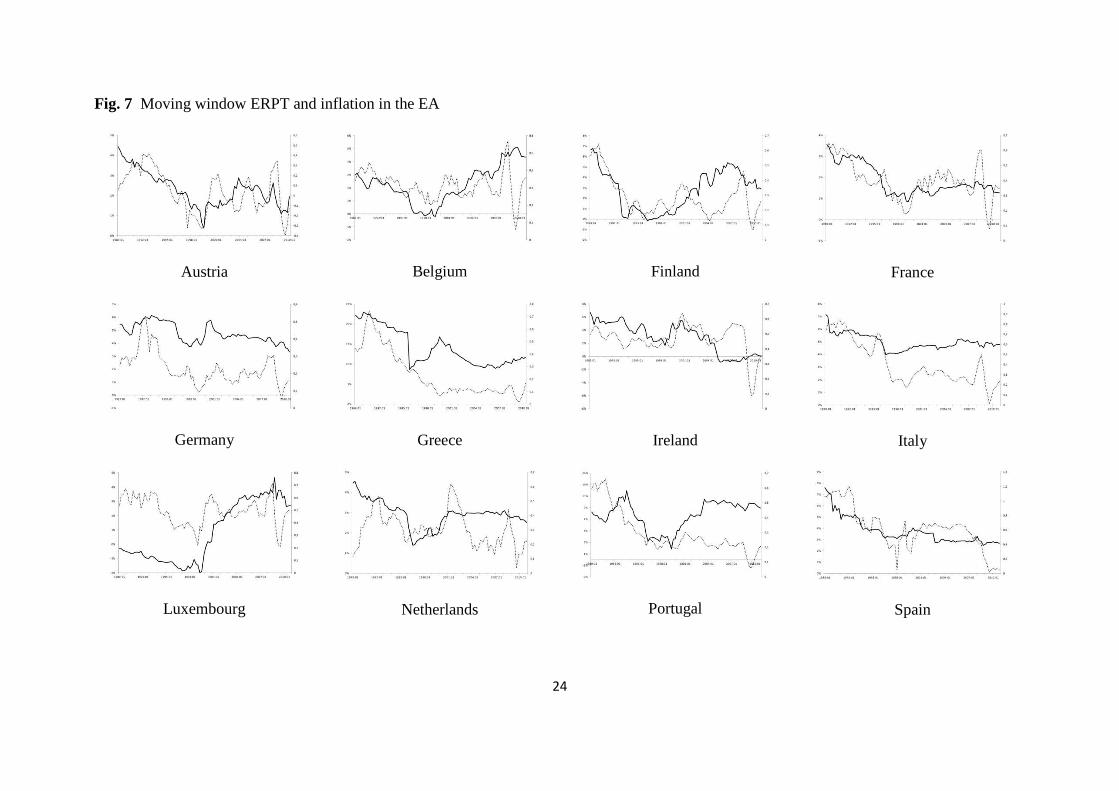
To give further evidence of the significant decline in ERPT in our sample of countries, we use a rolling window regression approach here. This allows us to check how pass-through has changed over time. For this purpose, ERPT elasticities are estimated from Eq. (12) with a 10-year moving window rolled forward one quarter at a time. We start with the window 1979:2-1989:1 and finish with 2001:1-2012:4. This will show the evolution of the responsiveness of import prices in EA countries.
The rolling estimates of import price pass-through are shown in Fig. 7 (estimates with standard error bands are reported in Fig. 9 in Appendix F). We have also reported inflation rates on the same plots to assess whether the shift towards stable inflation environment has
23
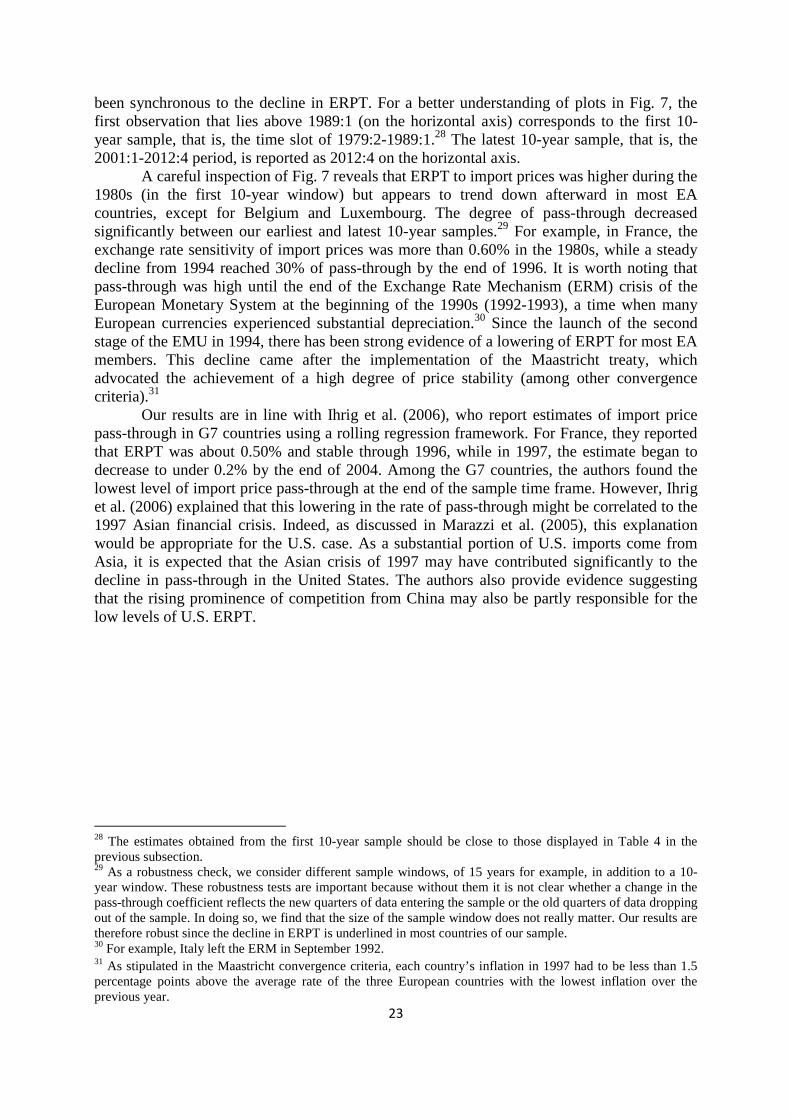
been synchronous to the decline in ERPT. For a better understanding of plots in Fig. 7, the first observation that lies above 1989:1 (on the horizontal axis) corresponds to the first 10-year sample, that is, the time slot of 1979:2-1989:1.28 The latest 10-year sample, that is, the 2001:1-2012:4 period, is reported as 2012:4 on the horizontal axis.
A careful inspection of Fig. 7 reveals that ERPT to import prices was higher during the 1980s (in the first 10-year window) but appears to trend down afterward in most EA countries, except for Belgium and Luxembourg. The degree of pass-through decreased significantly between our earliest and latest 10-year samples.29 For example, in France, the exchange rate sensitivity of import prices was more than 0.60% in the 1980s, while a steady decline from 1994 reached 30% of pass-through by the end of 1996. It is worth noting that pass-through was high until the end of the Exchange Rate Mechanism (ERM) crisis of the European Monetary System at the beginning of the 1990s (1992-1993), a time when many European currencies experienced substantial depreciation.30 Since the launch of the second stage of the EMU in 1994, there has been strong evidence of a lowering of ERPT for most EA members. This decline came after the implementation of the Maastricht treaty, which advocated the achievement of a high degree of price stability (among other convergence criteria).31
Our results are in line with Ihrig et al. (2006), who report estimates of import price pass-through in G7 countries using a rolling regression framework. For France, they reported that ERPT was about 0.50% and stable through 1996, while in 1997, the estimate began to decrease to under 0.2% by the end of 2004. Among the G7 countries, the authors found the lowest level of import price pass-through at the end of the sample time frame. However, Ihrig et al. (2006) explained that this lowering in the rate of pass-through might be correlated to the 1997 Asian financial crisis. Indeed, as discussed in Marazzi et al. (2005), this explanation would be appropriate for the U.S. case. As a substantial portion of U.S. imports come from Asia, it is expected that the Asian crisis of 1997 may have contributed significantly to the decline in pass-through in the United States. The authors also provide evidence suggesting that the rising prominence of competition from China may also be partly responsible for the low levels of U.S. ERPT.
28 The estimates obtained from the first 10-year sample should be close to those displayed in Table 4 in the previous subsection. 29 As a robustness check, we consider different sample windows, of 15 years for example, in addition to a 10-year window. These robustness tests are important because without them it is not clear whether a change in the pass-through coefficient reflects the new quarters of data entering the sample or the old quarters of data dropping out of the sample. In doing so, we find that the size of the sample window does not really matter. Our results are therefore robust since the decline in ERPT is underlined in most countries of our sample. 30 For example, Italy left the ERM in September 1992. 31 As stipulated in the Maastricht convergence criteria, each country’s inflation in 1997 had to be less than 1.5 percentage points above the average rate of the three European countries with the lowest inflation over the previous year.
24
Fig. 7 Moving window ERPT and inflation in the EA
Austria
Belgium
Finland
France
Germany
Greece
Ireland
Italy
Luxembourg
Netherlands
Portugal
Spain
25
Visual inspection of Fig. 7 shows that there is a broad downward tendency for both inflation and ERPT. Finally, we note that the wide swings of the single currency during the first three years of the monetary union posed a serious threat to price stability in the EA by putting upward pressure on import costs and producer prices.32 Plots in Fig. 7 confirm the rise in inflation rates in most EA member states from 1999 to 2000 due to the extensive depreciation of the euro. It should be noted that this outcome would explain why ERPT rose in Belgium and Luxembourg instead of decreasing. For the latter countries, the inflation levels were already low, and it is not surprising that pass-through would increase in accordance with the rise of inflationary pressures at the beginning of the EA. Overall, it should be noted that exchange rate changes continue to lead to significant pressures on domestic prices, justifying the growing interest in the issue of pass-through in the context of the EA.
6 Concluding remarks
In this paper, an update of the ERPT estimates is provided for 12 EA countries. First, using quarterly data over the 1990-2012 period, we do not find a wide heterogeneity in the degree of pass-through across the 12 EA countries under investigation, in contrast to previous empirical studies. This is not surprising since previous studies used very few observations for the EA era whereas in our study, the time span for the analysis of the post-EA era is rather long, namely until the end of 2012. In fact, the process of monetary union has entailed some convergence towards more stable macroeconomic conditions; hence, finding a relatively low and less dispersed ERPT across EA member states is expected. Assessing the stability of pass-through elasticities, we find very weak evidence of a decline around 1999.
However, our results reveal that the pass-through estimates appear to trend down from the beginning of the 1990s. We notice that the observed decline was synchronous to the shift towards a reduced inflation regime in our 12-country sample. Moreover, when estimating our pass-through equation over 1979:2-1990:2, we obtained more pronounced cross-differences in ERPT than those recorded over 1990:3-2012:4. Indeed, there were divergent macroeconomic conditions across EA countries during the 1980s, especially between “peripheral” and “core” economies. Hence, it is expected that the general process of European convergence, which began before the introduction of the euro in 1999, would lead to a reduction in the variability of pass-through within EA countries.
Finally, we observe that the wide swings of the single currency during the first three years of the monetary union was a serious threat to price stability in the EA by putting upward pressure on import costs and producer prices. During this period, ERPT increased significantly in some countries, which explains the concerns of the ECB regarding how euro depreciation affected price stability. Exchange rate changes continue to put significant pressure on domestic prices, justifying the growing interest in the issue of pass-through in the context of the EA.
32 See ECB statements by F. Duisenberg (President of the European Central Bank) in 2000.
26
References Anderton, B. (2003). Extra-Euro area manufacturing import prices and exchange rate pass-
through. (ECB Working Paper 219). Andrews, D. W. K., & Ploberger, W. (1994). Optimal tests when a nuisance parameter is
present only under the alternative. Econometrica, 62, 1383–1414. Andrews, D. W. K. (1993). Tests for parameter instability and structural change with
unknown change point, Econometrica, 61, 821–856. Athukorola, P., & Menon, J. (1995). Exchange rates and strategic pricing: The case of
Swedish machinery exports. Oxford Bulletin of Economics and Statistics, 57(4), 533–546.
Bailliu, J., & Fujii, E. (2004). Exchange rate pass-through and the inflation environment in industrialized countries: An empirical investigation. (Bank of Canada Working Paper 2004-21).
Bodnar, G. M., Dumas, B., & Marston, R. C. (2002). Pass-through and exposure. Journal of Finance, 57, 199–231.
Ben Cheikh, N. and Louhichi, W. (2014). Revisiting the role of inflation environment in exchange rate pass-through: A panel threshold approach. Economic Modeling, http://dx.doi.org/10.1016/j.econmod.2014.11.004
Bussière, M. (2013). Exchange rate pass-through to trade prices: The role of nonlinearities and asymmetries. Oxford Bulletin of Economics and Statistics, 75(5), 731–758.
Campa, J., & Goldberg, L. (2002). Exchange rate pass-through into import prices: A macro or micro phenomenon? (NBER Working Paper 8934).
Campa, J., & Goldberg, L. (2005). Exchange rate pass-through into import prices. The Review of Economics and Statistics, 87(4), 679–690.
Campa, J. M., Goldberg, L., & González-Mínguez, J. M. (2005). Exchange rate pass-through to import prices in the Euro area. (NBER Working Paper 11632).
Campa, J. M., & González, J. M. (2006). Difference in exchange rate pass-through in the Euro area. European Economic Review, 50, 121–145.
Choudhri, E., & Hakura, D. (2006). Exchange rate pass through to domestic prices: Does the inflationary environment matter? Journal of International Money and Finance, 25, 614–639.
Coughlin, C. C., & Pollard, P. S. (2004). Size matters: Asymmetric exchange rate pass- through at the industrial level. (Federal Reserve Bank of St. Louis Working Paper 2003-029C).
Carrion-I-Silvestre, J., & Sanso, A. (2006). A guide to the computation of stationarity tests. Empirical Economics, 31, 433-448.
De Bandt, O., Banerjee, A., & Kozluk, T. (2008). Measuring long-run exchange rate pass-through. Economics: The Open-Access, Open-Assessment E-Journal, 2 (2008-6).
Devereux, M., & Engel, C. (2002), Exchange rate pass-through, exchange rate volatility, and exchange rate disconnect. Journal of Monetary Economics, 49, 913–940.
Devereux, M., Engel, C., & Tille, C. (2003). Exchange rate pass-through and the welfare effects of the Euro. International Economic Review, 44, 223–242.
Dornbusch, R. (1987). Exchange rates and prices. American Economic Review, 77(1), 93–106.
Elliott, G., Rothemberg, T., & Stock, J. (1996). Efficient tests for an autoregressive unit root, Econometrica, 64, 813-839.
Engle, R., & Granger, C. (1987). Cointegration and error correction: Representation, estimation, and testing, Econometrica, 55, 251-276.
27
Faruqee, H. (2006). Exchange rate pass-through in the Euro area. IMF Staff Papers, 53, 63–88.
Feenstra, R. (1989). Symmetric pass-through of tariffs and exchange rates under imperfect competition: An empirical test. Journal of International Economics, 27, 25–45.
Gagnon, J., & Ihrig, J. (2004). Monetary policy and exchange rate pass-through. International Journal of Finance and Economics, 9(4), 315–338.
Goldberg, L. S., & Tille, G. (2008). Vehicle currency use in international trade. Journal of International Economics, 76, 177–192.
Goldberg, P. K., & Knetter, M. (1997). Goods prices and exchange rates: What have we learned? Journal of Economic Literature, 35, 1243–1272.
Gregory, W., & Hansen, B. (1996). Residual-based tests for cointegration in models with regime shifts. Journal of Econometrics, 70(1), 99–126.
Gust, C., Leduc, S., & Vigfusson, R. (2010). Trade integration, competition, and the decline in exchange-rate pass-through. Journal of Monetary Economics, 57, 309–324.
Hahn, E. (2003). Pass-through of external shocks to Euro area inflation. (ECB Working Paper 243).
Hüfner, F. P., & Schröder, M. (2002). Exchange rate pass-through to consumer prices: A European perspective. (ZEW Centre for European Economic Research Discussion Paper 02-20).
Hooper, P., & Mann, C. (1989). Exchange rate pass-through in the 1980s: The case of U.S. imports of manufacturing. Brookings Papers on Economic Activity, 1, 297–337.
Ihrig, J. E., Marazzi, M., & Rothenberg, A. (2006). Exchange rate pass-through in the G7 economies. (Board of Governors of the Federal Reserve System International Finance Discussion Paper 851).
Johansen, S. (1988). Statistical analysis of cointegration vectors. Journal of Economic Dynamics and Control, 12(2–3), 231–254.
Johansen, S. (1991). Estimation and hypothesis testing of cointegration vectors in Gaussian vector autoregressive models, Econometrica, 59(6), 1551–1580.
Krugman, P. (1987). Pricing to market when the exchange rate changes. In S. W. Arndt & D. J. Richardson (Eds.), Real-financial linkages among open economies. Cambridge, MIT Press.
Kwiatkowski, D., Phillips, P., & Shin Y. (1992). Testing for the null hypothesis of stationarity against the alternative of a unit root. Journal of Econometrics, 54, 159-178.
Mann, C. L. (1986). Prices, profits margins, and exchange rates. Federal Reserve Bulletin, 366–379.
Marazzi, M., Sheets, N., Vigfusson, R., et al. (2005). Exchange rate pass-through to U.S. import prices: Some new evidence. (Board of Governors of the Federal Reserve System International Finance Discussion Paper 833).
Marazzi, M., & Sheets, N. (2007). Declining exchange rate pass-through to U.S. import prices: The potential role of global factors. Journal of International Money and Finance, 26, 924–947.
McCarthy, J. (2007). Pass-through of exchange rates and import prices to domestic inflation in some industrialized economies. Eastern Economic Journal, 33(4), 511–537.
Obstfeld, M., & Rogoff, K. (1995). Exchange rate dynamics redux. Journal of Political Economy, 103, 624–660.
Olivei, G. P. (2002). Exchange rates and the prices of manufacturing products imported into the United States. New England Economic Review, First Quarter, 3–18.
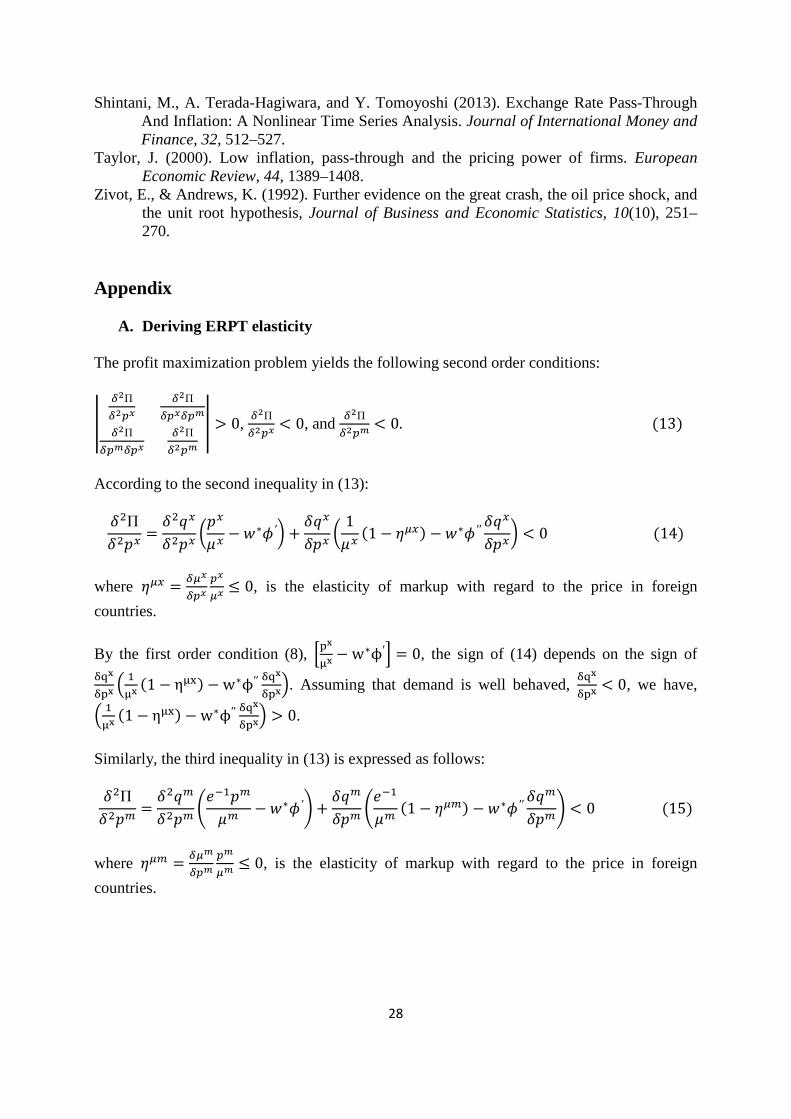
28
Shintani, M., A. Terada-Hagiwara, and Y. Tomoyoshi (2013). Exchange Rate Pass-Through And Inflation: A Nonlinear Time Series Analysis. Journal of International Money and Finance, 32, 512–527.
Taylor, J. (2000). Low inflation, pass-through and the pricing power of firms. European Economic Review, 44, 1389–1408.
Zivot, E., & Andrews, K. (1992). Further evidence on the great crash, the oil price shock, and the unit root hypothesis, Journal of Business and Economic Statistics, 10(10), 251–270.
Appendix
A. Deriving ERPT elasticity The profit maximization problem yields the following second order conditions:
h +iΠ+i�� +i
Π+��+��+iΠ+��+�� +i
Π+i��h > 0,
+iΠ+i�� < 0, and
+iΠ+i�� < 0. (13)
According to the second inequality in (13): �>
Π�>� = �>��>� #�2 − �∗�′% + ���� # 12 (1 − EH) − �∗�′′ ����% < 0 (14)
where EH = +H�+�� ��
H� ≤ 0, is the elasticity of markup with regard to the price in foreign
countries.
By the first order condition (8), klmnm − w∗ϕ′q = 0, the sign of (14) depends on the sign of
rsmrlm * �nm (1 − ηnu) − w∗ϕ′′ rsm
rlm.. Assuming that demand is well behaved, rsmrlm < 0, we have,
* �nm (1 − ηnu) − w∗ϕ′′ rsmrlm. > 0.
Similarly, the third inequality in (13) is expressed as follows: �>
Π�>�� = �>���>�� v�����2� − �∗�′w + ������ v���2� (1 − EH�) − �∗�′′ ������w < 0 (15)
where EH� = +H�+�� ��
H� ≤ 0, is the elasticity of markup with regard to the price in foreign
countries.
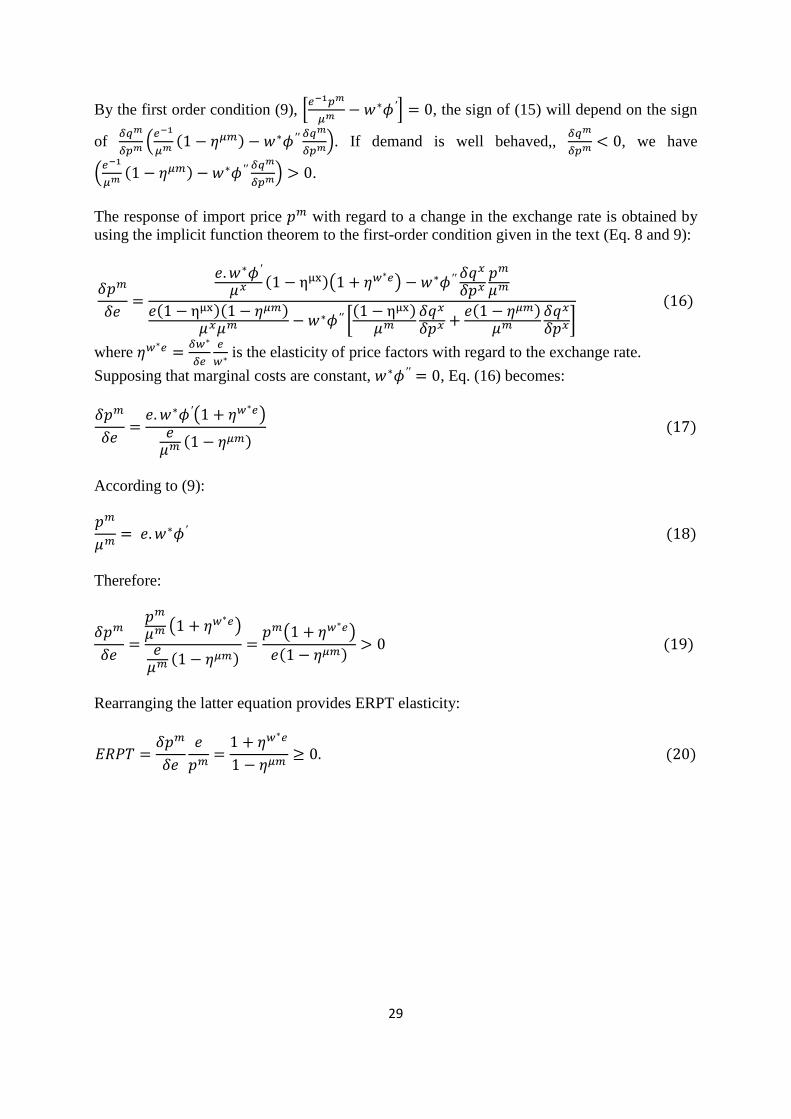
29
By the first order condition (9), kGxy��H� − �∗�′q = 0, the sign of (15) will depend on the sign
of +,�+�� *Gxy
H� (1 − EH�) − �∗�′′ +,�+��.. If demand is well behaved,,
+,�+�� < 0, we have
*GxyH� (1 − EH�) − �∗�′′ +,�
+��. > 0.
The response of import price �� with regard to a change in the exchange rate is obtained by using the implicit function theorem to the first-order condition given in the text (Eq. 8 and 9):
����� = �. �∗�′2 (1 − ηnu)�1 + EF∗G� − �∗�′′ ���� ��2��(1 − ηnu)(1 − EH�)22� − �∗�′′ "(1 − ηnu)2� ���� + �(1 − EH�)2� ����& (16)
where EF∗G = +F∗+G GF∗ is the elasticity of price factors with regard to the exchange rate.
Supposing that marginal costs are constant, �∗�′′ = 0, Eq. (16) becomes: ����� = �. �∗�′�1 + EF∗G��2� (1 − EH�) (17)
According to (9): ��2� = �. �∗�′ (18)
Therefore:
����� = ��2� �1 + EF∗G��2� (1 − EH�) = ���1 + EF∗G��(1 − EH�) > 0 (19)
Rearranging the latter equation provides ERPT elasticity:
ABCD = ����� ��� = 1 + EF∗G1 − EH� ≥ 0. (20)
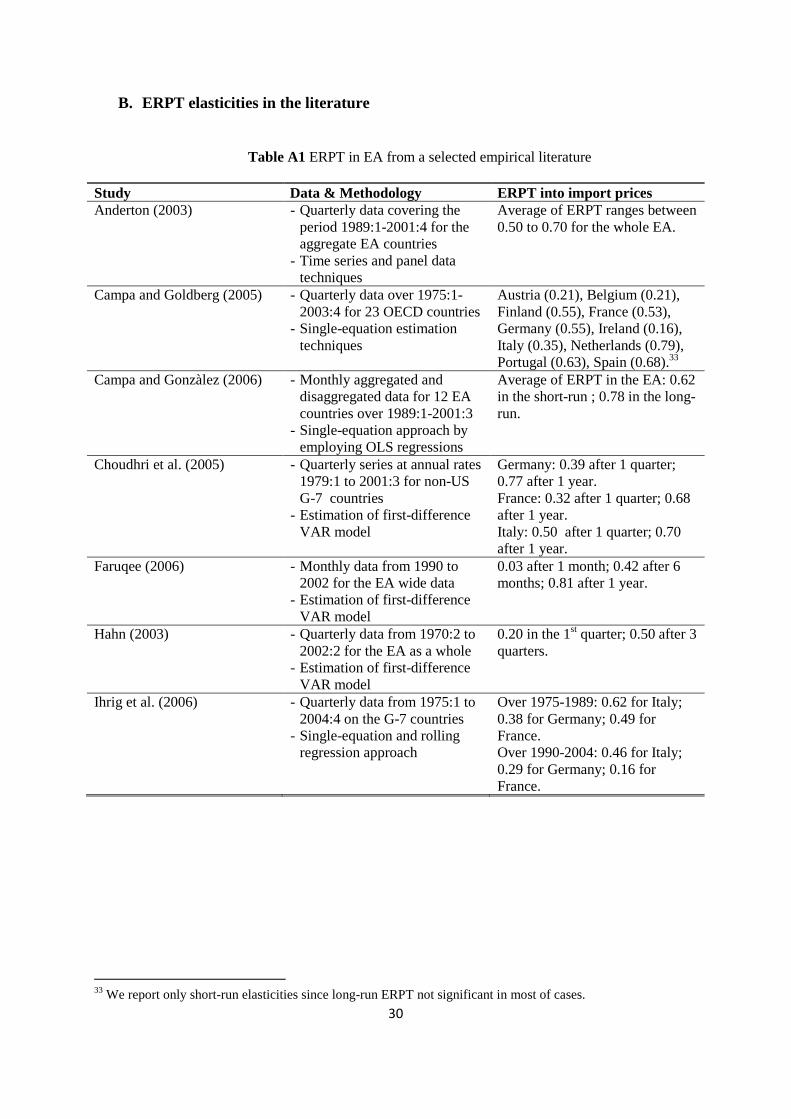
30
B. ERPT elasticities in the literature
Table A1 ERPT in EA from a selected empirical literature
Study Data & Methodology ERPT into import prices Anderton (2003) - Quarterly data covering the
period 1989:1-2001:4 for the aggregate EA countries
- Time series and panel data techniques
Average of ERPT ranges between 0.50 to 0.70 for the whole EA.
Campa and Goldberg (2005) - Quarterly data over 1975:1-2003:4 for 23 OECD countries
- Single-equation estimation techniques
Austria (0.21), Belgium (0.21), Finland (0.55), France (0.53), Germany (0.55), Ireland (0.16), Italy (0.35), Netherlands (0.79), Portugal (0.63), Spain (0.68).33
Campa and Gonzàlez (2006) - Monthly aggregated and disaggregated data for 12 EA countries over 1989:1-2001:3
- Single-equation approach by employing OLS regressions
Average of ERPT in the EA: 0.62 in the short-run ; 0.78 in the long-run.
Choudhri et al. (2005) - Quarterly series at annual rates 1979:1 to 2001:3 for non-US G-7 countries
- Estimation of first-difference VAR model
Germany: 0.39 after 1 quarter; 0.77 after 1 year. France: 0.32 after 1 quarter; 0.68 after 1 year. Italy: 0.50 after 1 quarter; 0.70 after 1 year.
Faruqee (2006) - Monthly data from 1990 to 2002 for the EA wide data
- Estimation of first-difference VAR model
0.03 after 1 month; 0.42 after 6 months; 0.81 after 1 year.
Hahn (2003) - Quarterly data from 1970:2 to 2002:2 for the EA as a whole
- Estimation of first-difference VAR model
0.20 in the 1st quarter; 0.50 after 3 quarters.
Ihrig et al. (2006) - Quarterly data from 1975:1 to 2004:4 on the G-7 countries
- Single-equation and rolling regression approach
Over 1975-1989: 0.62 for Italy; 0.38 for Germany; 0.49 for France. Over 1990-2004: 0.46 for Italy; 0.29 for Germany; 0.16 for France.
33 We report only short-run elasticities since long-run ERPT not significant in most of cases.
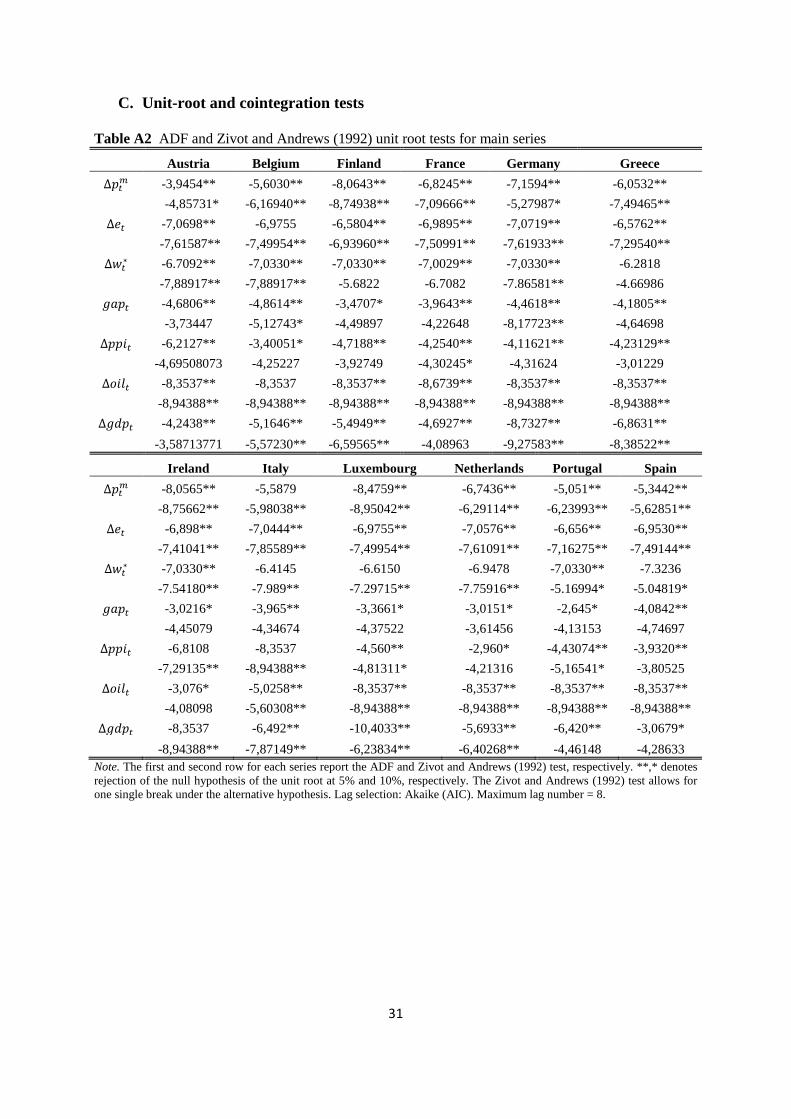
31
C. Unit-root and cointegration tests Table A2 ADF and Zivot and Andrews (1992) unit root tests for main series
Austria Belgium Finland France Germany Greece Δ�;� -3,9454** -5,6030** -8,0643** -6,8245** -7,1594** -6,0532**
-4,85731* -6,16940** -8,74938** -7,09666** -5,27987* -7,49465** Δ�; -7,0698** -6,9755 -6,5804** -6,9895** -7,0719** -6,5762**
-7,61587** -7,49954** -6,93960** -7,50991** -7,61933** -7,29540** Δ�;∗ -6.7092** -7,0330** -7,0330** -7,0029** -7,0330** -6.2818
-7,88917** -7,88917** -5.6822 -6.7082 -7.86581** -4.66986 TU�; -4,6806** -4,8614** -3,4707* -3,9643** -4,4618** -4,1805**
-3,73447 -5,12743* -4,49897 -4,22648 -8,17723** -4,64698 ��/; -6,2127** -3,40051* -4,7188** -4,2540** -4,11621** -4,23129**
-4,69508073 -4,25227 -3,92749 -4,30245* -4,31624 -3,01229 ΔR/Q; -8,3537** -8,3537 -8,3537** -8,6739** -8,3537** -8,3537**
-8,94388** -8,94388** -8,94388** -8,94388** -8,94388** -8,94388** ΔTz�; -4,2438** -5,1646** -5,4949** -4,6927** -8,7327** -6,8631**
-3,58713771 -5,57230** -6,59565** -4,08963 -9,27583** -8,38522**
Ireland Italy Luxembourg Netherlands Portugal Spain Δ�;� -8,0565** -5,5879 -8,4759** -6,7436** -5,051** -5,3442**
-8,75662** -5,98038** -8,95042** -6,29114** -6,23993** -5,62851** Δ�; -6,898** -7,0444** -6,9755** -7,0576** -6,656** -6,9530**
-7,41041** -7,85589** -7,49954** -7,61091** -7,16275** -7,49144** Δ�;∗ -7,0330** -6.4145 -6.6150 -6.9478 -7,0330** -7.3236
-7.54180** -7.989** -7.29715** -7.75916** -5.16994* -5.04819* TU�; -3,0216* -3,965** -3,3661* -3,0151* -2,645* -4,0842**
-4,45079 -4,34674 -4,37522 -3,61456 -4,13153 -4,74697 ��/; -6,8108 -8,3537 -4,560** -2,960* -4,43074** -3,9320**
-7,29135** -8,94388** -4,81311* -4,21316 -5,16541* -3,80525 ΔR/Q; -3,076* -5,0258** -8,3537** -8,3537** -8,3537** -8,3537**
-4,08098 -5,60308** -8,94388** -8,94388** -8,94388** -8,94388** ΔTz�; -8,3537 -6,492** -10,4033** -5,6933** -6,420** -3,0679*
-8,94388** -7,87149** -6,23834** -6,40268** -4,46148 -4,28633 Note. The first and second row for each series report the ADF and Zivot and Andrews (1992) test, respectively. **,* denotes rejection of the null hypothesis of the unit root at 5% and 10%, respectively. The Zivot and Andrews (1992) test allows for one single break under the alternative hypothesis. Lag selection: Akaike (AIC). Maximum lag number = 8.

32
Table A3 Engle and Granger (EG) and Gregory and Hansen (GR) cointegration tests for the benchmark model over 1990-2012
Austria Belgium Finland France Germany Greece
EG Test -2,18425 -1,44054 -3,50167** -2,73048 -1,87657 -3,63295**
GH Test
Break in constant -4,155 -3,568 -4,423 -4,243 -3,892 -5,147
Break in constant and slope -5,273 -5,014 -6,132 -6,295* -6,620* -5,937
Ireland Italy Luxembourg Netherlands Portugal Spain
EG Test -3,18447* -1,57368 -2,78077 -2,65413 -1,65779 -1,9858
GH Test
Break in constant -3,728 -5,354* -3,038 -5,221* -4,444 -3,864
Break in constant and slope -3,947 -6,918** -5,146 -6,887** -5,601 -5,572 Note. **,* the null hypothesis of the unit root in the residuals (no cointegration) is rejected at 5% and 10%, respectively. The first row reports Engle and Granger (1987) test. The second row corresponds to Gregory and Hansen (1996) tests. Specifications for GH tests include both a constant and a time trend. Lag selection: Akaike (AIC). Maximum lag number =8.
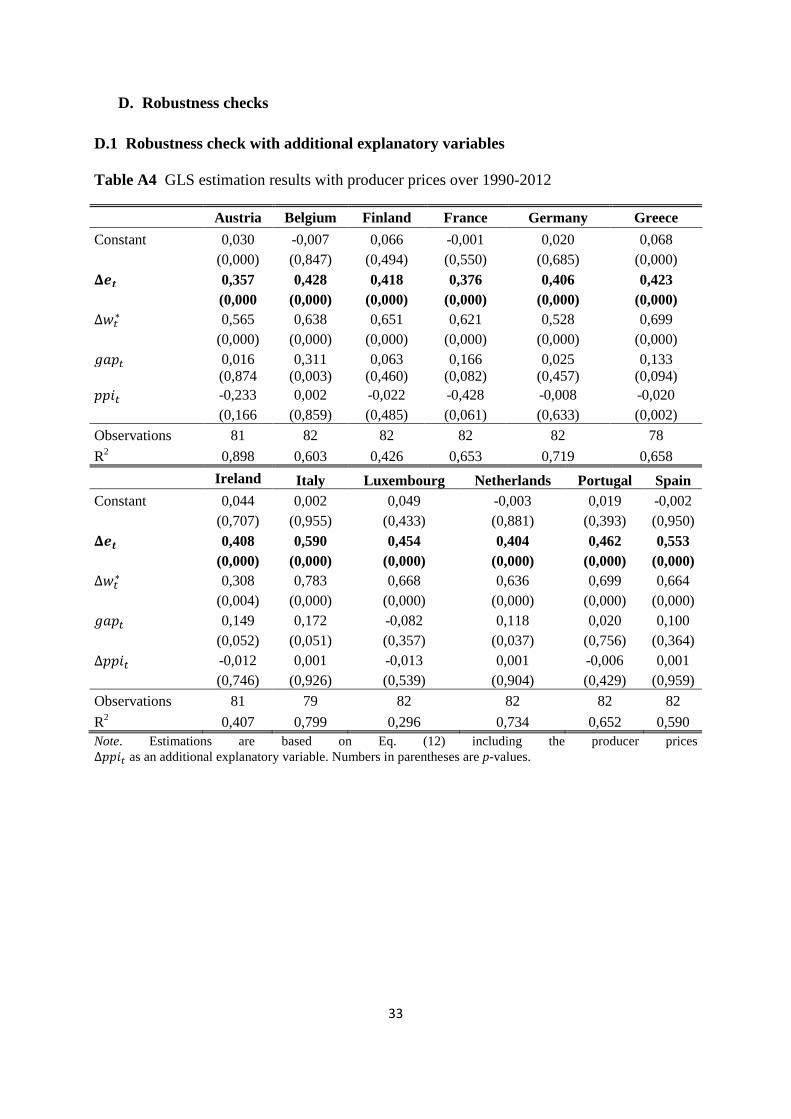
33
D. Robustness checks D.1 Robustness check with additional explanatory variables Table A4 GLS estimation results with producer prices over 1990-2012
Austria Belgium Finland France Germany Greece
Constant 0,030 -0,007 0,066 -0,001 0,020 0,068 (0,000) (0,847) (0,494) (0,550) (0,685) (0,000) bcd 0,357 0,428 0,418 0,376 0,406 0,423 (0,000 (0,000) (0,000) (0,000) (0,000) (0,000) Δ�;∗ 0,565 0,638 0,651 0,621 0,528 0,699 (0,000) (0,000) (0,000) (0,000) (0,000) (0,000) TU�; 0,016 0,311 0,063 0,166 0,025 0,133 (0,874 (0,003) (0,460) (0,082) (0,457) (0,094) ��/; -0,233 0,002 -0,022 -0,428 -0,008 -0,020
(0,166 (0,859) (0,485) (0,061) (0,633) (0,002)
Observations 81 82 82 82 82 78
R2 0,898 0,603 0,426 0,653 0,719 0,658
Ireland Italy Luxembourg Netherlands Portugal Spain Constant 0,044 0,002 0,049 -0,003 0,019 -0,002
(0,707) (0,955) (0,433) (0,881) (0,393) (0,950) bcd 0,408 0,590 0,454 0,404 0,462 0,553 (0,000) (0,000) (0,000) (0,000) (0,000) (0,000) Δ�;∗ 0,308 0,783 0,668 0,636 0,699 0,664 (0,004) (0,000) (0,000) (0,000) (0,000) (0,000) TU�; 0,149 0,172 -0,082 0,118 0,020 0,100 (0,052) (0,051) (0,357) (0,037) (0,756) (0,364) Δ��/; -0,012 0,001 -0,013 0,001 -0,006 0,001
(0,746) (0,926) (0,539) (0,904) (0,429) (0,959)
Observations 81 79 82 82 82 82
R2 0,407 0,799 0,296 0,734 0,652 0,590 Note. Estimations are based on Eq. (12) including the producer prices ��/; as an additional explanatory variable. Numbers in parentheses are p-values.

34
Table A5 GLS estimation results with oil prices over 1990-2012
Austria Belgium Finland France Germany Greece
Constant 0,029 -0,001 -0,005 -0,004 -0,003 0,007 (0,000) (0,762) (0,186) (0,042) (0,036) (0,009) bcd 0,244 0,445 0,291 0,303 0,397 0,501 (0,000 (0,000) (0,000) (0,000) (0,000) (0,000) Δ�;∗ 0,321 0,678 0,418 0,451 0,513 0,853 (0,006 (0,000) (0,002) (0,000) (0,000) (0,000) TU�; -0,012 0,311 0,031 0,088 0,030 0,056 (0,905 (0,003) (0,697) (0,280) (0,362) (0,527) R/Q; 0,017 -0,006 0,018 0,029 0,012 -0,021
(0,185 (0,585) (0,289) (0,000) (0,189) (0,086) Observations 81 82 82 82 82 78
R2 0,898 0,604 0,331 0,708 0,711 0,594
Ireland Italy Luxembourg Netherlands Portugal Spain Constant 0,006 0,005 0,011 0,000 0,002 0,000
(0,092) (0,019) (0,009) (0,913) (0,341) (0,971) bcd 0,404 0,578 0,424 0,355 0,432 0,525 (0,000 (0,000) (0,000) (0,000) (0,000) (0,000) Δ�;∗ 0,298 0,745 0,595 0,516 0,613 0,580 (0,029 (0,000) (0,001) (0,000) (0,000) (0,000) TU�; 0,149 0,179 -0,085 0,118 0,008 0,100 (0,053) (0,039) (0,342) (0,027) (0,900) (0,358) R/Q; 0,002 0,005 0,010 0,020 0,015 0,016
(0,883) (0,617) (0,610) (0,005) (0,121) (0,232) Observations 81 82 82 82 82 82
R2 0,406 0,794 0,295 0,761 0,661 0,598 Note. Estimations are based on Eq. (12) including oil prices, Δo/Q;, in U.S. dollars as an additional explanatory variable. Numbers in parentheses are p-values.
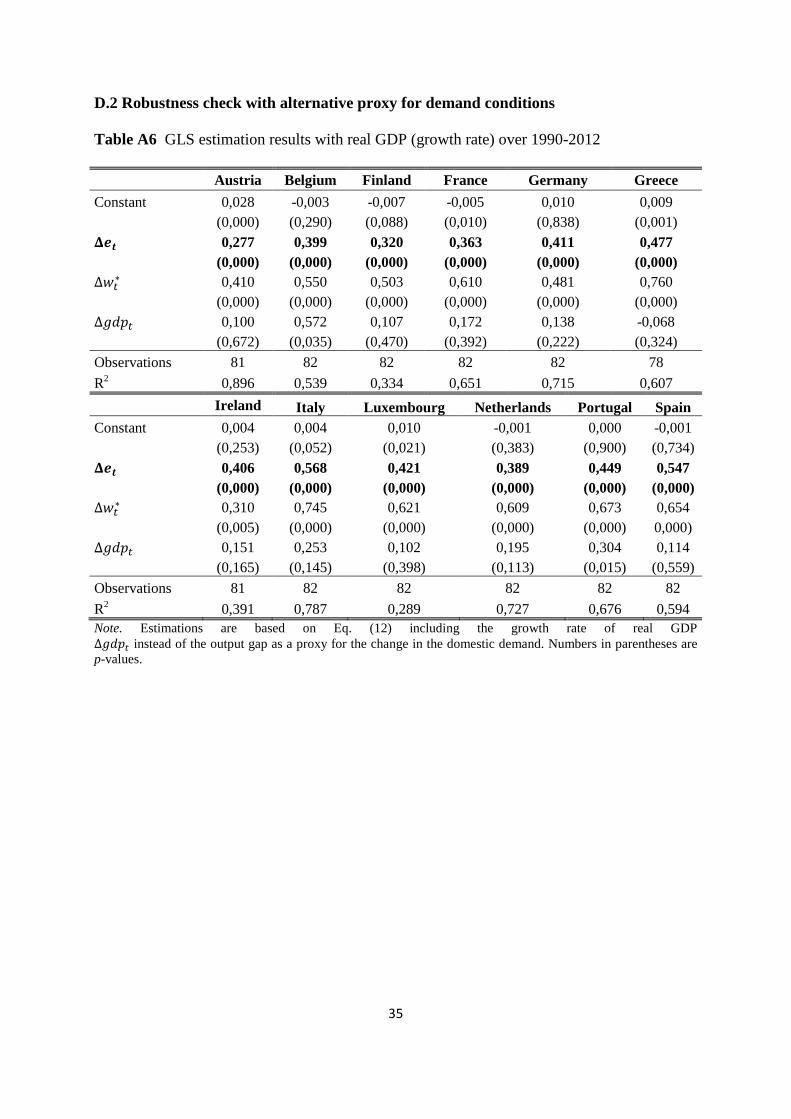
35
D.2 Robustness check with alternative proxy for demand conditions Table A6 GLS estimation results with real GDP (growth rate) over 1990-2012
Austria Belgium Finland France Germany Greece
Constant 0,028 -0,003 -0,007 -0,005 0,010 0,009 (0,000) (0,290) (0,088) (0,010) (0,838) (0,001) bcd 0,277 0,399 0,320 0,363 0,411 0,477 (0,000) (0,000) (0,000) (0,000) (0,000) (0,000) Δ�;∗ 0,410 0,550 0,503 0,610 0,481 0,760 (0,000) (0,000) (0,000) (0,000) (0,000) (0,000) ΔTz�; 0,100 0,572 0,107 0,172 0,138 -0,068 (0,672) (0,035) (0,470) (0,392) (0,222) (0,324)
Observations 81 82 82 82 82 78
R2 0,896 0,539 0,334 0,651 0,715 0,607
Ireland Italy Luxembourg Netherlands Portugal Spain Constant 0,004 0,004 0,010 -0,001 0,000 -0,001
(0,253) (0,052) (0,021) (0,383) (0,900) (0,734) bcd 0,406 0,568 0,421 0,389 0,449 0,547 (0,000) (0,000) (0,000) (0,000) (0,000) (0,000) Δ�;∗ 0,310 0,745 0,621 0,609 0,673 0,654 (0,005) (0,000) (0,000) (0,000) (0,000) 0,000) ΔTz�; 0,151 0,253 0,102 0,195 0,304 0,114 (0,165) (0,145) (0,398) (0,113) (0,015) (0,559)
Observations 81 82 82 82 82 82
R2 0,391 0,787 0,289 0,727 0,676 0,594 Note. Estimations are based on Eq. (12) including the growth rate of real GDP ΔTz�; instead of the output gap as a proxy for the change in the domestic demand. Numbers in parentheses are p-values.
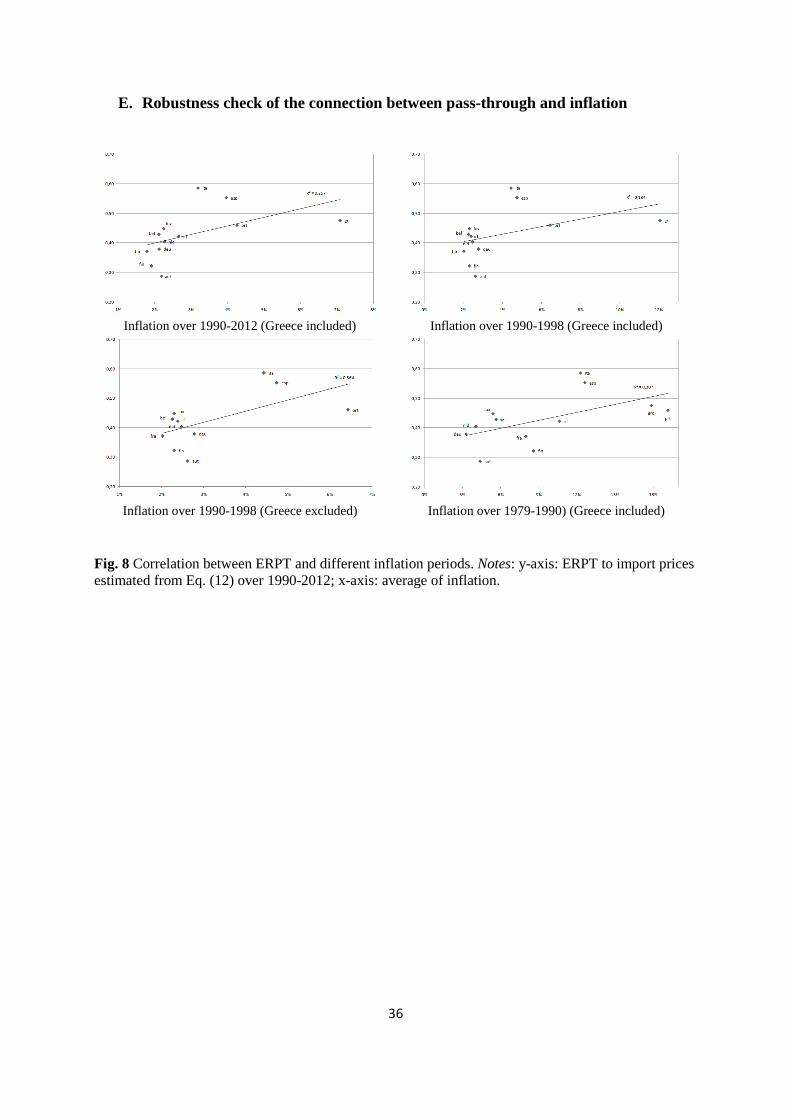
36
E. Robustness check of the connection between pass-through and inflation
Inflation over 1990-2012 (Greece included)
Inflation over 1990-1998 (Greece included)
Inflation over 1990-1998 (Greece excluded)
Inflation over 1979-1990) (Greece included)
Fig. 8 Correlation between ERPT and different inflation periods. Notes: y-axis: ERPT to import prices estimated from Eq. (12) over 1990-2012; x-axis: average of inflation.
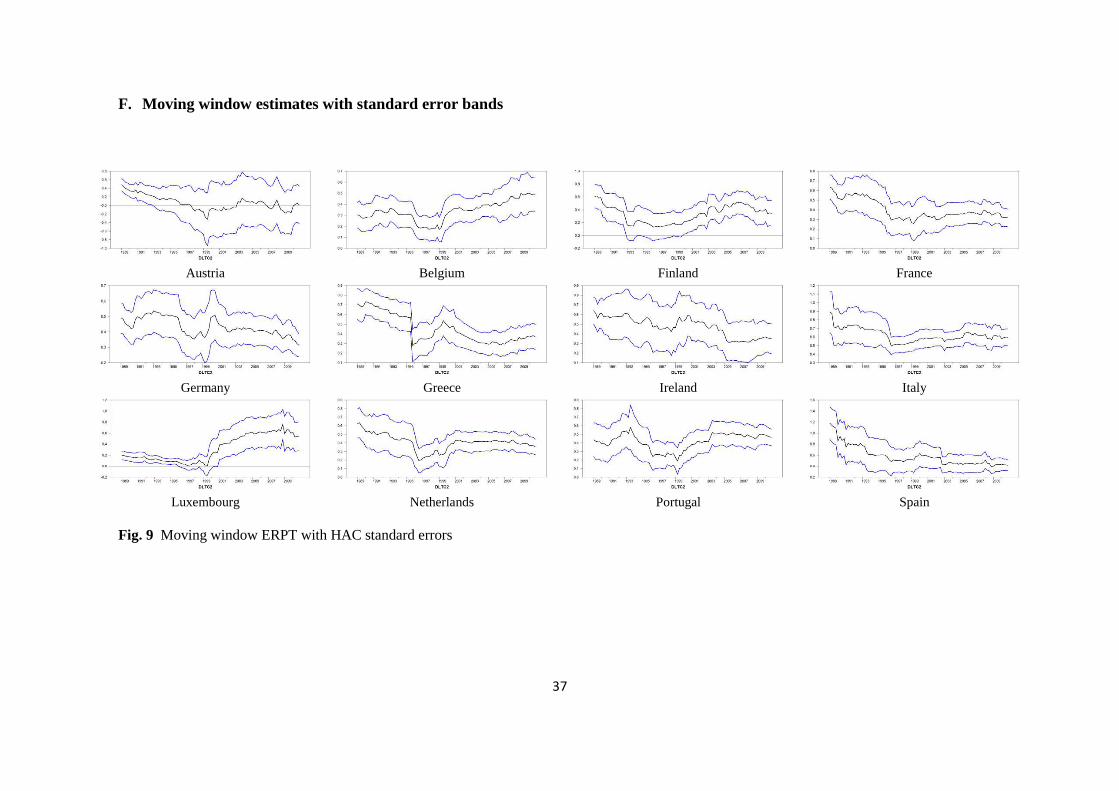
37
F. Moving window estimates with standard error bands
Austria
Belgium
Finland
France
Germany
Greece
Ireland
Italy
Luxembourg
Netherlands
Portugal
Spain
Fig. 9 Moving window ERPT with HAC standard errors