cesifo working paper no. 2563 - econstor
TRANSCRIPT

econstorMake Your Publications Visible.
A Service of
zbwLeibniz-InformationszentrumWirtschaftLeibniz Information Centrefor Economics
Carson, Scott Alan
Working Paper
Demographic, residential, and socioeconomic effectson the distribution of 19th century US white statures
CESifo Working Paper, No. 2563
Provided in Cooperation with:Ifo Institute – Leibniz Institute for Economic Research at the University ofMunich
Suggested Citation: Carson, Scott Alan (2009) : Demographic, residential, and socioeconomiceffects on the distribution of 19th century US white statures, CESifo Working Paper, No. 2563,Center for Economic Studies and Ifo Institute (CESifo), Munich
This Version is available at:http://hdl.handle.net/10419/26608
Standard-Nutzungsbedingungen:
Die Dokumente auf EconStor dürfen zu eigenen wissenschaftlichenZwecken und zum Privatgebrauch gespeichert und kopiert werden.
Sie dürfen die Dokumente nicht für öffentliche oder kommerzielleZwecke vervielfältigen, öffentlich ausstellen, öffentlich zugänglichmachen, vertreiben oder anderweitig nutzen.
Sofern die Verfasser die Dokumente unter Open-Content-Lizenzen(insbesondere CC-Lizenzen) zur Verfügung gestellt haben sollten,gelten abweichend von diesen Nutzungsbedingungen die in der dortgenannten Lizenz gewährten Nutzungsrechte.
Terms of use:
Documents in EconStor may be saved and copied for yourpersonal and scholarly purposes.
You are not to copy documents for public or commercialpurposes, to exhibit the documents publicly, to make thempublicly available on the internet, or to distribute or otherwiseuse the documents in public.
If the documents have been made available under an OpenContent Licence (especially Creative Commons Licences), youmay exercise further usage rights as specified in the indicatedlicence.
www.econstor.eu

Demographic, Residential, and Socioeconomic Effects on the Distribution of
19th Century US White Statures
SCOTT ALAN CARSON
CESIFO WORKING PAPER NO. 2563 CATEGORY 3: SOCIAL PROTECTION
FEBRUARY 2009
An electronic version of the paper may be downloaded • from the SSRN website: www.SSRN.com • from the RePEc website: www.RePEc.org
• from the CESifo website: Twww.CESifo-group.org/wp T

CESifo Working Paper No. 2563
Demographic, Residential, and Socioeconomic Effects on the Distribution of
19th Century US White Statures
Abstract Using a source of 19th century US state prison records, this study addresses European-American stature variation. The most commonly cited sources for stature variation are diets, disease, and work effort. However, vitamin D is also vital in human statures and health. This paper demonstrates that 19th century white statures were positively associated with direct sunlight, which is the primary source of vitamin D in mammals. Stature and insolation are associated with occupations, and workers who spent more time outdoors produced more vitamin D and grew taller. White statures also decreased throughout the 19th century, and this stature diminution is observed across the stature distribution.
JEL Code: I30, I31, J00, J15.
Keywords: 19th US white statures, vitamin D, solar radiation, quantile regression.
Scott Alan Carson School of Business
University of Texas, Permian Basin 4901 East University
Odessa, TX 79762 USA
Please do not cite without permission from the author. I appreciate comments from Marco Sünder, and John Komlos. Owen Wallace-Servera, Sandy Triepke and Anita Voorhies provided excellent research assistance. All errors are mine.

Demographic, Residential, and Socioeconomic Effects on the Distribution of 19th
Century United States White Stature
I. Introduction
The use of height data to measure living standards is now a well-established
method in economics (Fogel, 1994, p. 138). A populations' average stature reflects the
cumulative interaction between nutrition, disease exposure, work, and the physical
environment (Steckel, 1979, pp. 365-367). By considering average versus individual
stature, genetic differences are mitigated, leaving only the influences of the economic and
physical environments on stature. When diets, health, and physical environments
improve, average stature increases and decreases when diets become less nutritious,
disease environments deteriorate, or the physical environment places more stress on the
body. Therefore, stature provides considerable insights into understanding historical
processes and augments other welfare measures for 19th century European-Americans.
Using a new source of 19th century United States prison records and robust statistics, the
present study contrasts the heights of US white males across the stature distribution and
adds a new explanation for traditional sources of white stature variation.
An inadequately explored source for 19th century stature variation may be related
to biology, especially its relation to geography. Calcium and vitamin D are two chemical
elements required throughout life for healthy bone and teeth formation; however, their
abundance are most critical during younger ages (Wardlaw, Hampl, and Divilestro, 2004,

pp. 394-396; Tortolani et al, 2002, p. 60). Calcium generally comes from dairy products,
and vitamin D in not dietary but is produced by the synthesis of cholesterol and sunlight
in the epidermises’’ stratum granulosum (Holick, 2004a, pp. 363-364; Nesby-O’dell,
2002, p. 187; Loomis, 1967, p. 501; Norman, 1998, p. 1108; Holick, 2007). Greater
direct sunlight (insolation) produces more vitamin D, and vitamin D is related to adult
terminal statures (Xiong et al, 2005, pp. 228, 230-231; X-ZLiu et al, 2003; Ginsburg et al
1998; Uitterlinden et al, 2004).
After the circulatory system contains sufficient amounts of vitamin D and to avoid
vitamin D toxicity, vitamin D production is restricted within the stratum granulosum and
residual vitamin D is broken down into inert matter (Holick et al, 1981, pp. 591-592;
Jablonski, 2006, p. 62; Holick, 2001, p. 20; Holick, 2004a, p. 363). This self-limiting
vitamin D effect may account for white stature variation with insolation, because at North
American latitudes whites are close to the natural threshold where vitamin D production
is curtailed. Moreover, to firmly establish the link between stature, insolation, and
vitamin D, it is necessary to demonstrate the significance of the stature-insolation
relationship across different samples and across their stature distributions. At the
opposite extreme, insufficient vitamin D has been linked to rickets, osteomalasia, auto-
immune diseases, and certain cancers (Holick, 2001, p. 28; Garland et al, 2006, pp. 252-
256; Grant et al, 2003, p. 372).
It is against this backdrop that using robust statistics this paper addresses three
paths of inquiry into 19th century white stature variation in the US. First, how were
insolation and vitamin D production related to white statures across the white stature
distribution? This study finds that white statures were positively related with insolation

and increased with insolation at a decreasing a rate. Second, how did white statures vary
with occupations? White farmers were taller than workers in other occupations, and this
farmer stature advantage is generally attributed to better nutrition and rural environments.
However, this paper offers an additional explanation for the farmer stature advantage.
Third, how did white statures vary throughout the 19th century? Results presented here
illustrate that 19th century US white statures decreased throughout the 19th century, which
is observed equally across the stature distribution.
II. Data
Prison Records
Table 1, Nineteenth Century US White Populations is State Prisons Prisons N Percent Prisons N Percent Arizona 2,171 1.73 Kentucky 6,650 5.31 California 8,230 6.57 Missouri 23,787 19.00 Colorado 7,021 5.61 New Mexico 1,998 1.60 Georgia 157 .13 Ohio 24,841 19.84 Idaho 2,074 1.66 Oregon 2,040 1.63 Illinois 9,942 7.94 Pennsylvania 16,026 12.80 Kansas 4,082 3.26 Texas 16,171 12.92 Source: Data used to study black and white anthropometrics is a subset of a much larger
19th century prison sample. All available records from American state repositories have
been acquired and entered into a master file. These records include Arizona, California,
Colorado, Idaho, Illinois, Kansas, Kentucky, Missouri, New Mexico, Ohio, Oregon,
Pennsylvania, Texas, Utah and Washington.
Notes: Stature is in centimeters. The occupation classification scheme is consistent
with Ferrie (1997).

The data used here to study white statures is part of a large 19th century prison
sample. All state prison repositories were contacted and available records were acquired
and entered into a master data set. These prison records include Arizona, California,
Colorado, Idaho, Illinois, Kansas, Kentucky, Missouri, New Mexico, Ohio, Oregon,
Pennsylvania, Texas, and Washington (Table 1). Most whites in the sample were
incarcerated in Ohio, Missouri, Texas, and Pennsylvania prisons.
All historical height data have various biases, and prison and military records are
the most common sources for historical stature data. One common shortfall for military
samples is a truncation bias imposed by minimum stature requirements (Fogel et al, 1978,
p. 85; Sokoloff and Vilaflor, 1982, p. 457, Figure 1; A’Hearn, 2004). Fortunately, prison
records do not implicitly suffer from such a constraint and the subsequent truncation bias
observed in military samples. However, prison records are not above scrutiny. The
prison data may have selected many of the materially poorest individuals who were
drawn from lower socioeconomic groups, that segment of society most vulnerable to
economic change (Bogin, 1991, p. 288; Komlos and Baten, 2004, p. 199; Nicholas and
Steckel, 1991, p. 944). For height as an indicator of biological variation, this kind of
selection is preferable to that which marks many military records – minimum height
requirements for service (Fogel, 1978, p. 85; Sokoloff and Vilaflor, 1982, p. 457, Figure
1). Moreover, if—at the margins of subsistence—demographic, socioeconomic factors,
and insolation were significant in stature variation, prison records may more clearly
illustrate these effects.
There also is concern over entry requirements, and physical descriptions were
recorded by prison enumerators at the time of incarceration as a means of identification

and reflect pre-incarceration conditions. Between 1830 and 1920, prison officials
routinely recorded the dates inmates were received, age, complexion, nativity, stature,
pre-incarceration occupation, and crime. All records with complete age, stature,
occupation, and nativity were collected. There was great care recording inmate statures
because accurate measurement had legal implications for identification in the event that
inmates escaped and were later recaptured.1 Arrests and prosecutions across states may
have resulted in various selection biases that may affect the results of this analysis.
However, white stature variation within US prisons is consistent with other stature
studies (Steckel, 1979; Margo and Steckel, 1982; Nicholas and Steckel, 1991, pp. 941-
943; Komlos, 1992; Komlos and Coclanis, 1997; Bodenhorn, 1999; Sünder, 2004).
Fortunately, inmate enumerators were quite thorough when recording inmate
complexion and occupation. For example, enumerators recorded white complexions as
light, medium, dark, and fair. The white inmate complexion classification is further
supported by European immigrant complexions, which were always of fair complexion
and were also recorded in US prisons as light, medium, dark, and fair.2 Enumerators
recorded a broad continuum of occupations and defined them narrowly, recording over
200 different occupations, which are classified here into four categories: merchants and
high skilled workers are classified as white-collar workers; light manufacturing, craft
workers, and carpenters are classified as skilled workers; workers in the agricultural
1 Many inmate statures were recorded at quarter, eighth, and even sixteenth increments.
2 I am currently collecting 19th century Irish prison records. Irish prison enumerators also used light,
medium, dark, fresh and sallow to describe white prisoners in Irish prisons from a traditionally white
population. To date, no inmate in an Irish prison has been recorded with a complexion consistent with
African heritage.

sector are classified as farmers; laborers and miners are classified as unskilled workers
(Tanner, 1977, p. 346; Ladurie, 1979; Margo and Steckel, 1992; p. 520). Unfortunately,
inmate enumerators did not distinguish between farm and common laborers. Since
common laborers probably encountered less favorable biological conditions during
childhood and adolescence, this potentially overestimates the biological benefits of being
a common laborer and underestimates the advantages of being a farm laborer. Because
the purpose of this study is to compare 19th century white male statures, blacks and
immigrants are excluded from the analysis.
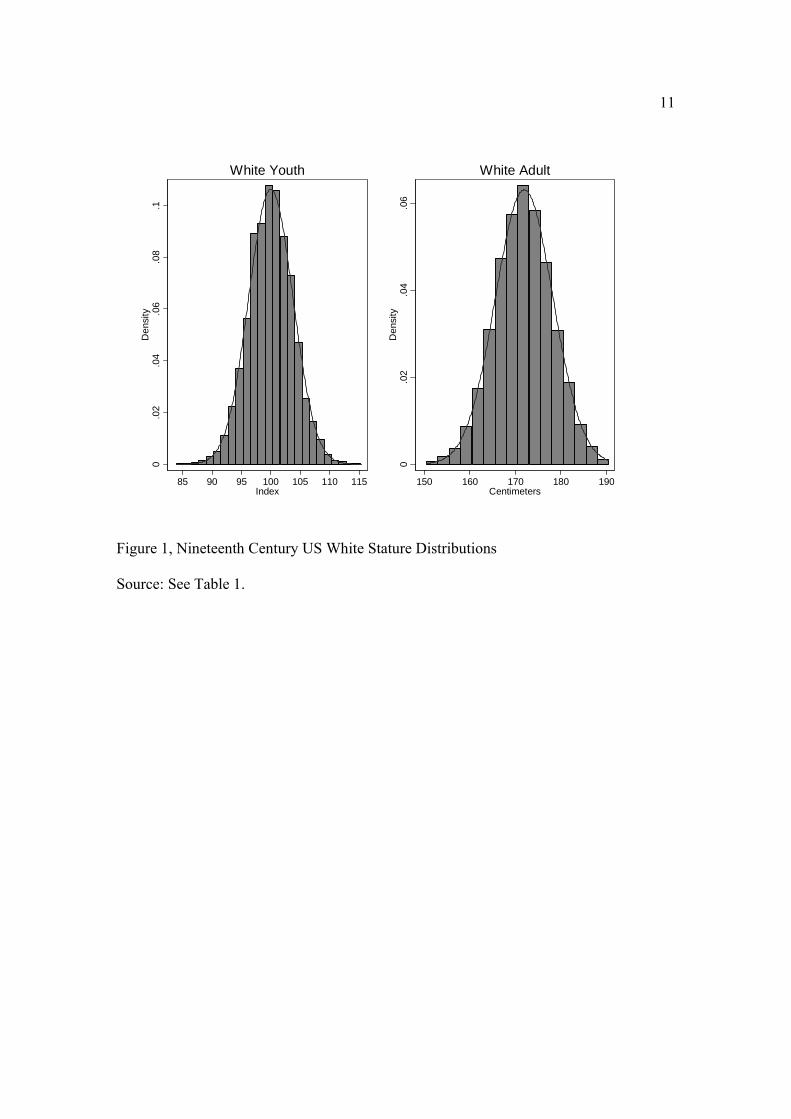
Because the youth height distribution is itself a function of the age distribution, a
youth height index is constructed that standardizes for age to determine youth stature
normality and whether there were arbitrary truncation points imposed on inmate stature,
either by law enforcement or state legislation. This index is calculated by first
calculating the average stature for each age group; each observation is then divided by the
average stature for the relevant age group (Komlos, 1987, p. 899). Figure 1 demonstrates
that white statures were distributed approximately normal and there is no evidence of age
heaping or arbitrary truncation points.

Table 2, Descriptive Statistics of Whites in National Prison Data Ages N Percent Height (cms) S.D. (cms) Teens 16,924 13.52 169.75 6.70 20s 64,187 51.27 171.95 6.52 30s 27,181 21.71 171.99 6.48 40s 10,987 8.78 171.89 6.50 50s 4,360 3.48 171.61 6.51 60s 1,318 1.05 171.25 6.73 70s 233 .19 170.94 6.42 Birth Decade 1800 906 .72 172.41 6.50 1810 2,467 1.97 172.52 6.56 1820 4,202 3.36 172.45 6.80 1830 7,995 6.39 171.79 6.66 1840 16,541 13.21 171.46 6.52 1850 25,084 20.04 171.31 6.69 1860 25,436 20.32 171.69 6.55 1870 22,334 17.84 171.65 6.52 1880 13,075 10.44 171.69 6.50 1890 6,744 5.39 171.90 6.51 1900 406 .32 170.67 6.30 Occupations White-Collar 13,800 11.02 171.32 6.37 Skilled 32,196 25.72 171.28 6.38 Farmers 16,640 13.29 173.16 6.44 Unskilled 56,344 45.01 171.54 6.66 No Occupations 6,210 4.96 170.97 7.14 Nativity Northeast 4,030 3.22 170.70 6.31 Middle Atlantic 32,335 25.83 170.09 6.36 Great Lakes 32,629 26.06 171.88 6.42 Plains 17,839 14.25 171.94 6.38 Southeast 21,857 17.46 172.91 6.66 Southwest 10,708 8.55 173.39 6.84 Far West 5,792 4.63 170.62 6.60 Decade Received
1820s 13 .01 168.52 5.29 1830s 958 .77 171.56 6.47 1840s 1,859 1.48 171.80 7.08 1850s 3,683 2.94 172.4 6.69 1860s 9,637 7.70 170.99 6.68 1870s 20,557 16.42 171.48 6.73 1880s 22,108 17.66 171.70 6.66 1890s 18,691 22.92 171.70 6.46 1900s 19,889 15.89 171.50 6.50

1910s 17,325 13.84 171.96 6.42 1920s 470 .38 172.38 6.45
Source: See table 1.
11
0.0
2.0
4.0
6.0
8.1
Den
sity
85 90 95 100 105 110 115Index
White Youth
0.0
2.0
4.0
6D
ensi
ty
150 160 170 180 190Centimeters
White Adult
Figure 1, Nineteenth Century US White Stature Distributions
Source: See Table 1.

12
Table 2 presents proportions for white inmates’ age, birth decade, occupations,
and nativity. Although average statures are included, they are not reliable because of
possible compositional effects, which are accounted for in the regression models that
follow. Age percentages demonstrate that whites were incarcerated at older ages. Most
prisoners were born in the mid-19th century; occupations reflect socioeconomic status,
and while prison inmates typically come from lower working classes, there was a sizeable
share of inmates from white-collar and skilled occupations. Most whites in the sample
were born in the Middle-Atlantic and Great Lakes states; the South and Far-west are also
represented in the sample.
United States’ Insolation
To account for the relationship between vitamin D and stature, a measure is
constructed that accounts for solar radiation. Insolation is the incoming direct sunlight
that reaches the earth, its atmosphere, and surface objects.3 Insolation is also the primary
source of vitamin D (Holick, 1991, p. 590; Holick, 2007, p. 270). Because of its distance
from the equator, Europeans were efficient in vitamin D production at low insolation
latitudes in the Northern hemisphere. As early hominids migrated out of African to
Northern latitudes, they received less solar radiation, and through the process of natural
selection, darker pigmented hominids were less successful hunter-gatherers in Northern
latitudes and were selected-out (Loomis, 1967, pp. 503-504).
3 Insolation is an acronym for incident solar radiation, and is a measure for sunlight energy received for a
given surface area at a given time. If w equals watts, m equals meters, and i equals insolation,
daymkwh
mwi
⋅== 22 .

13
Because US historical insolation is unavailable, a modern insolation index (1993-
2003) is constructed, and monthly insolation values are measured from January through
June. The insolation index measures statewide average insolation levels across each of
the states based on the hours of direct sunlight received per day at county centroids in
each state.4 Each state estimate is then determined by summing the average hours of
direct sunlight for each county (at its centroid), weighted by the proportion of the
county’s total land area (in square miles) to the state’s total land area (in square miles).
While this index is a rough approximation for historical insolation, it provides sufficient
detail to capture state latitudinal insolation variation and consequently, vitamin D
production. Predictably, Southern states have greater insolation than Northern states.
For example, Texas receives 1.43, or 29 percent, more hours of direct sunlight per day
than New York. It is also difficult to interpret insolation’s net direct effect on human
health, because greater insolation reduces calories required to maintain body temperature
and produces more vitamin D, but greater insolation also warms surface temperatures,
which may have made disease environments less healthy from water-borne diseases,
especially in the South.
III. Socioeconomic Status, Geography, Insolation, and White Stature
Nineteenth century white statures were related to age, socioeconomic status, birth
cohorts, and nativity; they may have also been related to insolation and vitamin D
production. Which of these factors dominates reveals much about conditions facing 19th
4 Insolation is not the insolation in the county that surrounds the state’s centroid, but insolation in each
county’s geographic center. The range of state insolation values extends from Maine’s minimum of 3.43
hours of direct sunlight to Arizona’s maximum of 5.22 hours of direct sunlight per day.

14
century whites. If US white nativity was a source for stature variation, regional diets and
social practices were a possible driving force in stature variation. If occupations were
associated with stature, relative social position was a primary impetus driving white
stature variation. If, however, insolation was a significant impetus on white stature, part
of 19th century white stature variation was not due to social or cultural factors but also
geographical, and whites born in the South would have benefited from extended
exposure to insolation.
To better understand the interaction between the conditional stature distribution
and socioeconomic and demographic characteristics, a stature quantile regression
function is constructed. Let si represent the stature of the ith inmate and xi the vector of
covariates for birth cohort, socioeconomic status, and demographic characteristics. The
conditional quantile function is
( ) ( ) ( )1,0, ∈+== ppSxxpQs yi ηθ
which is the pth-quantile of s, given x.5 The interpretation of the coefficient iθ is the
influence of the ith covariate on the stature distribution at the pth quantile. For example,
the age coefficient at the median (.5 quantile) is the stature increase that keeps an
“average” inmate’s stature on the median if age increases by one year. When estimating
stature regressions, quantile estimation offers several advantages over least squares. Two
advantages in anthropometric research are more robust estimation in the face of an
unknown truncation point and greater description of covariate effects across that stature
distribution.
5 The coefficient vector θ is obtained using techniques presented in Koenker and Bassett (1978 and 1982)
and Hendricks and Koenker (1992).

15
We test which variables were associated with the height of 19th century whites.
To start, stature for the ith individual is related to age, socioeconomic status, birth period,
nativity, and insolation.
∑ ∑ ∑= = =
++++=70
12
10
1
3
11
a t li
pli
pti
pai
pi OccupationDecadeBirthAgeBlackCent ββββα
∑ ∑= =
++++6
1
4
1ni
d
pInsoli
pdi
pMigrationi
pn InsolationDirectionMoveMigrationNativity ββββ
pii
pInsol nInsolatiio εβ ++ 2
2
Dummy variables are included for individual youth ages 12 through 22; adult age
dummies are included for ten year age intervals from the 40s through the 70s. Birth
decade dummies are in ten year intervals from 1800 through 1899. Occupation dummy
variables are for white-collar, skilled, farmers, and unskilled occupations. Nativity
dummy variables are included for birth in Northeast, Middle Atlantic, Great Lakes,
Southeast, Southwest, and Far West regions. A dummy variable accounts for migration
status and directional migration dummy variables are included to account for North-
South migrations.6 If insolation was a driving force in stature growth, northward moves
6 North1 is an intermediate move from Southern to Central or Central to Northern states. North2 is a long
distance move from Southern to Northern states. South1 is a move from a Northern to Central or Central to
Southern state. South2 is a move from Northern to Southern states. Northern states include Maine,
Vermont, New Hampshire, Massachusetts, Connecticut, Rhode Island, New York, New Jersey,
Pennsylvania, Michigan, Wisconsin, Iowa, Minnesota, North Dakota, South Dakota, Wyoming, Montana,
Idaho, Oregon, and Washington. Central states include Delaware, Maryland, Virginia, Wes Virginia,
Kentucky, Indiana, Illinois, Missouri, Nebraska, Kansas, Colorado, Utah, Nevada, and California.
Southern states include North Carolina, South Carolina, Georgia, Florida, Alabama, Mississippi,
Tennessee, Arkansas, Louisiana, Oklahoma, Texas, New Mexico, and Arizona. The binary variable North1

16
will have adverse stature effects, and southward moves will be associated with taller
statures. Continuous insolation and insolation difference variables between receiving and
sending locations are added to account for insolation and vitamin D production.
Table 3’s model 1 presents least squares estimates for the white sample. To
illustrate how white stature was related to demographic, occupation, nativity, migration,
and insolation across the stature distribution, models 2 through 6 present .25, .50, .75,
.90, and .95 quantile stature estimates.
is an intermediate move from Southern to Central or Central to Northern states. North2 is a long distance
move from Southern to Northern states. South1 is a move from a Northern to Central or Central to
Southern state. South2 is a move from Northern to Southern states.

17
Table 3, Nineteenth Century United States National Quantile Stature Models
related to Demographics, Birth Period, Migration, and Insolation by Socioeconomic
Status
Model 1 Model 2 Model 3 Model 4 Model 5 Model 6 OLS .25 .50 .75 .90 .95 Intercept 143.43*** 135.27*** 143.74*** 153.24*** 155.80*** 169.44***Ages 12 -17.35*** -21.16*** -16.48*** -13.80*** -10.30*** -10.02*** 13 -15.26*** -17.99*** -15.85*** -10.37*** -8.79*** -6.83*** 14 -13.27*** -13.42*** -13.45*** -12.49*** -11.77*** -10.15*** 15 -8.31*** -8.50*** -8.35*** -8.04*** -6.81*** -5.88*** 16 -4.90*** -4.80*** -5.04*** -5.09*** -5.35*** -5.50*** 17 -3.13*** -2.86*** -3.08*** -3.29*** -3.14*** -3.46*** 18 -2.00*** -1.81*** -2.11*** -2.28*** -2.30*** -2.21*** 19 -1.06*** -.916*** -1.04*** -1.23*** -1.36*** -1.39*** 20 -.586*** -.596*** -.528* -.606*** -.778*** -.651** 21 -.146*** -.088 -.141* -.160* -.169* -.231*
22 -.001** .021 -.005 .043 -.001 .158 23-39 Reference Reference Reference Reference Reference Reference 40s -.333*** -.228*** -.444*** -.486*** -.214* -.334*** 50s -.842*** -.786*** -.864*** -.843*** -.711*** -.778***
60s -1.43*** -1.68*** -1.66*** -1.28*** -1.36*** -858** 70s -2.03*** -1.97*** -2.28*** -2.07*** -1.98*** -.904* Birth Decade 1800s 1.52*** 1.66*** 1.76*** 1.76*** 1.02*** .836 1810s 1.43*** 1.73*** 1.46*** 1.50*** 1.14*** 1.04** 1820s 1.13*** 1.03*** 1.12*** .328*** 1.32*** 1.58*** 1830s .287*** .259* .216** .328** .321* .379** 1840s -.124** -.085 -.186*** -.195*** -.169 -3.9-7
1850s -.317*** -.368*** -.294*** -.309 -.350*** -.184* 1860s Reference Reference Reference Reference Reference Reference 1870s -.260*** -.085 -.405*** -.309*** -.299*** -.221*** 1880s -.584*** -.364*** -.714** -.681*** -.661*** -.680*** 1890s -.411*** -.330** -.510*** -.222* -.366** -.333
1900s -.170 -.175 -.206 .010 -.732*** -.935** Occupations White-Collar -.178*** -.053 -.184** -.263*** -.450*** -.356*** Skilled -.192*** -.053 -.195*** -.264*** -.407*** -.405*** Farmer 1.21*** 1.31*** 1.15*** 1.17*** .997*** .953*** Unskilled Reference Reference Reference Reference Reference Reference Nativity Northeast -1.46*** -1.21*** -1.61*** -1.49*** -1.73*** -2.12***

18
Middle Atlantic -1.78*** -1.61*** -1.88*** -1.87*** -1.89*** -2.36*** Great Lakes -.095 .066 -.207*** -.145*** 8.7-4*** -.249*** Plains Reference Reference Reference Reference Reference Reference Southeast .954*** .881*** .930*** 1.10** 1.12*** .850*** Southwest 2.87*** 2.78*** 2.93*** 2.84*** 3.23*** 3.19*** Far west .193 .329* .224 .051 .028 -.202 Migration Status Migrant .284*** .194*** .266*** .392*** .314*** .292*** Non-migrant Reference Reference Reference Reference Reference Reference Move Direction North1 -.733*** -.609*** -.689*** -.830*** -.785*** -.615*** North2 -.333* -.137 -.320*** -.542*** -.498* -.087 South1 .221*** .124 .235*** .302*** .190*** .318* South2 .734*** .379 .606*** 1.08*** 1.29*** 1.76*** Insolation Variables
Insolation 14.23*** 15.96*** 14.26*** 11.43*** 12.08*** 6.91** Insolation2 -1.75*** -1.94*** -1.77*** -1.40*** -1.48*** -.891** Insolation Difference
.322*** .563*** .260*** .155** .168* -2.6-7
N 125,190 125,190 125,190 125,190 125,190 125,190 R2 .0677 .0328 .0345 .0345 .0340 .0340
Source: See Table 1.
Notes: *-1 percent significant; **-5 percent significant; ***-10 percent significant.
Standard errors attained with bootstrap.
19
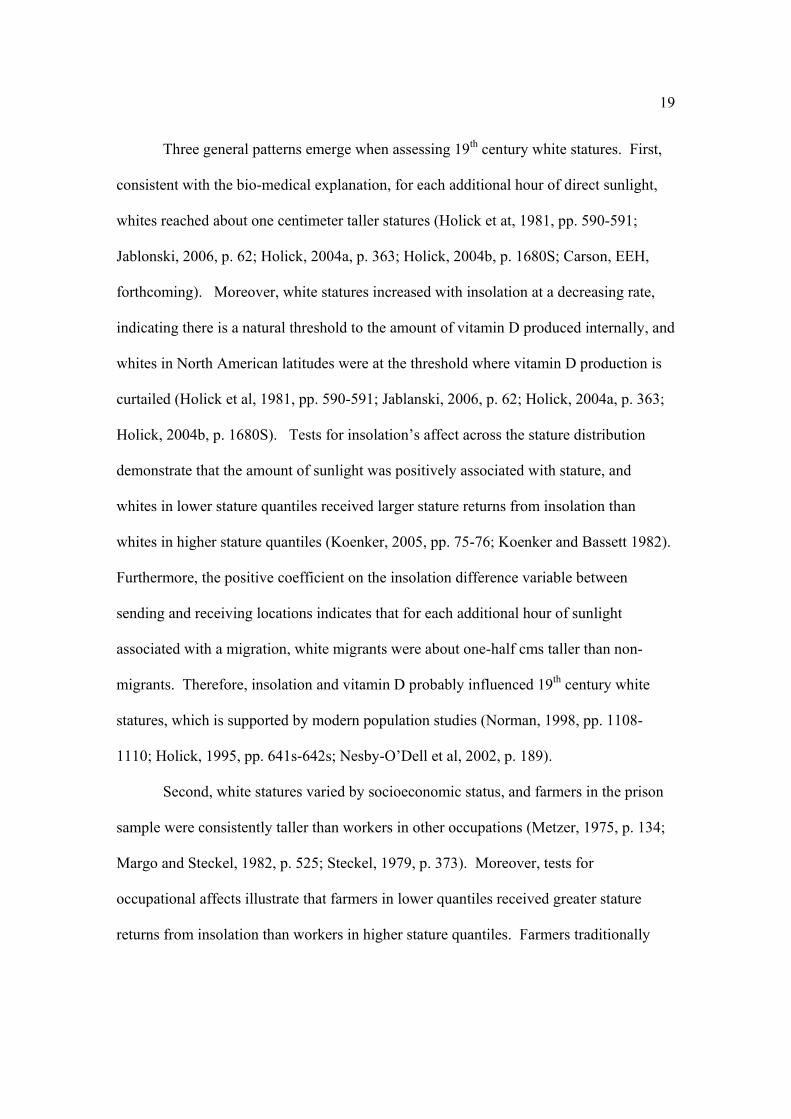
Three general patterns emerge when assessing 19th century white statures. First,
consistent with the bio-medical explanation, for each additional hour of direct sunlight,
whites reached about one centimeter taller statures (Holick et at, 1981, pp. 590-591;
Jablonski, 2006, p. 62; Holick, 2004a, p. 363; Holick, 2004b, p. 1680S; Carson, EEH,
forthcoming). Moreover, white statures increased with insolation at a decreasing rate,
indicating there is a natural threshold to the amount of vitamin D produced internally, and
whites in North American latitudes were at the threshold where vitamin D production is
curtailed (Holick et al, 1981, pp. 590-591; Jablanski, 2006, p. 62; Holick, 2004a, p. 363;
Holick, 2004b, p. 1680S). Tests for insolation’s affect across the stature distribution
demonstrate that the amount of sunlight was positively associated with stature, and
whites in lower stature quantiles received larger stature returns from insolation than
whites in higher stature quantiles (Koenker, 2005, pp. 75-76; Koenker and Bassett 1982).
Furthermore, the positive coefficient on the insolation difference variable between
sending and receiving locations indicates that for each additional hour of sunlight
associated with a migration, white migrants were about one-half cms taller than non-
migrants. Therefore, insolation and vitamin D probably influenced 19th century white
statures, which is supported by modern population studies (Norman, 1998, pp. 1108-
1110; Holick, 1995, pp. 641s-642s; Nesby-O’Dell et al, 2002, p. 189).
Second, white statures varied by socioeconomic status, and farmers in the prison
sample were consistently taller than workers in other occupations (Metzer, 1975, p. 134;
Margo and Steckel, 1982, p. 525; Steckel, 1979, p. 373). Moreover, tests for
occupational affects illustrate that farmers in lower quantiles received greater stature
returns from insolation than workers in higher stature quantiles. Farmers traditionally

20
had greater access to superior diets and nutrition, but farmers also worked outdoors and
were exposed to more sunlight during adolescent ages; consequently, stature and
socioeconomic status may also be related to vitamin D production (Bodiwala et al, 2003,
pp. 659-660; Tangpricha et al, 2002, p. 662). Islam et al (2007, pp. 383-388) demonstrate
that children exposed to more insolation produce more vitamin D, and if there was little
movement away from parental occupations, 19th century occupations may also be a good
indicator for the occupational environment in which individuals come to maturity (Costa,
1993, p. 367; Margo and Steckel, 1992, p. 520; Wananamethee et al, 1996, pp. 1256-
1262; Nyström-Peck and Lundberg, 1995, pp.734-737). That unskilled workers were
also tall suggests that many unskilled workers were agricultural workers, who received
sufficient nutrition allocations and almost certainly worked outdoors, received more
insolation and produced sufficient vitamin D to reach taller statures.

21
165
170
175
180
185
Cen
timet
ers
1800 1820 1840 1860 1880 1900Decade
q.5 q.25q.75 q.9q.95
Figure 2, Nineteenth Century US Whites across Quantiles
Source: See Table 3.
Third, white statures decreased throughout the 19th century, and this is observed
across the stature distribution. Between 1800 and 1900 and across quantiles, statures
declined by nearly 2 cms (Figure 2). Part of the stature decline corresponded with US
industrialization and urbanization. Nineteenth century US agricultural commercialization
separated producers from consumers. During the early 19th century, white farmers
worked in rural agricultural environments, and the rise of Northeastern urban centers—
such as New York City, Boston, and Philadelphia—placed disproportionate stress on
rural farmers who lived near urban centers (Carson, 2008b, pp. 367-368). For example,
although Southeastern Pennsylvanian’s were in close physical proximity to leading

22
Bucks, Chester, and Lancaster counties, they were also closer to urbanized Philadelphia,
and Southeastern Pennsylvanian’s reached shorter terminal statures than individuals from
rural Pennsylvania (Carson, 2008b, pp. 363-368; Cuff, 2005, pp. 154-161). Urbanization
and industrialization created other costs related with agricultural commercialization.
Industrialization’s proliferation compromised the quality of dairy and meat production,
and in this pre-refrigeration period, food spoilage increased as the distance between rural
farms and urban centers increased (Craig et al., 2004).
Other relationships are consistent with expectations. Statures varied regionally,
and Southwestern whites reached the tallest statures. Internal immigrants who located
southward were taller than those who immigrated northward, and Southern white stature
gains were larger than those experienced by Northern whites. Part of the Southern
migration advantage was related to Southern agriculture. The 19th century opening of the
South to agriculture increased Southwestern agricultural productivity, which was higher
than elsewhere in the US (Higgs, 1977, p. 24; Margo and Steckel, 1982, p. 519; Komlos
and Coclanis, 1997, p. 443). Before the Civil War, the South was self-sufficient in food
production, and relatively high white wages may have also influenced white Southern
statures (Fogel, 1994, pp. 89, 132-133). After the Civil War, Southern wages in the West
South Central were in general lower than Midwest wages and were comparable to those
in the Middle Atlantic region. Northeasterners, especially youth, encountered adverse
biological environments, and contemporary reports of rickets—a result of vitamin D
deficiency—may have contributed to shorter Northeastern statures.

23
IV. Conclusions
This paper demonstrates that insolation was an important source of 19th century
white stature variation and illustrates that whites at North American latitudes were closer
to the biological threshold were vitamin D production is curtailed. Moreover, to establish
the link between stature, insolation, and vitamin D, a positive and significant relationship
between insolation and stature is observed across the stature distribution. The stature-
insolation hypothesis also adds to our knowledge for why 19th century farmers were taller
than workers in other occupations. Farmers were closer to nutritious food supplies and
further from urban locations, where disease was most easily spread. However, farmers
also worked outdoors, were exposed to more sunlight, produced more vitamin D than
their white-collar and skilled counterparts, and reached taller terminal statures. White
statures declined throughout the 19th century, a pattern frequently observed with
industrialization and urbanization. Therefore, 19th century statures were associated with a
complex set of demographic, environmental, and occupational factors, which were
consistently related with US white statures across the stature distribution.

24
References
A’Hearn, Brian “A Restricted Maximum Likelihood Estimator for Truncated Height
Samples,” Economics and Human Biology 2, no. 1 (2004): 5-20.
Bodenhorn, Howard. “A Troublesome Caste: Height and Nutrition of Antebellum
Virginia’s Rural Free Blacks.” Journal of Economic History. 59, no. 4
(December, 1999): 972-996.
Bodiwala, Dhaval, Christopher Luscombe, Samson Liu, Mark Saxby, Michael French,
Peter Jones, Anthony Fryer and Richard Strange. 2003, “Prostate Cancer Risk
and Exposure to Ultraviolet Radiation: Further Support of the Protective Effect of
Sunlight,” Cancer Letters v. 192, pp. 145-146.
Bogin, Barry, 1991, “Measurement of Growth Variability and Environmental Quality in
Guatemalan Children,” Annals of Human Biology 18, pp. 285-294.
Carson, Scott Alan (forthcoming). “Geography, Insolation, and Vitamin D in 19th
Century US African-American and White Statures,” Explorations in Economic
History.
Carson, Scott Alan. (2008a) “The Effect of Geography and Vitamin D on African-
American Stature in the Nineteenth Century: Evidence from Prison Records,”
Journal of Economic History. 68(3), pp. 812-831.
Carson, SA (2008b) “Health During Industrialization: Evidence from the Nineteenth-
Century Pennsylvania State Prison System,” Social Science History 32(3), pp.
347-372.
Costa, Dora, 1993, “Height, Wealth and Disease among the Native-Born in the Rural
Antebellum North,” Social Science History Association, 17(3), pp. 355-383.

25
Craig, Lee A., Barry Goodwin, and Thomas Grennes. 2004. “The Effect of Mechanical
Refrigeration on Nutrition in the U. S.” Social Science History. 28(2): 325-336.
Cuff T (1992) A Weighty Issue Revisited: New Evidence on Commercial Swine
Weights and Pork Production in Mid-Nineteenth Century America. Agricultural
History 66(4): 55-74
Fogel, Robert, Stanley Engerman, James Trussell, Roderick Floud, Clayne Pope, and
Larry Wimmer, “Economics of Mortality in North America, 1650-1910: A
Description of a Research Project,” Historical Methods, 11(2), 1978, pp. 75-108.
Fogel, Robert W. “Economic Growth, Population Theory and Physiology: The Bearing of
Long-Term Processes on the Making of Economic Policy,” American Economic
Review 84(3), 1994, pp. 369-395.
Garland, Cedric F, Frank Garland, Edward Gorhom, Margin Lipkin, Harold Newmark,
Sharif Mohr, and Michael Holick. (2006) “The Role of Vitamin D in Cancer
Prevention.” American Journal of Public Health. 96(2). pp. 252-261.
Ginsburg, E, G. Livshits, K. Yakovenko and E. Kobyliansky, “Major Gene Control of
Human Body Height, Weight and BMI in Five Ethnically Different Populations,”
Annals of Human Genetics, 62, 1998, pp. 307-322.
Grant, William (2003) “Ecological Studies of Solar UV-B Radiation and Cancer
Mortality Rates,” Resent Results in Cancer Research. 164, pp. 371-377.
Higgs, Robert. Competition and Coercion. Chicago: University of Chicago Press, 1977.
Holick, Michael F., A. MacLaughlin, and S. H. Doppelt (1981) “Regulation of Cutaneous
Previtamin D3 Photosynthesis in Men: Skin Pigment is not an Essential
Regulator.” Science, 211(6), pp. 590-593.

26
Holick, Michael F., “Environmental Factors that Influence the Cutaneous Production of
Vitamin D.” American Journal of Clinical Nutrition 61, 1995, pp. 638S-645S.
Holick, Michael F., (2001) “A Perspective on the Beneficial Effects of Moderate
Exposure to Sunlight: Bone Health, Cancer Prevention, Mental Health and Well
Being,” Ed. Giacomoni, Paolo, Sun Protection in Man. Elsevier: Amersterdam.
Holick, Michael F, “Vitamin D: Importance in the Prevention of Cancers, Type 1
Diabetes, Heart Disease and Osteroporosis.” American Journal of Clinical
Nutrition 79. 2004a. pp. 362-371.
Holick, Michael, 2004b, “Sunlight and Vitamin D for Bone Health and Prevention of
Autoimmune Diseases, Cancers, and Cardiovascular Diseases,” American
Journal of Clinical Nutrition, supplement, pp. 1678S-1688S.
Holick, Michael F, 2007 “Vitamin D Deficiency.” New England Journal of Medicine
357(3). pp. 266-281.
Islam, Talat, W. James Gauderman, Wendy Cozen, Thomas Mack, 2007, “Childhood Sun
Exposure Influences Rick of Multiple Sclerosis in Monozygotic Twins,”
Neurology 69, pp. 381-388.
Jablonski, Nina (2006) Skin: A Natural History. Berkeley: University of California Press.
Koenker, Roger, “Robust Methods in Econometrics,” Econometric Reviews, (1), 213-
215.
Koenker, Roger and G Bassett (1978) “Regression Quantiles,” Econometrica, 46: 33-50.
Koenker, Roger (2005) Quantile Regression, Cambridge University Press, Cambridge.
Komlos, John. “The Height and Weight of West Point Cadets: Dietary Change in
Antebellum America.” Journal of Economic History 47, no. 4 (December 1987):

27
897-927.
Komlos, John. “Toward an Anthropometric History of African-Americans: The Case of
the Free Blacks in Antebellum Maryland.” in Strategic Factors in Nineteenth
Century American Economic History: A Volume to Honor Robert W. Fogel,
edited by Claudia Goldin and Hugh Rockoff. Chicago: University of Chicago
Press. 1992, 297-329.
Komlos, John and Peter Coclanis. “On the Puzzling Cycle in the Biological Standard of
Living: The Case of Antebellum Georgia.” Explorations in Economic History.
34, no. 4 (October, 1997): 433-59.
Komlos, John and Jörg Baten (2004) “Anthropometric Research and the Development of
Social Science History. Social Science History. 28: 191-210.
Le Roy Ladurie, E., 1979, The Conscripts of 1968: A Study of the Correlation between
Geographical Mobility, Delinquency and Physical Stature and Other Aspects of
the Situation of the Young Frenchman Called to Do Military Service that Year.
In: Reynolds B, Reynolds S, editors. The Territory of the Historian, (Chicago:
University of Chicago Press). 33-60.
Loomis, W. Farnsworth, 1967, “Skin-Pigment Regulation of Vitamin-D Biosynthesis in
Man: Variation in Solar Ultraviolet at Different Latitudes may have Caused
Racial Differentiation in May,” Science, pp. 501-506.
Margo, Robert and Richard Steckel. “Heights of American Slaves: New Evidence on
Nutrition and Health.” Social Science History 6, no. 4 (Fall, 1982): 516-538.
Margo, Robert and Richard Steckel. 1992, “The Nutrition and Health of Slaves and
antebellum Southern whites.” in Without Consent or Contract: Conditions of

28
Slave Life and the Transition to Freedom, edited by R. W. Fogel and S. L.
Engerman, New York: Norton, 508-521.
Metzer, Jacob. M. “Rational Management, Modern Business Practices and Economies of
Scale in Antebellum Southern Plantations.” Explorations in Economic History
12, n. 2 (April, 1975): 123-150.
Nesby-O’Dell, Shanna, Kelley Scanlon, Mary Cogswell, Cathleen Gillesie, Bruce Hollis
Anne Looker, Chris Allen, Cindy Doughertly, Elaine Gunter, and Barbara
Bowman. “Hypovitaminosis D Prevalence and Determinants among African-
American and White Woman of Reproductive Age: Third National Health and
Nutrition Examination Survey, 1988-1994.” American Journal Clinical Nutrition
76. 2002. pp. 187-192.
Nicholas, Stephen and Richard Steckel, “Heights and Living Standards of English
Workers During the Early Years of Industrialization.” Journal of Economic
History. 51(4), 1991, pp. 937-957.
Norman, Anthony, “Sunlight, Season, Skin Pigmentation, Vitamin D and 25-
hydroxyvatamin D: Integral Components of the Vitamin D Endocrine System,”
American Journal of Clinical Nutrition, 67. 1998, pp. 1108-1110.
Nyström-Peck, Maria and Olle Lundberg, 1995, “Short Stature as an Effect and Social
Conditions in Childhood,” Social Science Medicine 41(5), pp. 733-738.
Sokoloff, K. & Villaflor, G. (1982) “Early Achievement of Modern Stature in America,”
Social Science History 6, 453-481.
Steckel, Richard, 1979, “Slave Height Profiles from Coastwise Manifests,” Explorations
in Economic History 16, pp. 363-380.

29
Sunder, Marco (2004) “The Height of Tennessee Convicts: Another Pieces of the
“Antebellum Puzzle”. Economics and Human Biology. pp. 75-86.
Tangpricha, Vin, Elizabeth Pearce, Tai Chen, and Michael Holick, 2002, “Vitamin D
Insufficiency among Free-Living Health Young Adults,” The American Journal
of Medicine v. 112, pp. 659-662.
Tanner, James M, 1977, “Human Growth and Constitution,” in Harrison, GA, Weiner,
JS, Tanner, JM, and Barnicot, NA (eds) Human Biology: an Introduction to
Human Evolution, Variation, Growth and Ecology. pp. 301-384.
Tortolani, Justin, Edward McCarthy, Paul Sponseller, 2002, “Bone Mineral Density
Deficiency in Children,” Journal of the American Academy of Orthopedic
Surgeons, 10(1) pp. 57-66.
Utterlinden, André, Yue Fang, Joyce B.J. van Meurs, Huibert A. P. Pols, Johannes P.T.M
van Leeuwen, “Genetic and Biology of Vitamin D Receptor Polymorphisms,”
Gene, 338, 2004, pp. 143-156.
Wannamethee, S. Goya, Peter Whincup, Gerald Shaper and Mary Walker, “Influence of
Father’s Social Class on Cardiovascular Disease in Middle-Aged Men,” The
Lancet, 348:9, 1996, pp.1259-63.
Wardlaw, G.M., J.S. Hampl, and R.A. Disilestro, 2004, Perspectives in Nutrition, 6th ed.,
New York: McGraw-Hill, pp. 394-397.
Xiong, E-H, F-H Xu, P-Y Liu, H Shen, J-R Long, L Elze, R R Recker and H-W Deng,
“Vitamin D Receptor Gene Polymorphisms are Linked to and Associated with
Adult Height,” Journal of Medical Genetics, 42, 2004, pp. 228-234.

30
Y-Z Liu, F-H Shen, H Deng, Y-J Liu, L-J Zhao, V Dvornyk, T Conway, J-L Li, Q-Y
Huang, K M Davies, R R Recker, and H-W Deng, “Confirmation Linkage Study
in Support of the X Chromosome Harbouring a ATL Underlying Human Height
Variation,” Journal of Medical Genetics, 40, pp. 825-831.

CESifo Working Paper Series for full list see Twww.cesifo-group.org/wp T (address: Poschingerstr. 5, 81679 Munich, Germany, [email protected])
___________________________________________________________________________ 2501 Andrew Clark, Andreas Knabe and Steffen Rätzel, Boon or Bane? Others’
Unemployment, Well-being and Job Insecurity, December 2008 2502 Lukas Menkhoff, Rafael R. Rebitzky and Michael Schröder, Heterogeneity in Exchange
Rate Expectations: Evidence on the Chartist-Fundamentalist Approach, December 2008 2503 Salvador Barrios, Harry Huizinga, Luc Laeven and Gaёtan Nicodème, International
Taxation and Multinational Firm Location Decisions, December 2008 2504 Andreas Irmen, Cross-Country Income Differences and Technology Diffusion in a
Competitive World, December 2008 2505 Wenan Fei, Claude Fluet and Harris Schlesinger, Uncertain Bequest Needs and Long-
Term Insurance Contracts, December 2008 2506 Wido Geis, Silke Uebelmesser and Martin Werding, How do Migrants Choose their
Destination Country? An Analysis of Institutional Determinants, December 2008 2507 Hiroyuki Kasahara and Katsumi Shimotsu, Sequential Estimation of Structural Models
with a Fixed Point Constraint, December 2008 2508 Barbara Hofmann, Work Incentives? Ex Post Effects of Unemployment Insurance
Sanctions – Evidence from West Germany, December 2008 2509 Louis Hotte and Stanley L. Winer, The Demands for Environmental Regulation and for
Trade in the Presence of Private Mitigation, December 2008 2510 Konstantinos Angelopoulos, Jim Malley and Apostolis Philippopoulos, Welfare
Implications of Public Education Spending Rules, December 2008 2511 Robert Orlowski and Regina T. Riphahn, The East German Wage Structure after
Transition, December 2008 2512 Michel Beine, Frédéric Docquier and Maurice Schiff, International Migration, Transfers
of Norms and Home Country Fertility, December 2008 2513 Dirk Schindler and Benjamin Weigert, Educational and Wage Risk: Social Insurance vs.
Quality of Education, December 2008 2514 Bernd Hayo and Stefan Voigt, The Relevance of Judicial Procedure for Economic
Growth, December 2008 2515 Bruno S. Frey and Susanne Neckermann, Awards in Economics – Towards a New Field
of Inquiry, January 2009

2516 Gregory Gilpin and Michael Kaganovich, The Quantity and Quality of Teachers: A
Dynamic Trade-off, January 2009 2517 Sascha O. Becker, Peter H. Egger and Valeria Merlo, How Low Business Tax Rates
Attract Multinational Headquarters: Municipality-Level Evidence from Germany, January 2009
2518 Geir H. Bjønnes, Steinar Holden, Dagfinn Rime and Haakon O.Aa. Solheim, ‚Large’ vs.
‚Small’ Players: A Closer Look at the Dynamics of Speculative Attacks, January 2009 2519 Jesus Crespo Cuaresma, Gernot Doppelhofer and Martin Feldkircher, The Determinants
of Economic Growth in European Regions, January 2009 2520 Salvador Valdés-Prieto, The 2008 Chilean Reform to First-Pillar Pensions, January
2009 2521 Geir B. Asheim and Tapan Mitra, Sustainability and Discounted Utilitarianism in
Models of Economic Growth, January 2009 2522 Etienne Farvaque and Gaёl Lagadec, Electoral Control when Policies are for Sale,
January 2009 2523 Nicholas Barr and Peter Diamond, Reforming Pensions, January 2009 2524 Eric A. Hanushek and Ludger Woessmann, Do Better Schools Lead to More Growth?
Cognitive Skills, Economic Outcomes, and Causation, January 2009 2525 Richard Arnott and Eren Inci, The Stability of Downtown Parking and Traffic
Congestion, January 2009 2526 John Whalley, Jun Yu and Shunming Zhang, Trade Retaliation in a Monetary-Trade
Model, January 2009 2527 Mathias Hoffmann and Thomas Nitschka, Securitization of Mortgage Debt, Asset Prices
and International Risk Sharing, January 2009 2528 Steven Brakman and Harry Garretsen, Trade and Geography: Paul Krugman and the
2008 Nobel Prize in Economics, January 2009 2529 Bas Jacobs, Dirk Schindler and Hongyan Yang, Optimal Taxation of Risky Human
Capital, January 2009 2530 Annette Alstadsæter and Erik Fjærli, Neutral Taxation of Shareholder Income?
Corporate Responses to an Announced Dividend Tax, January 2009 2531 Bruno S. Frey and Susanne Neckermann, Academics Appreciate Awards – A New
Aspect of Incentives in Research, January 2009 2532 Nannette Lindenberg and Frank Westermann, Common Trends and Common Cycles
among Interest Rates of the G7-Countries, January 2009

2533 Erkki Koskela and Jan König, The Role of Profit Sharing in a Dual Labour Market with
Flexible Outsourcing, January 2009 2534 Tomasz Michalak, Jacob Engwerda and Joseph Plasmans, Strategic Interactions
between Fiscal and Monetary Authorities in a Multi-Country New-Keynesian Model of a Monetary Union, January 2009
2535 Michael Overesch and Johannes Rincke, What Drives Corporate Tax Rates Down? A
Reassessment of Globalization, Tax Competition, and Dynamic Adjustment to Shocks, February 2009
2536 Xenia Matschke and Anja Schöttner, Antidumping as Strategic Trade Policy Under
Asymmetric Information, February 2009 2537 John Whalley, Weimin Zhou and Xiaopeng An, Chinese Experience with Global 3G
Standard-Setting, February 2009 2538 Claus Thustrup Kreiner and Nicolaj Verdelin, Optimal Provision of Public Goods: A
Synthesis, February 2009 2539 Jerome L. Stein, Application of Stochastic Optimal Control to Financial Market Debt
Crises, February 2009 2540 Lars P. Feld and Jost H. Heckemeyer, FDI and Taxation: A Meta-Study, February 2009 2541 Philipp C. Bauer and Regina T. Riphahn, Age at School Entry and Intergenerational
Educational Mobility, February 2009 2542 Thomas Eichner and Rüdiger Pethig, Carbon Leakage, the Green Paradox and Perfect
Future Markets, February 2009 2543 M. Hashem Pesaran, Andreas Pick and Allan Timmermann, Variable Selection and
Inference for Multi-period Forecasting Problems, February 2009 2544 Mathias Hoffmann and Iryna Shcherbakova, Consumption Risk Sharing over the
Business Cycle: the Role of Small Firms’ Access to Credit Markets, February 2009 2545 John Beirne, Guglielmo Maria Caporale, Marianne Schulze-Ghattas and Nicola
Spagnolo, Volatility Spillovers and Contagion from Mature to Emerging Stock Markets, February 2009
2546 Ali Bayar and Bram Smeets, Economic and Political Determinants of Budget Deficits in
the European Union: A Dynamic Random Coefficient Approach, February 2009 2547 Jan K. Brueckner and Anming Zhang, Airline Emission Charges: Effects on Airfares,
Service Quality, and Aircraft Design, February 2009 2548 Dolores Messer and Stefan C. Wolter, Money Matters – Evidence from a Large-Scale
Randomized Field Experiment with Vouchers for Adult Training, February 2009

2549 Johannes Rincke and Christian Traxler, Deterrence through Word of Mouth, February
2009 2550 Gabriella Legrenzi, Asymmetric and Non-Linear Adjustments in Local Fiscal Policy,
February 2009 2551 Bruno S. Frey, David A. Savage and Benno Torgler, Surviving the Titanic Disaster:
Economic, Natural and Social Determinants, February 2009 2552 Per Engström, Patrik Hesselius and Bertil Holmlund, Vacancy Referrals, Job Search,
and the Duration of Unemployment: A Randomized Experiment, February 2009 2553 Giorgio Bellettini, Carlotta Berti Ceroni and Giovanni Prarolo, Political Persistence,
Connections and Economic Growth, February 2009 2554 Steinar Holden and Fredrik Wulfsberg, Wage Rigidity, Institutions, and Inflation,
February 2009 2555 Alexander Haupt and Tim Krieger, The Role of Mobility in Tax and Subsidy
Competition, February 2009 2556 Harald Badinger and Peter Egger, Estimation of Higher-Order Spatial Autoregressive
Panel Data Error Component Models, February 2009 2557 Christian Keuschnigg, Corporate Taxation and the Welfare State, February 2009 2558 Marcel Gérard, Hubert Jayet and Sonia Paty, Tax Interactions among Belgian
Municipalities: Does Language Matter?, February 2009 2559 António Afonso and Christophe Rault, Budgetary and External Imbalances
Relationship: A Panel Data Diagnostic, February 2009 2560 Stefan Krasa and Mattias Polborn, Political Competition between Differentiated
Candidates, February 2009 2561 Carsten Hefeker, Taxation, Corruption and the Exchange Rate Regime, February 2009 2562 Jiahua Che and Gerald Willmann, The Economics of a Multilateral Investment
Agreement, February 2009 2563 Scott Alan Carson, Demographic, Residential, and Socioeconomic Effects on the
Distribution of 19th Century US White Statures, February 2009