recent developments in modeling of monitoring …jestec.taylors.edu.my/vol 7 issue 1 february...
TRANSCRIPT

Journal of Engineering Science and Technology Vol. 7, No. 1 (2012) 56 - 72 © School of Engineering, Taylor’s University
56
RECENT DEVELOPMENTS IN MODELING OF MONITORING IN THE ANAEROBIC BIOREACTOR SYSTEM
KATHERIN INDRIAWATI1, RAHMAT ANDY SAPUTRA
1,
AYMAN ABO JABAL2, TITIK BUDIATI
3, TOTOK R. BIYANTO
1,4*
1Engineering Physic Department - FTI – ITS Surabaya, Indonesia 2College of Engineering, Sudan University of Science & Technology (SUST), Sudan
3School of Industrial Technology - Universiti Sains Malaysia, Malaysia 4Universiti Teknologi PETRONAS, Malaysia
*Corresponding Author: [email protected]
Abstract
Monitoring in the anaerobic bioreactor system is requiring understanding the
occurred situation in the bioreactor process. Bioreactor is complex designed to
accelerate waste degradation by combining attributes of the aerobic and
anaerobic bioreactors involves many variables. Multivariate Statistical Process
Control (MSPC) models are a statistical solution to the problem of directly
calculating physical and biological properties of molecules from their physical
structure. QSAR model is utilized to extract information from a set of numerical
descriptors characterizing molecular structure and use this information to
develop inductively a relationship between structure and property. The goal of a
(MSPC) model is to replace the conventional methods univariate Statistical
Process Control (SPC) to analyze the state of the multivariate process of
anaerobic bioreactor. The objective of the sequential aerobic-anaerobic
treatment is to cause the rapid biodegradation of degradable waste in the aerobic
stage in order to reduce the production of organic acids in the anaerobic stage
resulting in the earlier onset of methanogenesis. The monitoring of process uses
principal component analysis (PCA) to reduce multivariate data. Further,
hotelling T² values were used to monitor the quality of the bioreactor operating
condition. Hence, fuzzy logic was used to determine the present condition of
the bioreactor based on the value of T² related. The simulation results indicate
that the offered method is able to determine four bioreactor process states, i.e.
normal, organic overload, hydraulic overload, and fluctuations in temperature,
with the success rate 100%.
Keywords: Bioreactor, Multivariate statistical process control, Principal
component analysis, Fuzzy logic.
Recent Developments of Monitoring in the Anaerobic Bioreactor System 57
Journal of Engineering Science and Technology February 2012, Vol. 7(1)
Nomenclatures
A1 Factor of input Sc variable
A2 Factor of input S2 variable
A3 Factor of input D variable
B Bicarbonate, mol/L
CO2D Dissolve carbon dioxide, mol/L
D Dilution rate, hr
H+ Hydrogen ion, mol/L
HS Acid (non ionized) form of S2 , mol/L
IC Inorganic carbon, mol/L
Ka Equilibrium constant of H+S
-, mol/L
Kb Equilibrium constant of H+B, mol/L
Kh Henry’s constant, mmol/L/Atm
KI2 Inhibition constant of substrate S2, mmol/L
KIC Inhibition constant of substrate Sc, g/L
KS2 Dissociation constant of substrate S2, mmol/L
KSc Dissociation constant of substrate Sc, g/L
N Number of data
PCO2 Partial pressure for the dissolved carbon dioxide, Atm
PR Matrix of principal component
Pt Total pressure, Atm
QCH4 Flow rate of CH4 output, L/hr
QCO2 Flow rate of CO2 output, L/hr
R1 Substrate degradation
R2 S2 production, mmol/g
R3 S2 consumption, mmol/g
R4 CO2 production by Xc, mmol/g
R5 CO2 production by X2, mmol/g
R6 CH4 production, mmol/g
S Standard deviation
S- Base (ionized) form of S2 , mol/L
S2 Fastly degradable substrate, g/L
Sc Slowly degradable substrat, g/L
SR Matrix containing R first eigen value in its diagonal
T Temperature, oC
T2 Hotelling T
2 value
tR Score space
U Unitary matrix
V Matrix containing the eigenvector
X Input data
X2 Methanogenic bacteria, g/L
Xc Acidogenic bacteria, g/L
x Mean
x% Residual
x̂ Projection matrix X
Z Total kation, mol/L
58 K. Indriawati et al.
Journal of Engineering Science and Technology February 2012, Vol. 7(1)
Subscript
C Acidogenic bacteria
I Index of batch process
In Input
J Index of measured variable
K Index of times
Max Maximum
R Number of principal component
0 Initial condition
2 Methanogenic bacteria
Greek Symbols
θ Activation energy, kJ/mol
λ Coefficient of gaseous carbon dioxide
µ2 Specific growth rate of methanogenic bacteria, 1/hr
µχ Specific growth rate of acidogenic bacteria, 1/hr
Σ Diagonal matrix containing the nonnegative square roots of the
Eigen values of xTx, ordered from the largest to the smallest
1. Introduction
A bioreactor is a container in which is carried out a chemical process which
involves organisms or biochemically active derivative substances from such
organisms. Bioreactors are frequently cylindrical, ranging in size from several
liter to cube meters, and are often made of stainless steel.
Bioreactor design is fairly a complex engineering mission. Under optimum
conditions, the microorganisms or cells will reproduce at surprising rate. The
container's environmental conditions like gas (i.e., air, oxygen, nitrogen, carbon
dioxide) flow rates, temperature, pH and dissolved oxygen levels, and agitation
speed require monitoring and controlling. A single bioreactor manufacturer,
Broadly-James Corporation, uses vessels, sensors, controllers, and a control
system, digitally networked together for their bioreactor scheme.
Continuous flow stirred tank reactors in the continuous flow, stirred tank
reactor (CSTR) fresh medium was feed into the bioreactor at a constant rate, and
medium mixed with cells leaves the bioreactor at the same rate. A fixed
bioreactor volume is maintained and ideally, the effluent stream should have the
same composition as the bioreactor contents. The culture is fed with fresh
medium containing one and sometimes two growth limiting nutrients such as
glucose. The concentration of the cells in the bioreactor is controlled by the
concentration of the growth-limiting nutrient. A steady state cell concentration is
reached where the cell density and substrate concentration are constant. The cell
growth rate, µ , is controlled by the dilution rate, D, of growth limiting nutrient.
Cell culture bioreactors classified into two types, those that utilized for
cultivation of anchorage dependent cells (e.g., primary cultures derived from
normal tissues and diploid cell lines. Those that used for the cultivation of
suspended mammalian cells (e.g., cell lines derived from cancerous tissues and
tumors, transformed diploid cell lines, hybridomas). In some cases, the bioreactor
Recent Developments of Monitoring in the Anaerobic Bioreactor System 59
Journal of Engineering Science and Technology February 2012, Vol. 7(1)
may be modified to grow both anchorage dependent and suspended cells. Ideally,
any cell culture bioreactor must maintain a sterile culture of cells in medium
conditions, which maximize cell growth and productivity.
Anaerobic wastewater treatment systems generally use the anaerobic
bioreactor. In this bioreactor occurred biological process that converts the
substrate or organic waste into methane (CH4) and carbon dioxide CO2 by
utilizing the activity of microorganisms in the environment without air
(anaerobic). Microorganisms can grow by consuming the available nutrients or
substrate on support environmental conditions.
Determination of optimal substrate feed rate is a problem in singular control,
so called because the control variable appears linearly both in the dynamic
equations describing the process and/or in the performance index which is to be
optimized. In many industrially important fermentation processes,
microorganisms require more than one substrate for their growth and product
formation [1]. It has long been realized that the production of antibiotics and
enzymes requires precise control of the nitrogen source in addition to the carbon
source. The production of a desired chemical from recombinant cell cultures often
involves addition of either an inducer or repressor along with the primary growth-
limiting nutrient. The optimization problem for such processes involves the
determination of the optimal feed rates of two nutrients: either two growth-
limiting substrates such as carbon and nitrogen or one growth-limiting substrate
and an inducer or a repressor. The feed rate optimization of fed-batch bioreactors
involving multiple singular control variables is a numerically difficult problem.
Bioreactor is extremely vulnerable to fluctuations in the substrate, temperature
and pH [2]. Those variables affect the viability of microorganisms. When these
variables are not maintained, they will result in death of microorganisms and
further microorganisms in the reactor will totally dead. This event is called
washout and recovery time for this event requires a long time. Hence, a
monitoring system is required to give information about the state of the process
and about the process behaviour. Then, based on that information, further
handling or action can be taken to ensure optimal running of the plant.
Anaerobic bioreactor is a complex process therefore; it involves multiple
process variables, including physical and chemical variables. Due to the number
of variables, it will be difficult to design a control or monitoring system for the
process. To solve this problem, it can be used the Multivariate Statistical Process
Control (MSPC) method. MSPC changes multidimensional information into a
number of latent variables that explain the variability of the measured variable,
including the relations between measured variables. MSPC makes use of
statistical methods to analyze, control and influence improvement on process
performance based on the existing multivariable.
Reducing multivariable to a few main variables can be done by using the
Principle Component Analysis (PCA) [3]. The use of PCA to diagnose the
condition and behaviour of an anaerobic bioreactor has been reported by Olson
[4] for a batch system. However, the latent variable acquired from PCA cannot
explain the condition of the ongoing process. This can cause difficulties for
operators to interpret them into physical forms. Therefore, to interpret these new
variables and to classify the current condition of the process, an algorithm for
decision-making is required.
60 K. Indriawati et al.
Journal of Engineering Science and Technology February 2012, Vol. 7(1)
Marco S. R. et al. [5] presented an approach for conducting multivariate
statistical process control (MSPC) in noisy environments, i.e., when the signal to
noise ratio is low, and, furthermore, noise standard deviation (uncertainty)
affecting every collected value can vary over time, and is assumingly known. This
approach is based upon a latent variable model structure, HLV (standing for
heteroscedastic latent variable model), that explicitly integrates information
regarding data uncertainty. Reasonable amounts of missing data can also be
handled in a coherent and fully integrated way through HLV. Various examples
exhibit the added value achieved under noisy conditions by adopting such an
approach and a case study illustrates its application to a real industrial context of
pulp and paper product quality data analysis.
The use of fuzzy as decision makers has been conducted by the researchers.
Murnleitner et al. [6] used a fuzzy logic system in order to predict the biological
state of the reactors. Carrasco et al. [7] have developed a diagnosis system based
fuzzy logic for the determination of acidification states on an anaerobic
wastewater treatment plants. In this paper, monitoring system algorithm based on
fuzzy assisted multivariate statistical process control for oxidation ditch has
developed. However, PCA was applied statically in the data matrix X, since it
was assumed there was no correlation over time. When this is the case the exact
relations between the variables will not be revealed. In this paper, the algorithm
was refined to handle this dynamic PCA for continuous process and was applied
to a plant bioreactor by a simulation.
2. Anaerobic Bioreactor Model
Substrate of organic waste is very complex, so it is impossible to include the
overall organic material conditions into a model. But there are approaches that
can be used to anticipate the complex nature of the substrate, i.e., by representing
them into two groups, namely the equivalent glucose substrate (Glucose, Sc) and
the equivalent acetic acid substrate (acetate, S2) [2].
The choice of the number of considered bacterial populations involved in the
anaerobic bioreactor process directly linked to the model complexity. Since the
objective is to obtain a model that would be able to represent the destabilization
phenomenon while being identifiable, it is assumed that bacterial population can be
divided into two main groups of homogeneous characteristics and that the anaerobic
digestion can be described by a two stage process. In the first step (acidogenesis),
the acidogenic bacteria (Xc) consume the organic substrate Sc and produce inorganic
carbon (IC) and acetic acid (S2) with the specific growth rate µc. The population of
methanogenic bacteria (X2) uses in a second step acetic acid (S2) as substrate for
growth and produce dissolved inorganic carbon (IC) and methane (CH4). Substrate
S2 is a weak acid dispatched between HS (acid form) and S− (base form). It is
important to notice that HS excess inhibits the growth rates µ2.
The inorganic carbon IC is made up of dissolved inorganic carbon, which is,
dispatched between the bicarbonate base form (B) and the dissolved carbon
dioxide acid form (CO2), following an equilibrium function on the pH. Gaseous
carbon dioxide (CO2) was, transferred in the gas phase from dissolved CO2. The
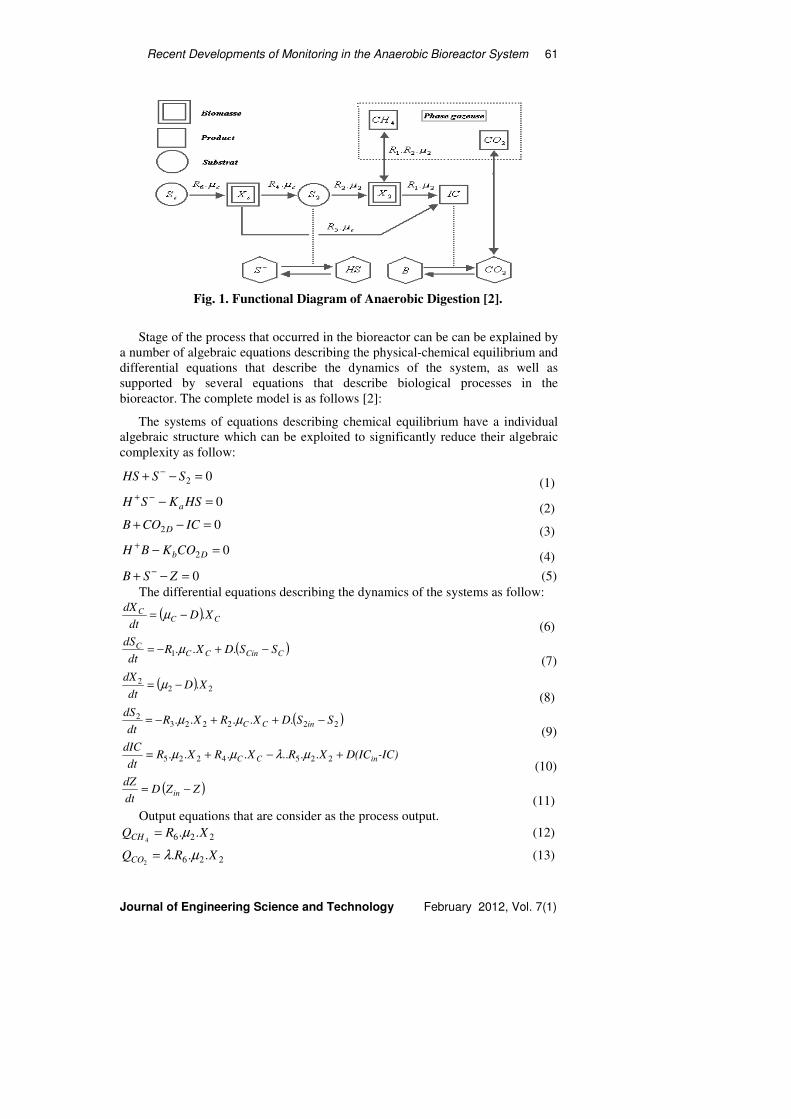
simplified functional diagram of anaerobic bioreactor process is shown in Fig. 1.
Recent Developments of Monitoring in the Anaerobic Bioreactor System 61
Journal of Engineering Science and Technology February 2012, Vol. 7(1)
Fig. 1. Functional Diagram of Anaerobic Digestion [2].
Stage of the process that occurred in the bioreactor can be can be explained by
a number of algebraic equations describing the physical-chemical equilibrium and
differential equations that describe the dynamics of the system, as well as
supported by several equations that describe biological processes in the
bioreactor. The complete model is as follows [2]:
The systems of equations describing chemical equilibrium have a individual
algebraic structure which can be exploited to significantly reduce their algebraic
complexity as follow:
02 =−+ − SSHS (1)
0=−−+ HSKSH a (2)
02 =−+ ICCOB D (3)
02 =−+DbCOKBH
(4)
0=−+ − ZSB (5)
The differential equations describing the dynamics of the systems as follow:
( ) CCC XD
dt
dX.−= µ
(6)
( )CCinCCC SSDXR
dt
dS−+−= ...1 µ
(7)
( ) 222 .XD
dt
dX−= µ
(8)
( )2222232 ..... SSDXRXR
dt
dSinCC −++−= µµ
(9)
-IC)D(ICXRXRXRdt
dICinCC +−+= 2254225 ........ µλµµ
(10)
( )ZZDdt
dZin −=
(11)
Output equations that are consider as the process output.
226 ..4
XRQCH µ= (12)
226 ...2
XRQCO µλ= (13)
62 K. Indriawati et al.
Journal of Engineering Science and Technology February 2012, Vol. 7(1)
with
h
DCO
K
COP 2
2= (14)
2
2
COt
CO
PP
P
−=λ (15)
2
2max2
2
2
.
IS
K
HSHSK
HS
++
=µ
µ (16)
IC
CCS
CCC
K
HSSSK
S
C
.
.max
++
=µ
µ (17)
where: R1, R2, R3, R4, R5, and R6 are the yield coefficients. µ1 and µ2 are the
Haldane growth rates. λ is a coefficient for gaseous carbon dioxide. D is dilution
rate. KIC stands for the inhibition constant for substrate Sc, KI2 stands for the
inhibition constant for substrate S2, KSc stands for the dissociation constant for
substrate Sc and inorganic carbon, KS2 stands for the dissociation constant for
substrate S2 and others acids, Kh stands for an equivalent of the Henry constant,
PCO2 stands for the partial pressure for the dissolved carbon dioxide and Pt stands
for the atmospheric pressure.
While the relationship between growth rate and temperature can be explained
by the formulas from Arhenius, as follows [8]:
=
−T
CC
c
e
θ
µµ 0,max
(18)
=
−Te
2
0,2max2
θ
µµ
(19)
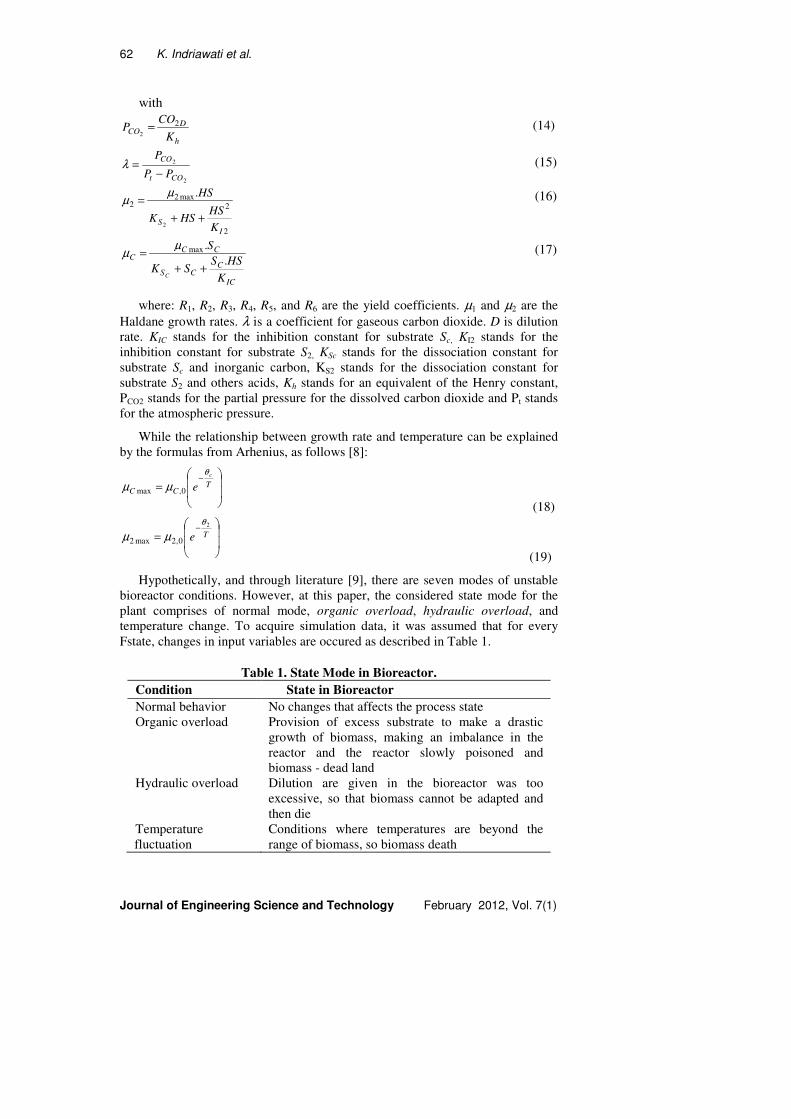
Hypothetically, and through literature [9], there are seven modes of unstable
bioreactor conditions. However, at this paper, the considered state mode for the
plant comprises of normal mode, organic overload, hydraulic overload, and
temperature change. To acquire simulation data, it was assumed that for every
Fstate, changes in input variables are occured as described in Table 1.
Table 1. State Mode in Bioreactor.
Condition State in Bioreactor
Normal behavior No changes that affects the process state
Organic overload Provision of excess substrate to make a drastic
growth of biomass, making an imbalance in the
reactor and the reactor slowly poisoned and
biomass - dead land
Hydraulic overload Dilution are given in the bioreactor was too
excessive, so that biomass cannot be adapted and
then die
Temperature
fluctuation
Conditions where temperatures are beyond the
range of biomass, so biomass death
Recent Developments of Monitoring in the Anaerobic Bioreactor System 63
Journal of Engineering Science and Technology February 2012, Vol. 7(1)
3. Monitoring System Design
The design of monitoring system based MSPC are mentioned in the following section:
• Multiway PCA Implementation
Principal Component Analysis (PCA) is one of MSPC methods, which are usually
applies to analyze a set of variables. The purpose of PCA is to reduce data
dimension by finding a new variables (called as principal components) which is a
linear combination of the original set of variables so that the variation of the new
components became maximum and the new components became independent to
each other. There are some PCA methods that have been developed, and for the
monitoring system design in this paper, the applied method is multi-way principal
component analysis (MPCA).
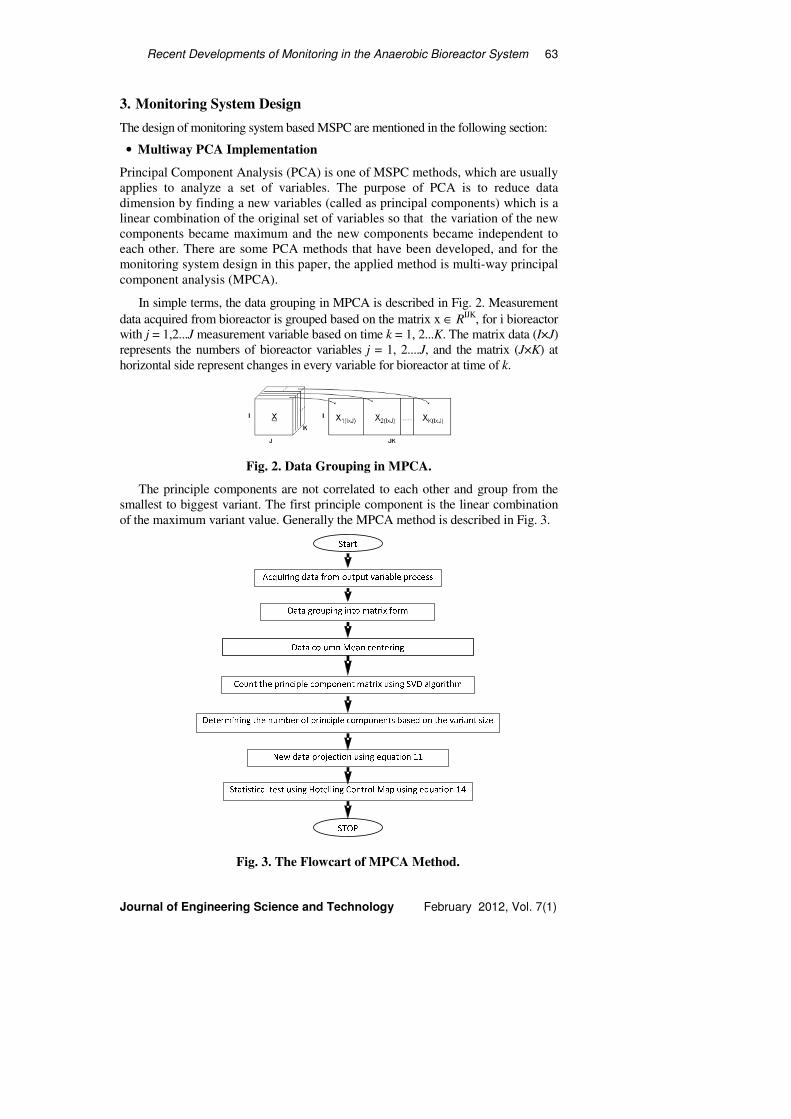
In simple terms, the data grouping in MPCA is described in Fig. 2. Measurement
data acquired from bioreactor is grouped based on the matrix x ∈ RIJK
, for i bioreactor
with j = 1,2...J measurement variable based on time k = 1, 2...K. The matrix data (I×J)
represents the numbers of bioreactor variables j = 1, 2....J, and the matrix (J×K) at
horizontal side represent changes in every variable for bioreactor at time of k.
Fig. 2. Data Grouping in MPCA.
The principle components are not correlated to each other and group from the
smallest to biggest variant. The first principle component is the linear combination
of the maximum variant value. Generally the MPCA method is described in Fig. 3.
Fig. 3. The Flowcart of MPCA Method.
64 K. Indriawati et al.
Journal of Engineering Science and Technology February 2012, Vol. 7(1)
In MPCA, the data must be changed into 2 dimensional form. From the
simulation result of the bioreactor model, a three dimensional data is acquired
(i,j,k) for i bioreactor, j measurement variable, and k time. Then they are grouped
into a (ij×k) matrix form. For the case in this paper, i = 1 and k = 1500 with
sampling time of 1 hour. j is the number of variables (pH, flow rate of CH4, and
temperature). Mean of each variable can be determine as:
∑=
=n
k
kj xn
x1
1 (20)
and the standard deviation is:
( )∑=
−−
=n
k
jkjj xxn
s1
2
1
1 (21)
The principal compo
Principle components can be calculated directly or, more commonly, after
different centering and scaling operations on the data matrix x according to:
s
xx jj −
One of the techniques to find principle components are Singular Value
Decomposition (SVD) algorithm, where the matrix for principle components and
it's variations could be find directly. In singular value decomposition, SVD, the
matrix x is decomposed according to:
TVUx Σ= (22)
which U is a matrix (k×j), V is a matrix (j×j), T is transpose matrix operator
and Σ is a diagonal matrix (k×j) containing the eigenvalue of covariance matrix x,
i.e., σ on the diagonal. The largest singular value (σ) in column of matrix V, (p1),
determines the direction of the first principal component, and the second largest
singular value (σ) in column of matrix V, (p2), determines the direction of the
second principal component, and so on.
Each observation in time ( ) JRkx ∈ of the variables is projected on to the score
space tR(k), by multiplying x(k) with matrix of principal components PRT
, with R
is the number of principal components in the model, and it is defined as:
( ) ( )kxP=kt TRR (23)
A new matrix projection is acquired and giving the residual
( ) ( )ktP=kx RR (24)
( ) ( ) ( )kxkx=kx ˆ~ − (25)
To determine if the value of principle component stays within the limit, a
statistical test Hotelling T² control map is used to check whether the process is in
controlled state. The statistical test used is:
( ) ( )kRRR tSt=kT12 − (26)
which RR
R RS×∈ is the matrix containing R first eigenvector.

Recent Developments of Monitoring in the Anaerobic Bioreactor System 65
Journal of Engineering Science and Technology February 2012, Vol. 7(1)
• Determining State Mode Using Fuzzy
From the hotelling T² control chart, it can be acquired the data of the deviation
value in every state, by finding the mean and deviation from the T2 value. Then,
those values are used to build a membership function for the input of fuzzy
(takagi sugeno).
The fuzzy rule for determining bioreactor condition is:
If (input 1 is state 1) then (output is state 1)
4. Results and Discussion
• Model Response for Some State Mode
From the SVD result, the variation of the principle components matrix (3x3) is:
a) First principal component = 96.58% of variation
b) Second principal component = 3.41% of variation
c) Third principal component = 0.0001% of variation
Principle Components analysis shows that the first principle components has the
biggest variation so it can be picked to be used in finding the original data projection.
For the normal condition of bioreactor, the variable input is listed in Table 2.
There was no change in Sc (10 gr/L) and D (0.00277778 h-1
) for over time of
simulation. While the value of S2 changed to be two times of initial value at the
specific step time (from 0.07 mol/L to be 0.21 mol/L). The respond of simulator
is shown in Fig. 4.
Table 2. Input Variables for Normal State Plant.
Input Variable Value
A1 (Sc) 0
A2 (S2) 2
A3 (D) 0
T (temperature) 30±1○C
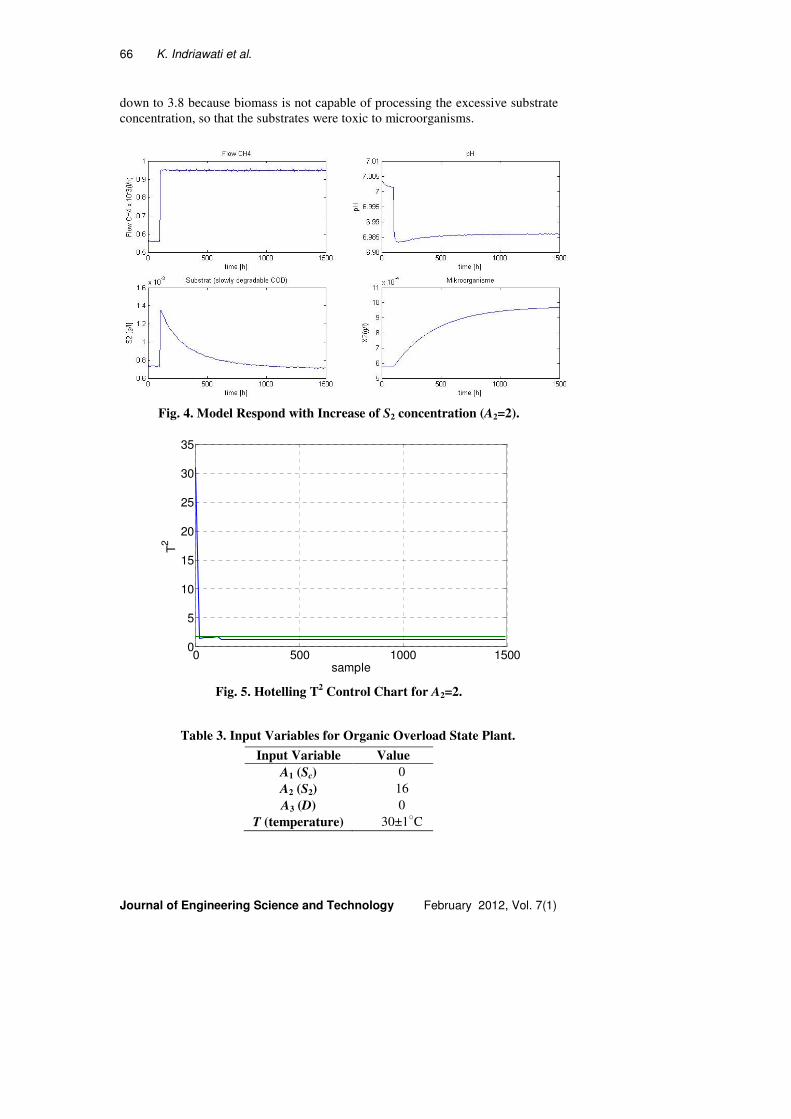
By looking at the Fig. 4 can be concluded that the increasing of S2
concentration still result normal condition of the bioreactor. The substrate
processed properly by the biomass, which marked by growing biomass and the
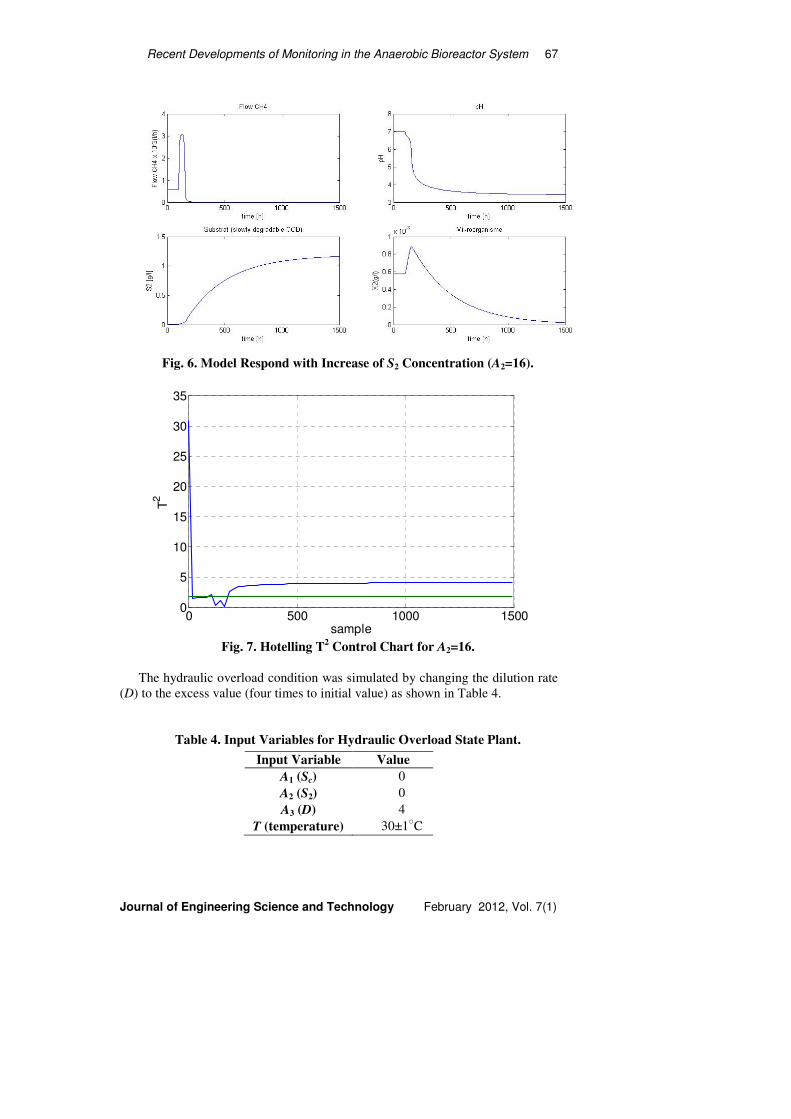
reduction in COD. In Fig. 5 is shows the Hotelling control chart of this
simulation. The value of T2 is never increase above upper control limit (UCL) of
the control chart.
To obtain the organic overload condition, the thing to do is add the
concentrations of the substrate which was represented by the larger change of S2
(become sixteen times of initial value, see Table 3), as one cause of excessive
substrate concentration [9]. The respond of simulator and the hotelling T2 control
chart for this case as shown in Figs. 6 and 7 respectively. From this, it can be
concluded that the bioreactor did not produce methane anymore and pH values
66 K. Indriawati et al.
Journal of Engineering Science and Technology February 2012, Vol. 7(1)
down to 3.8 because biomass is not capable of processing the excessive substrate
concentration, so that the substrates were toxic to microorganisms.
Fig. 4. Model Respond with Increase of S2 concentration (A2=2).
0 500 1000 15000
5
10
15
20
25
30
35
T2
sample
Fig. 5. Hotelling T2 Control Chart for A2=2.
Table 3. Input Variables for Organic Overload State Plant.
Input Variable Value
A1 (Sc) 0
A2 (S2) 16
A3 (D) 0
T (temperature) 30±1○C
Recent Developments of Monitoring in the Anaerobic Bioreactor System 67
Journal of Engineering Science and Technology February 2012, Vol. 7(1)
Fig. 6. Model Respond with Increase of S2 Concentration (A2=16).
0 500 1000 15000
5
10
15
20
25
30
35
T2
sample Fig. 7. Hotelling T
2 Control Chart for A2=16.
The hydraulic overload condition was simulated by changing the dilution rate
(D) to the excess value (four times to initial value) as shown in Table 4.
Table 4. Input Variables for Hydraulic Overload State Plant.
Input Variable Value
A1 (Sc) 0
A2 (S2) 0
A3 (D) 4
T (temperature) 30±1○C

68 K. Indriawati et al.
Journal of Engineering Science and Technology February 2012, Vol. 7(1)
The respond of the simulator for this case is the same with one for the organic
overload case, as shown in Fig. 8. The T2 values are above the upper control limit
of the hotelling T² control chart, as shown in Fig. 9. The same result is obtained
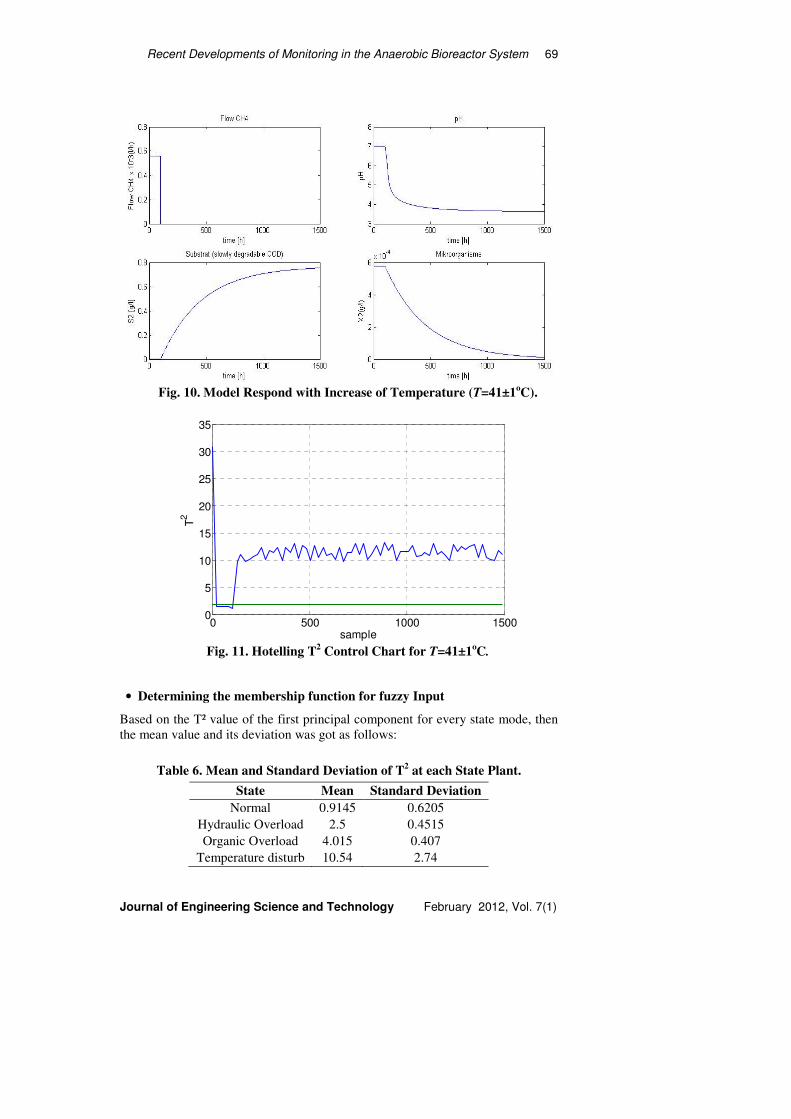
for the temperature change case described in Table 5 (from 30±1○C to be
41±1○C), as shown in Figs. 10 and 11 for the respond and the hotelling T² control
chart respectively.
Fig. 8. Model Respond with Increase of Dilution Rate (A3=4).
0 500 1000 15000
5
10
15
20
25
30
35
T2
sample Fig. 9. Hotelling T
2 Control Chart for A3=4.
Table 5. Input Variables for Temperature Fluctuation State Plant.
Input Variable Value
A1 (Sc) 0
A2 (S2) 10
A3 (D) 4
T (temperature) 41±1○C
Recent Developments of Monitoring in the Anaerobic Bioreactor System 69
Journal of Engineering Science and Technology February 2012, Vol. 7(1)
Fig. 10. Model Respond with Increase of Temperature (T=41±1
oC).
0 500 1000 15000
5
10
15
20
25
30
35
T2
sample Fig. 11. Hotelling T
2 Control Chart for T=41±1
oC.
• Determining the membership function for fuzzy Input
Based on the T² value of the first principal component for every state mode, then
the mean value and its deviation was got as follows:
Table 6. Mean and Standard Deviation of T2 at each State Plant.
State Mean Standard Deviation
Normal 0.9145 0.6205
Hydraulic Overload 2.5 0.4515
Organic Overload 4.015 0.407
Temperature disturb 10.54 2.74
70 K. Indriawati et al.
Journal of Engineering Science and Technology February 2012, Vol. 7(1)
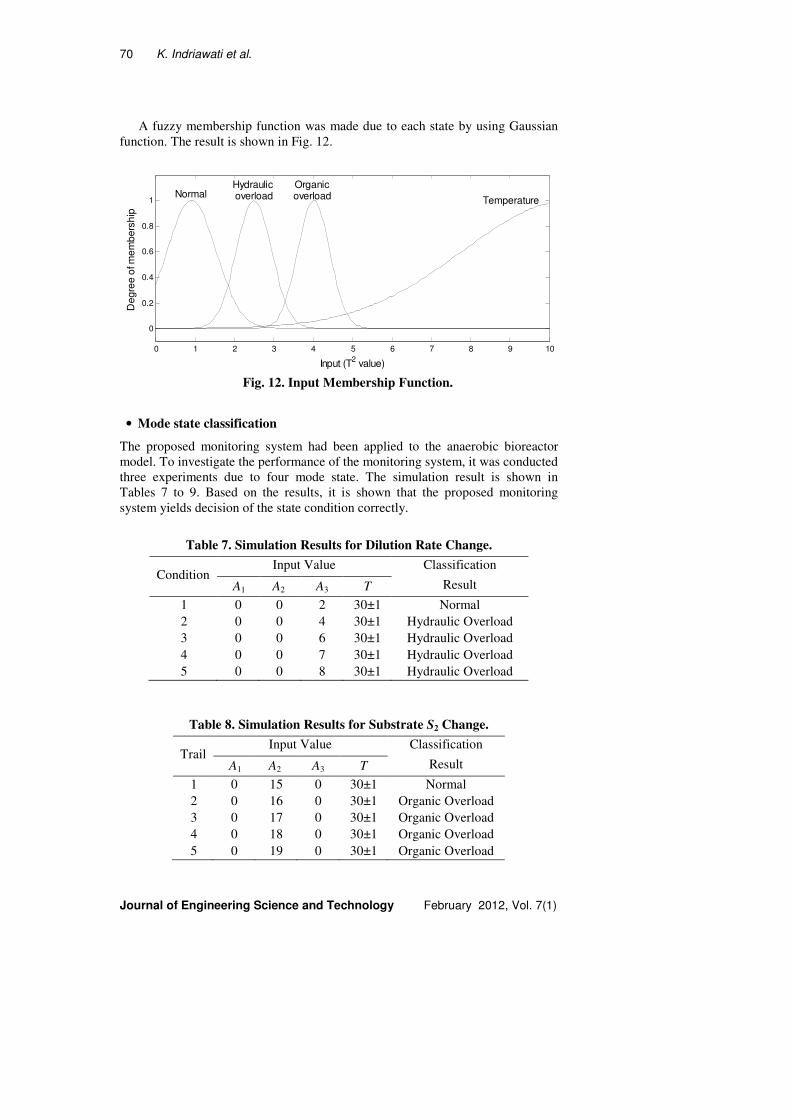
A fuzzy membership function was made due to each state by using Gaussian
function. The result is shown in Fig. 12.
0 1 2 3 4 5 6 7 8 9 10
0
0.2
0.4
0.6
0.8
1
Input (T2 value)
De
gre
e o
f m
em
bers
hip
NormalOrganicoverload
Hydraulic overload Temperature
Fig. 12. Input Membership Function.
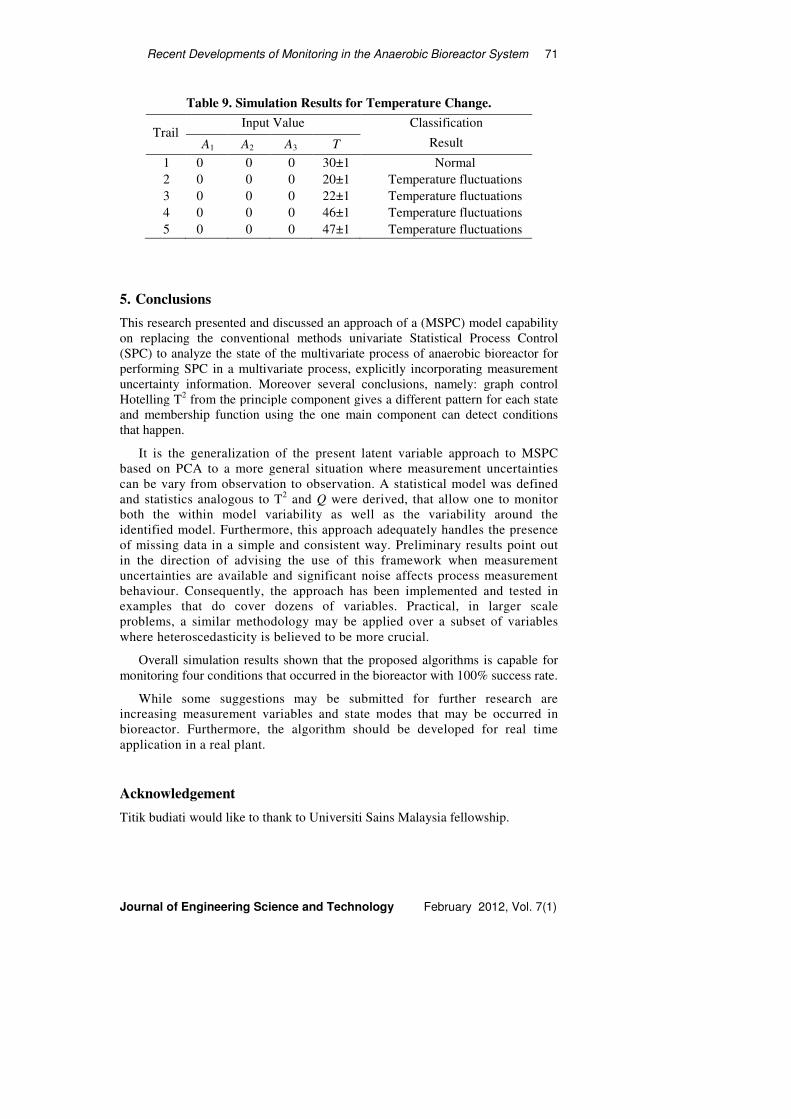
• Mode state classification
The proposed monitoring system had been applied to the anaerobic bioreactor
model. To investigate the performance of the monitoring system, it was conducted
three experiments due to four mode state. The simulation result is shown in
Tables 7 to 9. Based on the results, it is shown that the proposed monitoring
system yields decision of the state condition correctly.
Table 7. Simulation Results for Dilution Rate Change.
Condition Input Value Classification
A1 A2 A3 T Result
1 0 0 2 30±1 Normal
2 0 0 4 30±1 Hydraulic Overload
3 0 0 6 30±1 Hydraulic Overload
4 0 0 7 30±1 Hydraulic Overload
5 0 0 8 30±1 Hydraulic Overload
Table 8. Simulation Results for Substrate S2 Change.
Trail Input Value Classification
A1 A2 A3 T Result
1 0 15 0 30±1 Normal
2 0 16 0 30±1 Organic Overload
3 0 17 0 30±1 Organic Overload
4 0 18 0 30±1 Organic Overload
5 0 19 0 30±1 Organic Overload
Recent Developments of Monitoring in the Anaerobic Bioreactor System 71
Journal of Engineering Science and Technology February 2012, Vol. 7(1)
Table 9. Simulation Results for Temperature Change.
Trail Input Value Classification
A1 A2 A3 T Result
1 0 0 0 30±1 Normal
2 0 0 0 20±1 Temperature fluctuations
3 0 0 0 22±1 Temperature fluctuations
4 0 0 0 46±1 Temperature fluctuations
5 0 0 0 47±1 Temperature fluctuations
5. Conclusions
This research presented and discussed an approach of a (MSPC) model capability
on replacing the conventional methods univariate Statistical Process Control
(SPC) to analyze the state of the multivariate process of anaerobic bioreactor for
performing SPC in a multivariate process, explicitly incorporating measurement
uncertainty information. Moreover several conclusions, namely: graph control
Hotelling T2 from the principle component gives a different pattern for each state
and membership function using the one main component can detect conditions
that happen.
It is the generalization of the present latent variable approach to MSPC
based on PCA to a more general situation where measurement uncertainties
can be vary from observation to observation. A statistical model was defined
and statistics analogous to T2 and Q were derived, that allow one to monitor
both the within model variability as well as the variability around the
identified model. Furthermore, this approach adequately handles the presence
of missing data in a simple and consistent way. Preliminary results point out
in the direction of advising the use of this framework when measurement
uncertainties are available and significant noise affects process measurement
behaviour. Consequently, the approach has been implemented and tested in
examples that do cover dozens of variables. Practical, in larger scale
problems, a similar methodology may be applied over a subset of variables
where heteroscedasticity is believed to be more crucial.
Overall simulation results shown that the proposed algorithms is capable for
monitoring four conditions that occurred in the bioreactor with 100% success rate.
While some suggestions may be submitted for further research are
increasing measurement variables and state modes that may be occurred in
bioreactor. Furthermore, the algorithm should be developed for real time
application in a real plant.
Acknowledgement
Titik budiati would like to thank to Universiti Sains Malaysia fellowship.

72 K. Indriawati et al.
Journal of Engineering Science and Technology February 2012, Vol. 7(1)
References
1. Sarkar, D.; and Modak, J.M. (2004). Optimization of fed-batch bioreactors
using genetic algorithm: multiple control variables. Computers and Chemical
Engineering, 28(5), 789-798.
2. Carlos-Hernandez, S.; Sanchez, E.N.; and Béteau, J.F. (2009). Fuzzy
observers for anaerobic WWTP: Development and implementation. Control
Engineering Practice, 17(6), 690-702.
3. Lowry C.A.; and Montgomery, D.C. (1995). A review of multivariate
control charts. IIE Transactions, 27(6), 800-810.
4. Olsen, G.J.; Lane, D.J.; Giovannoni, S.J.; Pace, N.R.; and Stahl, D.A. (1986).
Microbial ecology and evolution: aribosomal RNA approach. Annual Review
Microbiology, 40, 337-365.
5. Reis, M.S.; and Saraiva, P.M. (2006). Heteroscedastic latent variable
modelling with applications to multivariate statistical process control.
Chemometrics and Intelligent Laboratory Systems, 80(1), 57-66.
6. Murnleitner, E.; Becker, T.M.; and Delgado, A. (2002). State detection and
control of overloads in the anaerobic wastewater treatment using fuzzy logic.
Water Research, 36(1), 201-211.
7. Carrasco, E.F.; Rodríguez, J.; Puñal, A.; Roca E.; and Lema, J.M. (2004).
Diagnosis of acidification states in an anaerobic wastewater treatment plant using
a fuzzy-based expert system. Control Engineering Practice, 12(1), 59-64.
8. Femat, R.; Mendez-Acosta, H.O.; Steyer, J.P.; and Gonzalez-Alvarez, V.
(2004). Temperature oscillations in a biological reactor with recycle. Chaos,
Solitons and Fractals, 19(4), 875-889.
9. Bitton, G. (2005). Wastewater Microbiology, (3rd
Ed.). John Willey & Sons
Inc, New York.