recal: intercoder reliability calculation as a web … · recal: intercoder reliability calculation...
TRANSCRIPT

International Journal of Internet Science 2010, 5 (1), 20–33 ISSN 1662-5544
IJIS.NET
ReCal: Intercoder Reliability Calculation as a Web Service
Deen G. Freelon
University of Washington, Seattle, USA
Abstract: Despite the fact that intercoder reliability is an indispensable validity criterion for studies that employ content analysis, currently available options for calculating it are sharply limited both in terms of the number of coefficients they offer and the range of operating systems they support. This paper introduces ReCal, an online intercoder reliability Web service that addresses both of these limitations by offering multiple coefficients for nominal-level data and by functioning through any Web browser regardless of OS. After describing the program’s functions, its accuracy is demonstrated through a set of worked examples and a systematic comparison of its results to those of alternative reliability calculators. Finally, ReCal’s usage statistics are briefly presented. Keywords: Intercoder, interrater, interjudge, reliability, Web service, online software, Krippendorff’s alpha, nominal data Introduction Intercoder (or interrater) reliability, defined as “the extent to which independent coders evaluate a characteristic of a message or artifact and reach the same conclusion” (Lombard, Synder-Duch, & Bracken, 2002, p. 589), is an essential criterion for validating subjectively-coded data that is assessed widely throughout the social and medical sciences1. In mass communication research and other social science disciplines, intercoder reliability is often deployed as a component of content analysis, a standard method of summarizing the substance of a set of mediated messages. In this context, it assesses the degree to which two or more judges agree on their evaluations of a group of messages. In medicine intercoder reliability is often used to validate diagnostic and etiological classification systems for diseases and other medical conditions (Altman, 1991; Fayers & Hays, 2005; Houser & Bokovoy, 2006; Machin & Campbell, 2005); for obvious reasons, it is critical to refine these criteria so that they are as consistent as possible between doctors. Intercoder reliability is used in other scholarly fields as well, and though compiling an exhaustive list thereof would be prohibitively difficult, in general the concept applies to any research that relies upon the subjective judgments of multiple trained coders. Usage differences between scientific disciplines notwithstanding, intercoder reliability is a highly recommended (though by no means universally employed) methodological bulwark against measurement error and incoherent operational definitions in textual analysis (Hayes & Krippendorff, 2007; Lombard et al., 2002; Neuendorf, 2002).
Address correspondence to Deen G. Freelon, Department of Communication, University of Washington, Seattle, USA, P.O. Box 353740, Seattle, WA 98195-3740, USA, Phone: (+1) 919 641 0442, [email protected] 1Advanced Google Scholar searches conducted on March 25, 2010 for the term interrater reliability within the subject areas “Business, Administration, Finance, and Economics”, “Medicine, Pharmacology, and Veterinary Science”, and “Social Sciences, Arts, and Humanities” returned 19,400, 50,500, and 158,000 results respectively.
D. G. Freelon / International Journal of Internet Science 5 (1), 20–33
21
In spite of its broad range of scholarly uses, intercoder reliability for nominal-level data is not comprehensively supported among the major research-grade statistical programs. SPSS, SAS, and STATA each computes only one nominal reliability coefficient – Cohen’s κ – but the former two only do so for data sets that meet certain narrow requirements. In response to these often crippling limitations (not to mention the significant expense associated with maintaining proprietary software licenses), independent programmers have made available free applications that compute various intercoder reliability coefficients. These take a number of forms, including small downloadable programs; user-created scripts for use within SPSS, STATA, and the like; and Web services with no system requirements other than Internet access. But these solutions suffer from their own drawbacks, two of the most prominent of which are operating system specificity and a limited number of available coefficients. This article describes a new Web service for calculating intercoder reliability that improves in these areas, among others. This online application, called ReCal (Reliability Calculator, available at http://www. dfreelon.org/utils/recalfront/), is operating system-independent, general in its data specification, and offers more reliability coefficients than any of its Web-based peers. Its functionality has been tested across an international range of computer configurations, and it has been successfully executed by hundreds of unique users since its public launch in early October 2008. In the following sections, I attempt to situate ReCal among its competitors, demonstrate the accuracy and reliability of its results, and present data on its usage to date. I begin by reviewing in greater detail currently available options for intercoder reliability computation and the various disadvantages that limit them. Next, I describe ReCal’s program functions, explain how it improves upon prior approaches, and offer evidence of the veracity of its output. Finally, I explore who has been using ReCal (by nation and by institutional affiliation) and how frequently it has been used (by both total number of program executions and number of unique users) using data collected through the Google Analytics service (2010). Intercoder reliability and the applications that calculate it Before examining the advantages and disadvantages of the available software options for calculating intercoder reliability, it is necessary to review certain of its characteristics in greater detail. For any given variable that has been assessed by multiple independent coders, a number of distinct coefficients can be calculated to summarize the level of reliability they attained. Each coefficient is defined by a different mathematical formula, the simplest being the number of instances in which two coders agreed divided by the total number of units of analysis. When multiplied by 100, this formula produces the intercoder reliability statistic known as percent agreement, which is valid only for nominal (categorical) data. Though percent agreement is relatively easy to compute and interpret, it does not correct for chance agreement between coders and is thus overly liberal in most cases (Lombard et al., 2002; Neuendorf, 2002). Widely used alternatives such as Scott’s π, Cohen’s κ, and Krippendorff’s α are both more conservative and more computationally complex due to the mathematical corrections for chance agreement integrated into their formulae. For this reason they are generally considered by most authorities on the subject to be superior to percent agreement as indices of intercoder reliability (Krippendorff, 2004; Lombard et al., 2002; Neuendorf, 2002). Researchers who require estimates of intercoder reliability often use specialized software to perform the necessary calculations. The applications from which they can choose can be divided into two broad categories: programs and Web services (Reips & Lengler, 2005). Because programs must be installed manually on the user’s computer, they often impose very specific system requirements such as particular operating system versions, hardware specifications, and software frameworks (e.g. DirectX, Java Runtime Environment, etc.). While one key advantage of programs is that they do not require an Internet connection to function, many only support a narrow range of operating systems and hardware configurations. In contrast, Web services are always-on, server-mounted applications that usually function through a Web browser, rendering many of them completely platform-independent. They can be executed from any Internet-connected computer that meets the service’s typically minimal browser requirements. Since no software installation is required, work can be done from shared computers and even from some mobile devices. While most of the widely-used applications in the social sciences are programs (e.g. SPSS and STATA for statistics; Atlas.ti for qualitative textual analysis; LaTeX for document preparation), scholarly Web services are increasing in both number and prominence. The Research Randomizer (Urbaniak & Plous, 2010) liberates social scientists from the limitations of random number tables and allows them to generate as many number sets as they need. Reips and Lengler’s (2005) Web Experiment List provides both an archive of completed online experimental studies for researchers to use as examples and broadens participant pools far beyond the geographical limitations of offline experimental research. Iyengar (2001) has long advocated the use of Web service technology to generate representative survey samples that are equal in validity to those compiled through random-digit telephone dialing. In the domain of textual analysis, the Public Comment Analysis Toolkit (Lu &
D. G. Freelon / International Journal of Internet Science 5 (1), 20–33
22
Shulman, 2008), the Context Miner (Shah & Marchionini, 2007), and the Internet Community Text Analyzer (Gruzd, 2009) all improve upon existing techniques by providing for the direct importation, annotation, and analysis of Web texts. The foregoing brief review is not intended to serve as an exhaustive list of scholarly Web services, but rather as a small sample that demonstrates some of the ways in which Web services are generating new research possibilities. ReCal is not the first application to apply the Web service concept to intercoder reliability, although it is the most comprehensive and fully-featured. But in order to appropriately situate the role of Web-based intercoder reliability calculators within the universe of intercoder reliability software, it will be necessary to discuss the relevant programs first. As mentioned previously, most general-purpose statistical programs offer few intercoder reliability calculation options for nominal data if they offer any at all. SPSS, STATA, and SAS all contain built-in functions to calculate Cohen’s κ only, but only STATA can handle cases involving more than two coders and those in which one coder has used category values the others have not. Moreover, the educational licenses for these applications can be quite expensive, potentially prohibitively so for institutions and individuals of limited financial means. The efforts of those generous experts who produce intercoder reliability macros for use with SPSS and the like (e.g. Hayes & Krippendorff, 2007) thus only aid those with the money to maintain the required licenses. For researchers on a budget, free reliability-calculating programs have in recent years offered viable alternatives to the larger statistical packages. The most prominent of these is PRAM (Program for Assessing reliability with Multiple coders), a Microsoft Windows application that can compute a relatively wide range of reliability coefficients for any number of coders. Unfortunately, since PRAM and other software of its ilk are almost invariably small not-for-profit initiatives, they are rarely written for more than one operating system (and the fact that PRAM in particular was scripted in the proprietary Microsoft programming language Visual Basic makes non-Windows editions especially unlikely). What is more, at the time of this writing PRAM had not been updated since 2004 and was not available for public download online. In response to these shortcomings, independent Web programmers have developed and made available several intercoder reliability Web services. These online calculators lack the proprietary system requirements of the programs discussed thus far and generally have the ability to analyze the output of most database and statistics programs. Moreover, they fill an important gap left by larger, more general-purpose mathematical Web services which lack intercoder reliability options (e.g. Arsham, 2010; Uitenbroek, 1997; Wolfram, 2010). All of the Web-based reliability calculators of which the author is aware calculate only variants of Cohen’s κ, though more could possibly exist in languages other than English or on private intranets. These services were developed by Randolph (2008), Lowry (2010), Geertzen (2009), and New Zealand’s National Institute of Water & Atmosphere Research (2008). Taken together, they offer researchers a set of distinct choices of input formats and acceptable data parameters. Randolph’s requires users to input the number of coders agreeing that each case belongs in each possible category, whereas Geertzen’s accepts two or more plain-text files per variable each containing a single coder’s category judgments. Both Lowry’s and NIWA’s applications are limited to two coders only. ReCal improves upon all of these Web services in three significant ways: first, it offers an input specification consistent with that of SPSS, STATA, and SAS; that is, one that treats columns as variables and rows as cases. Thus, unlike its competitors, ReCal requires very little manual data reconfiguration when importing from these applications or from spreadsheets. Second, it applies an array of automatic data-sanitization routines that increases the probability of successful program executions. Third, and most importantly, it calculates far more intercoder reliability coefficients than just Cohen’s κ, and it does so for any number of coders and coding categories. ReCal: Its functionality and features In order to fully elucidate the methodological advances ReCal represents, this section describes exactly what it does and contrasts its functions with those of comparable applications. The most important characteristic to note about ReCal at the outset is that it consists of two independent modules, ReCal2 and ReCal3 (Figure 1). The former is intended for data sets that have been coded by two coders, while the latter accepts data coded by two or more coders. The reason for this division is that ReCal2 allows users to calculate reliability for more than one variable on a single execution for the sake of convenience. By contrast, ReCal3 can only compute results for one variable per execution. Each module requires its data sets to conform to a distinct and fairly precise set of specifications to produce results (although minor deviations are allowed). Both accept only CSV (comma-separated values) and TSV (tab-separated values) data files as input. Both of these file types consist of plain text with integers representing code categories arranged in rows delimited by line breaks and columns delimited by commas (CSV) or tab characters (TSV). CSV and TSV were chosen as the only acceptable file types due to their simplicity and the fact that they can be exported by SPSS, STATA, SAS, Microsoft Excel, Microsoft Access, Google Docs, and a host of other database, spreadsheet, and statistical programs. They can also be constructed by hand in a word processing program if desired. This design choice represents a key advance in cross-platform compatibility over programs like PRAM, which accepts only pre-2007 MS Excel documents.

D. G. Freelon / International Journal of Internet Science 5 (1), 20–33
23
Users wishing to calculate reliability with ReCal must thus first choose which module to use based on the nature of their data. Both modules require users to export CSV or TSV files formatted such that each row represents a unique unit of analysis, but each interprets columns differently. ReCal2 assumes that every adjacent pair of columns starting from the leftmost column represents two sets of judgments on the same variable; it would thus interpret a 4-column 10-row CSV file consisting entirely of numbers as 10 units of analysis for 2 distinct variables evaluated by two coders per variable. ReCal3, by contrast, would interpret this same file as containing the judgments of four different coders on 10 units of a single variable.
Figure 1. Web interfaces for ReCal2 (left) and ReCal3 (right). In spite of the relative straightforwardness of ReCal’s data specification, there nevertheless remains significant potential for user error. Over 18 months of user testing has fueled the development of a robust cascade of data-sanitizing and error-checking routines which has dramatically reduced the number of possible user errors. These technological advances were made possible through close analysis of cached copies of the data files uploaded to ReCal (the service’s license agreement stipulates that all data files will be saved for this purpose). ReCal’s status as a Web service played a critical role here – without the ability to pinpoint users’ errors by directly reviewing their data, it would have been much more difficult to improve its functionality in meaningful ways. The error-checking cascade begins by checking the file extension of the submitted file: if it is not CSV or TSV, ReCal halts and asks users to resubmit their file in the proper format. Next, it examines the file size to ensure that it is neither zero (which usually indicates a corrupt file) or over 100,000 bytes (since most files exceeding that size are non-CSV files renamed with the CSV extension to pass the first criterion). At this point the cascade begins its data sanitization routine, in which it converts tab and semicolon delimiters into commas2, strips text headers on the first row (if they exist), and prunes extraneous whitespace and unused delimiters. Finally, it runs a second set of data verification procedures, checking for non-numeric characters and missing values. ReCal2 contains one additional data criterion not shared by ReCal3: it will only analyze files containing an even number of columns since it requires that each variable submitted to it consist of a pair of judgment sets. ReCal3 can accept any number of columns, even or odd, as it assumes that each column represents a different user working on the same variable. Successful passage of a data file through the error cascade indicates to ReCal that the file is ready for analysis. For the sake of simplicity, ReCal calculates all of the coefficients it offers on each execution; that is, it does not offer users the option to choose which coefficients they want to calculate (this design choice does not noticeably increase execution latency). ReCal2’s results page displays percent agreement, Scott’s π, Cohen’s κ, and Krippendorff’s α; while ReCal3’s results page displays percent agreement (all pairwise percentages as well as their combined average), Fleiss’ κ, Cohen’s κ (all pairwise κs as well as their combined average), and Krippendorff’s α. In addition, each module presents a few basic descriptive statistics and execution details: the number of columns, rows, coders, cases, and decisions, as well as the file’s size in bytes. ReCal2 also reports the number of agreements and disagreements per variable, and ReCal3 reports several of the computational inputs
2Some versions of Microsoft Excel for European countries (and possibly others) export semicolon-delimited files with the extension CSV. The addition of the segment of the cascade that converts semicolons to commas thus made ReCal much easier to use for many European users as evidenced by the unprecedented appearance of semicolon-delimited files in ReCal's data repository.

D. G. Freelon / International Journal of Internet Science 5 (1), 20–33
24
for Fleiss’ κ and Krippendorff’s α including observed and expected agreement for the former. All of this non-coefficient information is intended to assist ReCal users in verifying that they have formatted their file correctly – if the number of coders or units is not what they anticipated, for example, they can adjust their files and try again. Figure 2 presents a flowchart summarizing the major steps a user must follow in order to use ReCal.
Figure 2. ReCal usage flowchart. Having successfully run the service, users can either save the results page in HTML format or export the results back to CSV format for import into Excel or another spreadsheet application. Export into database or statistical applications is technically possible but not recommended as the output file was designed for readability rather than further statistical analysis. Verification of calculations Short of checking ReCal’s output by hand, users have no way of being absolutely certain their results will be correct every time. While it would be impossible to demonstrate that ReCal will always give accurate results for all possible data sets, this section will present two forms of empirical evidence to support its veracity. First, a set of worked examples will demonstrate for each coefficient the math required to verify ReCal’s output by hand. Second, a direct comparison between ReCal’s coefficients and those of alternative calculators for 20 randomly-selected ReCal user data files will be presented and discussed. ReCal2 worked examples
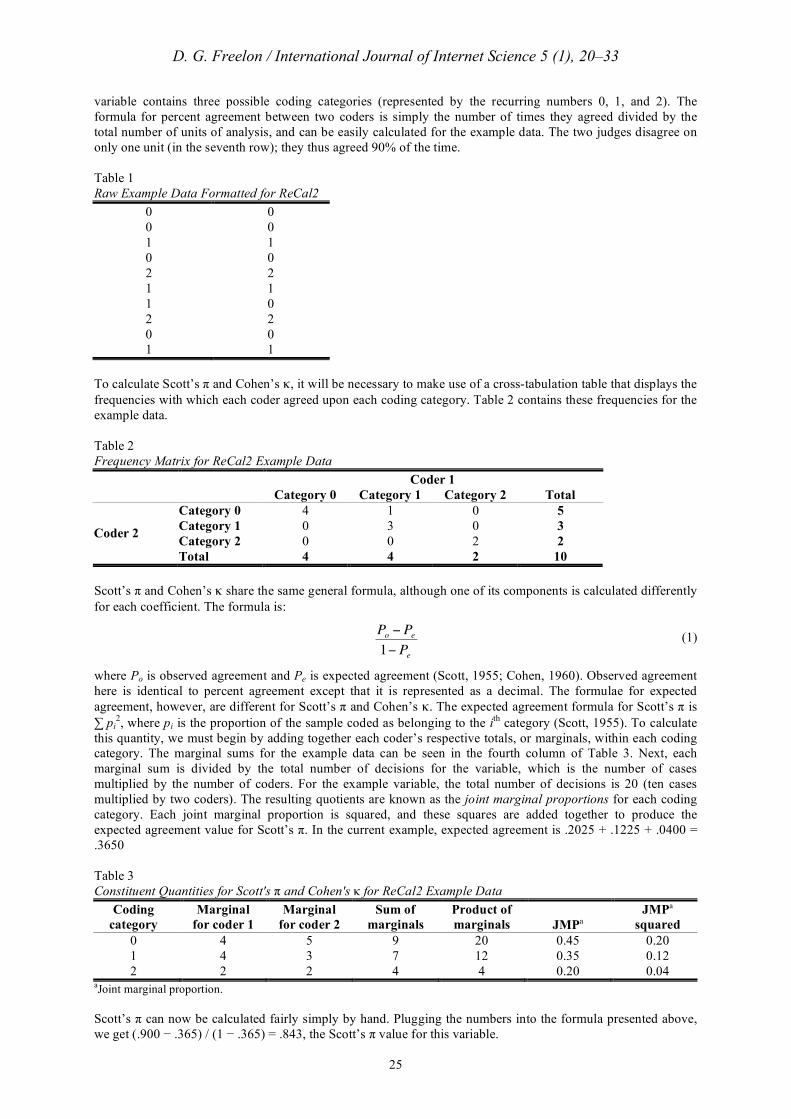
Consider an example ReCal2 data file consisting of two columns and ten rows of numerical judgments (Table 1). ReCal2 would consider this file to contain one variable with ten units of analysis coded by two judges. This
D. G. Freelon / International Journal of Internet Science 5 (1), 20–33
25
variable contains three possible coding categories (represented by the recurring numbers 0, 1, and 2). The formula for percent agreement between two coders is simply the number of times they agreed divided by the total number of units of analysis, and can be easily calculated for the example data. The two judges disagree on only one unit (in the seventh row); they thus agreed 90% of the time. Table 1 Raw Example Data Formatted for ReCal2
0 0 0 0 1 1 0 0 2 2 1 1 1 0 2 2 0 0 1 1
To calculate Scott’s π and Cohen’s κ, it will be necessary to make use of a cross-tabulation table that displays the frequencies with which each coder agreed upon each coding category. Table 2 contains these frequencies for the example data. Table 2 Frequency Matrix for ReCal2 Example Data
Coder 1 Category 0 Category 1 Category 2 Total
Category 0 4 1 0 5 Category 1 0 3 0 3 Category 2 0 0 2 2 Coder 2
Total 4 4 2 10 Scott’s π and Cohen’s κ share the same general formula, although one of its components is calculated differently for each coefficient. The formula is:
!
Po" P
e
1" Pe
(1)
where Po is observed agreement and Pe is expected agreement (Scott, 1955; Cohen, 1960). Observed agreement here is identical to percent agreement except that it is represented as a decimal. The formulae for expected agreement, however, are different for Scott’s π and Cohen’s κ. The expected agreement formula for Scott’s π is ∑ pi
2, where pi is the proportion of the sample coded as belonging to the ith category (Scott, 1955). To calculate this quantity, we must begin by adding together each coder’s respective totals, or marginals, within each coding category. The marginal sums for the example data can be seen in the fourth column of Table 3. Next, each marginal sum is divided by the total number of decisions for the variable, which is the number of cases multiplied by the number of coders. For the example variable, the total number of decisions is 20 (ten cases multiplied by two coders). The resulting quotients are known as the joint marginal proportions for each coding category. Each joint marginal proportion is squared, and these squares are added together to produce the expected agreement value for Scott’s π. In the current example, expected agreement is .2025 + .1225 + .0400 = .3650 Table 3 Constituent Quantities for Scott's π and Cohen's κ for ReCal2 Example Data
Coding category
Marginal for coder 1
Marginal for coder 2
Sum of marginals
Product of marginals JMPa
JMPa squared
0 4 5 9 20 0.45 0.20 1 4 3 7 12 0.35 0.12 2 2 2 4 4 0.20 0.04
aJoint marginal proportion. Scott’s π can now be calculated fairly simply by hand. Plugging the numbers into the formula presented above, we get (.900 − .365) / (1 − .365) = .843, the Scott’s π value for this variable.

D. G. Freelon / International Journal of Internet Science 5 (1), 20–33
26
The expected agreement formula for Cohen’s κ is:
!
Pe =1
n2
pmi" (2)
where n is the number of cases and ∑ pmi is the sum of the marginal products (Neuendorf, 2002). To calculate this quantity, we begin by multiplying each pair of marginals within each coding category (fifth column of Table 3) and then summing the products. This sum in our example is 20 + 12 + 4 = 36, which is then multiplied by the reciprocal of the square of the number of cases, 1/n2. Our number of cases being 10, the latter quantity is equal to .01. Expected agreement is therefore .01(36) = .36. We can now complete the Cohen’s κ formula for the example data: (.90 − .36) / (1 − .36) = .844, the final κ value. Krippendorff’s α behaves somewhat differently from Scott’s π and Cohen’s κ, both of which are premised upon frequency tables that produce category marginals for each coder. Instead, it requires coincidences within units, matrices of which produce marginals indicating the total number of times each category is employed in the data set3. These values are identical to the sums of marginals used in the calculations for Scott’s π (Table 3, fourth column), and can be seen in the coincidence matrix for the current example (Table 4). Note that coincidences are counted twice in the matrix (Krippendorff, 2007): for example, the four 0-0 agreements entail a value of eight in the 0-0 cell. Disagreements (represented by the off-diagonal cells) are also counted twice, but in different cells; thus the sole disagreement here is counted once in the 0-1 cell and again in the 1-0 cell. Table 4 Krippendorff's α Coincidence Matrix for ReCal2 Example Data
Category 0 Category 1 Category 2 Total Category 0 8 1 0 9 Category 1 1 6 0 7 Category 2 0 0 4 4 Total 9 7 4 20 Table 4 contains all the information needed to calculate Krippendorff’s α. Its general formula for multiple coders working with nominal data is as follows (Krippendorff, 2007):
!
n "1( ) occ" n
cnc"1( )##
n n "1( )" ncnc"1( )#
(3)
where n is the total number of coding decisions, occ is each agreement coincidence (diagonal cells in the coincidence matrix), and nc is each coincidence marginal. Inserting the matrix values into the formula produces the following equation:
!
" =20 #1( ) 8+ 6+ 4( )# 9 9 #1( ) + 7 7 #1( ) + 4 4 #1( )[ ]20 20 #1( )# 9 9 #1( ) + 7 7 #1( ) + 4 4 #1( )[ ]
= .85 (4)
Figure 3 displays the ReCal2 output page for the data set represented in Table 1. Readers are encouraged to copy these data into their own CSV files and run them through ReCal to independently verify these results.
3Technically this is only the case when all coders judge all units (i.e. there is no missing data), which ReCal requires. If a data set is missing a few points, these points should be manually removed listwise.

D. G. Freelon / International Journal of Internet Science 5 (1), 20–33
27
Figure 3. Output for ReCal2 example data. ReCal3 worked examples
Table 5 contains an example dataset for ReCal3 with 3 columns and 10 rows. ReCal3 would interpret a CSV file containing this information as 10 units of data for a single variable evaluated by three coders. The first statistics it computes are pairwise percent agreements (i.e. percent agreement between each possible pair of coders) and average pairwise percent agreement. In this example, pairwise agreement is 80% for the first and second columns, 80% for the second and third columns, and 60% for the first and third columns. The definition of average pairwise percent agreement is the average of these three quantities, 73.3%. Table 5 Raw Example Data Formatted for ReCal3
0 1 0 1 1 1 1 1 1 2 2 1 1 1 1 1 1 0 1 1 1 1 0 1 0 0 0 2 2 2
Fleiss’ κ, actually an extension of Scott’s π for more than two coders, is defined by the following formula (Fleiss, 1971):
!
P " P e
1"P e
(5)
To determine
!
P e, we must first calculate the quantity pj, which is the proportion of judgments that a case
belonged to the jth category; and to determine
!
P we need to know the quantity Pi, the proportion of agreement among all judges for the ith case. The formula for pj is:
!
pj =1
Nnnij" (6)
where N is the number of cases, n is the number of judges, and nij is the number of judges who assigned the ith case to the jth category (hence ∑nij is equal to the total number of times the category in question was used throughout the entire sample). This quantity is computed for each category the judges used (see Table 6), and the sum of their squares is
!
P e, the expected agreement.
!
P e in this example is .2302 + .6002 + 0.1702 = .442.
Pi is calculated for each case (thus there will be ten values thereof in this example) using the following formula:
!
Pi =1
n n "1( )nij2 " nij# (7)
D. G. Freelon / International Journal of Internet Science 5 (1), 20–33
28
Therefore Pi for the first case of the data above would be:
!
1
3 3"1( )22" 2( ) + 12 "1( )[ ] (8)
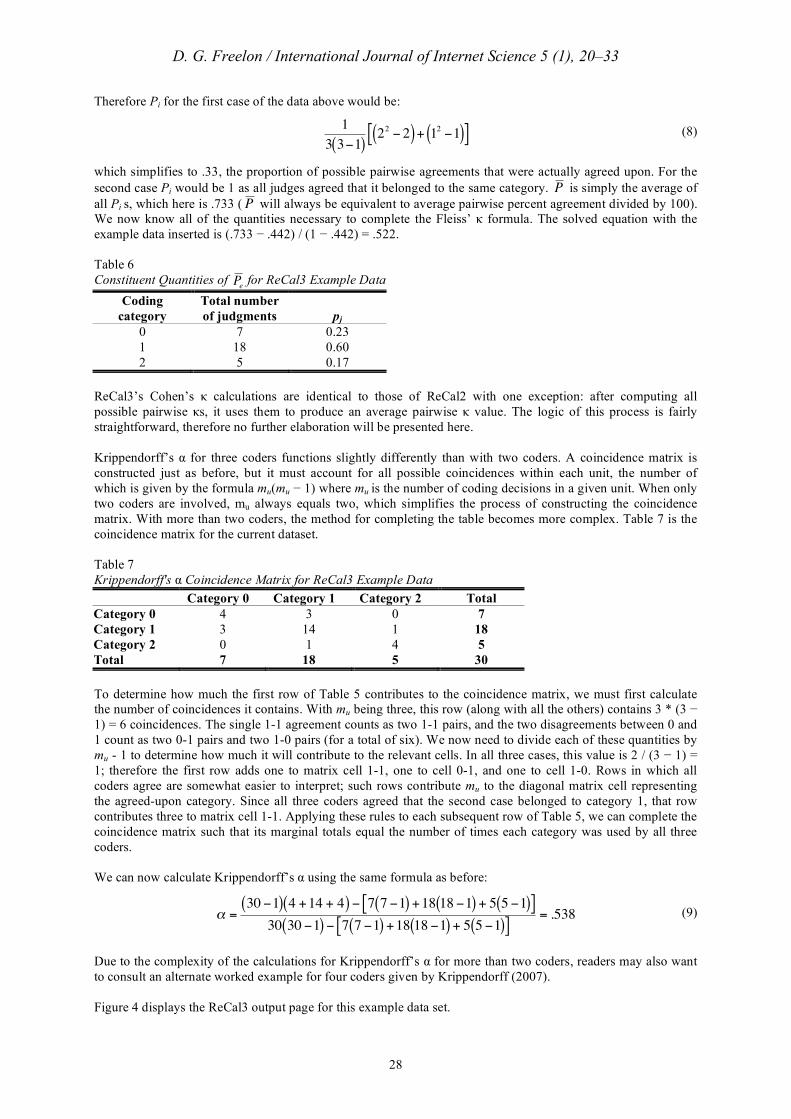
which simplifies to .33, the proportion of possible pairwise agreements that were actually agreed upon. For the second case Pi would be 1 as all judges agreed that it belonged to the same category.
!
P is simply the average of all Pi s, which here is .733 (
!
P will always be equivalent to average pairwise percent agreement divided by 100). We now know all of the quantities necessary to complete the Fleiss’ κ formula. The solved equation with the example data inserted is (.733 − .442) / (1 − .442) = .522. Table 6 Constituent Quantities of
!
P e for ReCal3 Example Data
Coding category
Total number of judgments pj
0 7 0.23 1 18 0.60 2 5 0.17
ReCal3’s Cohen’s κ calculations are identical to those of ReCal2 with one exception: after computing all possible pairwise κs, it uses them to produce an average pairwise κ value. The logic of this process is fairly straightforward, therefore no further elaboration will be presented here. Krippendorff’s α for three coders functions slightly differently than with two coders. A coincidence matrix is constructed just as before, but it must account for all possible coincidences within each unit, the number of which is given by the formula mu(mu − 1) where mu is the number of coding decisions in a given unit. When only two coders are involved, mu always equals two, which simplifies the process of constructing the coincidence matrix. With more than two coders, the method for completing the table becomes more complex. Table 7 is the coincidence matrix for the current dataset. Table 7 Krippendorff's α Coincidence Matrix for ReCal3 Example Data Category 0 Category 1 Category 2 Total Category 0 4 3 0 7 Category 1 3 14 1 18 Category 2 0 1 4 5 Total 7 18 5 30 To determine how much the first row of Table 5 contributes to the coincidence matrix, we must first calculate the number of coincidences it contains. With mu being three, this row (along with all the others) contains 3 * (3 − 1) = 6 coincidences. The single 1-1 agreement counts as two 1-1 pairs, and the two disagreements between 0 and 1 count as two 0-1 pairs and two 1-0 pairs (for a total of six). We now need to divide each of these quantities by mu - 1 to determine how much it will contribute to the relevant cells. In all three cases, this value is 2 / (3 − 1) = 1; therefore the first row adds one to matrix cell 1-1, one to cell 0-1, and one to cell 1-0. Rows in which all coders agree are somewhat easier to interpret; such rows contribute mu to the diagonal matrix cell representing the agreed-upon category. Since all three coders agreed that the second case belonged to category 1, that row contributes three to matrix cell 1-1. Applying these rules to each subsequent row of Table 5, we can complete the coincidence matrix such that its marginal totals equal the number of times each category was used by all three coders. We can now calculate Krippendorff’s α using the same formula as before:
!
" =30 #1( ) 4 +14 + 4( ) # 7 7 #1( ) +18 18 #1( ) + 5 5 #1( )[ ]
30 30 #1( ) # 7 7 #1( ) +18 18 #1( ) + 5 5 #1( )[ ]= .538 (9)
Due to the complexity of the calculations for Krippendorff’s α for more than two coders, readers may also want to consult an alternate worked example for four coders given by Krippendorff (2007). Figure 4 displays the ReCal3 output page for this example data set.

D. G. Freelon / International Journal of Internet Science 5 (1), 20–33
29
Figure 4. Output for ReCal3 example data. Comparison to alternative calculators
To further verify ReCal’s results, a small subset of its entire population of user-submitted data was comparatively tested using other intercoder reliability software applications. This subset comprised 20 data files – 10 for ReCal2 and 10 for ReCal3 – that were randomly chosen from all 5,319 unique files submitted by users to ReCal between November 10, 2008 and May 6, 2010. While a sample size of 20 may seem small for a population of over 5,000, it should be emphasized that the purpose of this exercise is not to draw statistical inferences but rather to support the claim that ReCal’s output is accurate. The files being tested collectively exhibit significant variation in number of coders, number of units of analysis, number of possible coding categories, and distribution of category judgments (see Table 8). Further, as will be shown, the level of coefficient agreement between ReCal and its alternatives is nearly perfect, and where discrepancies occur ReCal is shown to be correct. In light of the fact that even testing all 5,319 files would not be sufficient to demonstrate accuracy in all conceivable cases, the results of this 20-file test should do so to a reasonable standard of scholarly satisfaction. To create the test sample, 20 files were initially selected at random from the complete user file archive. Of these, three were improperly formatted (the system archives such files for troubleshooting purposes) and thus three replacement files were randomly chosen, all of which were fully functional. By chance, the final 20-file test sample contained ten files bearing an odd number of data columns. These were immediately assigned to the ReCal3 testing subgroup, as ReCal2 can only accommodate files with even numbers of columns. All of the remaining ten files were placed into the ReCal2 testing subgroup, and the seven of those that contained more than two columns were pared down to their leftmost two columns so that ten variables from ten distinct files would be tested. All files in both subgroups containing more than 50 units of analysis were tested only on their first 50 units to limit the amount of manual processing involved in converting the files from ReCal’s data configuration to those of the other calculators (the differences between the required data configurations for PRAM and ReCal are discussed in Lombard, Snyder-Duch, & Bracken, 2008). Finally, all files were anonymized by replacing the original file names with the new names in the leftmost column of Table 8, which combine the subgroup to which the file belongs (“R2” for ReCal2 and “R3” for ReCal3) with a unique ID number (01-10).

D. G. Freelon / International Journal of Internet Science 5 (1), 20–33
30
The 10 files assigned to the ReCal2 subgroup were checked against two alternative intercoder reliability calculators: PRAM (Neuendorf, 2002) and Andrew Hayes’ Krippendorff’s alpa macro for SPSS (Hayes & Krippendorff, 2007). PRAM was used to verify percent agreement, Scott’s π, and Cohen’s κ; while Hayes’ macro was used to corroborate Krippendorff’s α. ReCal3’s calculations were checked against PRAM (pairwise percent agreement and pairwise Cohen’s κ), Hayes’ macro (Krippendorff’s α), and an intercoder reliability package for the statistical environment R called irr (Fleiss’ κ). All of the files used in this comparison are available online for independent verification at http://dfreelon.org/recal/ijis/ijis.icr.data.zip and at http://ijis.net/ supplement/ijis5_1/freelon.zip. Table 8 Characteristics of Randomly Selected Data Sets Used in Coefficient Comparison
Filename (anonymized)
N of coders
N of units of analysis
N of coding categories
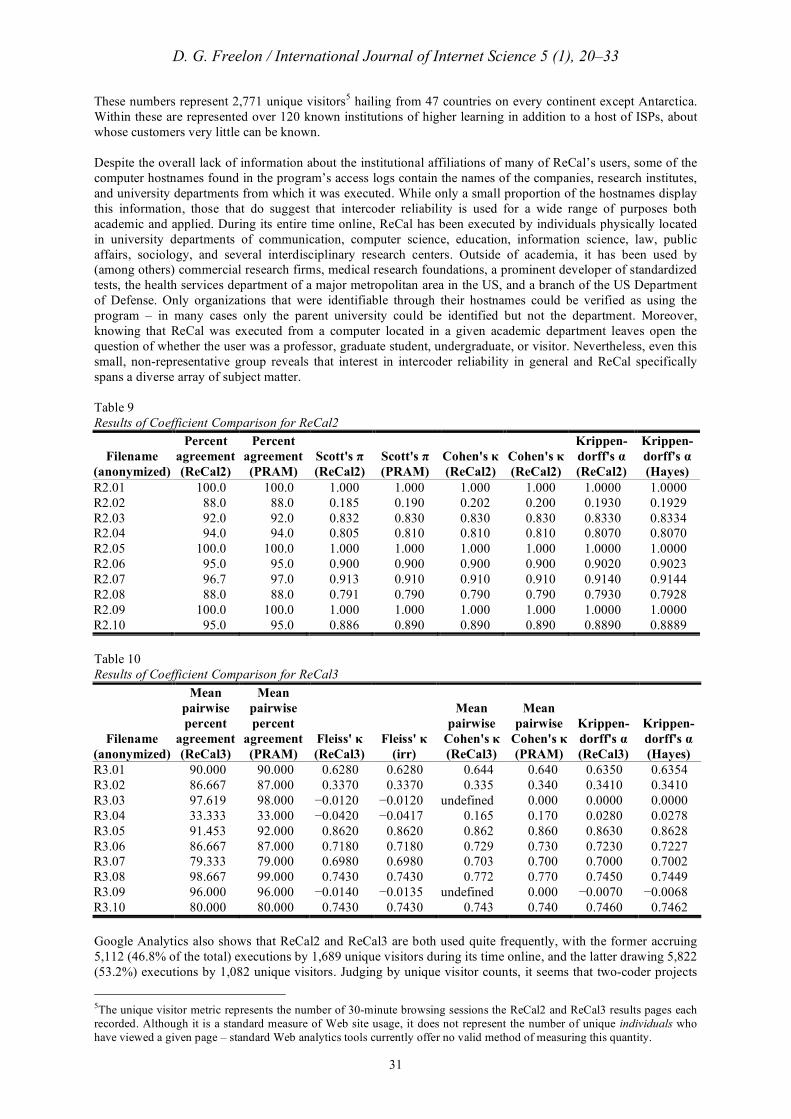
R2.01 2 10 2 R2.02 2 50 2 R2.03 2 50 4 R2.04 2 50 2 R2.05 2 50 2 R2.06 2 20 2 R2.07 2 30 5 R2.08 2 50 4 R2.09 2 20 2 R2.10 2 20 2 R3.01 5 10 2 R3.02 3 50 2 R3.03 3 28 2 R3.04 3 5 3 R3.05 3 39 3 R3.06 3 20 2 R3.07 3 50 4 R3.08 3 50 2 R3.09 3 50 4 R3.10 3 25 7 The results of the verification analysis can be seen in Tables 9 and 10: in every case except two, ReCal’s results are mathematically equivalent to those of its competitors to three decimal places. In the two cases in which ReCal disagrees with another calculator (average pairwise Cohen’s κ for R3.03 and R3.09), it can easily be demonstrated that ReCal is correct. The issue here stems from the fact that parts of both of these calculations result in division by zero (recall that since Cohen’s κ is defined by equation [1] in the previous section, it will lead to division by zero whenever Pe = 1, as it does for one of the coder pairs in both R3.03 and R3.09). PRAM reports both of the final coefficients as zero while ReCal lists them as undefined, but PRAM is programmed to set undefined values to zero. (PRAM’s output in such cases includes the following note: “This field is set to 0 because the coefficient is indeterminite [sic].”) But zero and undefined are mathematically distinct: given that dividing any real number by zero is impossible, the quotient of any real number divided by zero logically cannot equal zero. And including an undefined value in a larger mathematical equation, as do the average pairwise Cohen’s κ calculations for both R3.03 and R3.09, renders the entire equation unsolvable. Thus PRAM errs in failing to distinguish between undefined values of average pairwise Cohen’s κ and actual zero values, while ReCal correctly renders undefined coefficients as undefined. ReCal’s usage Since its introduction in early October 2008, ReCal has been tested by scholars and professionals around the world. Between October 4, 2008 and May 26, 2010 (the date of this writing), Google Analytics reports that it has been executed by someone other than the developer nearly every day. That is, either ReCal2 or ReCal3 was run at least once on 88.5% of all days (including weekends) between October 4, 2008 and March 25, 2010. Its overall execution count currently stands at 10,9344 and its average daily execution count stands at roughly 18.
4The large discrepancy between this number and the aforementioned number of unique files is due to two factors: repeat executions of the same file and executions of different data sets using the same filename.
D. G. Freelon / International Journal of Internet Science 5 (1), 20–33
31
These numbers represent 2,771 unique visitors5 hailing from 47 countries on every continent except Antarctica. Within these are represented over 120 known institutions of higher learning in addition to a host of ISPs, about whose customers very little can be known. Despite the overall lack of information about the institutional affiliations of many of ReCal’s users, some of the computer hostnames found in the program’s access logs contain the names of the companies, research institutes, and university departments from which it was executed. While only a small proportion of the hostnames display this information, those that do suggest that intercoder reliability is used for a wide range of purposes both academic and applied. During its entire time online, ReCal has been executed by individuals physically located in university departments of communication, computer science, education, information science, law, public affairs, sociology, and several interdisciplinary research centers. Outside of academia, it has been used by (among others) commercial research firms, medical research foundations, a prominent developer of standardized tests, the health services department of a major metropolitan area in the US, and a branch of the US Department of Defense. Only organizations that were identifiable through their hostnames could be verified as using the program – in many cases only the parent university could be identified but not the department. Moreover, knowing that ReCal was executed from a computer located in a given academic department leaves open the question of whether the user was a professor, graduate student, undergraduate, or visitor. Nevertheless, even this small, non-representative group reveals that interest in intercoder reliability in general and ReCal specifically spans a diverse array of subject matter. Table 9 Results of Coefficient Comparison for ReCal2
Filename (anonymized)
Percent agreement (ReCal2)
Percent agreement (PRAM)
Scott's π (ReCal2)
Scott's π (PRAM)
Cohen's κ (ReCal2)
Cohen's κ (ReCal2)
Krippen-dorff's α (ReCal2)
Krippen-dorff's α (Hayes)
R2.01 100.0 100.0 1.000 1.000 1.000 1.000 1.0000 1.0000 R2.02 88.0 88.0 0.185 0.190 0.202 0.200 0.1930 0.1929 R2.03 92.0 92.0 0.832 0.830 0.830 0.830 0.8330 0.8334 R2.04 94.0 94.0 0.805 0.810 0.810 0.810 0.8070 0.8070 R2.05 100.0 100.0 1.000 1.000 1.000 1.000 1.0000 1.0000 R2.06 95.0 95.0 0.900 0.900 0.900 0.900 0.9020 0.9023 R2.07 96.7 97.0 0.913 0.910 0.910 0.910 0.9140 0.9144 R2.08 88.0 88.0 0.791 0.790 0.790 0.790 0.7930 0.7928 R2.09 100.0 100.0 1.000 1.000 1.000 1.000 1.0000 1.0000 R2.10 95.0 95.0 0.886 0.890 0.890 0.890 0.8890 0.8889 Table 10 Results of Coefficient Comparison for ReCal3
Filename (anonymized)
Mean pairwise percent
agreement (ReCal3)
Mean pairwise percent
agreement (PRAM)
Fleiss' κ (ReCal3)
Fleiss' κ (irr)
Mean pairwise
Cohen's κ (ReCal3)
Mean pairwise
Cohen's κ (PRAM)
Krippen-dorff's α (ReCal3)
Krippen-dorff's α (Hayes)
R3.01 90.000 90.000 0.6280 0.6280 0.644 0.640 0.6350 0.6354 R3.02 86.667 87.000 0.3370 0.3370 0.335 0.340 0.3410 0.3410 R3.03 97.619 98.000 −0.0120 −0.0120 undefined 0.000 0.0000 0.0000 R3.04 33.333 33.000 −0.0420 −0.0417 0.165 0.170 0.0280 0.0278 R3.05 91.453 92.000 0.8620 0.8620 0.862 0.860 0.8630 0.8628 R3.06 86.667 87.000 0.7180 0.7180 0.729 0.730 0.7230 0.7227 R3.07 79.333 79.000 0.6980 0.6980 0.703 0.700 0.7000 0.7002 R3.08 98.667 99.000 0.7430 0.7430 0.772 0.770 0.7450 0.7449 R3.09 96.000 96.000 −0.0140 −0.0135 undefined 0.000 −0.0070 −0.0068 R3.10 80.000 80.000 0.7430 0.7430 0.743 0.740 0.7460 0.7462 Google Analytics also shows that ReCal2 and ReCal3 are both used quite frequently, with the former accruing 5,112 (46.8% of the total) executions by 1,689 unique visitors during its time online, and the latter drawing 5,822 (53.2%) executions by 1,082 unique visitors. Judging by unique visitor counts, it seems that two-coder projects
5The unique visitor metric represents the number of 30-minute browsing sessions the ReCal2 and ReCal3 results pages each recorded. Although it is a standard measure of Web site usage, it does not represent the number of unique individuals who have viewed a given page – standard Web analytics tools currently offer no valid method of measuring this quantity.

D. G. Freelon / International Journal of Internet Science 5 (1), 20–33
32
are slightly more popular than three-coder projects among ReCal’s user base. The greater number of ReCal3 program executions is most likely due to the fact that ReCal2 can analyze multiple variables at once while its counterpart can only analyze one variable at a time. In addition to the execution counts provided above, public user comments provide additional evidence of ReCal’s practical value. Between ReCal’s public launch and May 17, 2010, users posted 40 public comments about the program (most of which can be found at http://www.dfreelon.org/utils/recalfront/), the vast majority of which were complimentary. Of all user comments, 32 (80%) expressed gratitude or appreciation, and a handful mentioned that the results would be incorporated in a conference paper, article submitted for publication, or dissertation. Ten comments (25% of the total) either asked a question about the user’s results or made a suggestion about additional features6 (some of which were later implemented). Importantly, none of ReCal’s users to date has reported any incorrect results either in public comments or in private emails to the developer. By contrast, the high proportion of voluntarily-expressed satisfaction with ReCal serves as further indication that at least some users are in fact finding it valuable and effective. Conclusion This paper has attempted to justify the existence of, describe, verify the mathematical computations of, and report some of the usage patterns of ReCal, a relatively new online calculator of intercoder reliability. In so doing I have demonstrated that the service improves upon prior approaches in significant respects, offered the reader hand-calculated examples that can be used to independently corroborate its output, and shown that researchers are actually using it. Nevertheless, the application does have two significant limitations that bear direct acknowledgment. First and foremost, the coefficients ReCal offers are only valid for nominal intercoder data, which means that any attempt to submit ordinal, interval, or ratio data would produce inappropriately conservative results. This limitation is of course prominently noted in the documentation, and support for additional levels of measurement is currently under development. The second limitation is that while ReCal2 can compute results for multiple variables per execution, ReCal3 only accepts a single variable per execution. This results from the fact that ReCal’s data configuration equates rows with units of analysis and columns with coders: in order for ReCal3 to be able to accommodate any number of coders, it must assume that all coders are evaluating the same variable. On the other hand, for the common and special case of two coders, ReCal2 can assume that every adjacent column pair is independent (although some users nevertheless trigger errors by submitting files containing odd numbers of data columns). Consistent with these limitations, the core claim of this paper is not that ReCal is any kind of panacea for all possible intercoder reliability needs. Rather it is that ReCal effectively and efficiently demonstrates the power and advantages of Web services for an often-overlooked yet essential statistical task in the social sciences. And although not every user who views the ReCal interface chooses to execute it, the fact that so many do shows that it provides a valuable service for those who take the time to learn how to use it. ReCal will not be ideal for all purposes or individuals, but it does offer a unique and viable alternative for anyone who wishes to calculate intercoder reliability for nominal, subjectively-assessed data. References Altman, D. (1991). Practical statistics for medical research. New York: Chapman and Hall. Arsham, H. (2010). Descriptive statistics [Computer software]. Retrieved from http://home.ubalt.edu/ntsbarsh/ Business-stat/otherapplets/Descriptive.htm Cohen, J. (1960). A coefficient of agreement for nominal scales. Educational and Psychological Measurement, 20, 37–46. Fayers, P., & Hays, R. (2005). Assessing quality of life in clinical trials: Methods and practice. New York: Oxford University Press. Fleiss, J. L. (1971). Measuring nominal scale agreement among many raters. Psychological Bulletin, 76, 378–382.
6These numbers do not sum to 100% because several comments both gave a compliment and asked a question.

D. G. Freelon / International Journal of Internet Science 5 (1), 20–33
33
Geertzen, J. (2009). Cohen’s kappa for more than two annotators with multiple classes [Computer software]. Retrieved from http://cosmion.net/jeroen/software/kappa/ Google Analytics. (2010). [Computer software]. Retrieved from http://www.google.com/analytics/ Gruzd, A. (2009). Automated discovery of social networks in text-based online communities. Proceedings of the ACM 2009 International Conference on Supporting Group Work, 379-380. Hayes, A. F., & Krippendorff, K. (2007). Answering the call for a standard reliability measure for coding data. Communication Methods and Measures, 1, 77–89. Houser, J., & Bokovoy, J. (2006). Clinical research in practice: A guide for the bedside scientist. Sudbury, MA: Jones and Bartlett. Iyengar, S. (2001). The method is the message: The current state of political communication research. Political Communication, 18, 225–229. Krippendorff, K. (2004). Some Common Misconceptions and Recommendations. Human Communication Research, 30, 411–433. Krippendorff, K. (2007). Computing Krippendorff’s alpha-reliability. Annenberg School for Communication Departmental Paper 43. Retrieved from http://repository.upenn.edu/asc_papers/43/ Lombard, M., Snyder-Duch, J., & Bracken, C. C. (2002). Content analysis in mass communication: Assessment and reporting of intercoder reliability. Human Communication Research, 28, 587–604. Lombard, M., Snyder-Duch, J., & Bracken, C. C. (2008). Practical resources for assessing and reporting intercoder reliability in content analysis research projects. Retrieved from http://astro.temple.edu/~lombard/ reliability/ Lowry, R. (2010). Kappa as a measure of concordance in categorical sorting [Computer software]. Retrieved from http://faculty.vassar.edu/lowry/kappa.html Lu, C. J., & Shulman, S. W. (2008). Rigor and flexibility in computer-based qualitative research: Introducing the Coding Analysis Toolkit. International Journal of Multiple Research Approaches, 2, 105–117. Machin, D., & Campbell, M. (2005). Design of studies for medical research. Hoboken, NJ: Wiley. National Institute of Water & Atmospheric Research. (2008). Cohen’s kappa [Computer software]. Retrieved from http://www.niwa.co.nz/our-services/online-services/statistical-calculators/cohens-kappa Neuendorf, K. A. (2002). The content analysis guidebook. Thousand Oaks, CA: Sage. Randolph, J. (2008). Online kappa calculator [Computer software]. Retrieved from http://justusrandolph.net/ kappa/ Reips, U.-D., & Lengler, R. (2005). The Web Experiment List: A Web service for the recruitment of participants and archiving of Internet-based experiments. Behavior Research Methods, 37, 287. Scott, W. A. (1955). Reliability of content analysis: The case of nominal scale coding. Public Opinion Quarterly, 19, 321–325. Shah, C., & Marchionini, G. (2007, June). ContextMiner: A tool for digital library curators. Paper presented at the Joint Conferences on Digital Libraries, Vancouver, BC. Uitenbroek, D. G. (1997). SISA [Computer software]. Retrieved from http://www.quantitativeskills.com/sisa/ Urbaniak, G. C., & Plous, S. (2010). Research Randomizer: Free random sampling and random assignment [Computer software]. Retrieved from http://randomizer.org/ Wolfram, S. (2010). WolframAlpha [Computer software]. Retrieved from http://www.wolframalpha.com/