real-world activity and fuel use of diesel and cng … activity and fuel use of diesel and cng...
TRANSCRIPT
Real-World Activity and Fuel Use
of Diesel and CNG Refuse Trucks
Gurdas Sandhu1
H. Christopher Frey1
Shannon Bartelt-Hunt2
Elizabeth Jones2
@ 2014 PEMS International Conference & Workshop » April 3-4 » Riverside, California
1
2

2
Waste Collection in U.S.
~ 250 million tons of municipal solid waste generated each year
~ 140,000 refuse trucks for collection and transportation
Trucks average 25,000 miles per year
Typical fuel economy of 2 to 3 mpg of diesel

3
Motivation
Very few studies that report real-world diesel or natural gas refuse truck duty cycles and fuel use rates.
No study that compares real-world duty cycles and fuel use rates between refuse truck configurations.

4
Study Overview
“Include refuse truck configurations, model years & emissions control devices, and fuels typical to the U.S. waste collection industry.”
24 Trucks (18 diesel, 6 CNG)
Roll-off, Front-loader, and Side-loader configurations
Model Years: 2003 to 2012
Fuels: Ultra Low Sulfur Diesel (ULSD) and Compressed Natural Gas (CNG)

5
Research Questions
1. What are the real-world duty cycles of roll-off, front-loader, and side-loader refuse trucks?
2. What are the real-world fuel use rates of diesel roll-off, front-loader, and side-loader refuse trucks?
3. What are the real-world fuel use rates of CNG front-loader and side-loader refuse trucks?

6
Roll-off Refuse Truck Activity
1 2
4 3

7
Front-loader Refuse Trucks Activity
1 2
4 3

8
Side-loader Refuse Trucks Activity
1 2
4 3

9
Measured Diesel Roll-off Trucks
RO-1 RO-2 RO-3 RO-4 RO-5 RO-6
Year 2005 2006 2007 2007 2012 2012
Make Mack Mack Mack Mack Mack Mack
Model CV713 CV713 CV713 CV713 GU 713 GU 713
Year 2005 2005 2006 2006 2012 2012
Make Mack Mack Mack Mack Mack Mack
Model AMI-370 AMI-335 AMI-335 AMI-335 MP7-405M MP7-405M
Displ. (L) 11.9 11.9 11.9 11.9 11.0 11.0
Hp 405 365 365 365 405 405
EGR EGR EGR EGR EGR,DPF, SCR EGR, DPF, SCR
362,037 445,734 320,805 303,635 81,588 81,903
DPF - Diesel Particulate Filter; EGR - Exhaust Gas Recirculation; SCR – Selective Catalytic Reduction
Truck
Chassis
Engine
Emissions Controls
Mileage

10
Measured Diesel Front-loader Trucks
FL-1 FL-2 FL-3 FL-4 FL-5 FL-6
Year 2004 2005 2008 2008 2010 2010
Make Mack Mack Autocar Mack Autocar Autocar
Model MR6885 MR6885 WX64 MRU 613 Xpeditor Xpeditor
Year 2004 2004 2006 2008 2007 2007
Make Mack Mack Cummins Mack Cummins Cummins
Model AI-350 AI-350 ISM-320V MP7 325M ISL-365 ISL-365
Displ. (L) 12.0 12.0 10.8 11.0 8.9 8.9
Hp 350 350 320 325 365 365
EGR EGR EGR EGR, DPF EGR, DPF EGR, DPF
284,003 267,971 184,934 117,691 50,033 41,017
DPF - Diesel Particulate Filter; EGR - Exhaust Gas Recirculation
Truck
Chassis
Engine
Emissions Controls
Mileage

11
Measured Diesel Side-loader Trucks
SL-1 SL-2 SL-3 SL-4 SL-5 SL-6
Year 2003 2003 2008 2009 2010 2012
Make Mack Mack Freightliner Mack Freightliner Freightliner
Model LE 613 LE 613 M2 106 LEU 613 M2 M2
Year 2003 2003 2008 2008 2010 2012
Make Mack Mack Detroit Diesel Mack Cummins Cummins
Model AI-300A AI-300A MBE 900 MP7-325M ISC-300 ISC-300
Displ. (L) 12.0 12.0 7.2 11.0 8.3 8.3
Hp 325 325 250 325 300 300
- - EGR, DPF EGR, DPF EGR, DPF EGR, DPF, SCR
236,913 292,135 108,814 88,781 75,480 40,097
DPF - Diesel Particulate Filter; EGR - Exhaust Gas Recirculation; SCR – Selective Catalytic Reduction
Truck
Chassis
Engine
Emissions Controls
Mileage

12
Measured CNG Trucks
FLC-1 FLC-2 FLC-3 SLC-1 SLC-2 SLC-3
Year
Make
Model
Year
Make
Model
Displ. (L)
Hp
27,670 35,551 30,534 23,197 25,177 25,317
EGR - Exhaust Gas Recirculation; TWC – Three Way Catalyst
320 320
EGR, TWC EGR, TWC
Truck Front-loader Side-loader
Cummins Cummins
ISLG-320 ISLG-320
8.9 8.9
Emissions Controls
Mileage
2013 2012
Mack Autocar
ACX64 MRU633
2012 2012
Chassis
Engine

13
CNG Fuel System
Full fuel tank: 3600 psi At engine inlet: 70-150 psi Inside engine: 40-70 psi
1 diesel gallon equivalent (DGE) of CNG costs ~ $1.80

14
Instrumentation
PEMS: GlobalMRV Axion
ECU Readout
Exhaust Probes
GPS units: Garmin 76CSx

15
Data Collected
Exhaust pollutants: Carbon Dioxide (CO2), Carbon Monoxide (CO), Hydrocarbons (HC), Nitric Oxide (NO), and Particulate Matter (PM).
Engine Data: Vehicle Speed (kph), Engine Speed (rpm), Intake Air Temperature (oC), Intake Manifold Pressure (kPa), Fuel Use Rate (L/hr), Engine Load (%), Torque (%), and Exhaust Temperature (oC).
Location Data: Latitude, Longitude, Elevation (m)
16
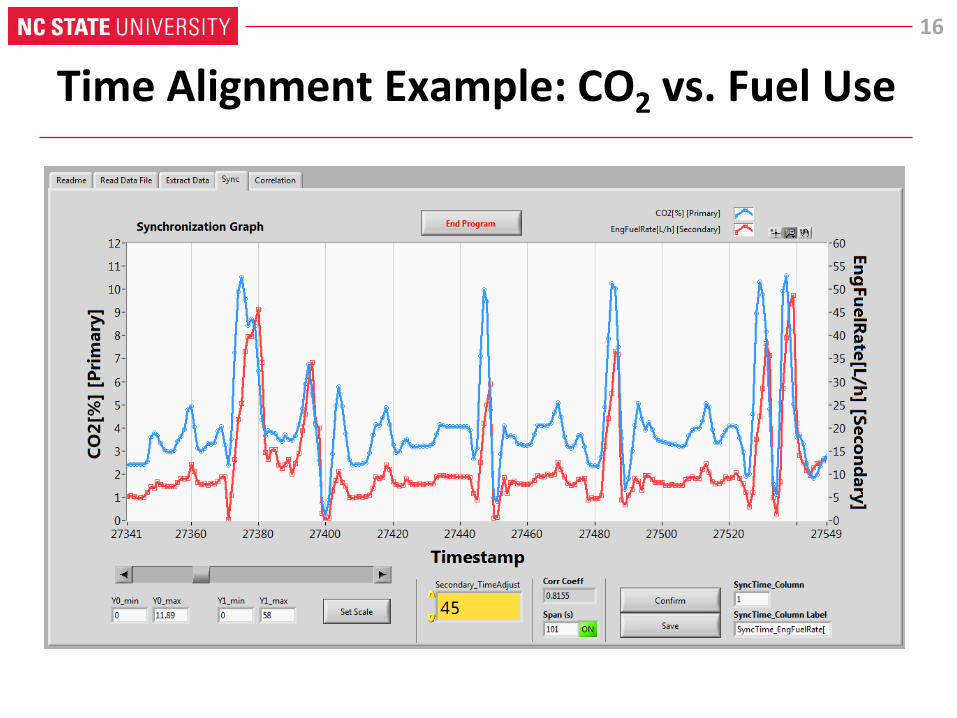
Time Alignment Example: CO2 vs. Fuel Use

17
Correlation Coeff Example: CO2 vs. Fuel Use

18
MOVES Scaled Tractive Power
STPt = scaled tractive power at time t, skW A = rolling resistance coefficient [kW-s/m] {1.41705} B = rotational resistance coefficient [kW-s2/m2] {0} C = aerodynamic drag coefficient [kW-s3/m3] {0.003572} at = vehicle acceleration at time t [m/s2] g = acceleration due to gravity [9.81 m/s2] m = vehicle mass [metric ton] {20.6845} rt = road grade at time t [%] vt = vehicle speed at time t [m/s] fscale = scaling factor, 17.1 unitless
2 3 ( )100
tt t t t t
t
scale
rAv Bv Cv mv a g
STPf

19
MOVES Operating Mode Definition
0
6
12
18
24
30
36
0 1 11 12 13 14 15 16 21 22 23 24 25 27 28 29 30 33 35 37 38 39 40
Scal
ed
Tra
ctiv
e P
ow
er,
skW
MOVES Operating Mode
1 mph ≤ Speed < 25 mph 25 mph ≤ Speed < 50 mph 50 mph ≤ Speed
Idlin
g
Dec
eler
atin
g
Co
asti
ng,
STP
< 0
Co
asti
ng,
STP
< 0
....

20
Activity Overview for Diesel Trucks
Roll-off Front
loader Side
loader Total
1Hz QA Data (hours) 50 48 46 144
Miles Driven 870 780 555 2,205
Fuel Used (gal) 199 285 210 694
Trash Cans Picked 39 660 4,200 4,900
Trash Collected (tons) 165 150 50 365

21
Activity Overview for CNG Trucks
Front loader
Side loader
Total
1Hz QA Data (hours) 30 20 50
Miles Driven 324 169 493
Fuel Used (DGE) 145 116 261
Trash Cans Picked 416 2110 2526
Trash Collected (tons) 105 28 133

22
Route of Roll-off 3
170 miles 7 cans
52 tons

23
Route of Front-loader 2
157 miles 110 cans 28.3 tons
24
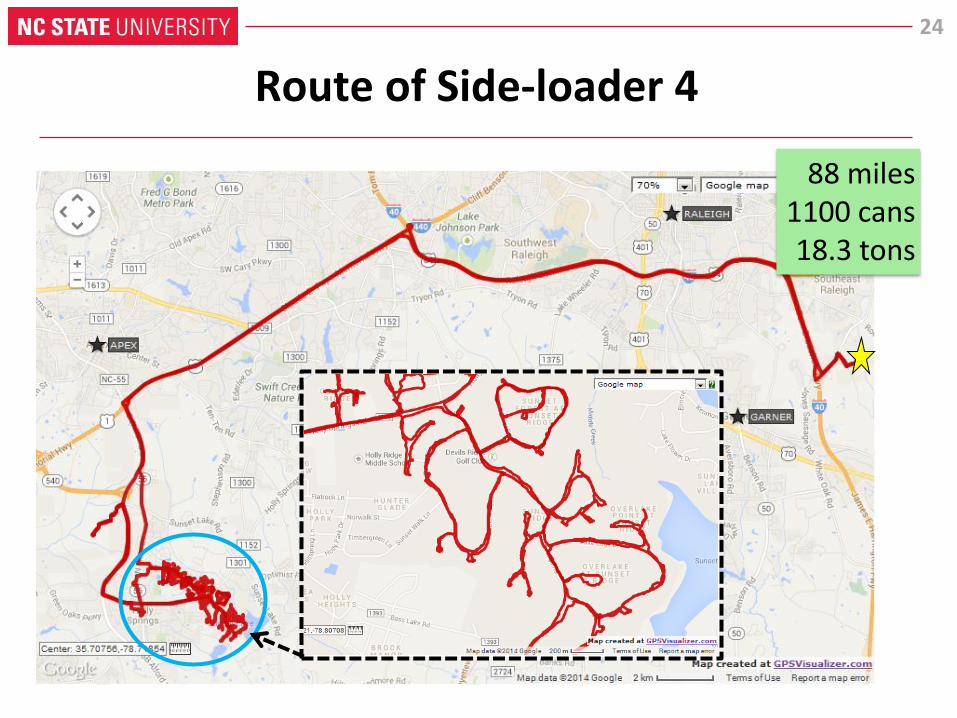
Route of Side-loader 4
88 miles 1100 cans 18.3 tons

25
Speed Trace for One Trip of Roll-off 3
U = Urban (arterial) driving, no trash collection; H = Highway driving; L = Landfill; TC = Trash Collection
0
20
40
60
80
0 1000 2000 3000 4000 5000
Sp
eed
(m
ph
)
Time (seconds)
U H U TC H UU L
1 can
26
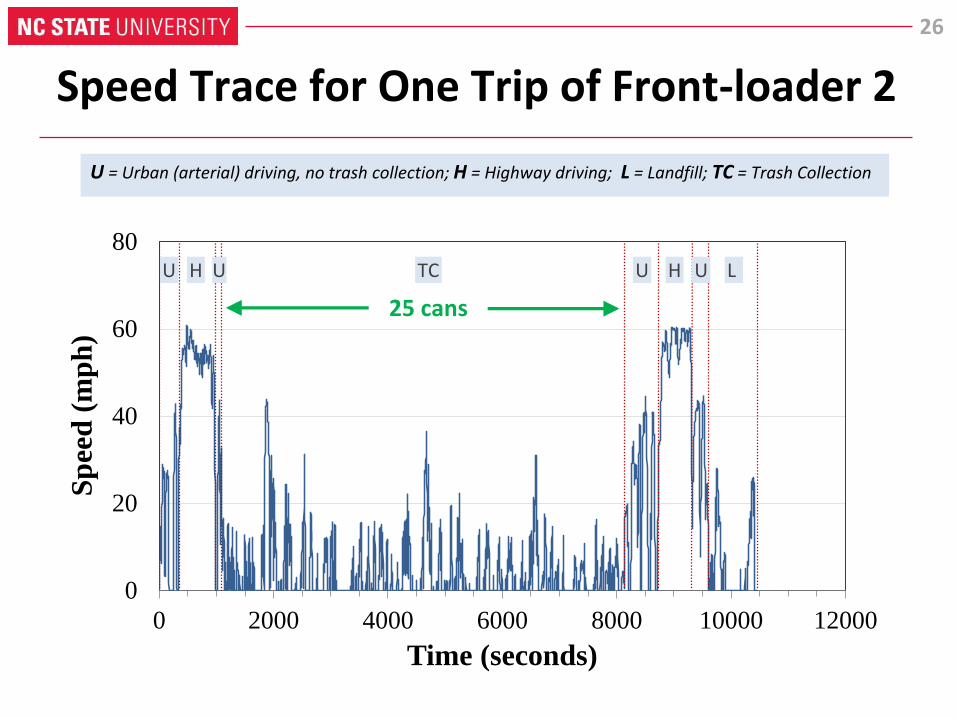
Speed Trace for One Trip of Front-loader 2
U = Urban (arterial) driving, no trash collection; H = Highway driving; L = Landfill; TC = Trash Collection
0
20
40
60
80
0 2000 4000 6000 8000 10000 12000
Sp
eed
(m
ph
)
Time (seconds)
U H U TC H UU L
25 cans

27
Speed Trace for One Trip of Side-loader 4
U = Urban (arterial) driving, no trash collection; H = Highway driving; L = Landfill; TC = Trash Collection
0
20
40
60
80
0 4000 8000 12000 16000
Sp
eed
(m
ph
)
Time (seconds)
U H U TC U L
450 cans

28
Comparison of Duty Cycles: Diesel vs CNG
0
20
40
60
80
0 1 11 12 13 14 15 16 21 22 23 24 25 27 28 29 30 33 35 37 38 39 40
% T
ime
Sp
en
t in
Op
Mo
de
MOVES Operating Mode
NCSU Diesel Front-L RT
NCSU CNG Front-L RT
NCSU Diesel Side-L RT
NCSU CNG Side-L RT
1 mph ≤ Speed < 25 mph 25 mph ≤ Speed < 50 mph 50 mph ≤ Speed
Idlin
gD
ecel
erat
ing
Within a speed range, higher modes represent greater engine power demand

29
Comparison of Duty Cycles: NCSU vs Literature
0
20
40
60
80
0 1 11 12 13 14 15 16 21 22 23 24 25 27 28 29 30 33 35 37 38 39 40
% T
ime
Sp
en
t in
Op
Mo
de
MOVES Operating Mode
NCSU Roll-off RT
NCSU Front-loader RT
NCSU Side-loader RT
Central Business District
New York Garbage Truck
1 mph ≤ Speed < 25 mph 25 mph ≤ Speed < 50 mph 50 mph ≤ Speed
Idlin
gD
ecel
erat
ing
Within a speed range, higher modes represent greater engine power demand
30
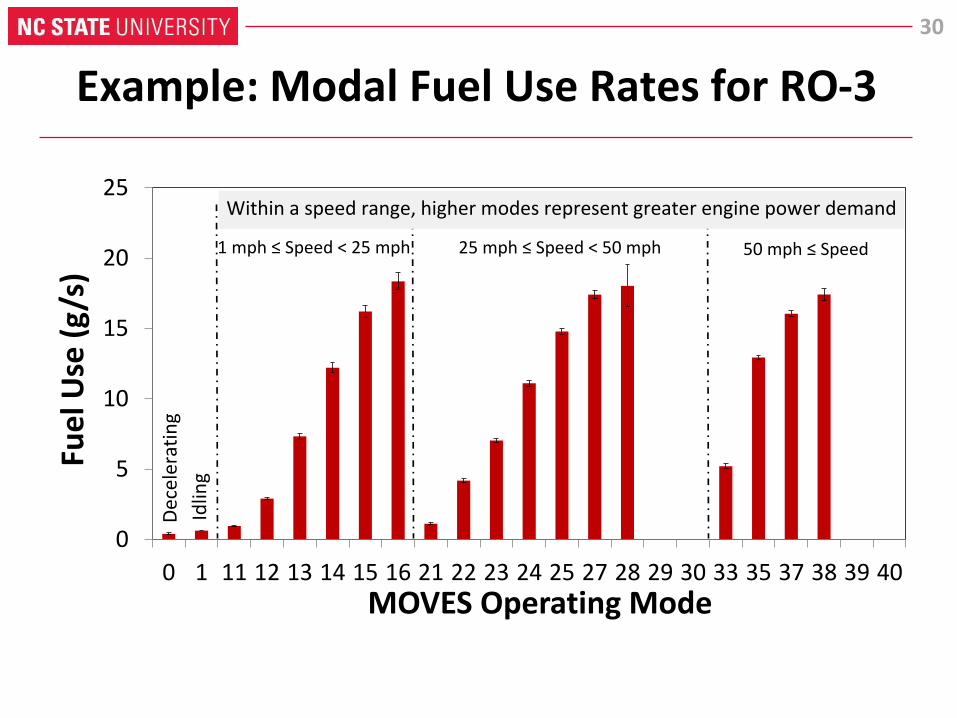
Example: Modal Fuel Use Rates for RO-3
0
5
10
15
20
25
0 1 11 12 13 14 15 16 21 22 23 24 25 27 28 29 30 33 35 37 38 39 40
Fue
l Use
(g
/s)
MOVES Operating Mode
1 mph ≤ Speed < 25 mph 25 mph ≤ Speed < 50 mph 50 mph ≤ Speed
Idlin
g
Dec
eler
atin
g
Within a speed range, higher modes represent greater engine power demand

31
Diesel Fuel Use Rates for Observed Cycles
g/s mi/gal
RO-1 3.0 4.5
RO-2 2.6 4.0
RO-3 3.6 4.0
RO-4 3.1 3.9
RO-5 2.4 6.0
RO-6 2.5 4.9
TruckFuel
Roll-off
Average: 4.6 Max/Min: 1.5
g/s mi/gal
FL-1 5.1 3.2
FL-2 3.8 2.6
FL-3 4.9 2.1
FL-4 3.5 2.4
FL-5 4.5 2.6
FL-6 3.8 2.3
TruckFuel
Front-loader
Average: 2.6 Max/Min: 1.5
g/s mi/gal
SL-1 3.8 2.8
SL-2 3.9 2.1
SL-3 2.5 3.3
SL-4 4.0 2.0
SL-5 2.1 3.1
SL-6 2.0 4.2
TruckFuel
Side-loader
Average: 2.9 Max/Min: 2.1

32
Diesel Fuel Use Rates for Average Cycle
g/s mi/gal
FL-1 4.3 2.5
FL-2 4.1 2.6
FL-3 4.5 2.4
FL-4 4.0 2.8
FL-5 4.4 2.5
FL-6 4.3 2.5
TruckFuel
Front-loader
Max/Min: 1.2
g/s mi/gal
RO-1 2.9 4.4
RO-2 3.1 4.2
RO-3 3.3 3.9
RO-4 3.0 4.4
RO-5 2.4 5.5
RO-6 2.6 4.9
TruckFuel
Roll-off
Max/Min: 1.4
g/s mi/gal
SL-1 3.5 2.3
SL-2 4.2 2.0
SL-3 2.3 3.6
SL-4 3.7 2.2
SL-5 2.6 3.2
SL-6 2.0 4.0
TruckFuel
Side-loader
Max/Min: 2.0

33
CNG Fuel Use Rates for Observed Cycles
Front-loader
Average: 2.3 Max/Min: 1.2
Side-loader
Average: 1.5 Max/Min: 1.8
g/s mi/DGE
FLC-1 3.4 2.3
FLC-2 3.7 2.6
FLC-3 3.5 2.1
TruckFuel
g/s mi/DGE
SLC-1 2.6 1.1
SLC-2 3.7 2.0
SLC-3 2.4 1.5
TruckFuel
Diesel Avg: 2.6 Diesel Avg: 2.9
CNG fuel use rates are based on preliminary data analysis

34
CNG Fuel Use Rates for Average Cycle
Front-loader
Max/Min: 1.0
Side-loader
Max/Min: 1.3
g/s mi/DGE
FLC-1 3.5 2.3
FLC-2 3.5 2.3
FLC-3 3.5 2.3
FuelTruck
g/s mi/DGE
SLC-1 2.8 1.6
SLC-2 3.3 1.4
SLC-3 2.6 1.8
FuelTruck
CNG fuel use rates are based on preliminary data analysis

35
Exploratory Analysis: Diesel Fuel Use, SL-1

36
Exploratory Analysis: Diesel NOx Rates, SL-1

37
Conclusions for Duty Cycles
Refuse truck duty cycles vary with configuration and are different from cycles used in previous studies.
EPA’s MOVES model should include at least one refuse truck duty cycle.

38
Conclusions for Fuel Use Rates
A higher value for fuel economy must be considered for roll-off configurations.
On average, compared to diesel, CNG trucks have lower fuel economy.
Overall fuel economy is not adversely affected by emissions controls; the adverse effect (if any) of only the emissions control device is offset by other efficiency measures.

39
Acknowledgements
This work is sponsored by the Environmental Research and Education Foundation (EREF).
Waste Industries (WI) provided refuse trucks for measurement at their Garner and Durham facilities in North Carolina, with extensive support from management staff, technical staff, and drivers.


41
ADDITIONAL MATERIAL

42
MOVES STP References
Development of Emission Rates for Heavy-Duty Vehicles in the Motor Vehicle Emissions Simulator MOVES2010. US EPA; 420-B-12-049; August 2012.
Development of Emission Rates for Light-Duty Vehicles in the Motor Vehicle Emissions Simulator (MOVES2010). US EPA; 420-R-11-011; August 2011.
MOVES2010 Highway Vehicle: Population and Activity Data. US EPA; 420-R-10-026; November 2010.