comparison of modern cng, diesel and diesel hybrid ... diesel hybrid... · comparison of modern...
TRANSCRIPT
Comparison of Modern CNG, Diesel and Diesel Hybrid-Electric Transit Buses:
Efficiency & Environmental Performance
CONCORD, MA - WASHINGTON, DC
47 JUNCTION SQUARE DRIVE CONCORD, MA 01742 978-405-1275 www.mjbradley.com

Comparison of Modern CNG, Diesel, and Diesel Hybrid-Electric Transit Buses
1 | P a g e
Table of Contents
Executive Summary......................................................................................................................... 2
1 Data Sources and Methodology .............................................................................................. 5
2 Results.................................................................................................................................... 10
2.1 Fuel Economy ................................................................................................................. 10
2.2 Emissions ........................................................................................................................ 12
2.1.1 Criteria Pollutants ................................................................................................... 12
2.1.2 Green House Gases ................................................................................................. 15
Appendix A Tabular Summary of Fuel Economy & Emissions
List of Figures
Figure 1 Altoona Measured Fuel Economy – New Flyer Buses .................................................... 10
Figure 2 Altoona Measured Fuel Economy – Daimler Buses ........................................................ 11
Figure 3 Altoona Measured NOx Emissions .................................................................................. 12
Figure 4 Altoona Measured PM Emissions ................................................................................... 13
Figure 5 Altoona Measured NMHC Emissions .............................................................................. 14
Figure 6 Altoona Measured CO Emissions .................................................................................... 14
Figure 7 Estimated Long-term Wells –to-Wheels GHG Emissions – New Flyer Buses ................. 16
Figure 8 Estimated Long-term Wells –to-Wheels GHG Emissions – Daimler Buses ..................... 16
Figure 9 Estimated Short-term Wells –to-Wheels GHG Emissions – New Flyer Buses ................ 17
Figure 10 Estimated Short-term Wells –to-Wheels GHG Emissions – Daimler Buses.................. 17
List of Tables
Table 1 40-foot Transit Buses Tested at ABRTC Since 2010 ........................................................... 5
Table 2 Specification of Buses Included in This Analysis ............................................................... 6
Table 3 Test Cycles Used by Altoona Bus Research & Testing Center............................................ 7
Table 4 GWP Values Used in the Analysis ...................................................................................... 8
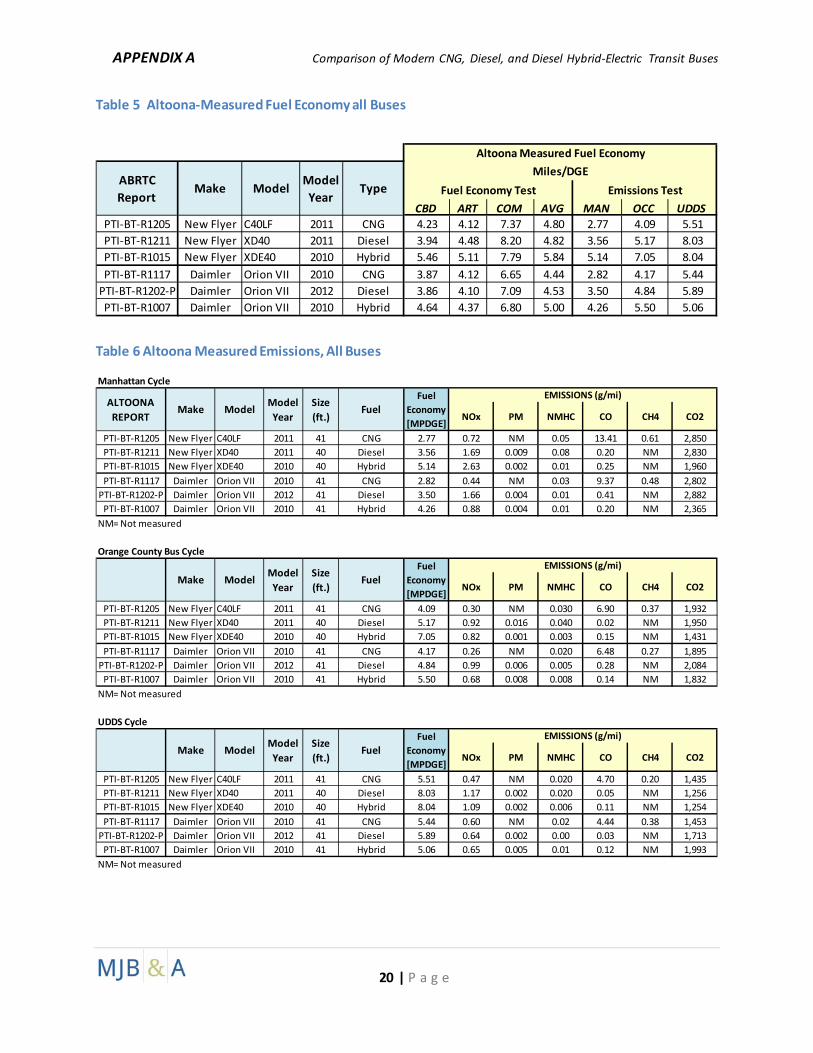
Table 5 Altoona-Measured Fuel Economy all Buses .................................................................... 20
Table 6 Altoona Measured Emissions, All Buses........................................................................... 20
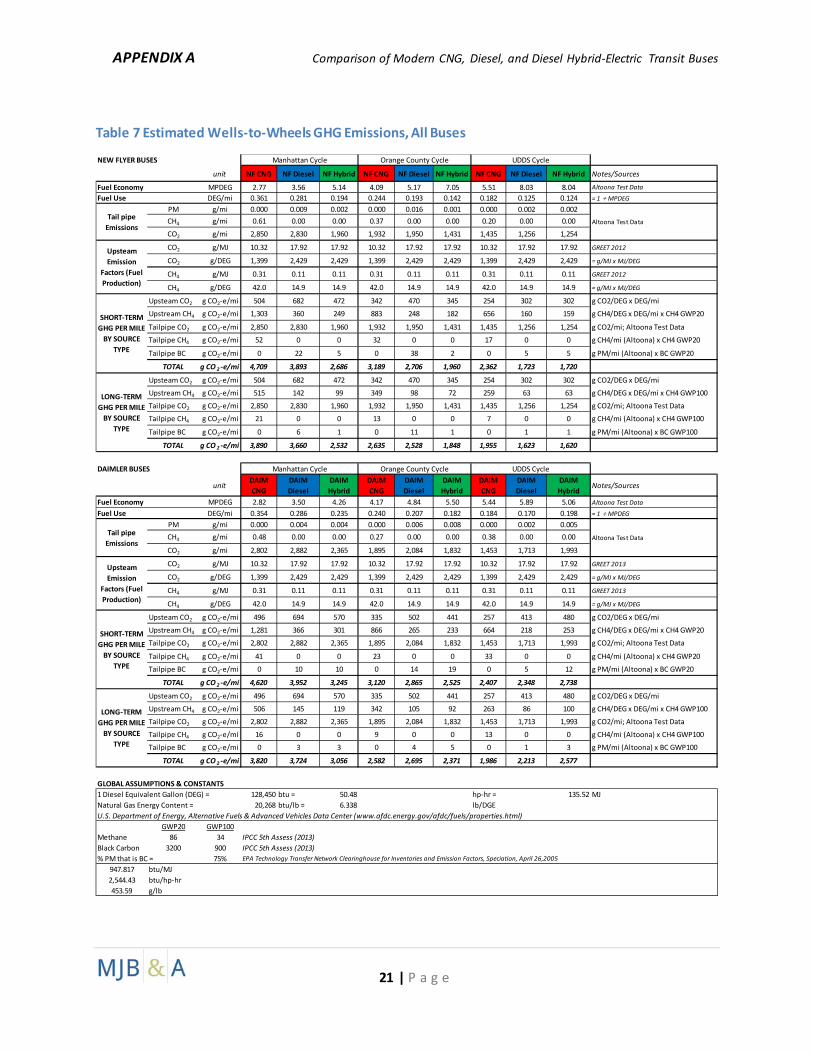
Table 7 Estimated Wells-to-Wheels GHG Emissions, All Buses ............................................................. 21

Comparison of Modern CNG, Diesel, and Diesel Hybrid-Electric Transit Buses
2 | P a g e
Executive Summary
Transit managers today face complex decisions about what fuels and propulsion technologies to commit to for their fleets when purchasing new buses. There are two main engine/fuel options: 1) compression-ignition engines that operate on diesel fuel, and 2) spark-ignition engines that operate on natural gas. Both of these options are readily available commercially and are already well established in the transit industry. According to the Public Transportation Association there are more than 47,000 transit buses currently in service that burn diesel fuel and more than 12,000 that operate on natural gas 1. Most natural gas powered transit buses store on-board fuel as a high-pressure compressed gas, so called “compressed natural gas”, or CNG2.
There are also two main options for propulsion system technology: 1) a traditional automatic transmission, and 2) a hybrid-electric system3. A hybrid-electric system combines one or more electric motors/generators with an energy storage system, power electronics, and controls to either replace or supplement an automatic or automated manual transmission. The use of a hybrid-electric propulsion system allows for collection and re-use of kinetic energy normally wasted in braking, and may allow for engine down-sizing and partial electric-only operation, including engine shut-off at idle. All of this can result in reduced fuel use compared to a bus equipped with an automatic transmission. The transit bus industry was the first major heavy-duty vehicle market to implement hybrid-electric technology, and today there are more than 4,500 hybrid-electric transit buses in service1.
When evaluating the choice of fuel and technology there are many factors to consider, both economic and environmental. This report focuses on the environmental considerations of transit bus fuel and technology choice, including three issues at the forefront of current US policy: efficiency, air quality, and climate change. This report compares the efficiency and environmental performance of modern transit buses equipped with the three most common engine/propulsion system options: diesel, hybrid diesel-electric (hybrid), and compressed natural gas (CNG)3. All of the data used to compare these transit bus technology options was collected by the Altoona Bus Research & Testing Center under the Federal Transit 1 American Public Transportation Association, 2011 Public Transportation Fact Book, 62nd Edition, April 2011 2 It is also possible to store and use natural gas in the form of a cryogenic l iquid, so called l iquefied natural gas, or LNG. Typically natural gas vehicles only store onboard fuel as LNG if more than 400 miles range between fueling events is required. Only a minority of current natural gas buses are LNG buses. 3 Fully electric buses that store on-board energy in chemical batteries that are re-charged from the grid, and which do not include an internal combustion engine, are also beginning to become avai lable on a l imited commercial basis. These types of buses were not included in this analysis because comparative ABRTC test data was not available.
Comparison of Modern CNG, Diesel, and Diesel Hybrid-Electric Transit Buses
3 | P a g e
Administration’s new model bus testing program. For each bus fuel economy (miles per diesel gallon equivalent, MPDGE) was measured on seven different test cycles with average speed ranging from 6.8 MPH to 38.0 MPH. Emissions of nitrogen oxides (NOx), particulate matter (PM), non-methane hydrocarbons (NMHC), methane (CH4), carbon monoxide (CO), and carbon dioxide (CO2) were measured on three test cycles with average speed ranging from 6.8 MPH to 18.9 MPH.
Two sets of buses are compared, which represent the full suite of technology options as implemented on two different bus platforms by two different manufacturers. All of the tested buses were equipped with EPA 2010 compliant engines and are therefore representative of expected performance from new buses purchased in the future.
The results of the comparison, as described more fully in section 2, indicate that:
EFFICIENCY & FUEL CONSUMPTION
• CNG and diesel buses have similar over-all drivetrain efficiency. Of 14 direct comparisons (diesel and CNG versions on the same bus platform) the diesel bus had higher fuel economy over ten different tests, while the CNG bus had higher fuel economy on one test and the diesel and CNG versions had virtually identical fuel economy on three tests.
• Hybrid buses consistently have higher average fuel economy than the diesel and CNG versions of the same bus platform on slow- and medium-speed test cycles (< 18 MPH); on these cycles average fuel economy of the hybrid buses was between 7% and 44% higher than the average fuel economy of the diesel version of the same bus. On higher-speed test cycles the hybrid buses generally have the same or lower average fuel economy than the diesel version of the same bus. On slow- and medium-speed duty cycles the annual fuel savings from operating new hybrid buses instead of new diesel buses could be as high as 3,100 gallons per bus. According to data reported to the National Transit Database, approximately 75% of U.S. transit agencies, and 90% of U.S. transit buses on average operate in slow- and medium-speed duty cycles (<16 MPH).
AIR QUALITY
• CNG buses consistently have lower NOx emissions and higher CO emissions than diesel and hybrid buses across all duty cycles. Annual reductions in NOx emissions from operating new CNG buses instead of new diesel buses could be as high as 82 pounds per bus. Annual increases in CO emissions from operating new CNG buses instead of new diesel buses could be as high as 1,000 pounds per bus.
• Hybrid buses generally have slightly lower NOx emissions than diesel buses, but on several tests hybrid NOx emissions were higher than from the diesel version of the same bus.
Comparison of Modern CNG, Diesel, and Diesel Hybrid-Electric Transit Buses
4 | P a g e
• Diesel and hybrid buses both have very low PM emissions, equivalent to only about one third or less of the allowable EPA standard. PM was not measured for the CNG buses.
• All three technologies have very low NMHC emissions, equivalent to only about one fourth or less of the allowable EPA standard.
CLIMATE IMPACTS
• Diesel and CNG buses emit very similar levels of CO2 from their tailpipes (g/mi); while natural gas has lower carbon content than diesel fuel this advantage is eroded by generally higher fuel economy for diesels. This result is different than reported results for other heavy-duty vehicles (for example long-haul trucks) due to differences in engine technology and duty cycle. Hybrid buses generally emit lower CO2 (g/mi) than diesel or CNG buses due to their higher fuel economy.
• Total wells-to-wheels GHG emissions (g CO2-e/mi) are generally slightly higher from CNG buses than from diesel buses, due primarily to the “upstream” impact of methane emissions from natural gas production and processing. The increase in total annual GHG emissions from operating new CNG buses instead of new diesel buses could be as high as 13.3 tons CO2-e per bus.
• Total wells-to-wheels GHG emissions are generally lower from hybrid buses than from diesel or CNG buses due to their higher fuel economy. The reduction in total annual GHG emissions from operating new hybrid buses instead of new CNG buses could be as high as 54.5 tons CO2-e per bus.
Comparison of Modern CNG, Diesel, and Diesel Hybrid-Electric Transit Buses
5 | P a g e
1 Data Sources and Methodology
This analysis uses data on fuel economy and exhaust emissions from different transit bus models, which was collected at the Altoona Bus Research & Testing Center (ABRTC), in Altoona PA. The ABRTC conducts required testing for all new transit bus models under the Federal Transit Administration’s new model bus testing program. The goal of ABRTC is to “ensure better reliability and in-service performance of transit buses by providing an unbiased and accurate comparison of bus models through the use of an established set of test procedures” 4.
The ABRTC conducts tests on a range of bus types, from 20-foot shuttle buses to 60-foot articulated transit buses. This analysis focuses only on 40-41 foot low floor transit buses; this bus type makes up approximately 62% of the current U.S. fleet used for fixed-route service5. In addition, the intent of this analysis is to compare the efficiency and environmental performance of new buses that will be purchased in the future, so we have only included data from tests conducted since 2010 when the most stringent EPA emission standards went into effect; all of the buses included in this analysis were equipped with engines complaint with EPA 2010 standards.
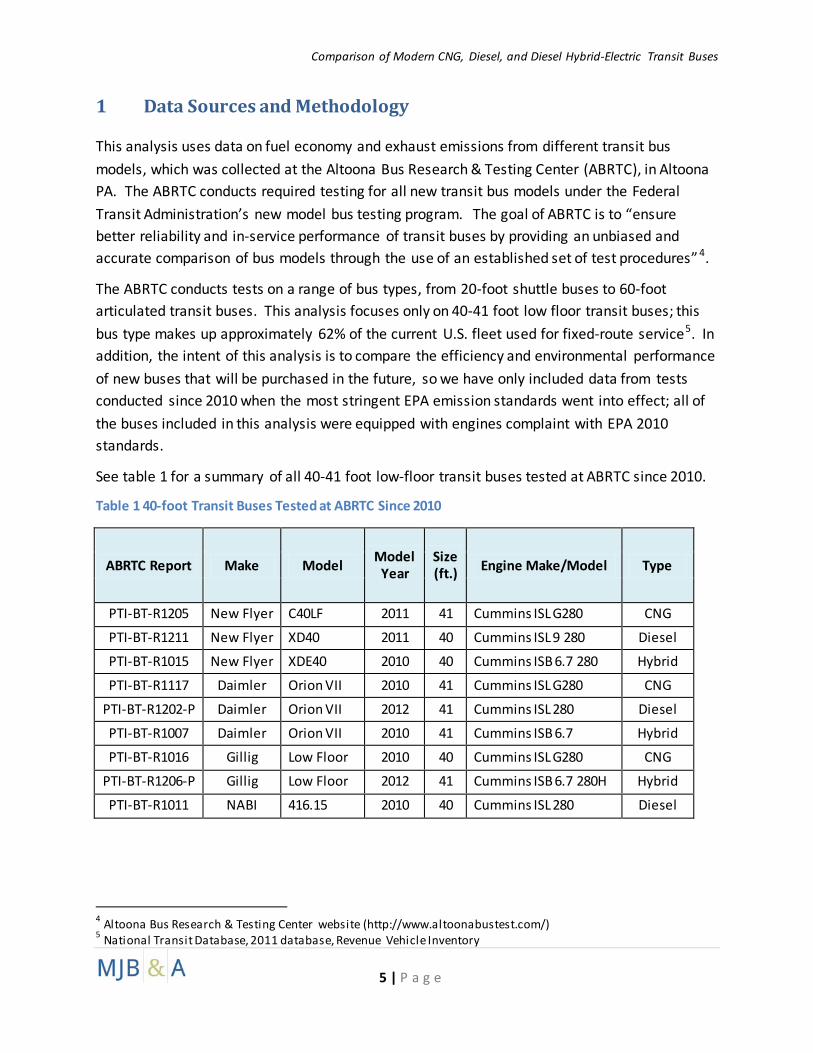
See table 1 for a summary of all 40-41 foot low-floor transit buses tested at ABRTC since 2010.
Table 1 40-foot Transit Buses Tested at ABRTC Since 2010
ABRTC Report Make Model Model Year
Size (ft.) Engine Make/Model Type
PTI-BT-R1205 New Flyer C40LF 2011 41 Cummins ISL G280 CNG
PTI-BT-R1211 New Flyer XD40 2011 40 Cummins ISL 9 280 Diesel
PTI-BT-R1015 New Flyer XDE40 2010 40 Cummins ISB 6.7 280 Hybrid
PTI-BT-R1117 Daimler Orion VII 2010 41 Cummins ISL G280 CNG
PTI-BT-R1202-P Daimler Orion VII 2012 41 Cummins ISL 280 Diesel
PTI-BT-R1007 Daimler Orion VII 2010 41 Cummins ISB 6.7 Hybrid
PTI-BT-R1016 Gillig Low Floor 2010 40 Cummins ISL G280 CNG
PTI-BT-R1206-P Gillig Low Floor 2012 41 Cummins ISB 6.7 280H Hybrid
PTI-BT-R1011 NABI 416.15 2010 40 Cummins ISL 280 Diesel
4 Altoona Bus Research & Testing Center website (http://www.altoonabustest.com/) 5 National Transit Database, 2011 database, Revenue Vehicle Inventory
Comparison of Modern CNG, Diesel, and Diesel Hybrid-Electric Transit Buses
6 | P a g e
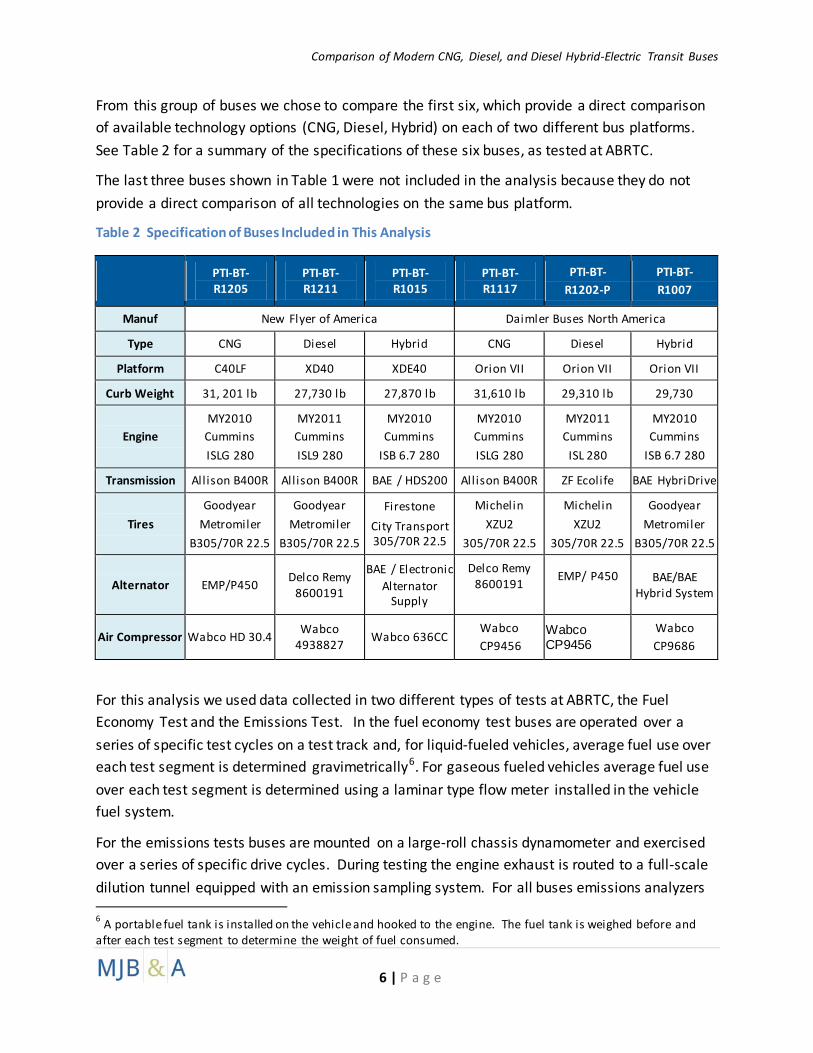
From this group of buses we chose to compare the first six, which provide a direct comparison of available technology options (CNG, Diesel, Hybrid) on each of two different bus platforms. See Table 2 for a summary of the specifications of these six buses, as tested at ABRTC.
The last three buses shown in Table 1 were not included in the analysis because they do not provide a direct comparison of all technologies on the same bus platform.
Table 2 Specification of Buses Included in This Analysis
PTI-BT-R1205
PTI-BT-R1211
PTI-BT-R1015
PTI-BT-R1117
PTI-BT- R1202-P
PTI-BT- R1007
Manuf New Flyer of America Daimler Buses North America
Type CNG Diesel Hybrid CNG Diesel Hybrid
Platform C40LF XD40 XDE40 Orion VII Orion VII Orion VII
Curb Weight 31, 201 lb 27,730 lb 27,870 lb 31,610 lb 29,310 lb 29,730
Engine MY2010
Cummins ISLG 280
MY2011 Cummins ISL9 280
MY2010 Cummins
ISB 6.7 280
MY2010 Cummins ISLG 280
MY2011 Cummins
ISL 280
MY2010 Cummins
ISB 6.7 280
Transmission Allison B400R All ison B400R BAE / HDS200 All ison B400R ZF Ecolife BAE HybriDrive
Tires Goodyear
Metromiler B305/70R 22.5
Goodyear Metromiler
B305/70R 22.5
Firestone City Transport 305/70R 22.5
Michelin XZU2
305/70R 22.5
Michelin XZU2
305/70R 22.5
Goodyear Metromiler
B305/70R 22.5
Alternator EMP/P450 Delco Remy 8600191
BAE / Electronic Alternator
Supply
Delco Remy 8600191
EMP/ P450
BAE/BAE Hybrid System
Air Compressor Wabco HD 30.4 Wabco 4938827 Wabco 636CC
Wabco CP9456
Wabco CP9456
Wabco CP9686
For this analysis we used data collected in two different types of tests at ABRTC, the Fuel Economy Test and the Emissions Test. In the fuel economy test buses are operated over a series of specific test cycles on a test track and, for liquid-fueled vehicles, average fuel use over each test segment is determined gravimetrically6. For gaseous fueled vehicles average fuel use over each test segment is determined using a laminar type flow meter installed in the vehicle fuel system.
For the emissions tests buses are mounted on a large-roll chassis dynamometer and exercised over a series of specific drive cycles. During testing the engine exhaust is routed to a full-scale dilution tunnel equipped with an emission sampling system. For all buses emissions analyzers 6 A portable fuel tank is installed on the vehicle and hooked to the engine. The fuel tank is weighed before and after each test segment to determine the weight of fuel consumed.
Comparison of Modern CNG, Diesel, and Diesel Hybrid-Electric Transit Buses
7 | P a g e
are used to determine average emissions (grams per mile, g/mi) of oxides of nitrogen (NOx), carbon monoxide (CO), carbon dioxide (CO2), and hydrocarbons (HC) over each drive cycle. For diesel fueled buses particulate matter (PM) is also measured, and for natural gas fueled buses methane (CH4) is measured. ABRTC does not measure PM emissions from CNG buses or methane emission from diesel buses. From measured CO2 emissions average fuel use over each drive cycle is determined based on carbon balance7.
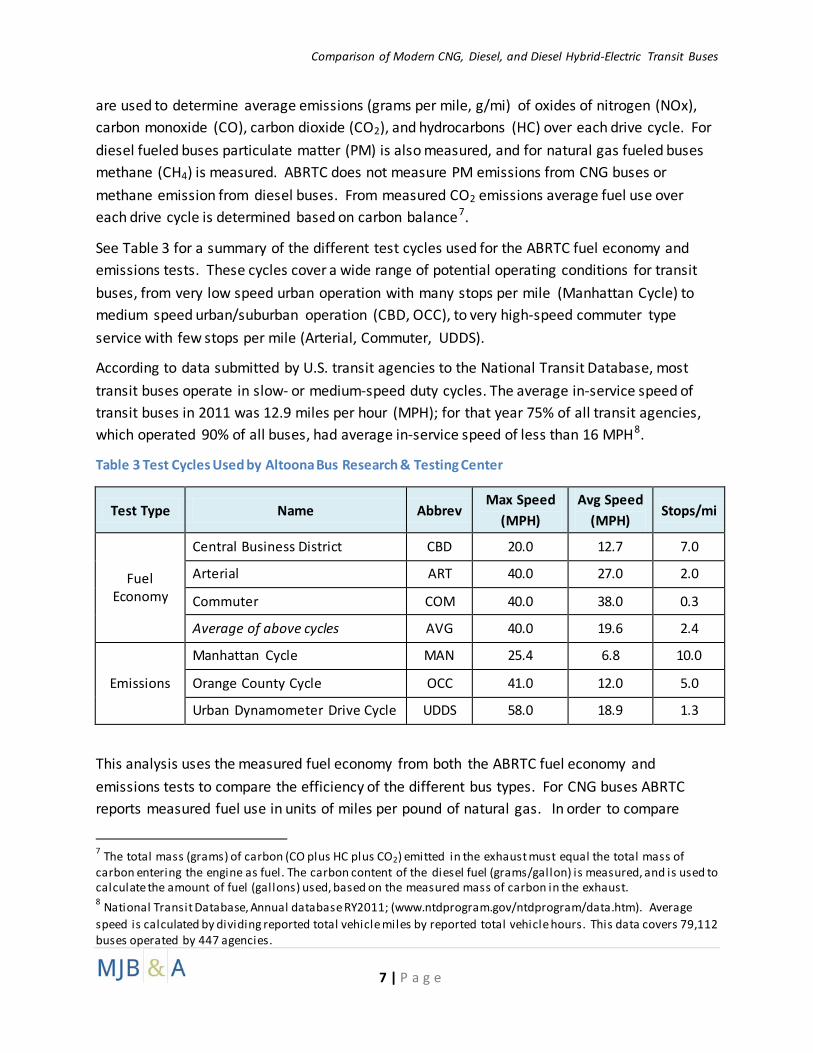
See Table 3 for a summary of the different test cycles used for the ABRTC fuel economy and emissions tests. These cycles cover a wide range of potential operating conditions for transit buses, from very low speed urban operation with many stops per mile (Manhattan Cycle) to medium speed urban/suburban operation (CBD, OCC), to very high-speed commuter type service with few stops per mile (Arterial, Commuter, UDDS).
According to data submitted by U.S. transit agencies to the National Transit Database, most transit buses operate in slow- or medium-speed duty cycles. The average in-service speed of transit buses in 2011 was 12.9 miles per hour (MPH); for that year 75% of all transit agencies, which operated 90% of all buses, had average in-service speed of less than 16 MPH8.
Table 3 Test Cycles Used by Altoona Bus Research & Testing Center
Test Type Name Abbrev Max Speed
(MPH) Avg Speed
(MPH) Stops/mi
Fuel Economy
Central Business District CBD 20.0 12.7 7.0
Arterial ART 40.0 27.0 2.0
Commuter COM 40.0 38.0 0.3
Average of above cycles AVG 40.0 19.6 2.4
Emissions
Manhattan Cycle MAN 25.4 6.8 10.0
Orange County Cycle OCC 41.0 12.0 5.0
Urban Dynamometer Drive Cycle UDDS 58.0 18.9 1.3
This analysis uses the measured fuel economy from both the ABRTC fuel economy and emissions tests to compare the efficiency of the different bus types. For CNG buses ABRTC reports measured fuel use in units of miles per pound of natural gas. In order to compare
7 The total mass (grams) of carbon (CO plus HC plus CO2) emitted in the exhaust must equal the total mass of carbon entering the engine as fuel. The carbon content of the diesel fuel (grams/gallon) is measured, and is used to calculate the amount of fuel (gallons) used, based on the measured mass of carbon in the exhaust. 8 National Transit Database, Annual database RY2011; (www.ntdprogram.gov/ntdprogram/data.htm). Average speed is calculated by dividing reported total vehicle miles by reported total vehicle hours. This data covers 79,112 buses operated by 447 agencies.
Comparison of Modern CNG, Diesel, and Diesel Hybrid-Electric Transit Buses
8 | P a g e
directly to diesel and hybrid buses, for this report these values were converted to units of miles per diesel gallon equivalent (MPDGE) using standard values of 128,450 btu/gallon for #2 diesel fuel and 20,269 btu/lb for natural gas 9.
To compare the environmental performance of the different bus types (g/mi emissions of NOx, PM, HC, CH4, CO, CO2, GHG) this analysis uses data from the ABRTC emissions tests only.
For each bus the following greenhouse gases (GHGs) are included in the analysis: carbon dioxide (CO2) and methane (CH4). In addition, for diesel buses the analysis includes the atmospheric warming effect of black carbon (BC) emitted from the tailpipe as particulate matter (PM)10. This analysis assumes that 75% of the mass of PM emitted by diesel engines is BC11. While CNG buses also typically emit a small amount of PM and BC from their tailpipes the ABRTC test data does not include PM emissions from the tested CNG buses, so it was not included.
In this analysis emissions of CH4 and BC are converted to “carbon dioxide equivalents” (CO2-e) using their “global warming potential” (GWP)12. For each bus, total GHGs per mile are calculated using equation 1:
Total GHG (CO2-e) [g/mi] = CO
2 [g/mi] + (GWP
CH4 x CH
4 [g/mi]) + (GWP
BC x BC [g/mi])
Equation 1
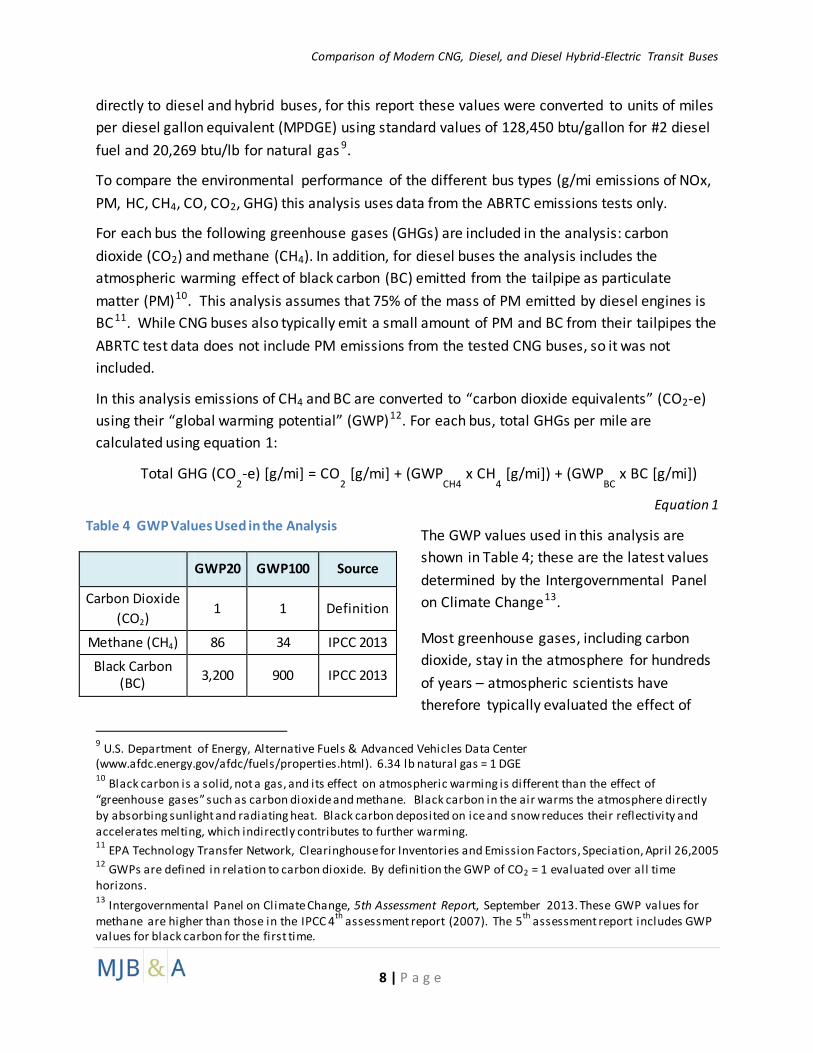
The GWP values used in this analysis are shown in Table 4; these are the latest values determined by the Intergovernmental Panel on Climate Change13.
Most greenhouse gases, including carbon dioxide, stay in the atmosphere for hundreds of years – atmospheric scientists have therefore typically evaluated the effect of
9 U.S. Department of Energy, Alternative Fuels & Advanced Vehicles Data Center (www.afdc.energy.gov/afdc/fuels/properties.html). 6.34 lb natural gas = 1 DGE 10 Black carbon is a solid, not a gas, and its effect on atmospheric warming is different than the effect of “greenhouse gases” such as carbon dioxide and methane. Black carbon in the air warms the atmosphere directly by absorbing sunlight and radiating heat. Black carbon deposited on ice and snow reduces their reflectivity and accelerates melting, which indirectly contributes to further warming. 11 EPA Technology Transfer Network, Clearinghouse for Inventories and Emission Factors, Speciation, April 26,2005 12 GWPs are defined in relation to carbon dioxide. By definition the GWP of CO2 = 1 evaluated over all time horizons. 13 Intergovernmental Panel on Climate Change, 5th Assessment Report, September 2013. These GWP values for methane are higher than those in the IPCC 4th assessment report (2007). The 5th assessment report includes GWP values for black carbon for the first time.
GWP20 GWP100 Source
Carbon Dioxide (CO2)
1 1 Definition
Methane (CH4) 86 34 IPCC 2013
Black Carbon (BC) 3,200 900 IPCC 2013
Table 4 GWP Values Used in the Analysis
Comparison of Modern CNG, Diesel, and Diesel Hybrid-Electric Transit Buses
9 | P a g e
GHGs over a 100-year time horizon, using GWP100. Recently, however, there has been growing evidence of the importance of “short-term climate forcers”, including both CH4 and BC, acting over a much shorter time horizon14. For that reason we have chosen to provide estimates of total GHGs from all buses using both a 20-year (GWP20) and 100-year (GWP100) time horizon – these are designated in this report as “short-term GHGs” and “long-term GHGs”, respectively. As shown in Table 4, in the short term one pound of methane emitted to the atmosphere has 86 times the warming potential of one pound of carbon dioxide (GWP20 = 86), while in the long term it has only 34 times the warming potential (GWP100 = 34). Black carbon is an even more potent climate warmer, particularly in the short term. Over a 20-year time horizon one pound of BC emitted into the atmosphere is estimated to have 3,200 times the warming potential of one pound of CO2.
When evaluating the total greenhouse gases (GHG) emitted by each bus type we included emissions from the bus tailpipe (as measured by ABRTC) as well as estimated “upstream” emissions from recovery, production and transport of the fuel used by the bus – this provides a “total fuel cycle” or “wells-to-wheels” view of GHG emissions. Data on estimated upstream emissions was taken from the Greenhouse Gases, Regulated Emissions, and Energy Use in Transportation (GREET) model developed by the Argonne National Laboratory15. National level default values for each fuel pathway were used to calculate CO2 and CH4 emissions (grams per megajoule, g/MJ) for the production of diesel fuel (for diesel and hybrid buses) and for the production of compressed natural gas (for CNG buses). These values were converted to mass of emissions per unit of fuel used (grams per diesel gallon equivalent, g/DGE) using a standard value of 135.52 MJ/gallon for diesel fuel16.
To evaluate potential annual fuel and emission savings from operating one type of bus compared to another, this analysis used 36,424 miles per year per bus. This is the average annual mileage for all U.S. transit buses, as reported by the American Public Transportation Association17.
14 Bond, T.C., et al, Bounding the role of black carbon in the climate system: A scientific assessment, Journal of Geophysical Research; Atmospheres, Volume 118, Issue 11, June 6, 2013 15 GREET 1 2013, October 25, 2013 16 U.S. Department of Energy, Alternative Fuels & Advanced Vehicles Data Center (www.afdc.energy.gov/afdc/fuels/properties.html) 17 American Public Transportation Association, 2012 Public Transportation Fact Book, Tables 7 and 8

Comparison of Modern CNG, Diesel, and Diesel Hybrid-Electric Transit Buses
10 | P a g e
2 Results
2.1 Fuel Economy
See Figure 1 for a comparison of ABRTC measured fuel economy from the CNG, diesel, and hybrid New Flyer buses and Figure 2 for measured fuel economy from the CNG, diesel, and hybrid Daimler buses. As shown, for 14 sets of measurements (two sets of buses times seven test cycles each), the diesel bus had higher fuel economy (MPDGE) than the CNG bus (same bus platform) on ten different tests , the CNG bus had higher fuel economy on one test, and the diesel and CNG buses had virtually identical fuel economy on three tests. For the test cycles over which the diesel bus had higher fuel economy than the CNG bus the increase in fuel economy ranged from 7% (Daimler buses on Commuter Cycle) to 46% (New Flyer buses on UDDS Cycle). For the test in which the CNG bus had higher fuel economy (New Flyer on CBD cycle) the increase in MPDGE was 7%.
Based on the data shown in Figure 1 and 2, a CNG bus with average annual mileage (36,424 miles per year) could use between 600 gallons less and 2,900 gallons18 more fuel annually than a diesel bus depending on the bus platform and duty cycle.
Figure 1 Altoona Measured Fuel Economy – New Flyer Buses
18 Diesel gallon equivalents
Comparison of Modern CNG, Diesel, and Diesel Hybrid-Electric Transit Buses
11 | P a g e
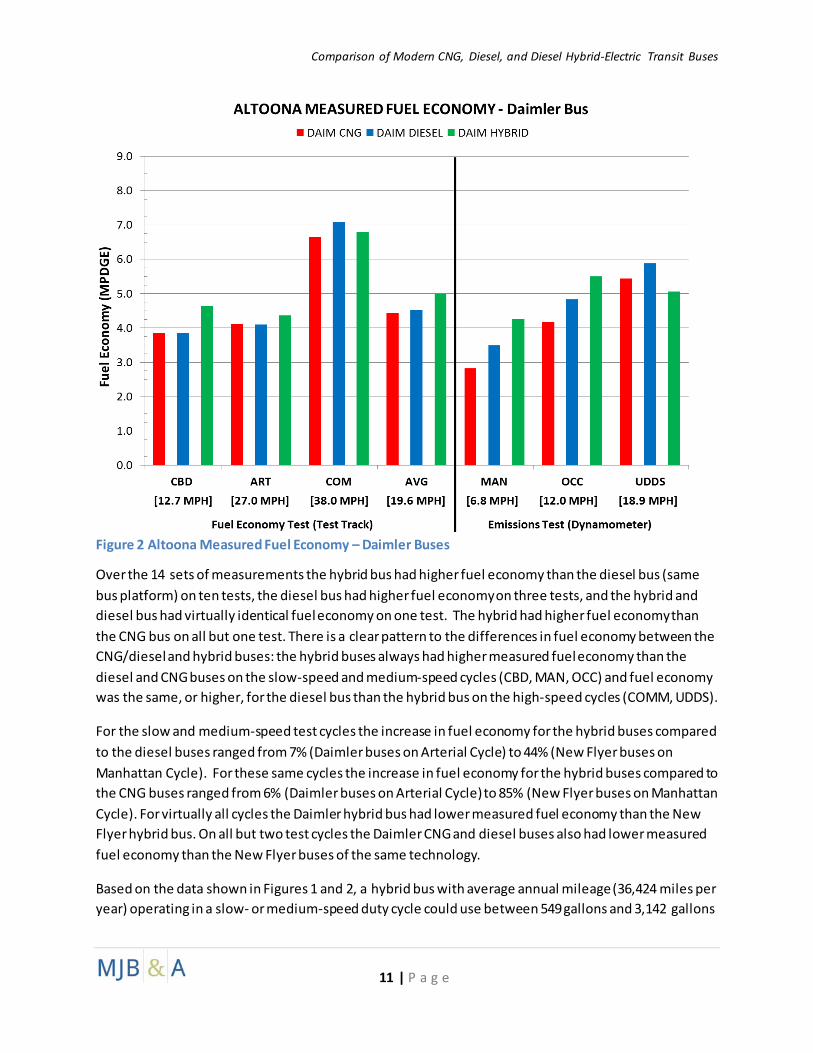
Figure 2 Altoona Measured Fuel Economy – Daimler Buses
Over the 14 sets of measurements the hybrid bus had higher fuel economy than the diesel bus (same bus platform) on ten tests, the diesel bus had higher fuel economy on three tests, and the hybrid and diesel bus had virtually identical fuel economy on one test. The hybrid had higher fuel economy than the CNG bus on all but one test. There is a clear pattern to the differences in fuel economy between the CNG/diesel and hybrid buses: the hybrid buses always had higher measured fuel economy than the diesel and CNG buses on the slow-speed and medium-speed cycles (CBD, MAN, OCC) and fuel economy was the same, or higher, for the diesel bus than the hybrid bus on the high-speed cycles (COMM, UDDS).
For the slow and medium-speed test cycles the increase in fuel economy for the hybrid buses compared to the diesel buses ranged from 7% (Daimler buses on Arterial Cycle) to 44% (New Flyer buses on Manhattan Cycle). For these same cycles the increase in fuel economy for the hybrid buses compared to the CNG buses ranged from 6% (Daimler buses on Arterial Cycle) to 85% (New Flyer buses on Manhattan Cycle). For virtually all cycles the Daimler hybrid bus had lower measured fuel economy than the New Flyer hybrid bus. On all but two test cycles the Daimler CNG and diesel buses also had lower measured fuel economy than the New Flyer buses of the same technology.
Based on the data shown in Figures 1 and 2, a hybrid bus with average annual mileage (36,424 miles per year) operating in a slow- or medium-speed duty cycle could use between 549 gallons and 3,142 gallons
Comparison of Modern CNG, Diesel, and Diesel Hybrid-Electric Transit Buses
12 | P a g e
less fuel annually than a diesel bus, or between 507 gallons and 6,052 gallons19 less fuel annually than a CNG bus, depending on the bus platform and actual duty cycle.
2.2 Emissions
2.1.1 Criteria Pollutants
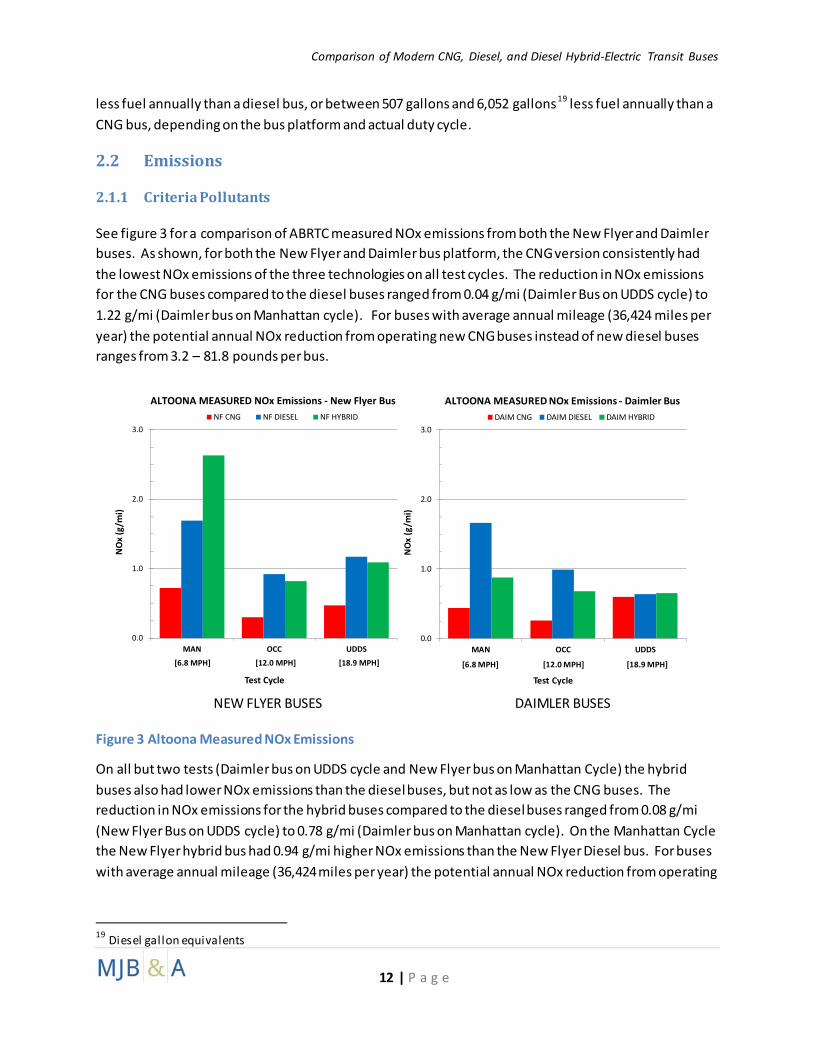
See figure 3 for a comparison of ABRTC measured NOx emissions from both the New Flyer and Daimler buses. As shown, for both the New Flyer and Daimler bus platform, the CNG version consistently had the lowest NOx emissions of the three technologies on all test cycles. The reduction in NOx emissions for the CNG buses compared to the diesel buses ranged from 0.04 g/mi (Daimler Bus on UDDS cycle) to 1.22 g/mi (Daimler bus on Manhattan cycle). For buses with average annual mileage (36,424 miles per year) the potential annual NOx reduction from operating new CNG buses instead of new diesel buses ranges from 3.2 – 81.8 pounds per bus.
Figure 3 Altoona Measured NOx Emissions
On all but two tests (Daimler bus on UDDS cycle and New Flyer bus on Manhattan Cycle) the hybrid buses also had lower NOx emissions than the diesel buses, but not as low as the CNG buses. The reduction in NOx emissions for the hybrid buses compared to the diesel buses ranged from 0.08 g/mi (New Flyer Bus on UDDS cycle) to 0.78 g/mi (Daimler bus on Manhattan cycle). On the Manhattan Cycle the New Flyer hybrid bus had 0.94 g/mi higher NOx emissions than the New Flyer Diesel bus. For buses with average annual mileage (36,424 miles per year) the potential annual NOx reduction from operating
19 Diesel gallon equivalents
NEW FLYER BUSES DAIMLER BUSES
0.0
1.0
2.0
3.0
MAN OCC UDDS
NO
x (g
/mi)
Test Cycle
NF CNG NF DIESEL NF HYBRID
ALTOONA MEASURED NOx Emissions - New Flyer Bus
[6.8 MPH] [12.0 MPH] [18.9 MPH]
0.0
1.0
2.0
3.0
MAN OCC UDDS
NO
x (g
/mi)
Test Cycle
DAIM CNG DAIM DIESEL DAIM HYBRID
ALTOONA MEASURED NOx Emissions - Daimler Bus
[6.8 MPH] [12.0 MPH] [18.9 MPH]
Comparison of Modern CNG, Diesel, and Diesel Hybrid-Electric Transit Buses
13 | P a g e
new hybrid buses instead of new diesel buses ranges from -75.5 pounds (increase) to 62.6 pounds per bus.
Figure 4 Altoona Measured PM Emissions
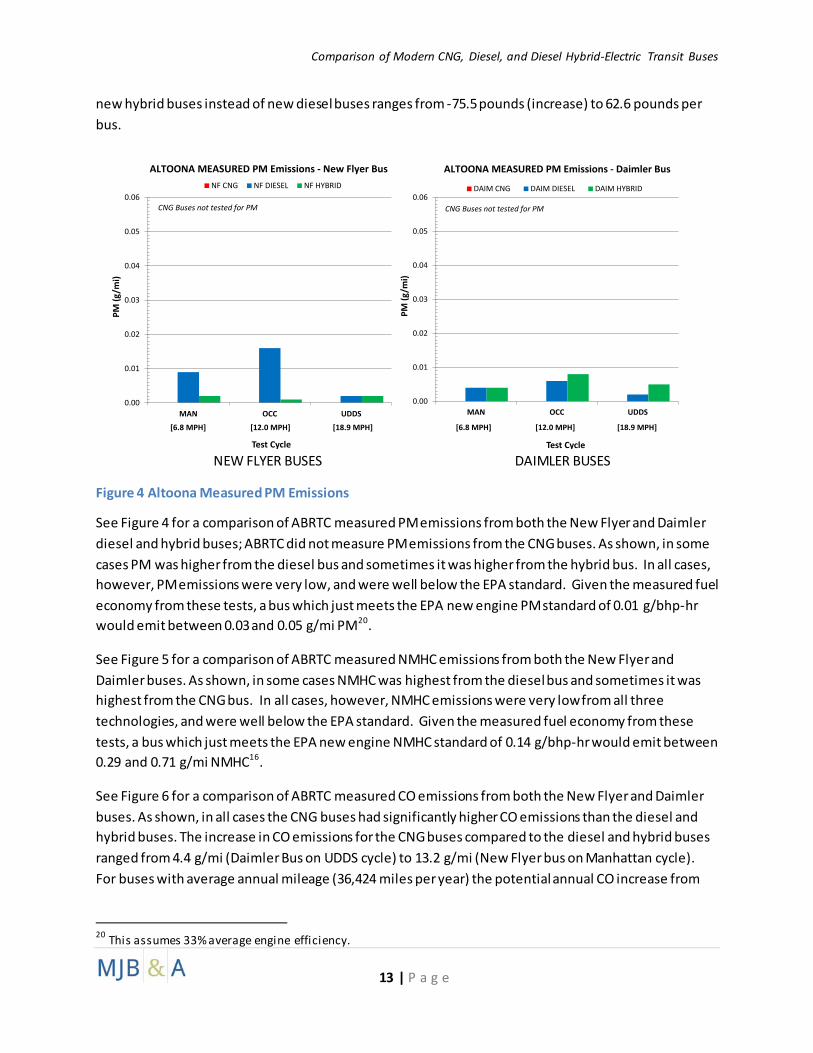
See Figure 4 for a comparison of ABRTC measured PM emissions from both the New Flyer and Daimler diesel and hybrid buses; ABRTC did not measure PM emissions from the CNG buses. As shown, in some cases PM was higher from the diesel bus and sometimes it was higher from the hybrid bus. In all cases, however, PM emissions were very low, and were well below the EPA standard. Given the measured fuel economy from these tests, a bus which just meets the EPA new engine PM standard of 0.01 g/bhp-hr would emit between 0.03 and 0.05 g/mi PM20.
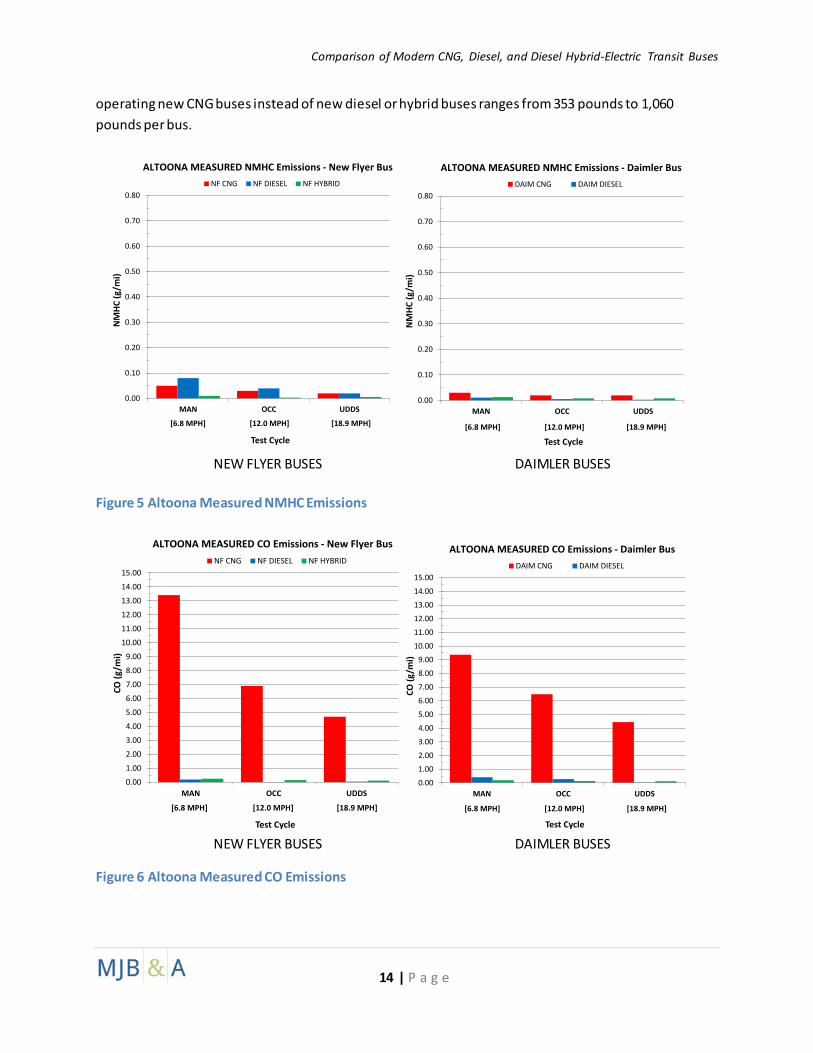
See Figure 5 for a comparison of ABRTC measured NMHC emissions from both the New Flyer and Daimler buses. As shown, in some cases NMHC was highest from the diesel bus and sometimes it was highest from the CNG bus. In all cases, however, NMHC emissions were very low from all three technologies, and were well below the EPA standard. Given the measured fuel economy from these tests, a bus which just meets the EPA new engine NMHC standard of 0.14 g/bhp-hr would emit between 0.29 and 0.71 g/mi NMHC16.
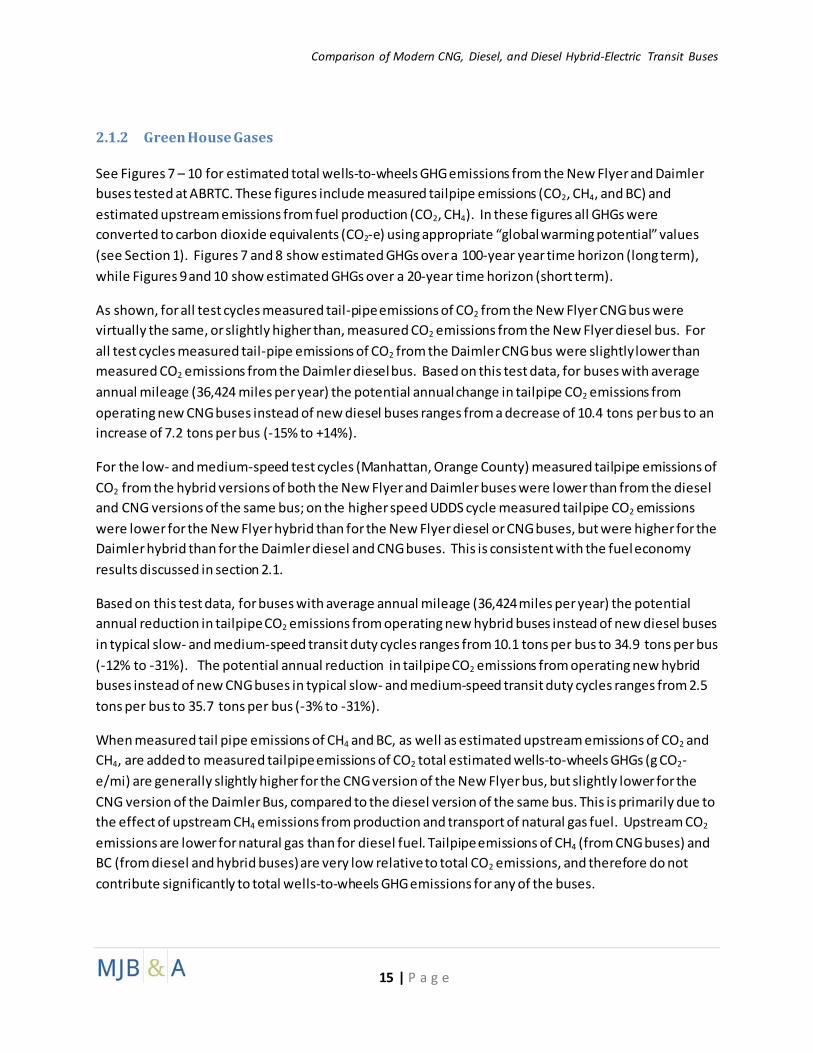
See Figure 6 for a comparison of ABRTC measured CO emissions from both the New Flyer and Daimler buses. As shown, in all cases the CNG buses had significantly higher CO emissions than the diesel and hybrid buses. The increase in CO emissions for the CNG buses compared to the diesel and hybrid buses ranged from 4.4 g/mi (Daimler Bus on UDDS cycle) to 13.2 g/mi (New Flyer bus on Manhattan cycle). For buses with average annual mileage (36,424 miles per year) the potential annual CO increase from
20 This assumes 33% average engine efficiency.
NEW FLYER BUSES DAIMLER BUSES
0.00
0.01
0.02
0.03
0.04
0.05
0.06
MAN OCC UDDS
PM (g
/mi)
Test Cycle
NF CNG NF DIESEL NF HYBRID
ALTOONA MEASURED PM Emissions - New Flyer Bus
CNG Buses not tested for PM
[6.8 MPH] [12.0 MPH] [18.9 MPH]
0.00
0.01
0.02
0.03
0.04
0.05
0.06
MAN OCC UDDSPM
(g/m
i)
Test Cycle
DAIM CNG DAIM DIESEL DAIM HYBRID
ALTOONA MEASURED PM Emissions - Daimler Bus
CNG Buses not tested for PM
[6.8 MPH] [12.0 MPH] [18.9 MPH]
Comparison of Modern CNG, Diesel, and Diesel Hybrid-Electric Transit Buses
14 | P a g e
operating new CNG buses instead of new diesel or hybrid buses ranges from 353 pounds to 1,060 pounds per bus.
Figure 5 Altoona Measured NMHC Emissions
Figure 6 Altoona Measured CO Emissions
NEW FLYER BUSES DAIMLER BUSES
0.00
0.10
0.20
0.30
0.40
0.50
0.60
0.70
0.80
MAN OCC UDDS
NM
HC (g
/mi)
Test Cycle
NF CNG NF DIESEL NF HYBRID
ALTOONA MEASURED NMHC Emissions - New Flyer Bus
[6.8 MPH] [12.0 MPH] [18.9 MPH]
0.00
0.10
0.20
0.30
0.40
0.50
0.60
0.70
0.80
MAN OCC UDDSN
MHC
(g/m
i)
Test Cycle
DAIM CNG DAIM DIESEL
ALTOONA MEASURED NMHC Emissions - Daimler Bus
[6.8 MPH] [12.0 MPH] [18.9 MPH]
NEW FLYER BUSES DAIMLER BUSES
0.00
1.00
2.00
3.00
4.00
5.00
6.00
7.00
8.00
9.00
10.00
11.00
12.00
13.00
14.00
15.00
MAN OCC UDDS
CO (g
/mi)
Test Cycle
NF CNG NF DIESEL NF HYBRID
ALTOONA MEASURED CO Emissions - New Flyer Bus
[6.8 MPH] [12.0 MPH] [18.9 MPH]
0.00
1.00
2.00
3.00
4.00
5.00
6.00
7.00
8.00
9.00
10.00
11.00
12.00
13.00
14.00
15.00
MAN OCC UDDS
CO (g
/mi)
Test Cycle
DAIM CNG DAIM DIESEL
ALTOONA MEASURED CO Emissions - Daimler Bus
[6.8 MPH] [12.0 MPH] [18.9 MPH]
Comparison of Modern CNG, Diesel, and Diesel Hybrid-Electric Transit Buses
15 | P a g e
2.1.2 Green House Gases
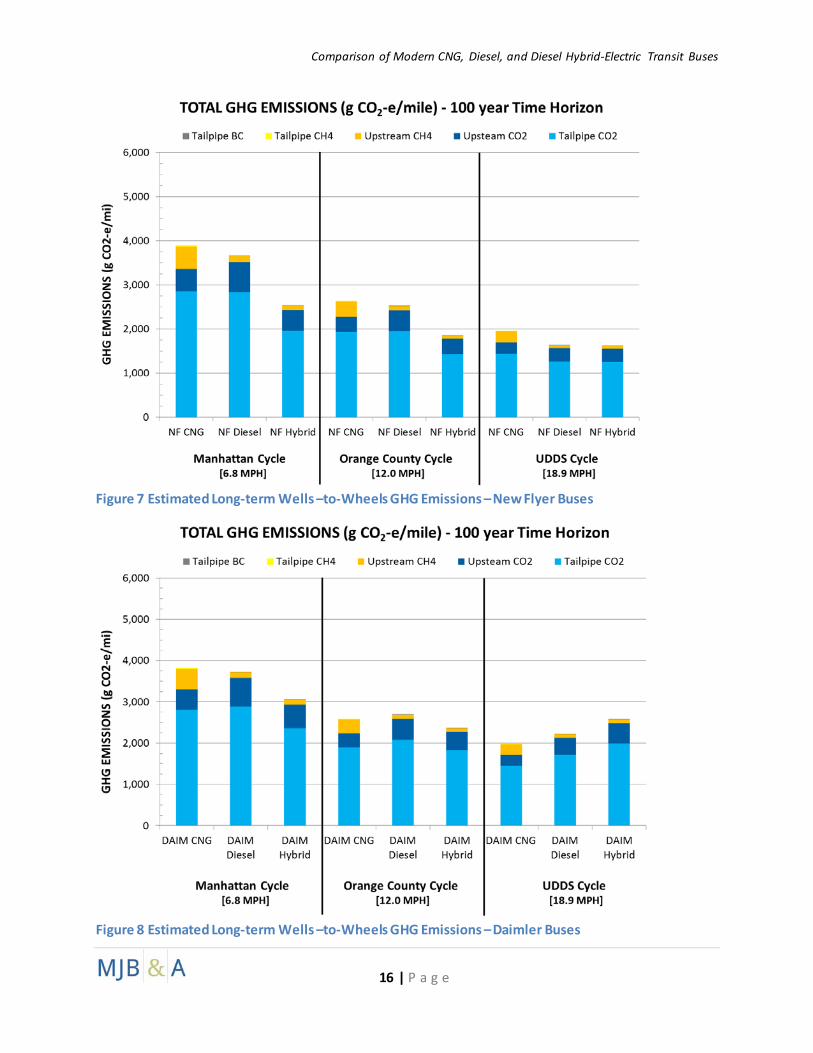
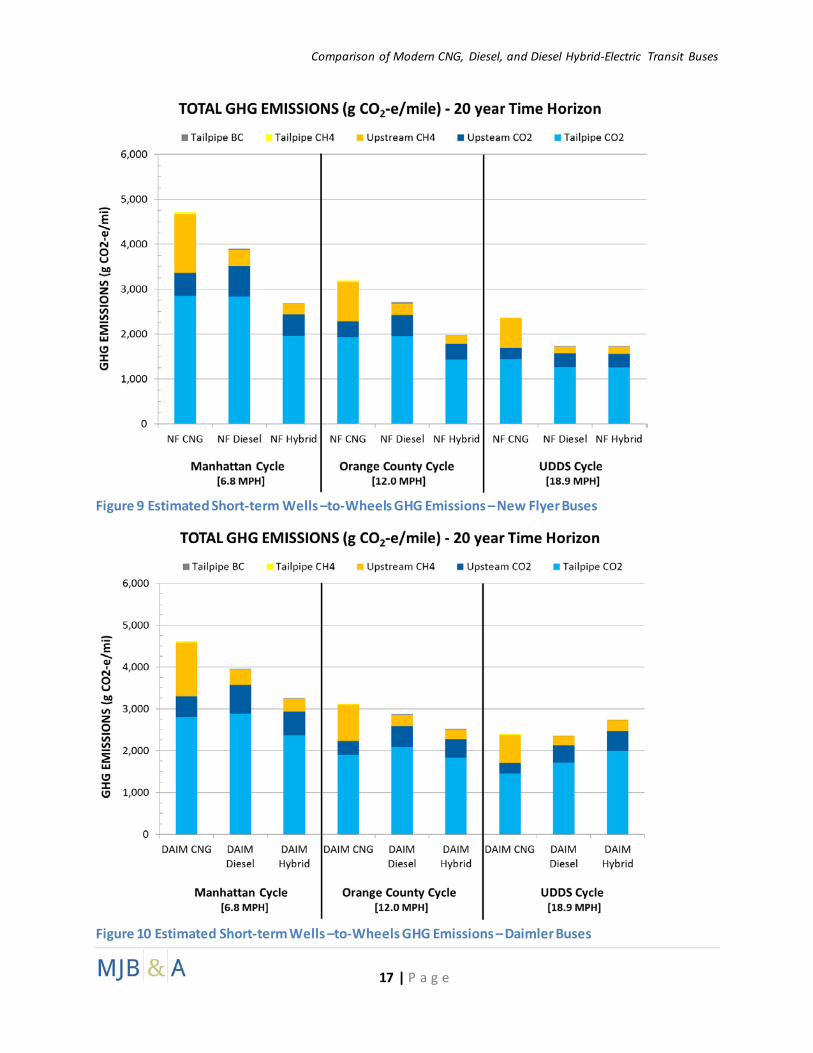
See Figures 7 – 10 for estimated total wells-to-wheels GHG emissions from the New Flyer and Daimler buses tested at ABRTC. These figures include measured tailpipe emissions (CO2, CH4, and BC) and estimated upstream emissions from fuel production (CO2, CH4). In these figures all GHGs were converted to carbon dioxide equivalents (CO2-e) using appropriate “global warming potential” values (see Section 1). Figures 7 and 8 show estimated GHGs over a 100-year year time horizon (long term), while Figures 9 and 10 show estimated GHGs over a 20-year time horizon (short term).
As shown, for all test cycles measured tail-pipe emissions of CO2 from the New Flyer CNG bus were virtually the same, or slightly higher than, measured CO2 emissions from the New Flyer diesel bus. For all test cycles measured tail-pipe emissions of CO2 from the Daimler CNG bus were slightly lower than measured CO2 emissions from the Daimler diesel bus. Based on this test data, for buses with average annual mileage (36,424 miles per year) the potential annual change in tailpipe CO2 emissions from operating new CNG buses instead of new diesel buses ranges from a decrease of 10.4 tons per bus to an increase of 7.2 tons per bus (-15% to +14%).
For the low- and medium-speed test cycles (Manhattan, Orange County) measured tailpipe emissions of CO2 from the hybrid versions of both the New Flyer and Daimler buses were lower than from the diesel and CNG versions of the same bus; on the higher speed UDDS cycle measured tailpipe CO2 emissions were lower for the New Flyer hybrid than for the New Flyer diesel or CNG buses, but were higher for the Daimler hybrid than for the Daimler diesel and CNG buses. This is consistent with the fuel economy results discussed in section 2.1.
Based on this test data, for buses with average annual mileage (36,424 miles per year) the potential annual reduction in tailpipe CO2 emissions from operating new hybrid buses instead of new diesel buses in typical slow- and medium-speed transit duty cycles ranges from 10.1 tons per bus to 34.9 tons per bus (-12% to -31%). The potential annual reduction in tailpipe CO2 emissions from operating new hybrid buses instead of new CNG buses in typical slow- and medium-speed transit duty cycles ranges from 2.5 tons per bus to 35.7 tons per bus (-3% to -31%).
When measured tail pipe emissions of CH4 and BC, as well as estimated upstream emissions of CO2 and CH4, are added to measured tailpipe emissions of CO2 total estimated wells-to-wheels GHGs (g CO2-e/mi) are generally slightly higher for the CNG version of the New Flyer bus, but slightly lower for the CNG version of the Daimler Bus, compared to the diesel version of the same bus. This is primarily due to the effect of upstream CH4 emissions from production and transport of natural gas fuel. Upstream CO2 emissions are lower for natural gas than for diesel fuel. Tailpipe emissions of CH4 (from CNG buses) and BC (from diesel and hybrid buses) are very low relative to total CO2 emissions, and therefore do not contribute significantly to total wells-to-wheels GHG emissions for any of the buses.
Comparison of Modern CNG, Diesel, and Diesel Hybrid-Electric Transit Buses
16 | P a g e
Figure 7 Estimated Long-term Wells –to-Wheels GHG Emissions – New Flyer Buses
Figure 8 Estimated Long-term Wells –to-Wheels GHG Emissions – Daimler Buses
Comparison of Modern CNG, Diesel, and Diesel Hybrid-Electric Transit Buses
17 | P a g e
Figure 9 Estimated Short-term Wells –to-Wheels GHG Emissions – New Flyer Buses
Figure 10 Estimated Short-term Wells –to-Wheels GHG Emissions – Daimler Buses
Comparison of Modern CNG, Diesel, and Diesel Hybrid-Electric Transit Buses
18 | P a g e
As shown in Figures 9 and 10 the negative effect of upstream CH4 emissions from natural gas fuel production are magnified in the short-term (20 years) compared to the long term (100 years) because methane is a short term climate forcer.
Based on the data shown in figures 7 - 10, for buses with average annual mileage (36,424 miles per year) the potential annual change in long-term wells-to-wheels GHG emissions (CO2-e) from operating new CNG buses instead of new diesel buses ranges from a decrease of 9.1 tons per bus to an increase of 13.3 tons per bus (-10% to +20%). In the short-term the potential annual change in wells-to-wheels GHG emissions (CO2-e) from operating new CNG buses instead of new diesel buses ranges from an increase of 2.5 tons per bus to an increase of 32.8 tons per bus (+2.5% to +17%).
For buses with average annual mileage (36,424 miles per year) the potential annual change in long-term wells-to-wheels GHG emissions (CO2-e) from operating new CNG buses instead of new hybrid buses ranges from a decrease of 23.7 tons per bus when operating in higher-speed duty cycles to an increase of 54.5 tons per bus when operating in slow-speed duty cycles (-23% to +25%). In the short-term the potential annual change in wells-to-wheels GHG emissions (CO2-e) from operating new CNG buses instead of new hybrid buses ranges from a decrease of 13.3 tons per bus when operating in high-speed duty cycles to an increase of 81.2 tons per bus when operating in typical slow-speed duty cycles (-29% to +54%).
Given that assumptions about upstream CH4 emissions from natural gas production have such a large effect on the wells-to-wheels GHG analysis, it must be noted that there is continuing uncertainty as to the actual level of methane emissions from this activity. This analysis uses the most recent data available, from Argonne’s GREET model (see Section 1), which is in turn based on EPA’s most recent national greenhouse gas inventory. However, recent studies have indicated that EPA’s inventory may over-state methane emissions from some natural gas production steps and understate methane emissions from others21. Future revisions to EPA’s inventory, and to the GREET model, could either increase or decrease estimated wells-to-wheels GHG emissions from the use of both diesel and CNG buses.
21 University of Texas, Center for Energy & Environmental Resources, Unprecedented Measurements Provide Better Understanding of Methane Emissions During Natural Gas Production, September 16, 2013; http://dept.ceer.utexas.edu/methane/study/index.cfm
Comparison of Modern CNG, Diesel, and Diesel Hybrid-Electric Transit Buses
19 | P a g e
REFERENCES
• PTI-BT-R1205, PARTIAL STURAA TEST 12 YEAR 500,000 MILE BUS from NEW FLYER of
AMERICA MODEL C40LF, JUNE 2012; The Thomas D. Larson Pennsylvania Transportation Institute, Vehicle Systems and Safety Program
• PTI-BT- R1211, PARTIAL STURAA TEST 12 YEAR 500,000 MILE BUS from NEW FLYER of AMERICA MODEL XD40, NOVEMBER 2012; The Thomas D. Larson Pennsylvania Transportation Institute, Vehicle Systems and Safety Program
• PTI-BT-R1015, PARTIAL STURAA TEST 12 YEAR 500,000 MILE BUS from NEW FLYER of AMERICA MODEL XDE40, DECEMBER 2011; The Thomas D. Larson Pennsylvania Transportation Institute, Vehicle Systems and Safety Program
• PTI-BT-R1117, PARTIAL STURAA TEST 12 YEAR 500,000 MILE BUS from DAIMLER BUSES NORTH AMERICA LTD. , MODEL ORION VII EPA 10 CNG, FEBRUARY 2012; The Thomas D. Larson Pennsylvania Transportation Institute, Vehicle Systems and Safety Program
• PTI-BT-R1202-P, PARTIAL STURAA TEST 12 YEAR 500,000 MILE BUS from DAIMLER BUSES NORTH AMERICA LTD. , MODEL ORION VII EPA10 DIESEL APRIL 2012; The Thomas D. Larson Pennsylvania Transportation Institute, Vehicle Systems and Safety Program
• PTI-BT-R1007, STURAA TEST 12 YEAR 500,000 MILE BUS from DAIMLER BUSES NORTH AMERICA LTD. , MODEL ORION VII EPA10, NOVEMBER 2010; The Thomas D. Larson Pennsylvania Transportation Institute, Vehicle Systems and Safety Program
APPENDIX A Comparison of Modern CNG, Diesel, and Diesel Hybrid-Electric Transit Buses
20 | P a g e
Table 5 Altoona-Measured Fuel Economy all Buses
Table 6 Altoona Measured Emissions, All Buses
CBD ART COM AVG MAN OCC UDDSPTI-BT-R1205 New Flyer C40LF 2011 CNG 4.23 4.12 7.37 4.80 2.77 4.09 5.51PTI-BT-R1211 New Flyer XD40 2011 Diesel 3.94 4.48 8.20 4.82 3.56 5.17 8.03PTI-BT-R1015 New Flyer XDE40 2010 Hybrid 5.46 5.11 7.79 5.84 5.14 7.05 8.04PTI-BT-R1117 Daimler Orion VII 2010 CNG 3.87 4.12 6.65 4.44 2.82 4.17 5.44
PTI-BT-R1202-P Daimler Orion VII 2012 Diesel 3.86 4.10 7.09 4.53 3.50 4.84 5.89PTI-BT-R1007 Daimler Orion VII 2010 Hybrid 4.64 4.37 6.80 5.00 4.26 5.50 5.06
Altoona Measured Fuel Economy
Make Model Model Year
Type Fuel Economy Test Emissions TestABRTC Report
Miles/DGE
[MPDGE]PTI-BT-R1205 New Flyer C40LF 2011 41 CNG 2.77 0.72 NM 0.05 13.41 0.61 2,850PTI-BT-R1211 New Flyer XD40 2011 40 Diesel 3.56 1.69 0.009 0.08 0.20 NM 2,830PTI-BT-R1015 New Flyer XDE40 2010 40 Hybrid 5.14 2.63 0.002 0.01 0.25 NM 1,960PTI-BT-R1117 Daimler Orion VII 2010 41 CNG 2.82 0.44 NM 0.03 9.37 0.48 2,802
PTI-BT-R1202-P Daimler Orion VII 2012 41 Diesel 3.50 1.66 0.004 0.01 0.41 NM 2,882PTI-BT-R1007 Daimler Orion VII 2010 41 Hybrid 4.26 0.88 0.004 0.01 0.20 NM 2,365
NM= Not measured
[MPDGE]PTI-BT-R1205 New Flyer C40LF 2011 41 CNG 4.09 0.30 NM 0.030 6.90 0.37 1,932PTI-BT-R1211 New Flyer XD40 2011 40 Diesel 5.17 0.92 0.016 0.040 0.02 NM 1,950PTI-BT-R1015 New Flyer XDE40 2010 40 Hybrid 7.05 0.82 0.001 0.003 0.15 NM 1,431PTI-BT-R1117 Daimler Orion VII 2010 41 CNG 4.17 0.26 NM 0.020 6.48 0.27 1,895
PTI-BT-R1202-P Daimler Orion VII 2012 41 Diesel 4.84 0.99 0.006 0.005 0.28 NM 2,084PTI-BT-R1007 Daimler Orion VII 2010 41 Hybrid 5.50 0.68 0.008 0.008 0.14 NM 1,832
NM= Not measured
[MPDGE]PTI-BT-R1205 New Flyer C40LF 2011 41 CNG 5.51 0.47 NM 0.020 4.70 0.20 1,435PTI-BT-R1211 New Flyer XD40 2011 40 Diesel 8.03 1.17 0.002 0.020 0.05 NM 1,256PTI-BT-R1015 New Flyer XDE40 2010 40 Hybrid 8.04 1.09 0.002 0.006 0.11 NM 1,254PTI-BT-R1117 Daimler Orion VII 2010 41 CNG 5.44 0.60 NM 0.02 4.44 0.38 1,453
PTI-BT-R1202-P Daimler Orion VII 2012 41 Diesel 5.89 0.64 0.002 0.00 0.03 NM 1,713PTI-BT-R1007 Daimler Orion VII 2010 41 Hybrid 5.06 0.65 0.005 0.01 0.12 NM 1,993
NM= Not measured
Size (ft.)
Manhattan Cycle
ALTOONA REPORT
Make Model Model Year CO CH4 CO2
FuelFuel
EconomyEMISSIONS (g/mi)
Orange County Bus Cycle
Make Model Model Year
Size (ft.)
FuelFuel
EconomyEMISSIONS (g/mi)
Size (ft.)
FuelFuel
EconomyEMISSIONS (g/mi)
UDDS Cycle
Make Model Model Year NOx PM NMHC CO CH4 CO2
NOx PM NMHC CO CH4 CO2
NOx PM NMHC
APPENDIX A Comparison of Modern CNG, Diesel, and Diesel Hybrid-Electric Transit Buses
21 | P a g e
Table 7 Estimated Wells-to-Wheels GHG Emissions, All Buses
NEW FLYER BUSES
unit NF CNG NF Diesel NF Hybrid NF CNG NF Diesel NF Hybrid NF CNG NF Diesel NF Hybrid Notes/Sources
Fuel Economy MPDEG 2.77 3.56 5.14 4.09 5.17 7.05 5.51 8.03 8.04 Altoona Test Data
Fuel Use DEG/mi 0.361 0.281 0.194 0.244 0.193 0.142 0.182 0.125 0.124 = 1 ÷ MPDEG
PM g/mi 0.000 0.009 0.002 0.000 0.016 0.001 0.000 0.002 0.002CH4 g/mi 0.61 0.00 0.00 0.37 0.00 0.00 0.20 0.00 0.00
CO2 g/mi 2,850 2,830 1,960 1,932 1,950 1,431 1,435 1,256 1,254
CO2 g/MJ 10.32 17.92 17.92 10.32 17.92 17.92 10.32 17.92 17.92 GREET 2012
CO2 g/DEG 1,399 2,429 2,429 1,399 2,429 2,429 1,399 2,429 2,429 = g/MJ x MJ/DEG
CH4 g/MJ 0.31 0.11 0.11 0.31 0.11 0.11 0.31 0.11 0.11 GREET 2012
CH4 g/DEG 42.0 14.9 14.9 42.0 14.9 14.9 42.0 14.9 14.9 = g/MJ x MJ/DEG
Upsteam CO2 g CO2-e/mi 504 682 472 342 470 345 254 302 302 g CO2/DEG x DEG/mi
Upstream CH4 g CO2-e/mi 1,303 360 249 883 248 182 656 160 159 g CH4/DEG x DEG/mi x CH4 GWP20
Tailpipe CO2 g CO2-e/mi 2,850 2,830 1,960 1,932 1,950 1,431 1,435 1,256 1,254 g CO2/mi; Altoona Test Data
Tailpipe CH4 g CO2-e/mi 52 0 0 32 0 0 17 0 0 g CH4/mi (Altoona) x CH4 GWP20
Tailpipe BC g CO2-e/mi 0 22 5 0 38 2 0 5 5 g PM/mi (Altoona) x BC GWP20
TOTAL g CO 2 -e/mi 4,709 3,893 2,686 3,189 2,706 1,960 2,362 1,723 1,720
Upsteam CO2 g CO2-e/mi 504 682 472 342 470 345 254 302 302 g CO2/DEG x DEG/mi
Upstream CH4 g CO2-e/mi 515 142 99 349 98 72 259 63 63 g CH4/DEG x DEG/mi x CH4 GWP100
Tailpipe CO2 g CO2-e/mi 2,850 2,830 1,960 1,932 1,950 1,431 1,435 1,256 1,254 g CO2/mi; Altoona Test Data
Tailpipe CH4 g CO2-e/mi 21 0 0 13 0 0 7 0 0 g CH4/mi (Altoona) x CH4 GWP100
Tailpipe BC g CO2-e/mi 0 6 1 0 11 1 0 1 1 g PM/mi (Altoona) x BC GWP100
TOTAL g CO 2 -e/mi 3,890 3,660 2,532 2,635 2,528 1,848 1,955 1,623 1,620
DAIMLER BUSES
unitDAIM CNG
DAIM Diesel
DAIM Hybrid
DAIM CNG
DAIM Diesel
DAIM Hybrid
DAIM CNG
DAIM Diesel
DAIM Hybrid
Notes/Sources
Fuel Economy MPDEG 2.82 3.50 4.26 4.17 4.84 5.50 5.44 5.89 5.06 Altoona Test Data
Fuel Use DEG/mi 0.354 0.286 0.235 0.240 0.207 0.182 0.184 0.170 0.198 = 1 ÷ MPDEG
PM g/mi 0.000 0.004 0.004 0.000 0.006 0.008 0.000 0.002 0.005CH4 g/mi 0.48 0.00 0.00 0.27 0.00 0.00 0.38 0.00 0.00
CO2 g/mi 2,802 2,882 2,365 1,895 2,084 1,832 1,453 1,713 1,993
CO2 g/MJ 10.32 17.92 17.92 10.32 17.92 17.92 10.32 17.92 17.92 GREET 2013
CO2 g/DEG 1,399 2,429 2,429 1,399 2,429 2,429 1,399 2,429 2,429 = g/MJ x MJ/DEG
CH4 g/MJ 0.31 0.11 0.11 0.31 0.11 0.11 0.31 0.11 0.11 GREET 2013
CH4 g/DEG 42.0 14.9 14.9 42.0 14.9 14.9 42.0 14.9 14.9 = g/MJ x MJ/DEG
Upsteam CO2 g CO2-e/mi 496 694 570 335 502 441 257 413 480 g CO2/DEG x DEG/mi
Upstream CH4 g CO2-e/mi 1,281 366 301 866 265 233 664 218 253 g CH4/DEG x DEG/mi x CH4 GWP20
Tailpipe CO2 g CO2-e/mi 2,802 2,882 2,365 1,895 2,084 1,832 1,453 1,713 1,993 g CO2/mi; Altoona Test Data
Tailpipe CH4 g CO2-e/mi 41 0 0 23 0 0 33 0 0 g CH4/mi (Altoona) x CH4 GWP20
Tailpipe BC g CO2-e/mi 0 10 10 0 14 19 0 5 12 g PM/mi (Altoona) x BC GWP20
TOTAL g CO 2 -e/mi 4,620 3,952 3,245 3,120 2,865 2,525 2,407 2,348 2,738
Upsteam CO2 g CO2-e/mi 496 694 570 335 502 441 257 413 480 g CO2/DEG x DEG/mi
Upstream CH4 g CO2-e/mi 506 145 119 342 105 92 263 86 100 g CH4/DEG x DEG/mi x CH4 GWP100
Tailpipe CO2 g CO2-e/mi 2,802 2,882 2,365 1,895 2,084 1,832 1,453 1,713 1,993 g CO2/mi; Altoona Test Data
Tailpipe CH4 g CO2-e/mi 16 0 0 9 0 0 13 0 0 g CH4/mi (Altoona) x CH4 GWP100
Tailpipe BC g CO2-e/mi 0 3 3 0 4 5 0 1 3 g PM/mi (Altoona) x BC GWP100
TOTAL g CO 2 -e/mi 3,820 3,724 3,056 2,582 2,695 2,371 1,986 2,213 2,577
GLOBAL ASSUMPTIONS & CONSTANTS1 Diesel Equivalent Gallon (DEG) = 128,450 btu = 50.48 hp-hr = 135.52 MJNatural Gas Energy Content = 20,268 btu/lb = 6.338 lb/DGEU.S. Department of Energy, Alternative Fuels & Advanced Vehicles Data Center (www.afdc.energy.gov/afdc/fuels/properties.html)
GWP20 GWP100Methane 86 34 IPCC 5th Assess (2013)Black Carbon 3200 900 IPCC 5th Assess (2013)% PM that is BC = 75% EPA Technology Transfer Network Clearinghouse for Inventories and Emission Factors, Speciation, April 26,2005
947.817 btu/MJ2,544.43 btu/hp-hr453.59 g/lb
LONG-TERM GHG PER MILE
BY SOURCE TYPE
Upsteam Emission
Factors (Fuel Production)
Tail pipe Emissions
Tail pipe Emissions
SHORT-TERM GHG PER MILE
BY SOURCE TYPE
LONG-TERM GHG PER MILE
BY SOURCE TYPE
Upsteam Emission
Factors (Fuel Production)
Manhattan Cycle Orange County Cycle UDDS Cycle
UDDS Cycle
SHORT-TERM GHG PER MILE
BY SOURCE TYPE
Manhattan Cycle Orange County Cycle
Altoona Test Data
Altoona Test Data