real-time indoor air quality monitoring through wireless sensor network · 2017-01-24 · real-time...
TRANSCRIPT

Real-Time Indoor Air Quality Monitoring Through WirelessSensor Network
MOHIEDDINE BENAMMAR ABDERRAZAK [email protected] [email protected]
H.M. SABBIR [email protected]
FARID [email protected]
ABDULLAH [email protected]
Abstract: Recently, indoor air quality monitoring (AQM) has become an important research area for the concernof human health and lifestyle. The AQM is usually based on the deployment of wireless sensor networks (WSN)within the building. Bridging the gap between gas sensors, deployed at different locations of the WSN, and theInternet becomes a challenging task in terms of link reliability and data integrity. Recent advances in the designof Internet-of-Things (IoT)-enabling solutions are spurring the advent of novel and fascinating bridging. In thewake of this tendency, this paper proposes a novel, IoT Smart architecture for air quality monitoring. With the IoTvision, we propose a Smart global AQM system, which employs different, yet complementary, technologies, suchas gas sensing, WSN and Smart mobile. Our proposed system, is able to collect, in real time and from differentcities, data related to the concentrations of critical gases, humidity, and temperatures. Collected data are deliveredto a local gateway where an advanced processing makes them easy and accessible by both, local and remote usersvia a remote web server.
Key–Words: WSN, Internet-of-Things, Carbon dioxide, Carbon monoxide, Carbonyls, Indoor air quality monitor-ing, Nitrogen dioxide, Volatile organic compounds.
1 IntroductionAThe Internet-of-Things (IoT) has become very at-tractive in the modern wireless communications con-text. IoT implies “a worldwide network of intercon-nected objects uniquely addressable, based on stan-dard communication protocols” [2]. Basically, themain idea of the IoT is the distribution of ubiquitous“objects” or “things”, which collect and exchangedata in order to reach a common objective by meansof mutual interactions [1]. Recent advances of IoTtechnologies are spurring the development of Smartsystems to monitor the air quality. IoT represents thefact of extending internet into the real world relatingeveryday objects. Nowadays, item and devices are nolonger disconnected from the virtual world, but can beaccessed remotely through internet services.
In the Smart environment context, IoT might beused to address the air pollution problem, which hasboth social and economical relevance. Carbon diox-ide, ground-level ozone and particulate matter mightcause asthma and respiratory diseases. Monitoring theair quality in the vital areas is one of the most chal-lenging goals of modern-day society. The fact of de-livering pertinent data of the surrounding gases to re-mote users and institutions is a primary issue.
In [6], the authors present the implementation and
the test of a real time environmental monitoring sys-tem using wireless sensor networks, capable of mea-suring temperature and greenhouse gas concentrationlevels such as CO, CO2 and CH4 levels. [4] presentPolluino, a system for monitoring the air pollution viaArduino and they developed a cloud-based platformthat manages data coming from air quality sensors.A comparison between two cloud computing servicemodels and between two IoT communication proto-cols is performed.
Figure 1 demonstrates the vision of the end-solution for the indoor air quality (IAQ) monitoringand assessment. In this research, we capitalize on thewide expertise of the collaborators in the area to de-velop a functional, scalable and reliable system forIAQ measurement. Although the work is related toIAQ monitoring and assessment of outdoor air quality(OAQ) in the vicinity of sample buildings to be usedin the study is important and will be carried out. Thereason for this is the evident impact of OAQ on IAQ.
In [9] the authors designed a new ZigBee networkfor IAQ monitoring system. They introduce an en-ergy saving ZigBee WSN network with low latencyand high throughput for the IAQ monitoring system.
[5], presented a wireless sensor network forJAQM. The system combines knowledge from lower
Mohieddine Benammar et al.International Journal of Internet of Things and Web Services
http://www.iaras.org/iaras/journals/ijitws
ISSN: 2367-9115 7 Volume 2, 2017

Gateway
IoT
Figure 1: Architecture of the proposed system
levels (sensors) up to the network level exploitingmultimodality of the network by adding the peoplepresence sensing. The node lifetime they propose ismuch bigger than the biggest predicted lifetime in lit-erature, which is 112 days in [3].
In [8], the authors present a study of indoor airquality (IAQ) in schools. The aims of their study areto evaluate indoor and outdoor concentrations of NO2,volatile organic compounds (VOCs) and carbonyls at14 elementary schools in Lisbon, Portugal. The au-thors selected three schools to measure comport pa-rameters, such as temperature and relative humidity,CO2, CO, total VOCs and bacterial and fungal colony-forming units per cubic meter. Primary results showthat indoor concentrations of CO2, in the three mainschools, indicated inadequate classroom air exchangerates.
Poor air quality may cause increased short-termhealth problems such as fatigue and nausea as well aschronic respiratory diseases, heart disease, and lungcancer. According to the factors affecting the IAQ,and to the test items specified in the stadium hygieneinspection, the CO2 concentration, temperature andhumidity are tested as the objective items, respectivelyusing the ZG106 CO2 detector, the DT-8892 profes-sional temperature and humidity tester. Meanwhile,the questionnaire is taken to the staff doing exercisesin the gym as the subjective item, which is formulatedaccording to the ASHRAE feeling scale.
Carbon monoxide (CO) is a colorless, odorless,tasteless, poisonous gas that is produced by the in-complete burning of various fuels, including coal,wood, charcoal, oil, kerosene, propane, and naturalgas. Equipment powered by internal combustion en-gines such as cars, portable generators, lawn mowers,and power washers all produce carbon monoxide.
In this paper, we propose a novel IoT Smart ar-chitecture for air quality monitoring. Specifically, we
present a Smart global AQM system, which employsdifferent, yet complementary, technologies, such asgas sensing, WSN and Smart mobile. Our proposedsystem, is able to collect, in real time and from differ-ent cities, data related to the concentrations of criticalgases, humidity, and temperatures. Collected data aredelivered to a local gateway where an advanced pro-cessing makes them easy and accessible by both, localand remote users via a remote web server at the IOT.The remainder of the paper is organised as follows.Section II, details the challenges of indoor air qualitymonitoring. An Integrated system for indoor AQMbased on IOT is presented and discussed in SectionIII. An example of case study is shown in the resultpart of this paper in Section IV. Section V is dedicatedto the conclusion of this paper.
2 Indoor Air Quality MonitoringChallenges
In this section, we present an overview of the indoorair quality monitoring and the challenges crossing thehumanity to monitor the air quality and to avoid hu-man and animal contaminations. According to [7],air pollution implies “the presence in the earth’s at-mosphere of one or more contaminants in sufficientquantity to cause short- or long-term deleterious ef-fects to human, animal, or plant life, or the environ-ment”. These pollutants can be classified into primarypollutants which are released directly into the atmo-sphere from sources and have high health impact. Sec-ondary pollutants are formed by chemical processesacting upon primary pollutants. The pollutants able toinjure health, harm the environment and cause prop-erty damage are
. Carbon monoxide (CO), . Particular Matter (PM),
. Lead (Pb), . Ozone (O3),
. Nitron dioxide (NO2), . Sulfure dioxide (SO2),
Human CO2 emissions pose a threat to publichealth and walfare. Legally in the USA, CO2 is anair pollutant which must be regulated if it may endan-ger public health or welfare. Humans have increasedthe amount of CO2 in the atmosphere by 40. Whenconsidering the legal definition of “air pollutants” andbody of scientific evidence, it becomes clear that CO2
meets the definition and poses a significant threat topublic health and welfare.
Nowadays, air pollution inside buildings is agrowing problem. As people spend 90% of the timeinside the buildings (malls, institutions, offices andschools ...) indoor air quality is the most influentialfactor for health, safety and comfort. In the last few
Mohieddine Benammar et al.International Journal of Internet of Things and Web Services
http://www.iaras.org/iaras/journals/ijitws
ISSN: 2367-9115 8 Volume 2, 2017

years, some wireless sensor network based solutionsfor indoor air quality monitoring are developed. Sen-sor nodes, deployed inside the building, send data tothe sink node by single hop or multi-hop communi-cations. The sink node is the gateway which is able,via ZigBee link, to collect raw data from each sensornode.
3 An Integrated System for IAQM
Sensor nodes, deployed inside the building, send datato the sink node by single hop or multi-hop commu-nications. The sink node is a gateway which is able,via ZigBee link, to collect raw data from each sen-sor node. In this section, we illustrate the acquisitionsystem and the gateway we designed for indoor airquality monitoring. The acquisition board is based onLibelium Gas sensors pro equipped with ZigBee com-munication feature (Figure 2). However the gatewayconsists of the a Raspberry Pi 2 board.
3.1 Wireless Sensor Node :
The key hardware features are illustrated with the aidof the block diagram below.
Figure 2: Block diagram of the Gas Sensor Node thatwe employ.
3.1.1 Choice of sensors :
Libelium has a large collection of gas sensors acquiredfrom third party sensors manufacturers. The sensorsavailable from Libelium are either non-calibrated orfactory-calibrated. In this work, we decided to opt forpre-calibrated sensors for rapid deployment. Frequentre-calibration of these sensors will be done using adeveloped Test Bed. Libelium provides generic plat-forms capable of running, interfacing, and data collec-tion from these sensors. The open platforms allow the
users to customize the gases they desire to monitor intheir facilities.
The selected gas sensors operate either of electro-chemical or Non Dispersive Infrared NDIR types; thespecifications of these sensors are given in Table 1
Table 1: Specifications of the selected gas sensors.Sensor name Nominal
Range(ppm)
Accuracy(ppm)
Responsetime (s)
Sensor Type AuxiliaryElectrode
Sulphur dioxide(SO2)
0 - 20 +/- 0.1 <= 45 Electrochemical No
Nitrogen dioxide(NO2)
0 - 20 +/-0.1 <= 30 Electrochemical No
Nitrogen oxide(NO)
0- 250 +/- 0.5 <= 30 Electrochemical No
Carbon dioxide(CO2)
0 - 5000 25 60 NDIR N/A
Carbon monox-ide (CO)
0 - 1000 +/- 2 <= 30 Electrochemical No
Chlorine (Cl2) 0 - 50 +/- 0.1 <= 30 Electrochemical No
Ozone (O3) 0-0 +/-0.005 <=15 Electrochemical Yes
3.1.2 Embedded hardware :
The Libelium board (Figure 3) that we employprovides an embedded solution named “Waspmote”which was chosen for the wireless sensor node. Thechoice was made for the following reasons :
1. Interfaces with Gases Pro Board: As mentionedbefore Gases Pro Board was chosen due to itsability to interface with six sensors. Gases ProBoard can be directly plugged to Waspmote thusproving hardware simplicity, compact design andreduced node size.
2. Compatible with Zigbee: The board features thehardware required to directly integrate the XBeetransceiver thus providing a compact node hard-ware setup.
3. Compatible with a wide number of wireless net-work: Waspmote supports WiFi (IEEE 802.11),Zigbee (IEEE 802.11.4), Bluetooth and Lo-RaWAN, thus providing choices of network forthe final node network.
4. On board storage facility with SD Card: Thisfeature can be used to set up a backup store forthe sensors to provide immunity against wirelesslink failure.
5. Extensive archive of S/W libraries: The librariesare shipped with the IDE available from Li-belium for Waspmote which will facilitate quick,reliable and bug free firmware development.
Mohieddine Benammar et al.International Journal of Internet of Things and Web Services
http://www.iaras.org/iaras/journals/ijitws
ISSN: 2367-9115 9 Volume 2, 2017

3.1.3 Sensor node and communication features :
The sensor node has to incorporate a wireless networkto communicate wirelessly with the gateway. Powerrequirement, distance and indoor through-wall com-munication were the two main factors which had to beconsidered while choosing the network for the node.Zigbee (IEEE 802.11.4) was chosen as the desiredwireless network as it meets our requirements. Fur-thermore, Zigbee nodes can transmit data over longdistances using a wireless mesh network configura-tion.
3.1.4 Firmware implementation of the sensornode :
The firmware operates the node in two modes whichare i. Calibration mode and ii. Monitoring mode. Bydefault the node stays in Monitoring mode. In order tochange the operating mode the sensor node has to beoperated in server-client architecture where the sensornode is the server. The client node (Gateway/PC ofthe calibration rig) can change the operating mode bysending specific commands to the server to which ifpossible it will acknowledge or otherwise not.
i. Monitoring Mode : During this mode, the nodemonitors the sensors, acquires reading, stores them inSD card and transmits to the gateway. The sequenceof tasks entitled to the sensor node during this modeis illustrated with the aid of a flowchart shown in Fig-ure 4. Note that the sensor readings are stored withtimestamp initialized by the user, and based on theclock of the Waspmote processor (Figure 2).
Power Adapter
Mains to 5V DC Libellium
Sensor board
Figure 3: First prototype of the complete wireless sen-sor node.
ii. Calibration Mode : The sensor node is oper-ated in this mode when it needs to be calibrated. Theprocess of calibration involves uploading a calibrationdata file to the nodes SD card from the calibration rig.
Figure 4: Flowchart for monitoring mode.
This is achieved using a client-server setup where thesensor node acts as the server and the calibration rigPC serves as a client. During the calibration processthe client polls the sensor readings for various concen-trations and temperatures. Once completed it transferthe calibration data file to the sensor node using FTPover Zigbee.
Figure 5: Sample sensor data during monitoringSmart mode sent over Zigbee.
Mohieddine Benammar et al.International Journal of Internet of Things and Web Services
http://www.iaras.org/iaras/journals/ijitws
ISSN: 2367-9115 10 Volume 2, 2017
3.2 Gateway of the wireless sensor networkfor IAQM
3.2.1 Hardware setup :
In the following, we present the implementation de-tails of Gateway employed in the wireless sensor net-work. The gateway consists of the Raspberry Pi 2board. We selected this board since it is very com-pact and easy to configure and maintain. The Rasp-berry Pi is a credit card-sized computer that plugs intoyour TV and a keyboard. It is a capable little com-puter which can be used in electronics projects, andfor many of the things that your desktop PC does, likespreadsheets, word processing, browsing the internet,and playing games. It also plays high-definition video.We want to see it being used by kids all over the worldto learn programming. The low cost and the size ofthe Raspberry Pi make it very popular and requestedin several real time applications. The setup and theconfiguration of one Raspberry Pi board is very easysince a micro SD is available with preinstalled OSand drivers. In addition Ubuntu/Linux users can eas-ily install and configure applications from binary andsources. All these features are not available with otherembedded boards which are very specific and diffi-cult to prepare and build the OS and the cross com-pilers. The Raspberry Pi 2 is the second generationRaspberry Pi its features include:
- A 900MHz quad-core ARMCortex-A7 CPU
- 1GB RAM
- 4 USB ports, - 40 GPIO pins,- Full HDMI port, - Ethernet port,- Combined 3.5mm audio jackand composite video
- Camera interface (CSI),
- Display interface (DSI), - Micro SD card slot,
3.2.2 Posting data to the Internet of Things plat-form :
Actually, engineers and researchers of different do-mains have several available Internet of Things plat-forms. The IoT used for our AQM application is theEmoncms which is a powerful open-source web ap-plication for processing, logging and visualising en-ergy, temperature and other environmental data fromthe open-source energy monitoring project OpenEn-ergyMonitor.org. We adapted Emoncms web appli-cation to our system since it is flexible and providethe storage of data for a long duration from hours toyears. Our first step of managing the IoT is from theOpenEnergyMonitor system. This later has the capa-bility of monitoring electrical energy use/generation,temperature and humidity.
Using the IoT platform, we propose a SmartIAQM monitoring system for online users. It con-
sists of an intelligent air monitoring system that wouldenable people in the production facility stay notifiedabout air quality.
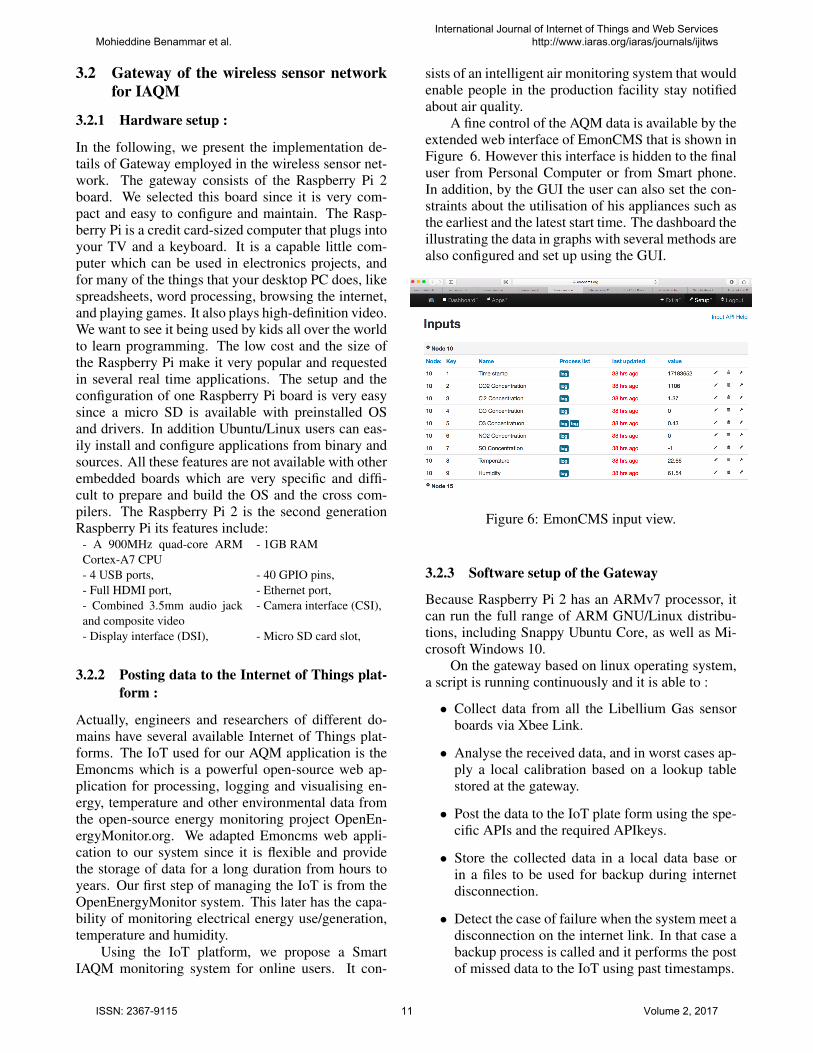
A fine control of the AQM data is available by theextended web interface of EmonCMS that is shown inFigure 6. However this interface is hidden to the finaluser from Personal Computer or from Smart phone.In addition, by the GUI the user can also set the con-straints about the utilisation of his appliances such asthe earliest and the latest start time. The dashboard theillustrating the data in graphs with several methods arealso configured and set up using the GUI.
Figure 6: EmonCMS input view.
3.2.3 Software setup of the Gateway
Because Raspberry Pi 2 has an ARMv7 processor, itcan run the full range of ARM GNU/Linux distribu-tions, including Snappy Ubuntu Core, as well as Mi-crosoft Windows 10.
On the gateway based on linux operating system,a script is running continuously and it is able to :
• Collect data from all the Libellium Gas sensorboards via Xbee Link.
• Analyse the received data, and in worst cases ap-ply a local calibration based on a lookup tablestored at the gateway.
• Post the data to the IoT plate form using the spe-cific APIs and the required APIkeys.
• Store the collected data in a local data base orin a files to be used for backup during internetdisconnection.
• Detect the case of failure when the system meet adisconnection on the internet link. In that case abackup process is called and it performs the postof missed data to the IoT using past timestamps.
Mohieddine Benammar et al.International Journal of Internet of Things and Web Services
http://www.iaras.org/iaras/journals/ijitws
ISSN: 2367-9115 11 Volume 2, 2017

All the scripts are coded in Python and PHP and ineach instant we post data by creating an array offields in csv format containing the identity of thenode, a timestamp (required for posting past data), theApiKeys and field1, field2,... filedN where all thesefields are in string format.
4 Measurement results
The aim of this part is to evaluate the air quality in aschool. In the following, we will focus our effort onthe evaluation of the air quality such as carbon dioxideCO2, carbon monoxide CO, chlorine Cl2, ozone O3,the temperature, humidity and some other gases.
Continuous air quality monitoring was proceed ina secondary school in Doha (QATAR) during the pe-riod from June 13, 2016 to June 23, 2016. The schoolis open for staff from 6:30 and for the students from7:00 am to 2:00 pm. The students have two breaks,at 10:30 am and at 12:00 pm. The official non work-ing days for schools in Qatar are Friday June 17 andSaturday June 18. In addition, the working time is anon-stop duration from 7:30 am to 2:30 pm.
Figure 7 depicts the measurement results. TheCO2 concentration increases with the increase of oc-cupancy. Thus, during the week-end, from Friday toSaturday, the school is empty, and then the CO2 leveldrops. However, on Saturday, there exists a smallincrease on CO2 concentration between 08:00 am to17:00 am which corresponds to the cleaning activityduring which cleaners are on duty.
Figure 7: Indoor air quality data as displayed by the IOT, Emon-cms web-application.
During the working days, where the students
are in school, the CO2 concentration increases andreaches a maximum between 1500 and 2000 ppm at08:30 am and at 12:30 pm, respectively. The CO2 con-centration starts its decrease at 2:00 pm and reachesthe minimum close to 5:50 ppm. This slow decreaseis due to the fact that the ventilation system requirestime to flash out existing CO2-rich air. The schoolemploys split air conditionners. Indeed, split air con-ditionning, simply cools the air without ventilation.
Figure 7 depicts also results of CO measurementsduring the nine days. For each day, the carbon monox-ide concentration shows a level increase from 4:00 pmto 03:00am (next day). According to the trends in thetemperature and carbon monoxide curves, we can no-tice that the CO concentration is relatively correlatedto temperature.
In urban outdoor air, the presence of NO2 ismainly due to traffic. Nitric oxide (NO), which isemitted by motor vehicles or other combustion pro-cesses, combines with oxygen in the atmosphere, pro-ducing NO2. Indoor NO2 is produced mainly by un-vented heaters and gas stoves. NO2 is also precur-sors for a number of harmful secondary air pollutantssuch as ozone and particulate matter. Exposure toNO2 may affect health independently of any effectsof other pollutants. However, because its presence isclosely linked to the formation or presence of other airpollutants, it is difficult to establish the health effectsattributable to NO2 alone. Figure 7 depicts the NO2
levels during the measurement campaign.Measurements of Chlorine (Cl2) concentration in-
dicate minimum and maximum levels, at 04:00 pmand 03:00 am respectively.
During the nine days, we derived the measure-ments of the Chlorine (Cl2) concentration at theschool (Figure 7). There exist also relative minimumand maximum respectively at the instant 04:00 pm and03:00 am Figure 7.
5 Conclusion
In this paper, we review the ongoing research withinair quality monitoring systems in terms of wire-less communication infrastructure, system architec-ture and IoT platform issues. We perform the anal-ysis of the main challenges in term of communicationtechnologies and data acquisition. A wireless sensornetwork has been designed and implemented for themeasurement of indoor air quality. The sensor nodesare fitted with sensors for measuring carbon dioxide,carbon monoxide, Chlorine and Nitric dioxide in ad-dition to temperature and humidity. A data collection
Mohieddine Benammar et al.International Journal of Internet of Things and Web Services
http://www.iaras.org/iaras/journals/ijitws
ISSN: 2367-9115 12 Volume 2, 2017
campaign in a typical school in Doha Qatar, has beenorganised using the developed platform. All the col-lected data are posted by the proposed platforms toan IoT, to make them well displayed and available forusers from anywhere. Results indicate overall compli-ance with international standards. .
Acknowledgements
This publication was made possible by the support ofNPRP grant NPRP 6 - 600 - 2 - 250 from the QatarNational Research Fund (a member of Qatar Founda-tion). The statements made herein are solely the re-sponsibility of the authors.
References:
[1] Luigi Atzori, Antonio Iera, and Giacomo Mora-bito. The internet of things: A survey. Computernetworks, 54(15):2787–2805, 2010.
[2] Debasis Bandyopadhyay and Jaydip Sen. Internetof things: Applications and challenges in technol-ogy and standardization. Wireless Personal Com-munications, 58(1):49–69, 2011.
[3] Saverio De Vito, Paola Di Palma, Carmine Am-brosino, Ettore Massera, Gianbattista Burrasca,Maria L Miglietta, and Girolamo Di Francia.Wireless sensor networks for distributed chemi-cal sensing: Addressing power consumption lim-its with on-board intelligence. IEEE Sensors jour-nal, 11(4):947–955, 2011.
[4] G. B. Fioccola, R. Sommese, I. Tufano, R. Canon-ico, and G. Ventre. Polluino: An efficient cloud-based management of IoT devices for air qual-ity monitoring. In 2016 IEEE 2nd InternationalForum on Research and Technologies for Soci-ety and Industry Leveraging a better tomorrow(RTSI), pages 1–6, Sept 2016.
[5] Vana Jelicic, Michele Magno, Davide Brunelli,Giacomo Paci, and Luca Benini. Context-adaptive multimodal wireless sensor network forenergy-efficient gas monitoring. IEEE SensorsJournal, 13(1):328–338, 2013.
[6] Ashenafi Lambebo and Sasan Haghani. A wire-less sensor network for Environmental Monitor-ing of Greenhouse Gases. In Proceedings of theASEE Zone I Conference, pages 1–4, 2014.
[7] Dean E Painter et al. Air pollution technology.1974.
[8] PN Pegas, CA Alves, MG Evtyugina, T Nunes,M Cerqueira, M Franchi, CA Pio, SM Almeida,and MC Freitas. Indoor air quality in elementaryschools of lisbon in spring. Environmental Geo-chemistry and Health, 33(5):455–468, 2011.
[9] Kim Fung Tsang, Hao Ran Chi, Luxiang Fu, LiliPan, and Hiu Fai Chan. Energy-saving IAQ mon-itoring ZigBee network using VIKOR decisionmaking method. In 2016 IEEE International Con-ference on Industrial Technology (ICIT), pages2004–2009. IEEE, 2016.
Mohieddine Benammar et al.International Journal of Internet of Things and Web Services
http://www.iaras.org/iaras/journals/ijitws
ISSN: 2367-9115 13 Volume 2, 2017