real-time data transmission and visualization as a
TRANSCRIPT

135
Real-Time Data Transmission and Visualization as a Powerful Technology to Reduce Non-Productive Time During Drilling Operations:
Present Day Capabilities, Limitation, and Future Development
Yustian Ekky Rahanjani, and Budhi NugrahaPetrolink
Mayapada Tower – 9th fl oor – Suite 09-03, Jl. Jenderal Sudirman Kav. 28, Jakarta Selatan, DKI Jakarta 12920, IndonesiaCorresponding author: [email protected]; [email protected]
Manuscript received: October, 5th 2020; Revised: November, 30th 2020Approved: December, 30th 2020 Corresponding author:
ABSTRACT - This paper primarily is focusing on presenting the non-productive time overview and any kind of non-productive time that can be reduced by real-time data technology, real-time data transmission and visualization infrastructure which supports the processes of aggregation, transmission, and visualization; the example of multipurpose implementation and further innovation and improvements that can be made within the real-time data transmission and visualization, such as real-time reservoir footage calculation during geosteering and drill-time calculation to pick the formation tops and casing point; the challenges and limitation while using real-time data, such as VSAT and local network connectivity issue; and future target and improvement of real-time data usage especially to make an artifi cial intelligence system to predict the potential feature, such as formation or drilling problem while drilling. All of those stuff s could be found by literature study and direct professional experience while handling real-time data system. This technology will inspire the user to design their own solution for their operations. Despite the signifi cant advances on real-time data transmission and visualization, there is signifi cant room to fully use its potential for advanced workfl ows and the usage of real-time data technology which was proven to reduce the Non-Productive Time that could save the operational cost. We believe that the utilization of real-time data transmission and visualization will defi nitely increase the effi ciency of the drilling operations, especially for multiple wells operations.Keywords: Real-time data, drilling, operations, non-productive time
How to cite this article:
Yustian Ekky Rahanjani, and Budhi Nugraha, 2020, Real-Time Data Transmission and Visualization as a Powerful Technology to Reduce Non-Productive Time During Drilling Operations: Present Day Capabilities, Limitation, and Future Development, Scientifi c Contributions Oil and Gas, 43 (3) pp., 135-142.
INTRODUCTION
In the present situation, there are many alternatives to keep the profi t in stable margin for the operators. One of them is using real-time data to monitor the drilling operations in real-time and adjust the drilling parameter accordingly to reduce Non-Productive Time (NPT) during drilling operation. NPT is defi ned as the time where drilling is ceased, or penetration rate is very low (Moazzeni, et al., 2010). There are several cases for NPT such as lost circulation,
kicks, stuck pipe, wellbore stability issues, formation breakdown, slow ROP, and drilling/formation problem. Figure #1 shows the time breakdown analysis of more than 200 development wells which were drilled in recent years in Maroun oil fi eld. For example, Figure #1 shows 3% of the rig time was used for fi shing due to stuck pipe issue. These issues spent the cost on rig time basis meanwhile no drilling progress was made. This situation is not benefi cial for the operation. As per the diagram shown on the
© SCOG - 2020
SCIENTIFIC CONTRIBUTIONS OIL AND GASResearch and Development Centre for Oil & Gas Technology
“LEMIGAS”Journal Homepage:http://www.journal.lemigas.esdm.go.id
ISSN: 2089-3361, e-ISSN: 2541-0520
Scientifi c Contributions Oil & Gas, Vol. 43. No. 3, December 2020: 135 - 142

136
Scientifi c Contributions Oil & Gas, Vol. 43. No. 3, December 2020: 135 - 142
Figure #1, the main factor of NPT cause is drilling issue including formation instability and fl uid issues which can be resumed in 33% of drilling operations as shown on green part of the diagram.
There are several kinds of diffi culties faced by the monitoring specialist when they must monitor multiple active wells together in real-time. This can trigger NPT due to human error and monitoring can be done by creating simple alert or real-time calculation ( real-time data analytics) that can be used to minimize human error while handling multiple wells. This can be started by designing the system and understanding the real-time data infrastructure and data fl ow.
METHODOLOGY
Real-Time Data Infrastructure
To support the drilling operations, an integrated and stable system of real-time data components and fl ow are required to support exploration and production business in the oil and gas industry (Khudiri, et al., 2008). Khudiri has modeled the real-time data infrastructure by dividing it as Real-Time Data Hub, which is the WITSML Web services interface to the back-end of an Oracle database, and Real-Time Data Viewer as unique plotting engine that acts as a pure WITSML client application to access the data in the real-time data hub. The data on the viewer has been arranged in standardized format hence it will be easier to be managed (Khudiri, et al., 2015). Meanwhile, the workfl ow is classifi ed into three parts: Data Aggregation, Data Transmission, and Data Visualization as shown in Figure #2.
Data aggregation was described as a process of collecting wellsite data in either the older Wellsite Information Transfer Standard (WITS) or directly in Wellsite Information Transfer Standard Mark-up Language (WITSML) from various service company data acquisition system (DAQs) present at the well-site. The data which typically comes from rig drilling sensors, mud logging, well-testing surface sensors, and downhole measurement while drilling (MWD) and logging while drilling (LWD) sensors will be converted to WITMSL format if the data transmitted from service companies DAQs is still in WITS format. Meanwhile, the data already in WITSML format will be stored in the local WITSML store directly (Khudiri, et al., 2015). In another hand, we could only do the real-time calculation if the data
was converted in the same format. Hence, format standardization is important.
Real-time WITSML Data Store typically consists of log objects (time and depth), mudlog objects (lithology and descriptions), and trajectory (spatial coordinates of the wellbore). Time data will update continuously once the rig spudded and continues updating till rig down. The depth, mud log, and trajectory objects will update while drilling phase and will be indexed by measured depth.
Data transmission can be explained as the process of transferring data through Very Small Aperture Terminal (VSAT) satellite links from the rig site to the corporate Oracle database through a secured virtual private network. This process involves a replication between the local rig site WITSML Store and centralized WITSML Store in town. Using multiple WITSML Web service gateways running on different redundant network segments and sophisticated load balancers, it is possible to guarantee data delivery even when there are servers or network problems.
Data visualization enables the users to view real-time WITSML data from any service company in a standardized display. The displays could be customized according to the monitoring specialist requirements, therefore standard display templates can be created for drilling, geosteering, exploration, well-testing, and real-time operations center, etc.
Data Analytics as Improvement Example
As mentioned above, real-time data is required by monitoring specialist to monitor the wells but there’s a special challenge if they are monitoring many active wells at the same time or if there is essential data missing. Hence, a calculation or smart alert in real-time would be needed to ease the monitoring specialist’s jobs. In these cases, two kind examples of implementation were provided. There is usage of real-time reservoir footage calculation while geosteering and using the calculated drilltime from ROP to pick shallow casing point.
One of the examples is calculating reservoir footage in real-time. The operation or geosteering geologist must know how long the length of wellbore contact with the reservoir while drilling to decide the total depth. This is what is called as reservoir footage, as they may need to check the situation to reach the target. This kind of evaluation requires them to do a quick look analysis on the logs so they can identify which part of the wellbore penetrating the reservoir.

137
Real-Time Data Transmission and Visualization as a Powerful Technology to Reduce Non-Productive Time During Drilling Operations: Present Day Capabilities, Limitation, and Future Development (Rahanjani, Y.E., & Nugraha, B.)
Figure 1Time breakdown diagram of drilled development wells in Maround oilfi eld.
Once it is done, they can calculate how long the horizontal section contacted the reservoir. This process can take a lot of time and challenge will be there if they must monitor many horizontal wells. this challenge can trigger NPT especially if they must stop the operations just to take a decision based on the quick look interpretations. In this case, we can utilize real-time calculator that can be placed in WITSML Data Store and display it on the visualization platform. Rahanjani already introduced a workfl ow to calculate the reservoir footage in real-time that can be seen in Figure #3. The logs which are available in WITSML format are fi ltered and calculated by the data analysis engine containing formula shown in Figure #4. The reservoir footage calculated in real-time is a temporary reservoir length to be analyzed and calculated by the geologists soon after their well reached the Total Depth (TD) or in the middle of drilling operations. Each reservoir has its petrophysical value range or cut-off . For example, a clean sand reservoir will have a gamma-ray value below a gAPI, resistivity value between x ohm.m and y ohm.m, and porosity above b, the data rate average of the real-time data is n, and reservoir footage is F, then the formula can be seen in Figure #4 (Rahanjani, et al., 2018). As shown on the Figure #4, the result of
reservoir footage could be calculated by multiplying the data average rate with all of the data points which were fulfi lling the criterion as the resistivity reading will be less than y and more than x ohm.m, gamma ray reading less than a gAPI, and the resistivity more than b v/v then the result is decreased by n as the reservoir length will be less than n considering the steps. The fi eld geologist who usually take hours to decide the well total depth will get their job eased as they can get the calculation result immediately which usually could take around 1 hour to be calculated.
Another example of real-time data usage is to combine the drilling parameter data in real-time to create a new log called drilltime to pick shallow casing point. The team of real-time data specialist will process the time log, hole depth, rate of penetration (ROP), and rotation per minute (RPM) log in a data analysis engine through a special algorithm to create a drill-time log which is defi ned as “the time taken to drill every x feet” indexed by depth (Figure #5). The algorithm was designed in such a way that it will automatically update only when the drilling is in progress (Alabdulkarim, et al., 2017). Later, the drilltime was displayed with lithology data on the correlation panel (Figure #6), hence the geologist

138
Scientifi c Contributions Oil & Gas, Vol. 43. No. 3, December 2020: 135 - 142
Figure 2Real-time data fl ow from the rig to the monitoring specialist.
Figure 3 Real-time reservoir calculation workfl ow.

139
Real-Time Data Transmission and Visualization as a Powerful Technology to Reduce Non-Productive Time During Drilling Operations: Present Day Capabilities, Limitation, and Future Development (Rahanjani, Y.E., & Nugraha, B.)
Figure 5 Legacy Data Fetching (Alabdulkarim, et al., 2017).
Figure 4 Formula to calculate reservoir footage in real-time (Rahanjani, et al., 2018).
will be able to pick the formation top and casing point based on the similar signatures of drilltime and lithology data (Alabdulkarim et.al., 2017). In this case, drilltime can be used as an alternative to pick the formation top in real-time by comparing it with lithology data if the gamma-ray log is not available.
Limitation of Real-Time Data Transmission
Based on the Figure #2, we can see that there are 5 components affecting the real-time data transmission. There are satellite network, local network, hardware, software and power supply. Based on the infrastructure-wise, we can identify what could be a problem on each segment of real-time data workfl ow.
Data aggregation was described as a process of collecting the rig data in WITS or WITSML and converting the data from WITS to WITSML. Based on the experience, there are several cases of WITSML ‘wrong translation’ because of changing on WITS channel. This could be triggered by software and hardware problem as it is mainly related to the DAQ and the error on application
converter. Meanwhile, the problem on the data transmission which is described as the process of transferring data through Very Small Aperture Terminal (VSAT).
satellite links mainly related to the satellite network. The satellite network issue could be caused

140
Scientifi c Contributions Oil & Gas, Vol. 43. No. 3, December 2020: 135 - 142
Figure 6Legacy Data Real-Time Correlation Viewer (Alabdulkarim, et al., 2017)
Figure 7The relationship of real-time system segments and problem’s aspects.
141
Real-Time Data Transmission and Visualization as a Powerful Technology to Reduce Non-Productive Time During Drilling Operations: Present Day Capabilities, Limitation, and Future Development (Rahanjani, Y.E., & Nugraha, B.)
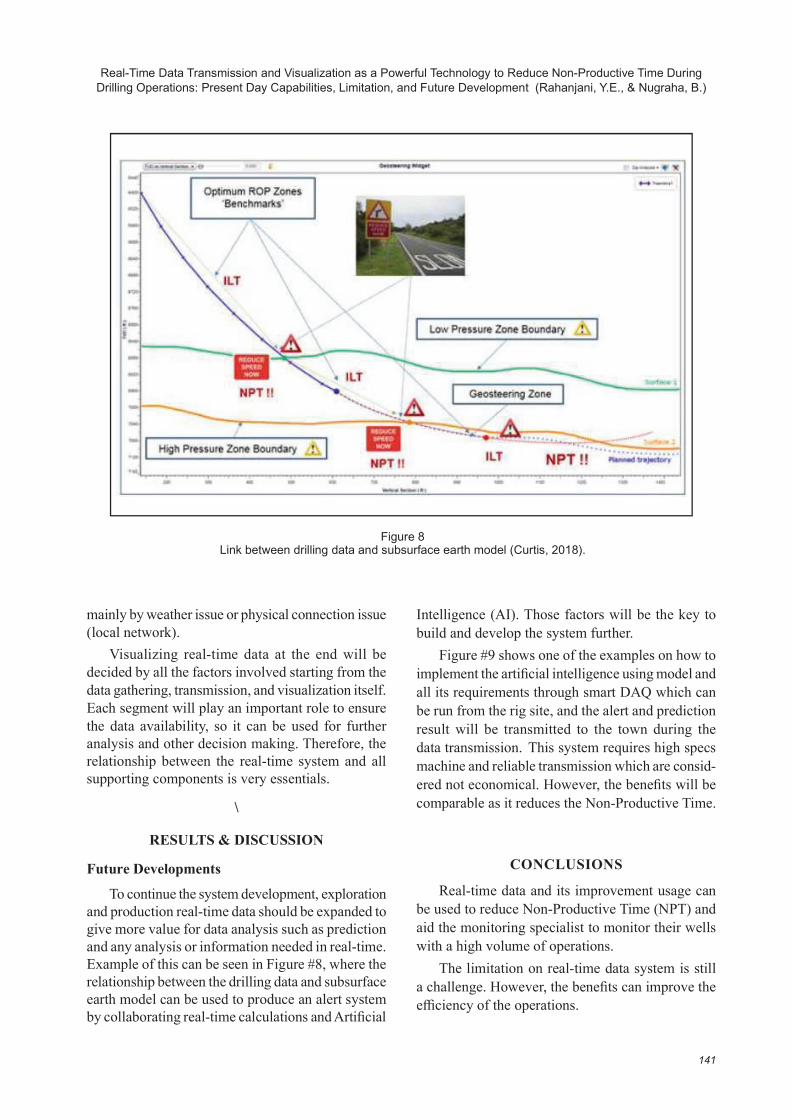
Figure 8Link between drilling data and subsurface earth model (Curtis, 2018).
mainly by weather issue or physical connection issue (local network).
Visualizing real-time data at the end will be decided by all the factors involved starting from the data gathering, transmission, and visualization itself. Each segment will play an important role to ensure the data availability, so it can be used for further analysis and other decision making. Therefore, the relationship between the real-time system and all supporting components is very essentials.
\
RESULTS & DISCUSSION
Future Developments
To continue the system development, exploration and production real-time data should be expanded to give more value for data analysis such as prediction and any analysis or information needed in real-time. Example of this can be seen in Figure #8, where the relationship between the drilling data and subsurface earth model can be used to produce an alert system by collaborating real-time calculations and Artifi cial
Intelligence (AI). Those factors will be the key to build and develop the system further.
Figure #9 shows one of the examples on how to implement the artifi cial intelligence using model and all its requirements through smart DAQ which can be run from the rig site, and the alert and prediction result will be transmitted to the town during the data transmission. This system requires high specs machine and reliable transmission which are consid-ered not economical. However, the benefi ts will be comparable as it reduces the Non-Productive Time.
CONCLUSIONS
Real-time data and its improvement usage can be used to reduce Non-Productive Time (NPT) and aid the monitoring specialist to monitor their wells with a high volume of operations.
The limitation on real-time data system is still a challenge. However, the benefi ts can improve the effi ciency of the operations.

142
Scientifi c Contributions Oil & Gas, Vol. 43. No. 3, December 2020: 135 - 142
Figure 9Machine learning model workfl ow (Curtis, 2018).
The implementation of Artifi cial Intelligence can be used to enhance the capability of a real-time system to do more high processing data analysis.
ACKNOWLEDGEMENTS
We would like to thank the Petrolink Management for their support and inspiration, so this paper can be completed.
GLOSSARY OF TERMS
REFERENCES
A. R., Moazzeni, M., Nabaei, & S., Ghadami Jegarluei., 2011, SPE Digital Energy Conference and Exhibition, 2-3,8.
Alabdulkarim, D., Saklou, M., Khudiri, Musab, Ghamdi, Yasser, Barayyan, Mohammed, Amer, M.A., Rasheed, & Farhan, Kashif, M., 2017, SPE ATSE, 3,7-8.
Amer, M.A., Kashif, M., & Meraj, H., 2018, PAPG and SPE Pakistan 25th ATC,4.
Curtis, Jon, 2018, SPE Webinar, 5-6.Khudiri, Musab, Sanie, Faisal, Miyajan, Ramzi, Wu-
haimed, Ali, Hawi, Maan, & Abbas, Mazin, 2015, SPE ATSE, 3-5.
Rahanjani, Y.E., Nair, Ragesh, Nugraha, Budhi, & Fe-rianto, Teguh, 2018, SPWLA Asia Pacifi c Technical Symposium, 2,7