real time automated transcription of live music into sheet music using...
TRANSCRIPT

18551: Digital Communication and Signal Processing DesignSpring 2000
Real Time Automated Transcription of Live Music intoSheet Music using Common Music Notation
© United Media
Final Report Ð 8 May 2000
Group 9
Kevin Chan (kschan)Supaporn Erjongmanee (supaporn)
Choon Hong Tay (ctay)

2
Table of Contents
Abstract
1.0 IntroductionProblem DescriptionDiscussion of Prior work in 18-551Constraints
2.0 Overview of SolutionPitch Estimation Analysis
A Simple ApproachDaubechies Derivative Wavelet FilterThe Combination Wavelet/FIR FilterCleaning Up Unwanted PeaksUnpitched Notes and Error Rejection
Musical PropertiesNotes & FrequencyDurationTiming JitterInstrument Analysis Ð ViolaMusic TranscriptionCommon Music NotationMerging of Notes
3.0 Our ProcessMatlab to C conversionEVM ImplementationGraphical User InterfaceFlow Chart
4.0 ResultsAccomplishmentsTiming, OptimizationsEVM Memory UsageProblems EncounteredWhy there are two versionsTowards Real-Time ImplementationProgress through the semesterPurchases
5.0 Summary
6.0 Web links and References

3
Introduction
Problem Description
The objective of this project is to implement a system on the C67 EVM board that willaccept live music through a microphone, detect the notes and transcribe them into sheetmusic in real time. Past projects have only attempted the transcription of recorded music,while this project attempts to perform the same in real time with live music. CommonMusic Notation is employed as the application to convert detected notes into sheet music,given its flexibility and portability.
Prior Work in 551
There were two projects in the past that attempted the same problem, with the followingfeatures:
Spring 97: STFT implementation using ideal synthesizers as input.Spring 98: WT implementation, also using ideal synthesizers.
In both cases, there was no implementation on the EVM.Both projects noted difficulties in getting the pitch detection process to work right, withunwanted notes appearing in the output. It should also be clear that both projects usedfrequency-domain techniques at their core.
This project, on the other hand, shifts away from conventional frequency-domain analysistechniques and utilizes a simple yet innovative time-domain approach that proves to workwell. As will be described later, the use of special wavelets and improvements to themproduced a remarkably robust pitch detection algorithm.
This project is also the first attempt at incorporation of clef, tempo, and meter into themusical transcription. This implementation of meter and tempo affected the transcriptionof the notes in that changes of meter and tempo altered the resulting notes. This is due tothe varying lengths of notes corresponding to the various tempos and meters possible.
Constraints of the Project
• The detection of music is limited to 2 octaves, C4- C6.
• The transcription of music is limited to any note as long as or longer than asixteenth note or rest. The detection can detect any length of note.
• The input signal must be in the presence of low noise.
• The application will only detect single-tones from single instruments.

4
Overview of Solution
Pitch Estimation Analysis
Pitch detection of musical sounds is, by their very nature, extremely difficult andchallenging. Currently, there exists no satisfactory polyphonic pitch detection algorithm,due to the non-trivial harmonic structure of musical sounds of various instruments. It isdecided that attempting polyphonic pitch detection will be beyond the reach of thisproject, therefore only monophonic pitch detection will be performed.
Pitch detection can be summed up readily into two separate categories: Time-domain andFrequency-domain. Frequency-domain techniques usually involve some kind of Fourier-type analysis on the musical signal. Most notable of these techniques include the Short-Time Fourier Transform (STFT) or the Discrete Wavelet Transform (DWT). Frequency-domain techniques are governed by the time-frequency tradeoff, i.e. greater frequencyresolution can be achieved at the expense of time resolution, and vice versa. Both STFTand DWT have their corresponding tradeoff schedule, but the DWT seems to performbetter with regard to the logarithmic musical scale.
Time-domain techniques usually revolve around finding zeros crossings or maximums inthe signal and calculating the pitch period. If musical signals are composed of simplesinusoids, this problem becomes very trivial. However, harmonics cause the signal tohave multiple zero crossings and the problem becomes more involved.
A Simple Approach
The approach used in this project involves using a time-domain event detection methodfor finding the pitch period of the musical signal. It is based on Wendt and PetropuluÕs1
work on speech signals. In their paper, they described the estimation of pitch period ofspeech signals by determining the ÒGlottal Closure Instants (GCIs)Ó and measuring thetime period between each event. It is instantly clear that the signal is processed period byperiod, which provides impressive time and frequency resolution.
The method proposed was to use a Òsingle derivative filtering function defined to containa specific bandwidth of voiced speech. This process produces a filtered signal with well-defined local maximums where GCIs occur in the speech signalÓ. It became apparent thatthis method promises a dramatic simplification in terms of processing, for onlyconvolution is used.
1 Wendt and Petropulu: Pitch Determination And Speech Segmentation Using The Discrete WaveletTransform

5
Building upon this work by Wendt and Petropulu, Jehan2 investigated the application ofthis algorithm towards musical signals in this thesis at CNMAT with some success onethnic flutes, which have very simple harmonic structures. Suitably excited by thisdevelopment, our group decided to try and implement this algorithm on the EVM board,with some essential changes that will be described later in this paper.
The Derivative Filter Ð Daubechies Wavelets3
Much work has been performed by Daubechies in the field of wavelets. Specifically, shedeveloped a class of wavelets that produced derivative filters, which possessed thecharacteristics of maximal-flatness and minimal length. A thorough explanation ofcharacteristics of wavelets and the method of deriving them is beyond the reach of thisproject. The wavelets and the final derivative function were chosen by utilizing aDaubechies wavelet generating function and investigating the properties of the resultingwavelet. This function is part of a complete set of wavelet functions for MATLABwritten by the Universidad de Vigo.
Generating the Derivative Wavelet
The first step in the design process involves deciding on the order of the Daubechieswavelet. In general, the higher the order, the longer the filter and this provides a betterperforming filter. However, it becomes more computationally intensive. With this inmind, the 8th order Daubechies wavelet was chosen. The MATLAB function returns thecoefficients of the Daubechies wavelets.
Following that, the coefficients are passed into another function that generates thewavelet and scaling functions. This function also takes as input the frequency band ofinterest. From the wavelet and scaling functions, the final filtering function was derived.Specifically, the scaling function from the high cut-off frequency wavelet was convolvedwith the wavelet function from the low cut-off frequency wavelet.
The frequency responses of the wavelets used for both the 4th and 5t h octaves arereproduced on the next page.
2 Jehan: Musical Signal Parameter Estimation3 Burrus, Gopinath and Guo: Introduction to Wavelets and Wavelet Transforms: A Primer

6
Figure 1
Figure 2

7
Recall that the 4th octave ranges from 261Hz to 494Hz while the 5th octave ranges from523Hz to 988Hz. It should be observable that the wavelets do have a frequency responsesimilar to the ranges of interest. However, they are still not satisfactory as bandpassfilters, particularly since the sidelobes are of relatively high magnitude.
Complex harmonic structures of instruments tend to create difficulties for zero-crossingdetection, in that they add more zero-crossings. If a bandpass filter can remove all thehigher harmonics, this problem will be resolved. As seen above, the wavelets bythemselves are not quite satisfactory since they still allow some of the next harmonic topass through. Therefore, improvements to the wavelets used in the thesis need to be done.
The Combination Wavelet/FIR filter
In order to resolve the above problem, lowpass FIR filters were brought into the picture.Specifically, they were convolved with the wavelets to suppress the sidelobes further.They were designed such that the cutoff frequency was in between the last note of theoctave of interest and the first note of the next octave. Here are the improved filters:
Figure 3
8
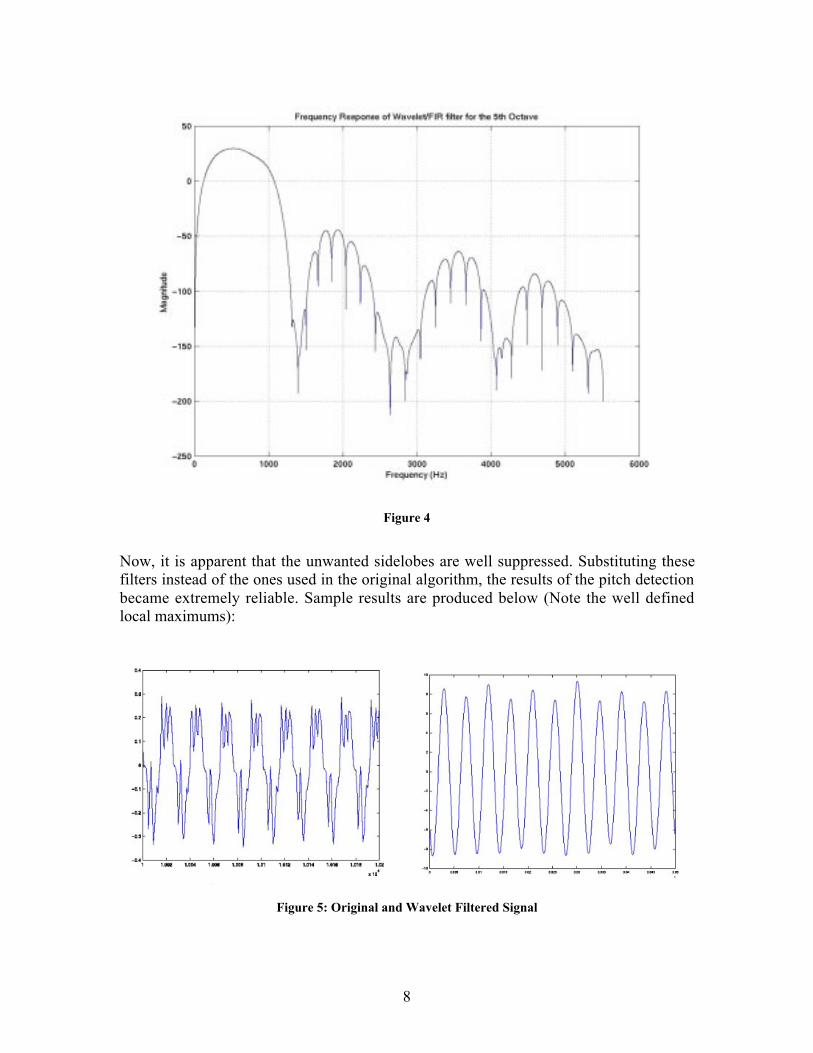
Figure 4
Now, it is apparent that the unwanted sidelobes are well suppressed. Substituting thesefilters instead of the ones used in the original algorithm, the results of the pitch detectionbecame extremely reliable. Sample results are produced below (Note the well definedlocal maximums):
Figure 5: Original and Wavelet Filtered Signal

9
Locating the Actual Maximums
While plots of the filtered signal shows the peaks as rather smooth curves, samplingusually causes the maximum to be located somewhere other than the location of thesamples. In his thesis, Jehan solved this problem by using a parabolic approximationtechnique. He used a parabola to fit three points that span the location of the maximum.
Figure 6: Illustration of Parabolic Approximation (Taken from Jehan)
The maximum is found by the following calculations (JehanÕs method):
)(
:
)()()(
)()()(
:
:
:
2121
21
32
31
31
21
21
3123
2131
2122
2121
3233
2222
1211
xxaxx
yyb
xx
xx
yy
xx
yy
a
Solving
xxbxxayy
xxbxxayy
cbxaxyC
cbxaxyB
cbxaxyA
+−−−
=
−−−
−−−
=
−+−=−−+−=−
++=++=++=
Finally, the maximum is located at Ðb/2a.
10
With this method, a more precise value of the pitch period can be obtained. This step isimportant since a slight change in the pitch period will cause a large effect on thecalculated frequency, which will in turn cause errors in the pitch estimation.
Cleaning up unwanted peaks
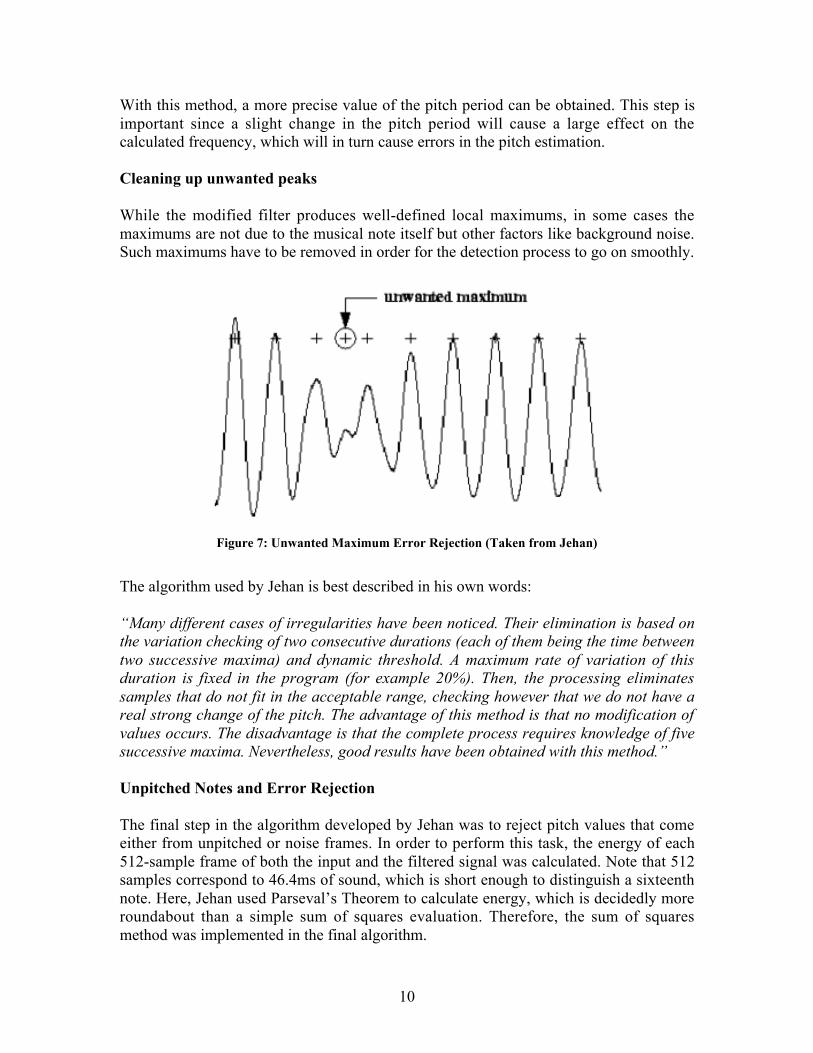
While the modified filter produces well-defined local maximums, in some cases themaximums are not due to the musical note itself but other factors like background noise.Such maximums have to be removed in order for the detection process to go on smoothly.
Figure 7: Unwanted Maximum Error Rejection (Taken from Jehan)
The algorithm used by Jehan is best described in his own words:
ÒMany different cases of irregularities have been noticed. Their elimination is based onthe variation checking of two consecutive durations (each of them being the time betweentwo successive maxima) and dynamic threshold. A maximum rate of variation of thisduration is fixed in the program (for example 20%). Then, the processing eliminatessamples that do not fit in the acceptable range, checking however that we do not have areal strong change of the pitch. The advantage of this method is that no modification ofvalues occurs. The disadvantage is that the complete process requires knowledge of fivesuccessive maxima. Nevertheless, good results have been obtained with this method.Ó
Unpitched Notes and Error Rejection
The final step in the algorithm developed by Jehan was to reject pitch values that comeeither from unpitched or noise frames. In order to perform this task, the energy of each512-sample frame of both the input and the filtered signal was calculated. Note that 512samples correspond to 46.4ms of sound, which is short enough to distinguish a sixteenthnote. Here, Jehan used ParsevalÕs Theorem to calculate energy, which is decidedly moreroundabout than a simple sum of squares evaluation. Therefore, the sum of squaresmethod was implemented in the final algorithm.

11
With the energy values, rejection of pitch values will take place whenever the inputsignal energy is below a set threshold (which means that there is no signal). A value of1% of the maximum energy of the signal was used as this threshold by Jehan, whichworked well. Pitch values will also be rejected if there is no energy in the filtered signal(which occurs if the signal is unpitched). The third criterion for rejecting pitch is if thepitch track exhibits rapid variations. From simulations, this is observed to occur for loudnoise with some tonal quality.
Musical Properties
Two fundamental properties of music are the characteristics of notes: pitch and duration.Through appropriate analysis, the pitch and duration of every note can be identified. Inthis way, the musical transcript can be accurately constructed with proper detection.
Notes and Frequency
Notes are grouped into sets of twelve notes called an octave. These notes: A, A#, B, C,C#, D, D#, E, F, F#, G, and G#. These notes cyclically repeat, and are assigned aparticular octave number. There are a total of 10 octaves in the musical range. Notesrange from C0 (about 16 Hz) to C10 (16 kHz).
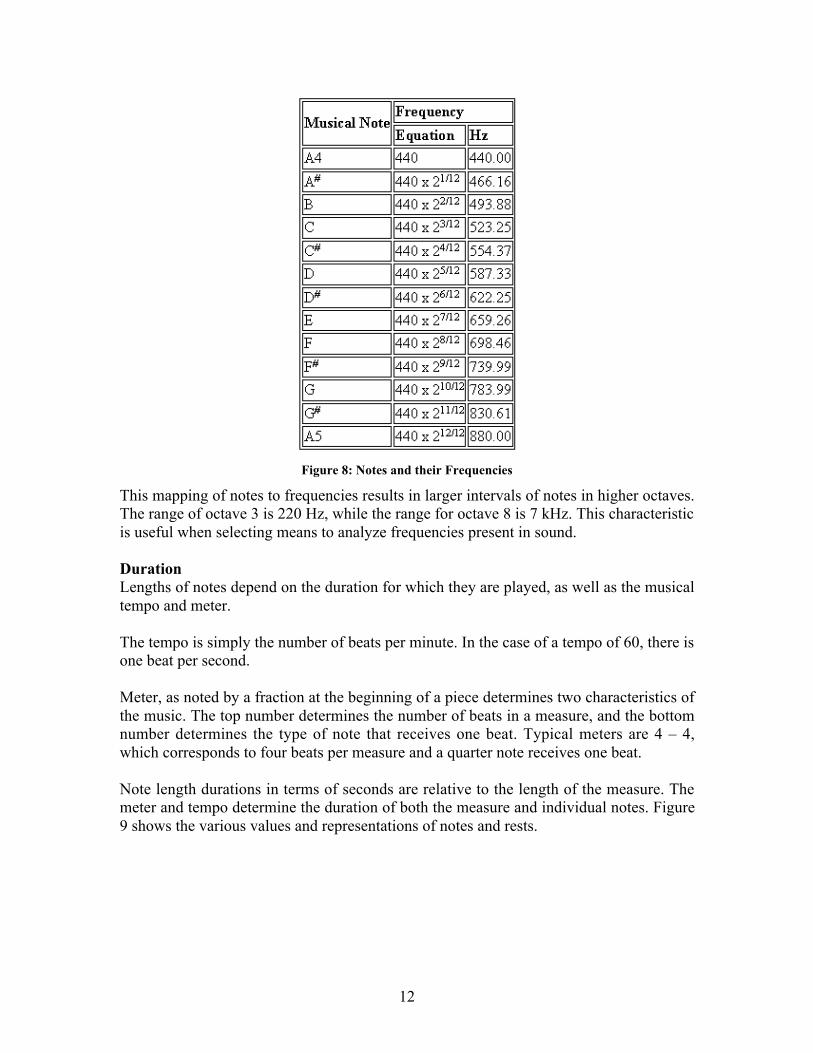
Pitch can determined if the frequency present is identifiable. A standard mappingconvention between pitch and frequency has been established. The convention commonin western music is the A-440 basis, where every note is based upon the frequency 440Hz, equivalent to the note A4. Every other note, denoted by pitch and octave, is related to440 Hz. The A in every octave is a multiple of 440; therefore the A5 corresponds to 880Hz. Notes in the same octave are related to the corresponding A on an exponential scale.Figure 8 shows the mapping of notes to frequencies for the fourth octave.
12
Figure 8: Notes and their Frequencies
This mapping of notes to frequencies results in larger intervals of notes in higher octaves.The range of octave 3 is 220 Hz, while the range for octave 8 is 7 kHz. This characteristicis useful when selecting means to analyze frequencies present in sound.
DurationLengths of notes depend on the duration for which they are played, as well as the musicaltempo and meter.
The tempo is simply the number of beats per minute. In the case of a tempo of 60, there isone beat per second.
Meter, as noted by a fraction at the beginning of a piece determines two characteristics ofthe music. The top number determines the number of beats in a measure, and the bottomnumber determines the type of note that receives one beat. Typical meters are 4 Ð 4,which corresponds to four beats per measure and a quarter note receives one beat.
Note length durations in terms of seconds are relative to the length of the measure. Themeter and tempo determine the duration of both the measure and individual notes. Figure9 shows the various values and representations of notes and rests.

13
Figure 9: Naming Convention of Notes and Rests
Source: http://library.thinkquest.org/15413/
Within the application, this project detects notes relative to the length of a measure.Should the length of a note be recognized as being played for less than the sensitivity ofthe detection (set to the duration of a 16th note), it is rejected. This affects the detection inthat the same music sample will result in differing transcriptions due to differingsensitivity.
These calculations are as follows:
√√↵
↔√√↵
↔=
beatonegetsthatnotetempouteperbeatsmeasure
____
0.40.60min__
beatonegetsthatnotetempo
ysensitivit ____0.60 √√↵
=
Timing JitterWith respect to transcription, the application does not account for small nuances andliberties with regards to tempo. Small articulation or unintended pauses diminish theperformance of the transcription. This is rather common in real life music where humanerror is suspect.

14
ViolaThe intention of the project is to detect notes played on a viola. The viola is a member ofthe string family of instruments. Its range of notes is C4 to C7. This range is lower thanthe violinÕs range and higher than the celloÕs range. The viola has strings (in order fromlowest to highest) of C, G, D, and A.
Instrumental characteristics
Box VibrationThe viola presents a difficulty in detection of pitch in that the box of the instrumentvibrates at a constant 125 Hz when played. This intentional design characteristic makesdetection difficult when playing its lowest note, the C3, which is equivalent to 125 Hz.Because of this, the C3 octave is not of interest in this project.
HarmonicsHarmonics are present in all musical sounds. When a note is played, the same note athigher octaves is sounded. This poses a problem in the detection of notes. Our detectionscheme takes into account this characteristic by always selecting the lowest note detected.This is reasonable since the detection is performed separately for each octave.
In the case of a viola, many harmonics are present. Figure 10 compares the harmonicstructure of a viola sample to that of a flute, one instrument with a very simple harmonicstructure. With this characteristic, should the input signal be a viola, filtering of some sortis required to reject the unwanted harmonics.
Figure 10: Comparison of Harmonic Structures

15
Music TranscriptionFrom the pitch detection process, the frequencies and durations of notes can be identifiedfor an entire music sample. Using look up tables containing the mapping between everyfrequency and their corresponding notes as well as another table containing the durationsof the rests and notes, the transcription process produces the desired standard musicalnotation.
Merging of Notes
The general thinking behind the merging of the two note estimation streams is toeliminate the higher harmonics present in music. By detecting two different octaves, anote played in the fourth octave would produce a harmonic in the fifth octave. Therefore,the task is to choose the correct note that was played.
The algorithm starts at the first note to be detected. Upon each note, the time of theresulting final note estimation is updated to the end of the last note. This results in 6 casesof merging. They are as follows:(Let Note1 and Note2 to denote the streams of notes)
1) Note1 starts first and the next Note2 ends after Note1 ends. If the Note2 containsa higher harmonic of Note1, the final note is the lower harmonic. The duration isupdated to the beginning of note1 to the end of Note2.
2) Note1 starts first and the next Note2 ends before Note1 ends. If the Note2contains a higher harmonic of note1, the final note is the lower harmonic. Theduration remains as from the beginning of Note1 to the end of Note1.
3) Note1 starts first and the next Note2 starts after Note1 ends. In this case, the finalnote is Note1.
4) Ð 6) is the reverse of cases 1) Ð 3) with Note2 starting first.
Common Music NotationOnce these elements of music are identified, the stream of notes is transcribed into a .cmnfile, which stands for Common Music Notation. This method to represent music is anapplication developed by the Center for Computer Research in Music and Acoustics atStanford University. Upon compiling a simple text representation of music, a lisp scriptconstructs the graphical music representation.
For ÒTwinkle Twinkle Little StarÓ, the code is:(cmn staff Treble (meter 4 4) d4 q d4 q a4 q a4 q b4 q b4 q a4 h g4 qg4 q fs4 q fs4 q e4 q e4 q d4 h double-bar)
The generated .eps file looks like:
Figure 11: Graphical CMN output

16
Our Process
C-conversion
As described above, most of the algorithm used was drawn on the work of Jehan in histhesis. Gratefully, he provided all the MATLAB code used in his thesis. Conversion fromMATLAB to C was rather straightforward when the details of the code were understood.However, two aspects of his code were revamped, as listed:
• conv() function was changed to overlap-add FFT implementation to improve onthe speed of evaluation as well as for block by block processing (useful for real-time implementation).
• Energy function was rewritten to that of simple sum of squares• Wavelets used were combined with FIR filters to refine their frequency responses,
resulting in an even more robust algorithm.
The most difficult part of C-conversion implementation was ensuring that the vectorindices were aligned properly. Since the entire code is spread over many separatefunctions, each function was tested for correctness before linking it to the other functions.With all the blocks linked up, the preliminary C-code was tested with several testingmusic files (all composed of music from ideal synthesis) to ensure correctness.
After C-code conversion was done, some optimizations were done to reduce the amountof memory required. Redundant variables were removed and several trivial constantfunctions were eliminated.
At this stage, it was discovered that Jehan stopped his analysis right after the pitch valuesand the times that they occur were obtained. Therefore, additional functions were writtento translate the pitch values and durations into standard musical notation. With twoseparate octaves being tracked at the same time, yet another decision process was writtento merge the notes correctly into a single stream.
EVM implementation
The EVM implementation was based on the code from lab 1 and 3. The PC willsend two sets of FIR coefficients, two sets of Wavelet coefficients, a note lookup table,and the measure to the EVM. However, on-chip EVM memory cannot accommodate alldata at once. Instead of sending together, the PC sends the first batch of wavelet and FIRcoefficients and waits till the combination filter is evaluated. Then the second batch issent and stored over the existing buffers for the calculation of the second combinationfilter. At this point, the PC will send the rest of input to the EVM.
The algorithm used is based on a sampling rate of 11025. This rate ensures thatthe highest note of interest (C6) is well within the cutoff of about 5 kHz (the Nyquistsampling criterion).
17
For the 10-second live implementation, after receiving all the essential data, theEVM is ready to record the music signal. A nominal value of 10 seconds was chosen asthe time limit for recording. After acquiring the signal from the codec, the EVM will callthe pitch detection function to perform energy calculation and pitch/durationdetermination. After this process, two streams of output notes well as their start and stoptimes are sent back to the PC.
For the 10-second segments version, 10-second segments of the music signal aresent sequentially from the PC to the EVM. Segments are processed individually with theresults being sent back to the PC before the next segment is sent to the EVM.
Graphical User Interface
After the implementation on the EVM was complete, a GUI was created with thenovice user in mind. The GUI is composed of two portions, namely, input and output. Inthe input portion, there are four main fields that the user needs to input: the tempo, thenumber of beats per measure, the note that gets one beat and the clef.
Several buttons on the interface control the entire program:
• Reset: Clear the input data• Done: Click this button to lock in values• Initialize: Initialize EVM Board; EVM gets filters and tables ready• Start: Commence recording• Back, Next: Scroll through the pages of output• CMN: Launches the cmn program, converts notes to sheet music• Exit: Exit the program
Results from the PC are displayed in the output portion of the interface.
The interface of 10-second (segment) version is adopted from the 10-second (live)version interface. In this case, a browsing function is added to allow the user to selecthis desired file. The Initialize button completes the entire process without any furtherintervention from the user.
A simple, intuitive interface for the program was desired to enable anyone to usethe program without any need for deep technical knowledge.

18
Figure 12: Flow Chart of System

19
Results
Accomplishments
The pitch detection algorithm works as advertised, that it is robust and simple inimplementation. For both versions, the program reliably detects the notes between C4 andC6. When tested with synthesizers, perfect recognition was achieved. However, detectionusing real instruments resulted in outputs that contained some minor errors (e.g. somehalf notes were split into two quarter notes). Such problems are expected, arising fromvariations and complexities in the instruments rather than the algorithm.
Final Timing Data and Optimizations
All calculations are for a 10 second block of input signal.
10s (Live) version: 675 million cycles10Xs (Segmented) version: 500 million cycles
Before optimizations:
10s version: 1 billion cycles10Xs version: 900 million cycles
From the code, it is apparent that the period-by-period processing of signals required nodouble loops (except for either traversing through the array or the one case whereelements in an array were removed), therefore no unrolling of loops was applicable. Theonly optimization performed was rewriting the energy function.
There is one part of the code that generated some thoughts as to whether a linked-listimplementation or a direct array implementation will have worked faster. The part inquestion was the direct array implementation of the maximums array, where removal ofan unwanted maximum was tricky. In a linked-list implementation, removal will beconstant time while removal in an array is linear. However, after examining the code, alinked-list implementation will not be feasible since accesses become linear time whilethe array implementation only requires constant time! It is decided that since noderemoval will be minimal, an array implementation is more desirable.
DMA transfers between data in internal and external memory was not looked into simplybecause more pressing aspects of the project were at hand, namely real-timeimplementation.

20
EVM Memory Usage
Input Signal: 220500*(4 bytes) Filtered Signal: 2*110250*(4 bytes) Filterbanks: 2*2048*(4 bytes) Maxima/Pitch: 4*110250*(4 bytes) Intermediates: 2*110250*(4 bytes) Energy Array: 4*1000*(4 bytes) Outputs: 6*100*(4 bytes) Note Match Array: 2000*(4 bytes) Others: Non significant Total: 4.35 Mbytes
This is well within the 8MB that the board has onboard. Nevertheless, every attempt wastaken to keep this usage as small as possible. Buffers were reused whenever possible(especially for the calculation of filter coefficients). With a real-time implementation,memory usage will be decreased further, since the entire signal need not be kept all atonce.
Problems Encountered
While the porting of MATLAB code to C code went rather uneventfully, the porting ofour generic C code to one implementable on the EVM was more frustrating. Often,results were incorrect due to memory issues. It was after much trial and error and askingthe TAs that the problem was discovered. As a result, much more time than projected wasused in getting the EVM to work correctly. As an example, the assembly FFT routinedemands that twiddle factor tables be stored in on-chip memory and be aligned to an 8-bitboundary. This requirement was not known before and the documentation was notimmediately obvious.
Unfortunately, these problems slowed the implementation down and in the end less thantwo weeks were left to implement a real-time version of the code. With the remainingtime, an analysis of running time was performed on the code (with and without thevarious simplifications to the code). Both analyzes suggest that real-time implementationwas indeed possible, and work on conversion began immediately. However, halfwaythrough the change, testing showed that the filling up of buffers occurred faster than therunning of the rest of the program. This was puzzling, for the running times were wellwithin the theoretical limit, with or without simplifications.
Why there are two versions
As described, real-time implementation was not achieved. However, demonstrating thatthe program will work for live input from the codec as well as for long signal lengths wasdesired. Therefore, two versions evolved from the same core code, the 10-second (live)version and the 10-second (segment) version.

21
Towards Real-Time Implementation
At the end of the project, it was disappointing to discover that the major setback towardsachieving real-time implementation was the slowdown due to Code Composer (with itsextremely slow printf() functions). Various steps were taken right from the start to movetowards this goal, for example, overlap-add convolution using FFTs as well as rewritingthe energy function to speed it up. All other functions were in line with the fact that thealgorithm allowed for the processing of the signal period by period. The only thing left todo was to break up the loops in the functions that were used to traverse the entire signalarray and recombine the outputs from each segment in the right order. Also, the note-matching process was achieved in constant time by the usage of a lookup table stored inan array. It was also discovered that the Radix-2 FFT is interruptible, and hence will notbe affected by the reading in of samples from the codec.
Our group was in the midst of translating the code into a real-time version when testswith Code Composer suggested that real-time implementation was not possible, butclose. Unfortunately, it was decided then that real-time implementation be set aside,leaving the little time left to put together a more complete package for the ordinary user.Hence the intuitive visual interfaces to the EVM board as well as several tweaks to themerging functions to make them more consistent.
22
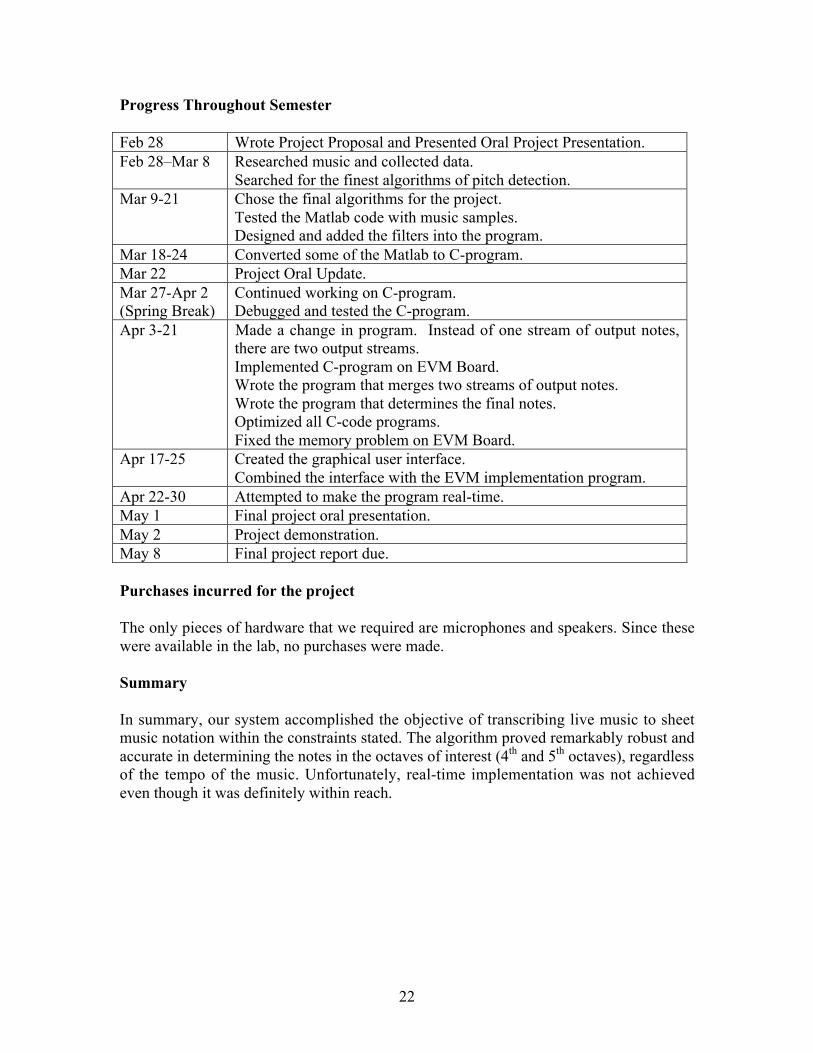
Progress Throughout Semester
Feb 28 Wrote Project Proposal and Presented Oral Project Presentation.Feb 28ÐMar 8 Researched music and collected data.
Searched for the finest algorithms of pitch detection.Mar 9-21 Chose the final algorithms for the project.
Tested the Matlab code with music samples.Designed and added the filters into the program.
Mar 18-24 Converted some of the Matlab to C-program.Mar 22 Project Oral Update.Mar 27-Apr 2(Spring Break)
Continued working on C-program.Debugged and tested the C-program.
Apr 3-21 Made a change in program. Instead of one stream of output notes,there are two output streams.Implemented C-program on EVM Board.Wrote the program that merges two streams of output notes.Wrote the program that determines the final notes.Optimized all C-code programs.Fixed the memory problem on EVM Board.
Apr 17-25 Created the graphical user interface.Combined the interface with the EVM implementation program.
Apr 22-30 Attempted to make the program real-time.May 1 Final project oral presentation.May 2 Project demonstration.May 8 Final project report due.
Purchases incurred for the project
The only pieces of hardware that we required are microphones and speakers. Since thesewere available in the lab, no purchases were made.
Summary
In summary, our system accomplished the objective of transcribing live music to sheetmusic notation within the constraints stated. The algorithm proved remarkably robust andaccurate in determining the notes in the octaves of interest (4th and 5th octaves), regardlessof the tempo of the music. Unfortunately, real-time implementation was not achievedeven though it was definitely within reach.

23
References
Tristan Jehan, Musical Signal Parameter Estimation, 1997, CNMAT, Berkeley
Christopher Wendt and Athina P.Petropulu,Pitch Determination And Speech Segmentation Using The Discrete Wavelet TransformIEEE International Symposium On Circuits And Systems, 1996 P. 45-48 Vol.2
Center for Computer Research in Music and Acoustics,http://ccrma-www.stanford.edu
Polikar, Robi, The Wavelet Tutorialhttp://www.public.iastate.edu/~rpolikar/wavelets/wttutorial.html
Nuria Gonzales Prelcic and Sergio J. Garcia Galan,Uvi-Wave, Wavelet Toolbox For Use With Matlab (Version 1.0.2)Grupo De Teor�a De La Se�al, Universidad De Vigoftp://ftp.cesga.es/pub/Uvi-Wave/Matlab/
Andrew Choi,Real-Time Fundamental Frequency Estimation By Least-Square FittingIEEE Transactions On Speech And Audio Processing, Vol 5 No 2, March 1997
C. Sidney Burrus, Ramesh A. Gopinath and Haitao GuoIntroduction to Wavelets and Wavelet Transforms: A PrimerPrentice Hall, 1997
Code is located at http://www.andrew.cmu.edu/~kschan/ece/551/