real assets annual program review - calpers 13, 2017 · real assets annual program review. ......
TRANSCRIPT

1
Agenda Item 6c, Attachment 1, Page 1 of 55
Real Assets
Annual Program Review
November 13, 2017

2
Agenda Item 6c, Attachment 1, Page 2 of 55 Real Assets Annual Program Review
Executive Summary – Real Assets Program Performance
As of June 30, 2017 NAV (millions) 1-Year
Net Return
3-Year
Net Return
5-Year
Net Return
10-Year
Net Return
20-Year
Net Return
Real Assets $36,291 7.4% 8.6% 10.0% -0.9% 7.0%
Policy Index 7.0% 9.9% 10.2% 6.9% 9.8%
Excess Return 0.4% -1.3% -0.2% -7.8% -2.9%
Real Estate $30,536 7.6% 9.4% 10.8% -1.3% 6.8%
Policy Index 7.4% 10.8% 11.1% 7.8% 10.3%
Excess Return 0.2% -1.4% -0.3% -9.1% -3.5%
Infrastructure $3,775 9.9% 10.7% 12.0%
Policy Index 6.5% 5.1% 5.3%
Excess Return 3.4% 5.6% 6.7%
Forestland $1,980 1.0% -3.1% -0.1%
Policy Index 3.6% 5.7% 7.1%
Excess Return -2.7% -8.7% -7.3%
Real Assets, Real
Estate and
Infrastructure all
outperformed the
2013 ALM
expected return of
7% for the 1-year
and 5-year
periods.

3
Agenda Item 6c, Attachment 1, Page 3 of 55 Real Assets Annual Program Review
Executive Summary – Real Assets Program Performance
Role - Inflation Protection
Role - Diversification of Equity
FY 5-Year rolling
Net Appreciation
5-Year rolling
CPI
FY 16/17 6.5% 1.2%
FY 15/16 8.1% 1.3%
FY 14/15 9.1% 1.6%
FY 13/14 -0.5% 2.1%
FY 12/13 -8.7% 1.7%
FY 11/12 -8.6% 2.2%
FY 1–Year Net
Income Return
5–Year Net
Income Return
RA Core
Exposure
FY 16/17 3.3% 3.3% 75%
FY 15/16 3.7% 2.8% 65%
FY 14/15 3.6% 2.4% 46%
FY 13/14 3.4% 1.7% 42%
FY 12/13 2.6% -0.4% 39%
FY 11/12 0.6% -1.9% 38%
Role - Cash Yield
Volatility 5-Year Correlation 5-Year
Real Assets 4.7 -0.05
FTSE Global All Cap Custom Net 8.5
Role of Real Assets
• Stable and predictable
cash yield
• Inflation protection
• Diversification of equity
risk

4
Agenda Item 6c, Attachment 1, Page 4 of 55 Real Assets Annual Program Review
Executive Summary – Portfolio Position
Program
Core vs.
Non-
Core*
1-Year Net
Income
Return
1-Year Net
Valuation
Change
Change
in NAV
(millions)
Current
LTV
1-Year LTV
Difference
Emerging Manager
Commitment/NAV
(in Million $)
Real Assets 75% / 25% 3.3% 4.2% 4,454 32.9% -0.4% $600 $348
Real Estate 77% / 23% 3.6% 4.1% 3,240 31.4% -0.9% $600 $348
Infrastructure 70% / 30% 3.3% 6.7% 1,207 46.6% -0.4% N/A N/A
Forestland 45% / 55% -1.2% 2.2% 7 22.3% -0.4% N/A N/A
*Core - Includes investments that produce a predictable current net income yield after debt service.
• The manager count was reduced from 58 in 2015 to 30 in 2017 (excludes an additional 5
emerging managers).
• Real Assets Loan-To-Value (LTV) % was reduced from 39.6% in 2012 to 32.9% in 2017.
• 85% of Real Estate properties are stabilized. The stabilized life cycle is defined as having
occupancy of 85% or greater.

5
Agenda Item 6c, Attachment 1, Page 5 of 55 Real Assets Annual Program Review
Executive Summary – FY 2016/17 Accomplishments Initiatives Accomplishments
Organization & Governance
Strategic Plan Update – Implementation
• Completed the Residential and International Segment Plans
• Completed Portfolio Hierarchy – Systems / Database
• Completed Investment Policy Procedures Guidelines across all Real Assets
• Completed Desktop Procedures Manual across all Real Assets
• Established Investment Manager Sub-Committee as a deliberative body to RAIC
Portfolio Repositioning • Fully realized Real Estate Secondary Sale
• Reduced Real Assets LTV%
• Improved Fixed/Floating debt ratio
• Reduced External Manager Count
• Increased Infrastructure exposures
• Real Assets core exposure at 74.9% (Policy limit minimum 75%)
Alignment and Costs Business Model
• Implemented New Alignment Model providing greater alignment with Real Assets role
and benchmark
Sustainable Investment – ESG Energy Optimization Initiative
• Hosted energy optimization roundtable which launched the initiative
Sustainability Objectives
• Added Real Estate to GRESB Sustainability Benchmark
RE Emerging & Transition Manager
Program
RE Emerging Managers
• Increased the dollars invested and the number of Emerging Managers
6
Agenda Item 6c, Attachment 1, Page 6 of 55 Real Assets Annual Program Review
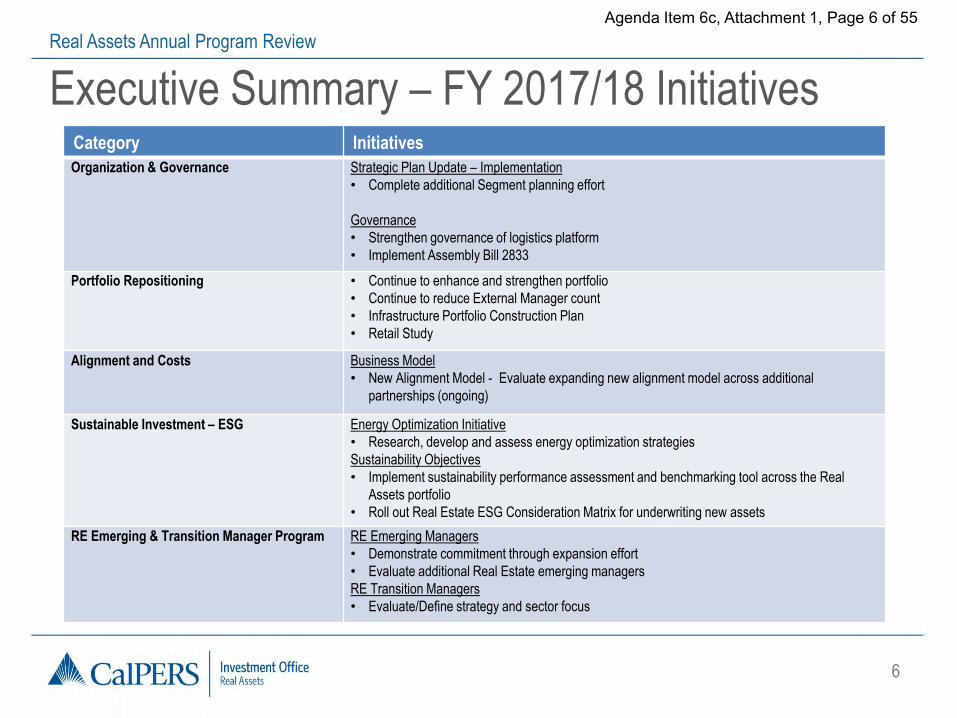
Executive Summary – FY 2017/18 Initiatives Category Initiatives
Organization & Governance Strategic Plan Update – Implementation
• Complete additional Segment planning effort
Governance
• Strengthen governance of logistics platform
• Implement Assembly Bill 2833
Portfolio Repositioning • Continue to enhance and strengthen portfolio
• Continue to reduce External Manager count
• Infrastructure Portfolio Construction Plan
• Retail Study
Alignment and Costs Business Model
• New Alignment Model - Evaluate expanding new alignment model across additional
partnerships (ongoing)
Sustainable Investment – ESG Energy Optimization Initiative
• Research, develop and assess energy optimization strategies
Sustainability Objectives
• Implement sustainability performance assessment and benchmarking tool across the Real
Assets portfolio
• Roll out Real Estate ESG Consideration Matrix for underwriting new assets
RE Emerging & Transition Manager Program RE Emerging Managers
• Demonstrate commitment through expansion effort
• Evaluate additional Real Estate emerging managers
RE Transition Managers
• Evaluate/Define strategy and sector focus

7
Agenda Item 6c, Attachment 1, Page 7 of 55 Real Assets Annual Program Review
Appendix
8
Agenda Item 6c, Attachment 1, Page 8 of 55 Real Assets Annual Program Review
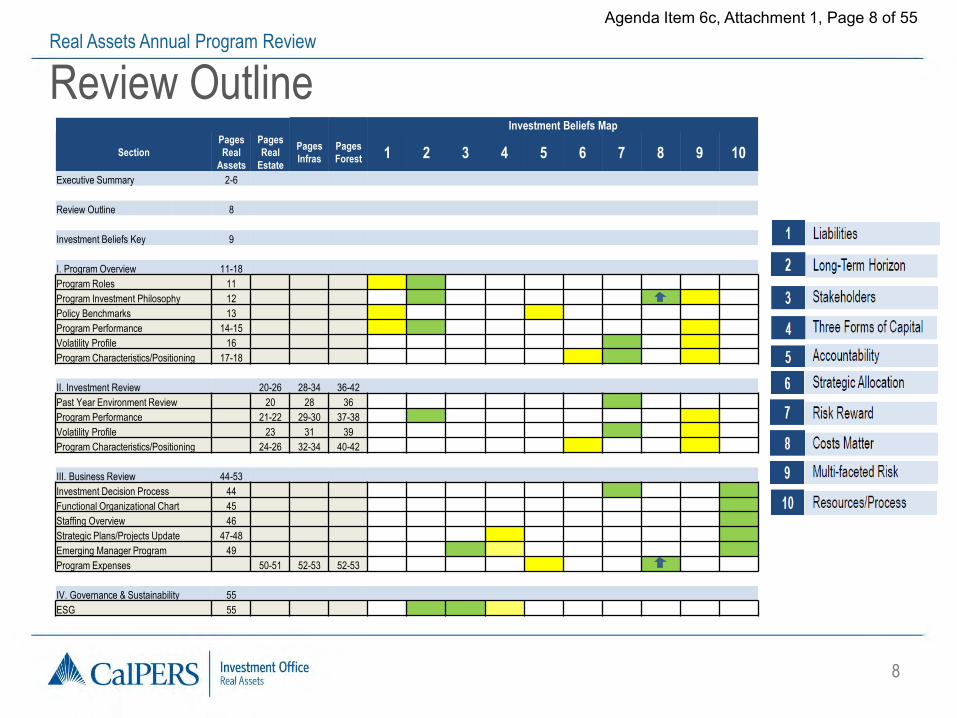
Review Outline Investment Beliefs Map
Section
Pages
Real
Assets
Pages
Real
Estate
Pages
Infras
Pages
Forest 1 2 3 4 5 6 7 8 9 10
Executive Summary 2-6
Review Outline 8
Investment Beliefs Key 9
I. Program Overview 11-18
Program Roles 11
Program Investment Philosophy 12
Policy Benchmarks 13
Program Performance 14-15
Volatility Profile 16
Program Characteristics/Positioning 17-18
II. Investment Review 20-26 28-34 36-42
Past Year Environment Review 20 28 36
Program Performance 21-22 29-30 37-38
Volatility Profile 23 31 39
Program Characteristics/Positioning 24-26 32-34 40-42
III. Business Review 44-53
Investment Decision Process 44
Functional Organizational Chart 45
Staffing Overview 46
Strategic Plans/Projects Update 47-48
Emerging Manager Program 49
Program Expenses 50-51 52-53 52-53
IV. Governance & Sustainability 55
ESG 55
9
Agenda Item 6c, Attachment 1, Page 9 of 55 Real Assets Annual Program Review
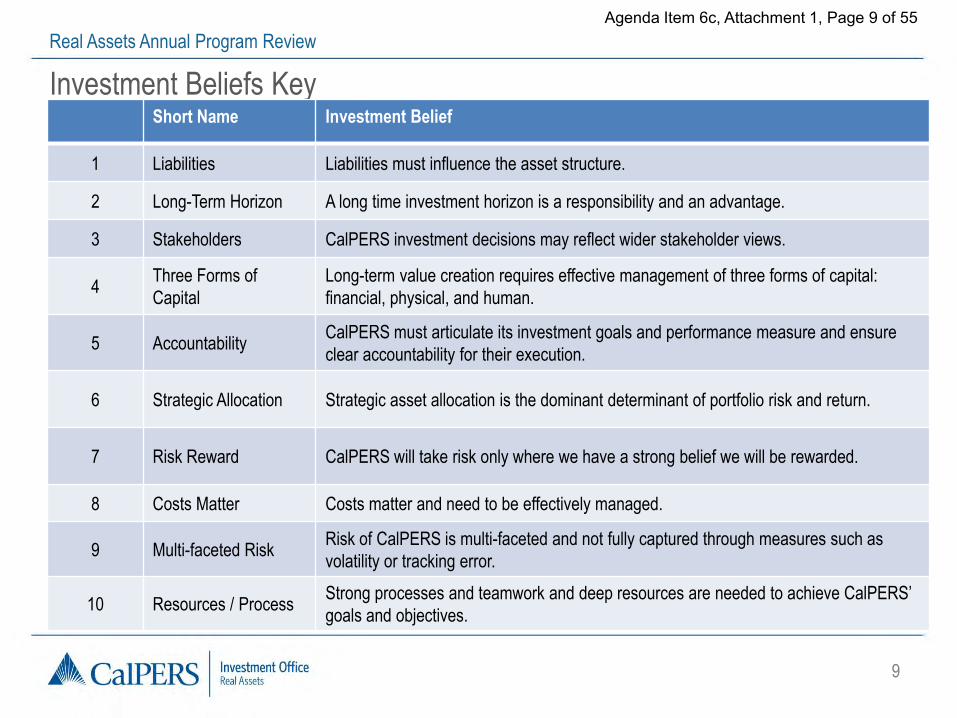
Investment Beliefs Key Short Name Investment Belief
1 Liabilities Liabilities must influence the asset structure.
2 Long-Term Horizon A long time investment horizon is a responsibility and an advantage.
3 Stakeholders CalPERS investment decisions may reflect wider stakeholder views.
4 Three Forms of
Capital
Long-term value creation requires effective management of three forms of capital:
financial, physical, and human.
5 Accountability CalPERS must articulate its investment goals and performance measure and ensure
clear accountability for their execution.
6 Strategic Allocation Strategic asset allocation is the dominant determinant of portfolio risk and return.
7 Risk Reward CalPERS will take risk only where we have a strong belief we will be rewarded.
8 Costs Matter Costs matter and need to be effectively managed.
9 Multi-faceted Risk Risk of CalPERS is multi-faceted and not fully captured through measures such as
volatility or tracking error.
10 Resources / Process Strong processes and teamwork and deep resources are needed to achieve CalPERS’
goals and objectives.

10
Agenda Item 6c, Attachment 1, Page 10 of 55 Real Assets Annual Program Review
I. Program Overview

11
Agenda Item 6c, Attachment 1, Page 11 of 55 Real Assets Annual Program Review
Program Roles
Real Assets
Stable and predictable cash yield
Diversification of equity risk
Inflation protection

12
Agenda Item 6c, Attachment 1, Page 12 of 55 Real Assets Annual Program Review
Program Investment Philosophy
• Invest in high-quality, well located assets held through business cycles.
• Core assets with stable and predictable cash flows.
• Preference for separate accounts with highly reputable, market-leading managers.
• Strong governance with focus on economic alignment, transparency, and cost efficiency.
• Movement toward fewer and larger external manager relationships.
• Moderate leverage across the portfolio.
• Sustainable investment practices for selection, contracting, monitoring, and management of assets and managers.

13
Agenda Item 6c, Attachment 1, Page 13 of 55 Real Assets Annual Program Review
Policy Benchmarks
Real Assets Policy Benchmark • 84.6% Real Estate Benchmark
• 7.7% Infrastructure Benchmark
• 7.7% Forestland Benchmark
Real Estate Policy Benchmark National Council of Real Estate Investment Fiduciaries Open-End Diversified Core Fund Index (NCREIF ODCE)
Infrastructure Policy Benchmark Consumer Price Index (CPI) + 4% lagged one quarter
Forestland Policy Benchmark National Council of Real Estate Investment Fiduciaries (NCREIF) Timberland Index

14
Agenda Item 6c, Attachment 1, Page 14 of 55 Real Assets Annual Program Review
Program Performance Review – Real Assets
As of June 30, 2017 1-Year
Net Return
3-Year
Net Return
5-Year
Net Return
10-Year
Net Return
20-Year
Net Return
Real Assets 7.4% 8.6% 10.0% -0.9% 7.0%
Policy Index 7.0% 9.9% 10.2% 6.9% 9.8%
Excess Return 0.4% -1.3% -0.2% -7.8% -2.9%
• Real Assets outperformed the 2013 ALM expected return of 7% for
the 1-, 3-, and 5-year periods.

15
Agenda Item 6c, Attachment 1, Page 15 of 55 Real Assets Annual Program Review
Performance: Real Assets 3-Year Rolling Excess Return
-30%
-25%
-20%
-15%
-10%
-5%
0%
5%
FY 2008 FY 2009 FY 2010 FY 2011 FY 2012 FY 2013 FY 2014 FY 2015 FY 2016 FY 2017
1 - YEAR EXCESS RETURNS ROLLING 3-YEAR EXCESS RETURNS

16
Agenda Item 6c, Attachment 1, Page 16 of 55 Real Assets Annual Program Review
Volatility Profile – Real Assets
Source: MSCI BarraOne Risk System – Real Assets holdings data as of 3/31/17 and
BarraOne Model information as of 6/30/17
• Real Assets Forecast Volatility is 11.1%.
• Forecast Tracking Error is 2.6%.
• Forecast Correlation vs. the entire PERF portfolio is 0.77.
Tracking Error
2.6%
Benchmark Volatility
9.2%
Total Volatility
11.1%

17
Agenda Item 6c, Attachment 1, Page 17 of 55 Real Assets Annual Program Review
Program Characteristics – Real Assets • Total Net Asset Value (NAV): $36.3 billion.
– Real Assets accounts for 11.2% of the Total Fund NAV.
– The NAV increased 14% from $31.8 billion to $36.3 billion.
• Unfunded: $8.7 billion ($8.1 billion revocable or at CalPERS discretion)
• Structure: – 30 External Managers, one manager is in both Real Estate and Infrastructure.
– 33 Separate Accounts, 20 Commingled Funds, 3 Direct Investments and 1 Operating Company.
• NAV Basis: 75% Separate Accounts, 11% Commingled Funds, 3% Direct Investments, 11% Operating Company.
• Geographic Exposure: – 88% U.S. and 12% International.
– 26% NAV invested in California.

18
Agenda Item 6c, Attachment 1, Page 18 of 55 Real Assets Annual Program Review
Portfolio Positioning – Real Assets
Risk Classification %Policy Range %NAV Policy Compliance
Core 75-100% 74.9% Value Add 0-25% 11.3%
Opportunistic 0-25% 13.8%
Development or Build-to-Core 0-10% 6.8%
Geography %Policy Range %NAV Policy Compliance
United States 70-100% 88.3%
International Developed Markets 0-30% 5.4%
International Emerging Markets 0-15% 6.1%
International Frontier Markets 0-5% 0.3%
Public Securities %Policy Range %NAV Policy Compliance
Real Assets 0-10% 0.1%
Leverage Policy Limit Current Policy Compliance
LTV 55% 32.9%
DSCR Total (minimum) 1.40 2.32

19
Agenda Item 6c, Attachment 1, Page 19 of 55 Real Assets Annual Program Review
II. Investment Review
a. Real Estate
b. Infrastructure
c. Forestland

20
Agenda Item 6c, Attachment 1, Page 20 of 55 Real Assets Annual Program Review
Past Year Environment Review – Real Estate
• Capital Markets – Markets are competitive, but showing early signs of pullback of institutional capital
in the U.S. markets.
– Lenders have been conservative and borrowing costs remain low.
– Cap rates have stabilized, but remain at historic lows despite upward pressure on the 10-yr Treasury.
• Property Fundamentals – New supply is ramping up across property sectors except retail; apartments are
experiencing over supply in select Metropolitan Statistical Areas (MSAs).
– Net Operating Income (NOI)* growth continues to moderate; retail is experiencing challenges from e-commerce and consumer behavior.
– Vacancy rates remain below historical average; apartment and retail vacancy rates are climbing slightly.
* NOI is net operating income before capital expense and interest expense

21
Agenda Item 6c, Attachment 1, Page 21 of 55 Real Assets Annual Program Review
Program Performance Review – Real Estate
As of June 30, 2017 1-Year
Net Return 3-Year
Net Return
5-Year Net Return
10-Year Net Return
20-Year Net Return
Real Estate 7.6% 9.4% 10.8% -1.3% 6.8%
Policy Index 7.4% 10.8% 11.1% 7.8% 10.3%
Excess Return 0.2% -1.4% -0.3% -9.1% -3.5%
• Real Estate outperformed the 2013 ALM expected return of 7%
for the 1-, 3-, and 5-year periods.
• Underperformance in 3- and 5-year periods driven primarily by
non-core holdings in domestic land, housing, and international
investments.
• Core performance in 3- and 5-year periods were 14.2% and
14.9%, respectively. Core outperformed the Real Estate Policy
Index by 340 bps and 380 bps.

22
Agenda Item 6c, Attachment 1, Page 22 of 55 Real Assets Annual Program Review
Program Performance Review – Real Estate (Cont’d)
3-Year Rolling Excess Return
-35%
-30%
-25%
-20%
-15%
-10%
-5%
0%
5%
10%
FY 2008 FY 2009 FY 2010 FY 2011 FY 2012 FY 2013 FY 2014 FY 2015 FY 2016 FY 2017
1 - YEAR EXCESS RETURNS ROLLING 3-YEAR EXCESS RETURNS

23
Agenda Item 6c, Attachment 1, Page 23 of 55 Real Assets Annual Program Review
Volatility Profile – Real Estate
Source: MSCI BarraOne Risk System – Real Estate holdings data as of 3/31/17 and
BarraOne Model information as of 6/30/17
• Real Estate Forecast Volatility is 11.8%.
• Forecast Tracking Error is 2.2%.
• Correlation vs. the entire PERF portfolio is 0.73.
Tracking Error
2.2%
Benchmark Volatility
10.4%
Total Volatility
11.8%

24
Agenda Item 6c, Attachment 1, Page 24 of 55 Real Assets Annual Program Review
Program Characteristics – Real Estate • Total NAV: $30.5 billion.
– Program NAV is 9.4% of Total Fund, versus 11% target.
– Program NAV increased 11.9% from $27.3 billion to $30.5 billion.
• Unfunded: $7.0 billion ($6.8 billion revocable by CalPERS)
• Structure:
– 21 External Managers.
– 28 Separate Accounts, 12 Commingled Funds, 1 Operating Company.
• NAV Basis: 79% Separate Accounts, 8% in Commingled Funds, 13% Operating Company.
• Geographic Exposure:
– 93% U.S., 6% International Emerging Markets, 1% International Developed Markets.
– 30% NAV invested in California.

25
Agenda Item 6c, Attachment 1, Page 25 of 55 Real Assets Annual Program Review
Program Characteristics – Real Estate by NAV*
*Period ending March 31, 2017 with total property level NAV amounting to $30.5 billion
Risk
Property Type
Segment
Life Cycle

26
Agenda Item 6c, Attachment 1, Page 26 of 55 Real Assets Annual Program Review
Portfolio Positioning – Real Estate
Risk Classification %Policy Range %NAV Policy Compliance
Core 75-100% 77.5%
Value Add 0-25% 8.6%
Opportunistic 0-25% 13.9%
Development or Build-to-Core 0-10% 8.1%
Geography %Policy Range %NAV Policy Compliance
United States 75-100% 93.0%
International Developed Markets 0-25% 0.7%
International Emerging Markets 0-15% 6.3%
International Frontier Markets 0-5% 0.0%
Leverage Policy Limit Current Policy Compliance
LTV 50% 31.4%
DSCR Total (minimum) 1.50 2.46 DSCR Core (minimum) 2.00 2.52

27
Agenda Item 6c, Attachment 1, Page 27 of 55 Real Assets Annual Program Review
II. Investment Review
a. Real Estate
b. Infrastructure
c. Forestland

28
Agenda Item 6c, Attachment 1, Page 28 of 55 Real Assets Annual Program Review
Past Year Environment Review – Infrastructure
• Fierce competition for new investments.
• Supportive credit markets.
• U.S. public ‘Infrastructure Gap’ continues.
• Transition to “clean” power generation continues to accelerate.
• U.S. government pledged higher infrastructure spending, but
little action has materialized.
• Challenged energy companies continue to divest assets and
utilize private capital for expansions / growth strategies.

29
Agenda Item 6c, Attachment 1, Page 29 of 55 Real Assets Annual Program Review
Program Performance Review – Infrastructure
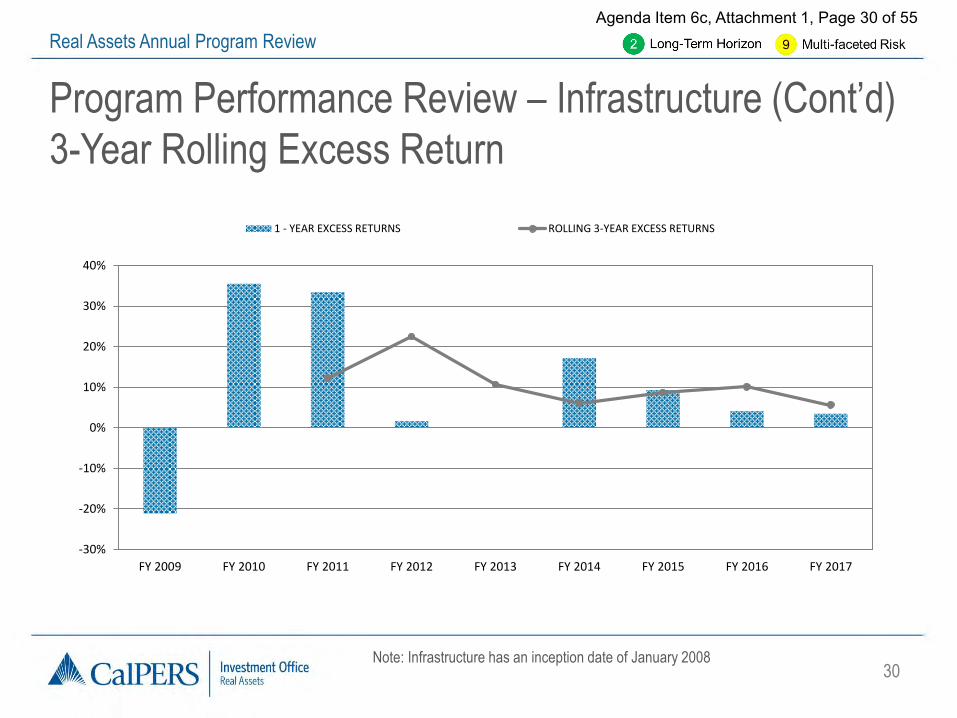
• Infrastructure outperformed the 2013 ALM expected return of 7% for the 1-, 3-, and 5-year periods.
• The Infrastructure Program outperformed across all measured periods. Strong performance was primarily driven by core holdings.
Note: Infrastructure has an inception date of January 2008
As of June 30, 2017 1-Year Net Return 3-Year Net Return 5-Year Net Return Since Inception
Infrastructure 9.9% 10.7% 12.0% 12.6%
Policy Index 6.5% 5.1% 5.3% 6.1%
Excess Return 3.4% 5.6% 6.7% 6.5%
30
Agenda Item 6c, Attachment 1, Page 30 of 55 Real Assets Annual Program Review
Program Performance Review – Infrastructure (Cont’d)
3-Year Rolling Excess Return
Note: Infrastructure has an inception date of January 2008
-30%
-20%
-10%
0%
10%
20%
30%
40%
FY 2009 FY 2010 FY 2011 FY 2012 FY 2013 FY 2014 FY 2015 FY 2016 FY 2017
1 - YEAR EXCESS RETURNS ROLLING 3-YEAR EXCESS RETURNS

31
Agenda Item 6c, Attachment 1, Page 31 of 55 Real Assets Annual Program Review
• Infrastructure Forecast Volatility is 9.1%.
• Correlation vs. the entire PERF portfolio is 0.85.
Volatility Profile – Infrastructure
Note: Infrastructure benchmark is CPI+4%, therefore tracking error and benchmark volatility are not shown
since they are not meaningful.
Source: MSCI BarraOne Risk System – Infrastructure holdings data as of 3/31/17 and
BarraOne Model information as of 6/30/17

32
Agenda Item 6c, Attachment 1, Page 32 of 55 Real Assets Annual Program Review
Program Characteristics – Infrastructure
• Total NAV: $3.8 billion.
– Program NAV is 1.2% of Total Fund, with a 1% interim target.
– Program NAV increased 47.0% from $2.6 billion to $3.8 billion.
• Unfunded: $1.7 billion ($1.3 billion at CalPERS discretion)
• Structure:
– 8 External Managers.
– 3 Separate Accounts, 8 Commingled Funds, and 3 Direct Investments.
• NAV Basis: 33% Separate Accounts, 36% in Commingled Funds, 31% in Direct Investments.
• Geographic Exposure:
– 56% U.S. and 44% International.
– 10% NAV invested in California.

33
Agenda Item 6c, Attachment 1, Page 33 of 55 Real Assets Annual Program Review
Program Characteristics – Infrastructure by NAV*
*Period ending March 31, 2017 with total NAV amounting to $3.8 billion.
Sector
Energy 29%
International Infrastructure
24%
Opportunistic Infrastructure
36%
Transportation 11%
Segment Risk
Communications 2%
Energy 8%
Other 2%
Power 41%
Transportation 44%
Water 3%
Asset Type

34
Agenda Item 6c, Attachment 1, Page 34 of 55 Real Assets Annual Program Review
Portfolio Positioning – Infrastructure
Risk Classification %Policy Range %NAV Policy Compliance
Core 60-100% 70.1%
Value Add 0-25% 17.9%
Opportunistic 0-25% 12.0%
Development or Build-to-Core 0-10% 0.0%
Geography %Policy Range %NAV Policy Compliance
United States 50-100% 56.3%
International Developed Markets 0-50% 42.6%
International Emerging Markets 0-15% 1.1%
International Frontier Markets 0-5% 0.0%
Leverage Policy Limit Current Policy Compliance
LTV 65% 46.6%
DSCR Total (minimum) 1.25 2.25
* The Key Policy Parameters pertaining to risk and geographic segments will apply to the Infrastructure portfolio
only when the NAV for that portfolio exceeds $5.0 billion.

35
Agenda Item 6c, Attachment 1, Page 35 of 55 Real Assets Annual Program Review
II. Investment Review
a. Real Estate
b. Infrastructure
c. Forestland

36
Agenda Item 6c, Attachment 1, Page 36 of 55 Real Assets Annual Program Review
Past Year Environment Review – Forestland
• U.S. housing starts continue to recover, but remain below
the long-term average.
• Domestic Forestland investment values reflect continuing
recovery in log prices and housing starts.
• Forestland transaction activity was moderate; some large
acquisitions were split between multiple buyers.
• Escalating trade tensions between the U.S. and Canada
resulted in the U.S. government imposing duties on
Canadian softwood lumber imports.

37
Agenda Item 6c, Attachment 1, Page 37 of 55 Real Assets Annual Program Review
Program Performance Review – Forestland
• Forestland underperformed the 2013 ALM expected
return of 7% for the 1-, 3-, and 5-year periods.
As of June 30, 2017 1-Year Net
Return
3-Year Net
Return
5-Year Net
Return
Since
Inception
Forestland 1.0% -3.1% -0.1% -0.4%
Policy Index 3.6% 5.7% 7.1% 5.3%
Excess Return -2.7% -8.8% -7.3% -5.7%
Note: Forestland has an inception date of January 2008

38
Agenda Item 6c, Attachment 1, Page 38 of 55 Real Assets Annual Program Review
Program Performance Review – Forestland (Cont’d)
3-Year Rolling Excess Return
Note: Forestland has an inception date of January 2008
-15%
-10%
-5%
0%
5%
10%
FY 2009 FY 2010 FY 2011 FY 2012 FY 2013 FY 2014 FY 2015 FY 2016 FY 2017
1 - YEAR EXCESS RETURNS ROLLING 3-YEAR EXCESS RETURNS
39
Agenda Item 6c, Attachment 1, Page 39 of 55 Real Assets Annual Program Review
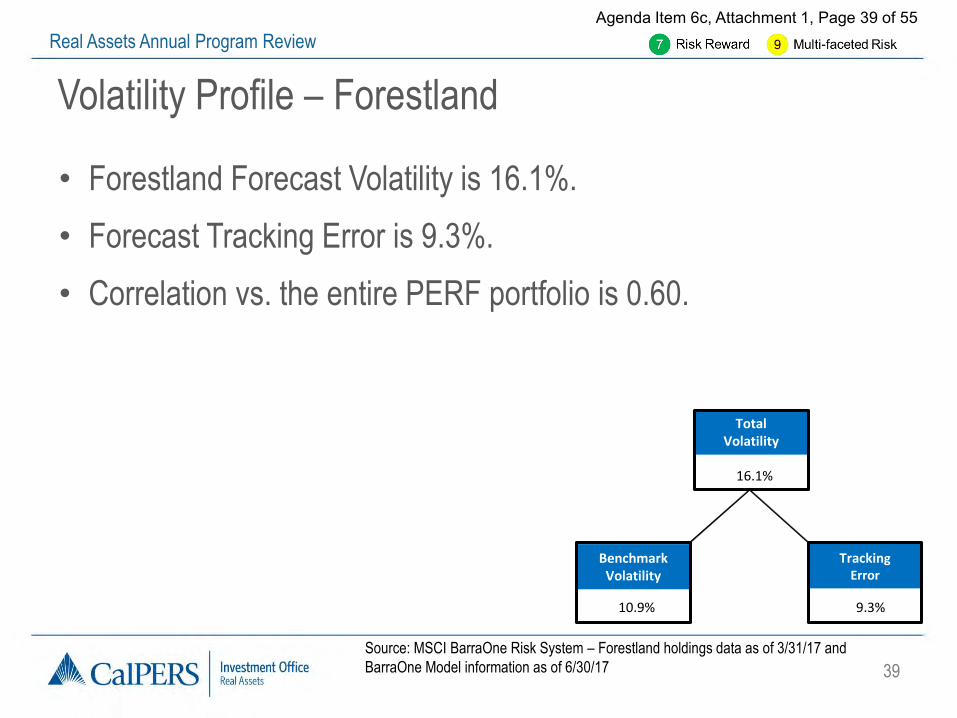
Volatility Profile – Forestland
• Forestland Forecast Volatility is 16.1%.
• Forecast Tracking Error is 9.3%.
• Correlation vs. the entire PERF portfolio is 0.60.
Tracking Error
9.3%
Benchmark Volatility
10.9%
Total Volatility
16.1%
Source: MSCI BarraOne Risk System – Forestland holdings data as of 3/31/17 and
BarraOne Model information as of 6/30/17

40
Agenda Item 6c, Attachment 1, Page 40 of 55 Real Assets Annual Program Review
Program Characteristics – Forestland
• Total NAV: $1.98 billion.
– Program NAV is 0.6% versus 1% target allocation of Total Fund.
– Program NAV increased 0.3% from $1.97 billion to $1.98 billion.
• Unfunded: $0.
• Structure:
– 2 External Managers.
– 2 Separate Accounts.
• NAV Basis: 100% Separate Accounts.
• Geographic Exposure:
– 77% U.S. and 23% International.

41
Agenda Item 6c, Attachment 1, Page 41 of 55 Real Assets Annual Program Review
Portfolio Characteristics – Forestland by NAV(a)
(a) Period ending March 31, 2017 with total NAV amounting to $2.0 billion..
Core 45%
Opportunistic 16%
Value Add 39%
Risk Segment
Sector Primary Product
Essential 77%
International 23%
International Forestland
23%
Timber 77%
Non-timber 2%
Pulpwood 3%
Sawtimber 90%
Specialty Hardwood
5%

42
Agenda Item 6c, Attachment 1, Page 42 of 55 Real Assets Annual Program Review
Portfolio Positioning – Forestland
Risk Classification %Policy Range %NAV Policy Compliance
Core 75-100% 44.8%
Value Add 0-25% 39.1% Opportunistic 0-25% 16.1%
Development or Build-to-Core 0-10% 0.0%
Geography %Policy Range %NAV Policy Compliance
United States 50-100% 76.9%
International Developed Markets 0-50% 7.0%
International Emerging Markets 0-15% 11.4%
International Frontier Markets 0-5% 4.8%
Leverage Policy Limit Current Policy Compliance
LTV 40% 22.3%
DSCR Total (minimum) 1.25 0.71

43
Agenda Item 6c, Attachment 1, Page 43 of 55 Real Assets Annual Program Review
III. Business Review
44
Agenda Item 6c, Attachment 1, Page 44 of 55 Real Assets Annual Program Review
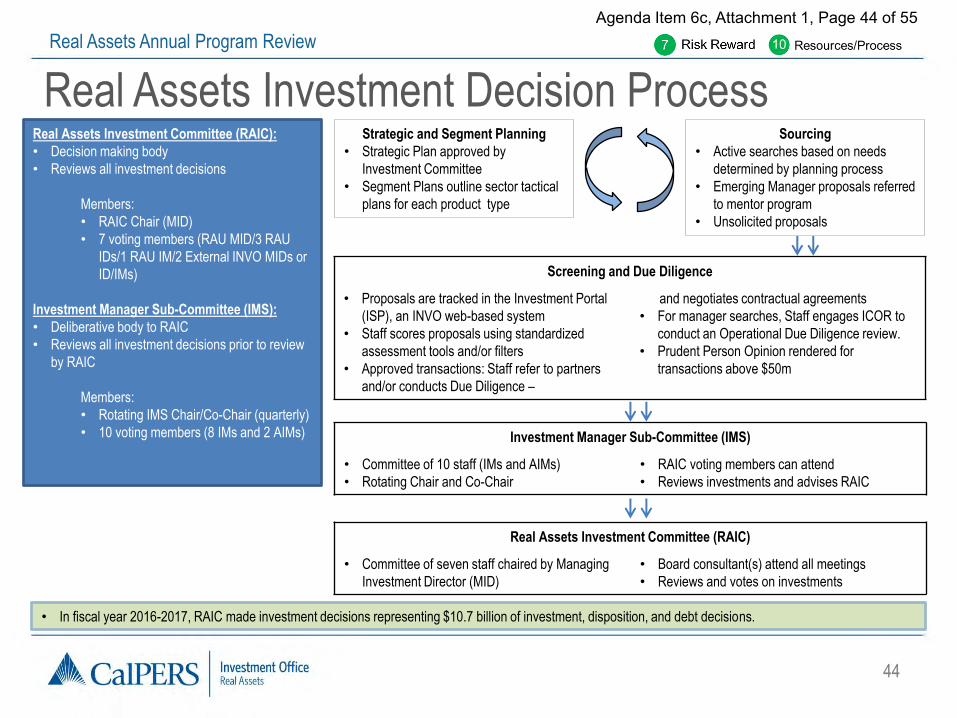
Real Assets Investment Decision Process Real Assets Investment Committee (RAIC):
• Decision making body
• Reviews all investment decisions
Members:
• RAIC Chair (MID)
• 7 voting members (RAU MID/3 RAU
IDs/1 RAU IM/2 External INVO MIDs or
ID/IMs)
Investment Manager Sub-Committee (IMS):
• Deliberative body to RAIC
• Reviews all investment decisions prior to review
by RAIC
Members:
• Rotating IMS Chair/Co-Chair (quarterly)
• 10 voting members (8 IMs and 2 AIMs)
Strategic and Segment Planning
• Strategic Plan approved by
Investment Committee
• Segment Plans outline sector tactical
plans for each product type
Sourcing
• Active searches based on needs
determined by planning process
• Emerging Manager proposals referred
to mentor program
• Unsolicited proposals
• In fiscal year 2016-2017, RAIC made investment decisions representing $10.7 billion of investment, disposition, and debt decisions.
Real Assets Investment Committee (RAIC)
• Committee of seven staff chaired by Managing
Investment Director (MID)
• Board consultant(s) attend all meetings
• Reviews and votes on investments
Investment Manager Sub-Committee (IMS)
• Committee of 10 staff (IMs and AIMs)
• Rotating Chair and Co-Chair
• RAIC voting members can attend
• Reviews investments and advises RAIC
Screening and Due Diligence
• Proposals are tracked in the Investment Portal
(ISP), an INVO web-based system
• Staff scores proposals using standardized
assessment tools and/or filters
• Approved transactions: Staff refer to partners
and/or conducts Due Diligence –
and negotiates contractual agreements
• For manager searches, Staff engages ICOR to
conduct an Operational Due Diligence review.
• Prudent Person Opinion rendered for
transactions above $50m

45
Agenda Item 6c, Attachment 1, Page 45 of 55 Real Assets Annual Program Review
Functional Organizational Chart
Real Assets
Portfolio Management Group
Portfolio Analytics, Research, Risk, Governance & Operations
New Investments Team

46
Agenda Item 6c, Attachment 1, Page 46 of 55 Real Assets Annual Program Review
Staffing Overview • 55 total positions within Real Assets; one fewer than the number of
positions in 2015-2016 TOTAL PROGRAM 1
• Appointed 1 Investment Director
• Appointed 3 Investment Managers
• Appointed 2 Associate Investment Managers
• Appointed 1 Investment Officer III
• Appointed 3 Investment Officer IIs
• Appointed 1 Investment Officer Is
• Appointed 3 Associate Governmental Program Analysts
• Appointed 1 Office Technician (Typing)
• Appointed 2 Seasonal Clerks
• Transferred 1 IM and 2 IO positions to other INVO programs
STAFFING UPDATES 1
• 1 Seasonal Clerk
• 1 Staff Services Analyst
• 1 Associate Governmental Program Analyst
• 2 Investment Officer IIs
• 1 Investment Officer III
• 1 Investment Manager
• 1 Investment Director
CURRENT VACANCIES 2
1 From July 1, 2016 through June 30, 2017 2 As of September 11, 2017
47
Agenda Item 6c, Attachment 1, Page 47 of 55 Real Assets Annual Program Review
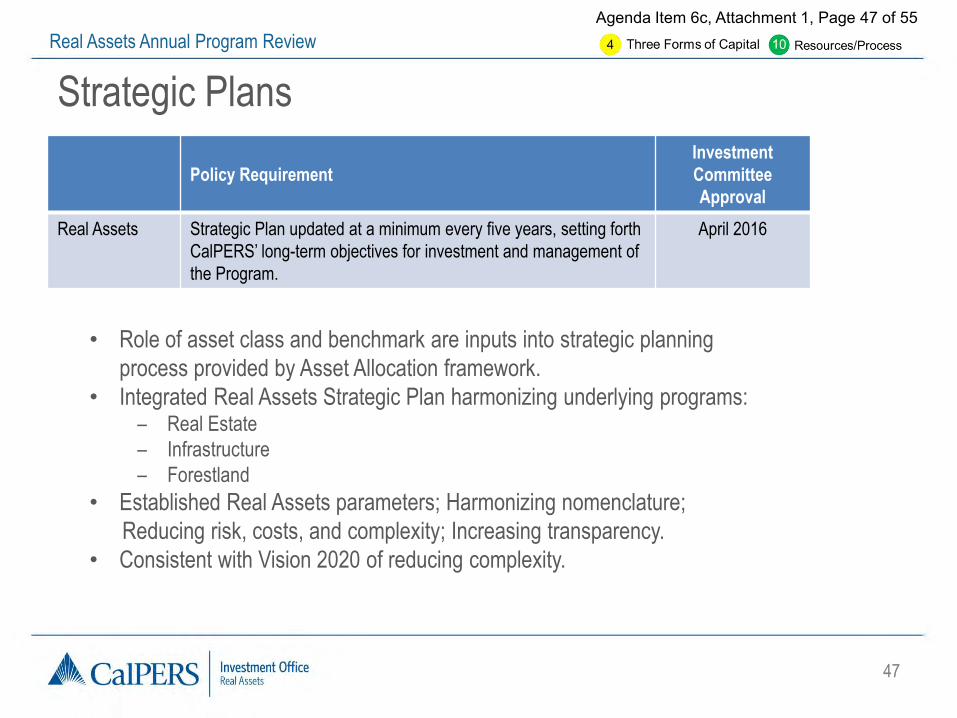
Strategic Plans
Policy Requirement
Investment
Committee
Approval
Real Assets Strategic Plan updated at a minimum every five years, setting forth
CalPERS’ long-term objectives for investment and management of
the Program.
April 2016
• Role of asset class and benchmark are inputs into strategic planning
process provided by Asset Allocation framework.
• Integrated Real Assets Strategic Plan harmonizing underlying programs: – Real Estate
– Infrastructure
– Forestland
• Established Real Assets parameters; Harmonizing nomenclature;
Reducing risk, costs, and complexity; Increasing transparency.
• Consistent with Vision 2020 of reducing complexity.

48
Agenda Item 6c, Attachment 1, Page 48 of 55 Real Assets Annual Program Review
Strategic Projects Update Initiatives Activities
Strategic Plan Update • Continue implementation of strategic plan, including segment/sector planning.
• Implementing Segment Plan recommendations.
• Completed Portfolio Hierarchy – Systems / Database
Real Assets Investment Policy
Revision
• Real Assets MID Delegation of Authority approved September 2016.
• Investment Policy Procedures Guidelines approved December 2016.
• Desktop Procedure Manual approved June 2017.
Portfolio Repositioning • Fully realized secondary sale of commingled funds July 2017.
• Continued Real Estate and Infrastructure portfolio growth through new investments.
• External Manager Reduction.
RE Emerging & Transition Manager
Program
RE Emerging Managers:
• Demonstrated commitment through expansion effort.
• Evaluate additional Real Estate emerging managers.
RE Transition Managers:
• Evaluate/Define strategy and sector focus.

49
Agenda Item 6c, Attachment 1, Page 49 of 55 Real Assets Annual Program Review
Emerging & Transition Manager Programs in Real Estate
• FY 2016/17 Significant Events
– As part of the Annual Investment Plan FY 2016/17, the Emerging Manager Program
received an allocation of $75M. Total commitments of $600M as of 6/30/17.
• Current Status/Update
– Completed fifth year of Innovative Mentoring Manager Model.
– Continued favorable feedback to our programmatic joint venture structure.
– Mentoring managers are evaluating the transition readiness of existing emerging
managers and maintain outreach efforts to the broader emerging manager community.
– Through its first 5 years, the programs have been performing above expectations.
– Canyon and CalPERS discussing broadening and expanding Emerging Manager
Program.

50
Agenda Item 6c, Attachment 1, Page 50 of 55 Real Assets Annual Program Review
Program Expenses – Real Estate
a All BPS fees and expenses paid figures are calculated on Total Program AUM defined as NAV (Net Asset Value). b External Management totals include asset management fees and profit sharing fees (paid and accrued) c Negative performance fees are due to the reversal of accruals caused by the fluctuation in market.
Note: Total profit sharing liabilities are $687 million as of 3/31/2017 and were $1.26 billion as of 3/31/2016.
Note: Some totals may not reconcile due to rounding. Four quarters of data ending on 3/31/17 and 3/31/16 respectively.
AUM ($billions)
Fees and
Profit Sharing ($millions) (BPS)
AUM ($billions) ($millions) (BPS)
Internal Management $0 $ 9.6 3 $0 $8.5 3
External Management
$ 30,536 $ 186.5 61 $ 27,296 $ 399.9 147
Asset Management Fees Paid
N/A $ 159.8 52 N/A $ 155.8 57
Profit Sharing Paid N/A $ 75.4 25 N/A $ 81.1 30
Profit Sharing Accrued N/A ($ 48.7) (16) N/A $ 163.0 60
Consultants Expense N/A $ 1.3 0 N/A $ 2.1 1
Technology & Operating Expense
N/A $ 11.0 4 N/A $ 12.2 4
Total Program $ 30,536 $ 208.4 68 $ 27,296 $ 422.7 155
FY 2016-17 FY 2015-16
b
c
FY 2016-17 CalPERS ($millions)
Realized and Unrealized Gains $1,130.6
Fees and
Profit Sharing Fees and
Profit Sharing Fees and
Profit Sharing a a

51
Agenda Item 6c, Attachment 1, Page 51 of 55 Real Assets Annual Program Review
Program Expenses – Real Estate
• External Management fees declined by 53% Y-o-Y
as a portion of the incentive fees paid this year were
accrued and expensed in prior years.
• Implementation of new fee alignment structure with
strategic managers facilitates better alignment and
drives cost efficiency and predictability.

52
Agenda Item 6c, Attachment 1, Page 52 of 55 Real Assets Annual Program Review
Program Expenses – Infrastructure & Forestland
Note: Some totals may not reconcile due to rounding. Four quarters of data ending on 3/31/17 and 3/31/16 respectively
a All BPS fees paid figures are calculated on Total Program AUM defined as NAV (Net Asset Value). b -$400K due to accrual reversals and corrections in accounting. c External Management totals include asset management fees and profit sharing fees (paid and accrued).
Note: Total profit sharing liabilities are $83.9 million as of 3/31/2017 and were $80.2 million as of 3/31/2016.
AUM ($billions) ($millions)
a
(BPS)
AUM ($billions) ($millions)
a
(BPS)
Internal Management
$0 ($ 0.4) (1) $0 $ 1.4 3
External Management
$ 5,755 $ 57.1 99 $ 4,541 $ 58.0 128
Asset Management Fees Paid
N/A $ 27.2 47 N/A $ 22.8 50
Profit Sharing Paid N/A $ 0 0 N/A $ 1.8 4
Profit Sharing Accrued N/A $ 29.9 52 N/A $ 33.5 74
Consultants Expense
N/A $ .1 0 N/A $ .2 0
Technology & Operating Expense
N/A $ 1.0 2 N/A $ 1.0 2
Total Program $ 5,755 $ 57.8 100 $ 4,541 $ 60.6 134
FY 2016-17 FY 2015-16
b
c
FY 2016-17 CalPERS ($millions)
Realized and Unrealized Gains $288.1
Fees and
Profit Sharing Fees and
Profit Sharing Fees and
Profit Sharing Fees and
Profit Sharing

53
Agenda Item 6c, Attachment 1, Page 53 of 55 Real Assets Annual Program Review
Program Expenses – Infrastructure & Forestland
• Separate account strategic partnerships negotiated for the
Infrastructure component carry better economic terms and
governance than commingled funds.
• Separate accounts are anticipated to be the primary mode of
new investment.
• Fees as a percentage of NAV are expected to decrease as
the portfolio grows through new separate account vehicles.

54
Agenda Item 6c, Attachment 1, Page 54 of 55 Real Assets Annual Program Review
IV. Governance & Sustainability Integration
55
Agenda Item 6c, Attachment 1, Page 55 of 55 Real Assets Annual Program Review
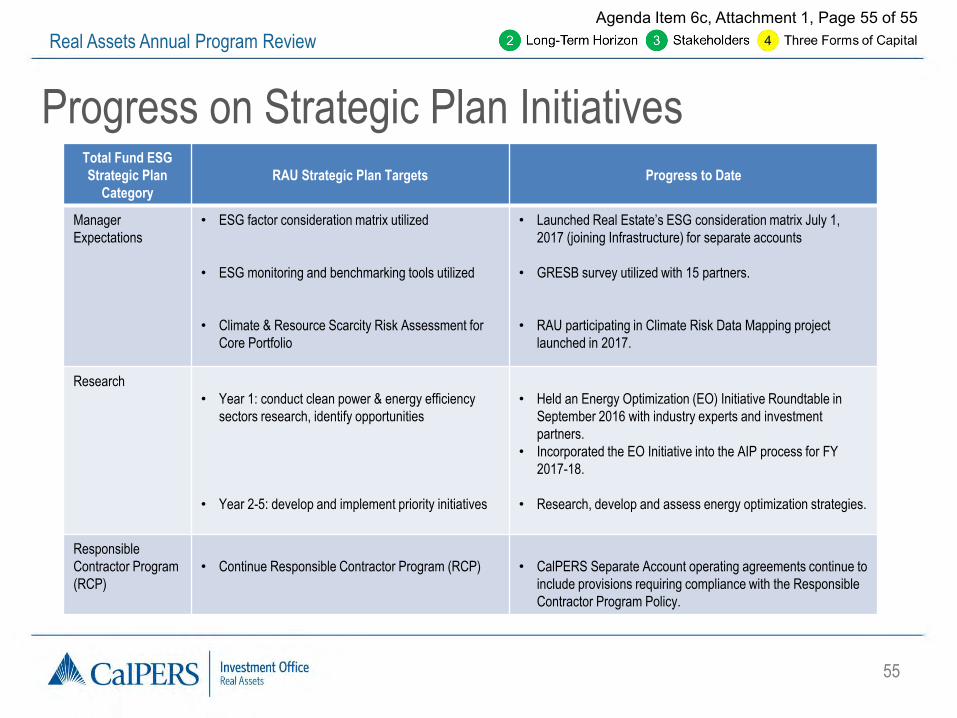
Total Fund ESG
Strategic Plan
Category
RAU Strategic Plan Targets
Progress to Date
Manager
Expectations
• ESG factor consideration matrix utilized
• ESG monitoring and benchmarking tools utilized
• Climate & Resource Scarcity Risk Assessment for
Core Portfolio
• Launched Real Estate’s ESG consideration matrix July 1,
2017 (joining Infrastructure) for separate accounts
• GRESB survey utilized with 15 partners.
• RAU participating in Climate Risk Data Mapping project
launched in 2017.
Research
• Year 1: conduct clean power & energy efficiency
sectors research, identify opportunities
• Year 2-5: develop and implement priority initiatives
• Held an Energy Optimization (EO) Initiative Roundtable in
September 2016 with industry experts and investment
partners.
• Incorporated the EO Initiative into the AIP process for FY
2017-18.
• Research, develop and assess energy optimization strategies.
Responsible
Contractor Program
(RCP)
• Continue Responsible Contractor Program (RCP)
• CalPERS Separate Account operating agreements continue to
include provisions requiring compliance with the Responsible
Contractor Program Policy.
Progress on Strategic Plan Initiatives