real activities manipulation and auditors' client-retention decisions
TRANSCRIPT

Online Early — Preprint of Accepted ManuscriptThis is a PDF file of a manuscript that has been accepted for publication in an American Accounting Association journal. It is the final version that was uploaded and approved by the author(s). While the paper has been through the usual rigorous peer review process for AAA journals, it has not been copyedited, nor have the graphics and tables been modified for final publication. Also note that the paper may refer to online Appendices and/or Supplements that are not yet available. The manuscript will undergo copyediting, typesetting and review of page proofs before it is published in its final form, therefore the published version will look different from this version and may also have some differences in content.
We have posted this preliminary version of the manuscript as a service to our members and subscribers in the interest of making the information available for distribution and citation as quickly as possible following acceptance.
The DOI for this manuscript and the correct format for citing the paper are given at the top of the online (html) abstract.
Once the final published version of this paper is posted online, it will replace this preliminary version at the specified DOI.
The Accounting Review • Issues in Accounting Education • Accounting HorizonsAccounting and the Public Interest • Auditing: A Journal of Practice & Theory
Behavioral Research in Accounting • Current Issues in Auditing Journal of Emerging Technologies in Accounting • Journal of Information Systems
Journal of International Accounting Research Journal of Management Accounting Research • The ATA Journal of Legal Tax Research
The Journal of the American Taxation Association

preprint
accepted manuscript
Real Activities Manipulation and Auditors’ Client Retention Decisions
Yongtae Kim Santa Clara University
Myung Seok Park
Virginia Commonwealth University
Abstract: In this study, we examine the effect of clients’ real activities manipulation (RAM) on auditors’ client retention decisions. We find that, with the exception of RAM through overproduction, clients’ opportunistic operating decisions are positively associated with the likelihood of auditor resignations. We also provide evidence that auditors are especially sensitive to clients’ RAM to just meet or beat earnings benchmarks in their client retention decisions. In addition, we find that clients whose auditors resign from engagements tend to hire smaller auditors and these clients engage in RAM more aggressively. Our additional analysis shows that, with the exception of RAM through overproduction, clients’ abnormal operating decisions are significantly associated with litigation risk against auditors. Overall, our evidence suggests that auditors shed clients with aggressive RAM to avoid excessive risk. Keywords: Real activities manipulation, Auditors’ client retention decision, Auditor resignation Data Availability: Data used in this study are available from public sources identified in the
study.
Editor’s note: Accepted by John Harry Evans III. Submitted July 2011 Accepted August 2013
We are grateful for the helpful comments and suggestions of John Harry Evans III (Senior Editor), two anonymous reviewers, Michael Calegari, Carolyn Norman, Benson Wier, and workshop participants at the 2009 AAA annual meeting, the 2009 AAA Western Region Meeting, the 2009 International Risk Management Conference, University of Memphis, Singapore Management University, and Sungkyunkwan University. We also gratefully acknowledge funding from PwC INQuires grant program.

preprint
accepted manuscript
1
I. INTRODUCTION
Despite regulators' considerable attention to auditor changes motivated by clients’ opportunism
in financial reporting (e.g., Securities and Exchange Commission 1988), there is little evidence on the
impact of opportunism in financial reporting on auditors’ client retention decisions. Prior studies
provide some insights into the relation between opportunistic financial reporting and auditor changes
(e.g., Krishnan and Krishnan 1997; DeFond and Subramanyam 1998; Shu 2000; Heninger 2001).
Heninger (2001) finds that abnormal accruals are positively related to the probability of litigation
against auditors. Krishnan and Krishnan (1997) and Shu (2000) document that auditor litigation risk is
associated with auditor resignations. Nevertheless, the association between managerial opportunism
and auditor resignation is unclear. DeFond and Subramanyam (1998) find income-decreasing abnormal
accruals prior to auditor changes, suggesting that auditors restrict accrual-based earnings management
and that clients attempt to replace incumbent auditors with more lenient ones. Although evidence in
DeFond and Subramanyam (1998) has implications for the relation between auditor conservatism and
the client’s choice of its auditor, it provides little insight into the relation between managerial
opportunism and the auditor’s client portfolio management. In addition, a decrease in abnormal
accruals prior to auditor changes suggests that abnormal accruals reported in financial statements do not
fully capture the degree of managerial opportunism in financial reporting because they reflect auditors’
preference for conservative accounting choices for clients with greater audit risk.1
In this study, we examine the relation between the auditor’s client retention decision and
real activities manipulation (RAM), our proxy for managerial opportunism. Extant literature
(Healy and Wahlen 1999; Roychowdhury 2006; Cohen et al. 2008; Cohen and Zarowin 2010; Zang
2012) suggests that managers exercise discretion not only via their choice of accounting estimates
and methods (i.e., accrual-based earnings management), but also through operational decisions. As 1 That is, we may not fully capture the extent of managerial opportunism that exists before auditors exert their will in the auditing process.

preprint
accepted manuscript
2
an alternative tool of earnings management, RAM occurs through changing operating activities and
decisions (e.g., opportunistically reducing discretionary expenses, overproducing, and offering price
discounts to boost current-period sales).2 Unlike abnormal accruals, which reflect the realized level
of earnings management after auditors conduct financial statement audits, RAM is subject to less
auditor scrutiny because it is done through real operating decisions rather than accounting method
choices. As such, RAM better reflects managers’ behavior and attitudes toward financial
reporting because it is not filtered through the audit process.
Although managers rather than auditors typically control RAM, this does not necessarily
mean that auditors are unconcerned about clients’ aggressive RAM. In fact, according to our
conversations with several current and former BIG 4 audit partners and directors, auditors are
concerned about clients’ abnormal and aggressive operating decisions to meet or beat their earnings
benchmarks.3 Specifically, they recognize the negative consequences of such business practices.
They are especially concerned about long-term implications of such aggressive operating decisions,
because abnormal business practices may increase business risk to the client as well as to the
auditor.4 Although there are multiple reasons to terminate an engagement relationship with a client,
audit partners and directors that we interview agree that a client’s aggressive operating decisions that
sacrifice long-term value are an important factor in their client retention decisions.
In this study, we argue that auditors are concerned about clients' abnormal operating practices
for the following reasons. First, RAM has a negative impact on cash flows and future performance 2 Roychowdhury (2006) defines RAM as management actions that deviate from normal business practices, undertaken with the primary objective of meeting or beating certain earnings thresholds. 3 AU section 329.23 (PCAOB 2002) requires auditors to engage in analytical review procedures to evaluate significant unexpected differences in financial statement items. Audit analytical review is the diagnostic process of identifying and determining the cause of unexpected fluctuations in account balances. Prior literature (e.g., Wright and Ashton 1989; Koonce 1992) shows that analytical review is beneficial for detecting unexpected fluctuations and is an important part of auditing. By comparing the actual results with those expected for balance sheet and income statement items, auditors should consider that unexplained differences may indicate an increased audit risk (AU section 329.21, PCAOB 2002) 4 In our discussions, one audit partner suggests that auditors view clients’ abnormal operations (i.e., inventory and accounts receivable build-up, cuts in R&D, etc.) as a sign of business risk to the client as well as to the auditor.

preprint
accepted manuscript
3
(e.g., Ewert and Wagenhofer 2005; Graham et al. 2005; Cohen et al. 2008; Mizik and Jacobson
2008; Leggett et al. 2009; Cohen and Zarowin 2010; Mizik 2010; Francis et al. 2011; Zang 2012).
For instance, Ewert and Wagenhofer (2005) show that RAM is costly and directly reduces firm value
(Proposition 4). Deterioration of the client’s performance and financial health limits an auditor’s
future business opportunities with the client. Second, clients’ poor financial performance often leads
to auditors being held liable for clients’ stakeholder losses, even if the auditors are not directly
responsible (O’Malley 1993; Arthur Andersen & Co. et al. 1992). For instance, O’Malley (1993)
asserts that when a client experiences financial losses, the auditors may be sued by anyone who
allegedly suffered a financial loss. He claims, “The auditors need not have done anything to cause the
loss. They need only be perceived to have done nothing to prevent or minimize it, or indeed to
predict it, and well in advance of the event” (O’Malley 1993, 83). Prior studies also provide evidence
that investors see auditors as providing insurance coverage in the case of securities litigation
(Willenborg 1999; Mansi et al. 2004) and as a potential source for recovery of losses (Menon
and Williams 1994; Baber, Kumar, and Verghese 1995). Third, RAM can contribute to an increase
in audit risk. Overproduction leads to inventory build-up, and excessive credit sales result in an
increase in receivables, both of which increase audit risk (e.g., Simunic 1980; Stice 1991). Inventory
build-up increases the probability of inventory write-downs, while higher receivables increase the
risk of bad debt.5 Finally, aggressive RAM reflects the management’s opportunism in financial
reporting (e.g., Roychowdhury 2006; Cohen et al. 2008; Cohen and Zarowin 2010; Zang 2012). The
discovery of opportunistic operating decisions that dissipate firm value casts doubt on the integrity of
management and its financial statements.
Facing resource constraints, auditors may shed clients with limited future opportunities and
greater risk. Since auditors cannot effectively control the clients’ RAM, they attempt to adjust their 5 Furthermore, a significant growth in accounts receivables and inventory as consequences of RAM could provide greater opportunities for accrual-based earnings management in subsequent periods (e.g., Cohen et al. 2008).

preprint
accepted manuscript
4
client portfolios by resigning from risky engagements (Bockus and Gigler 1998). Therefore, we
predict that auditors are more likely to resign when clients engage in RAM aggressively.
Following prior literature (Roychowdhury 2006; Cohen et al. 2008; Cohen and Zarowin
2010), we estimate and examine three types of activities manipulation: 1) sales manipulation, 2)
overproduction, and 3) reduction of discretionary expenses. To mitigate the concern that clients’
financial performance may explain the relation between RAM and auditor resignation, we make
several research design choices. First, we construct our RAM measures after adjusting for the
client’s financial performance (see Kothari et al. 2005). We also explicitly control for the client’s
financial performance by including return on assets and other proxies for financial performance,
such as financial distress, and expected future performance in the regressions. In addition, we
utilize a performance-matched control sample.
Consistent with our prediction, we find that clients’ opportunistic operating decisions,
proxied by abnormal cash flows and abnormal discretionary expenses, are positively associated
with the likelihood of auditor resignations. We find little evidence, however, that abnormal
production costs are significantly associated with the likelihood of auditor resignations. Our
results are robust to three sets of control samples: client-initiated auditor changes, all continuing
audit clients, and performance-matched continuing audit clients. We also find that clients whose
auditors resign tend to engage in RAM more aggressively to meet or beat earnings benchmarks
prior to auditor changes, and that auditors are especially sensitive to clients’ RAM to just meet or
beat earnings benchmarks in their client retention decisions, with the exception of RAM through
overproduction. Furthermore, additional analysis reveals that clients whose auditors resign from
engagements tend to employ non-Big 4 auditors as successor auditors and that these clients
engage in RAM more actively than other clients whose incoming auditors are Big 4. We further
find that the association between RAM and the likelihood of auditor resignation is especially

preprint
accepted manuscript
5
prevalent for small clients and during the post- Sarbanes-Oxley Act of 2002 (SOX) period. In
addition, we find that client’s abnormal cash flows and abnormal discretionary expenses are
significantly associated with litigations against auditors.
Our study adds to the literature on auditor switches by highlighting the effect of
clients’ RAM on auditors’ client-portfolio management. Graham et al. (2005) report that
almost 80% of executives are willing to take real economic actions to maintain accounting
appearances. They admit to sacrificing long-term value for the sake of reporting desired
accounting numbers. Although earnings management through accounting choices is receiving
considerably more attention in the literature, survey results show that executives are more
willing to take real actions than accounting actions to meet earnings benchmarks. Despite the
pervasiveness of RAM and considerable attention to auditor switches, especially in the post-
SOX era, there is little evidence for the implication of RAM for auditors’ client retention
decisions. To the best of our knowledge, our study is the first to show an association between
clients’ opportunistic operating decisions and auditor resignations. In addition, we provide
evidence of a direct association between the auditor’s client retention decisions and
managerial opportunism, which is difficult to fully capture with abnormal accruals.
The remainder of this paper proceeds as follows. In Section II, we discuss related literature
and research issues. We describe our research design in Section III. We present empirical results in
Section IV, which is followed by additional analyses in Section V. We conclude in Section VI.
II. RESEARCH ISSUE
Heninger (2001) and Palmrose and Scholz (2004) report that clients’ aggressive financial
reporting is positively associated with auditor litigation risk. Stice (1991), Krishnan and
Krishnan (1997), and Shu (2000) provide empirical evidence of a positive association between

preprint
accepted manuscript
6
auditor litigation risk and auditor resignations. Stice (1991) reports a positive association
between the likelihood of litigation and the probability that the auditor will resign rather than be
dismissed from the engagement. By examining the role of litigation risk against auditors in
differentiating auditor resignations from dismissals, Krishnan and Krishnan (1997) also provide
empirical evidence that auditors tend to resign from engagements that are associated with high
litigation risk. Similarly, Shu (2000) presents evidence that clients whose auditors resign from
engagements possess greater litigation risk. Nonetheless, there is little evidence on the impact of
managerial opportunism in financial reporting on the auditor’s client retention decision.
DeFond and Subramanyam (1998) find income-decreasing abnormal accruals prior to the
auditor change, especially for clients with high litigation risk. This evidence suggests that when the
auditor restricts accrual-based earnings management, the client may attempt to replace the auditor with
a potentially more lenient one. DeFond and Subramanyam (1998) provide evidence on the client’s
response to the auditor’s preference for conservative accounting choices. This evidence, however,
provides little insight into the impact of managerial opportunism on the auditor’s client retention
decision. We shed light on this issue by examining the association between auditor resignations and
RAM, our proxy for managerial opportunism.
Recent studies (e.g., Roychowdhury 2006; Cohen et al. 2008; Cohen and Zarowin 2010;
Zang 2012) document that managers exercise discretion not only via their choice of accounting
estimates and methods (i.e., accrual-based earnings management), but also through operational
decisions. These studies suggest that managers engage in aggressive financial-reporting practices
using RAM. For instances, Roychowdhury (2006) provides evidence that managers tend to
manipulate operating activities to avoid reporting losses and to meet annual analyst forecasts.
Cohen et al. (2008) report that the level of RAM increases significantly after the passage of SOX,

preprint
accepted manuscript
7
while the level of accrual-based earnings management declines, indicating that firms shift from
using accrual-based earnings management to RAM after SOX.6
Unlike accrual-based earnings management, auditors may not be directly responsible for
clients’ RAM because it is not done through accounting method choices and managers typically
control it. Nonetheless, there are several reasons why clients’ aggressive RAM can be of
particular concern to auditors. First, RAM has a negative impact on the client’s cash flows and
future financial performance, which limits the auditor’s future business opportunities with the
client. Focusing on RAM to just meet earnings benchmarks, Gunny (2010) finds a positive
association between RAM and subsequent performance. An overwhelming majority of studies,
however, document RAM's negative impact on future financial performance and firm value (e.g.,
Ewert and Wagenhofer 2005; Graham et al. 2005; Cohen et al. 2008; Mizik and Jacobson 2008;
Leggett et al. 2009; Cohen and Zarowin 2010; Mizik 2010; Francis et al. 2011; Zang 2012). In
their analytical study, Ewert and Wagenhofer (2005) show that firm value directly depends on
the level of expected RAM, because of the costs associated with RAM (Proposition 4, 1112).
Zang (2012) argues that the main costs of RAM are the economic consequences of deviating
from optimal business operations and therefore jeopardizing the firm’s competitive advantage.
Graham et al. (2005) find that managers would rather take economic actions that could have
negative long-term consequences than make within-GAAP accounting choices to manage
earnings. Mizik and Jacobson (2008) and Mizik (2010) find that the myopic RAM has a negative
impact on future stock returns and financial performance. In a similar vein, Cohen and Zarowin
(2010) provide evidence that, for equity offering firms, a decline in post-offer performance
6 Earlier studies provide evidence on the opportunistic reduction of expenses, such as R&D expenses, to either increase earnings or meet earnings benchmarks (Dechow and Sloan 1991; Baber et al. 1991; Bushee 1998; Bens et al. 2002). Thomas and Zhang (2002) present evidence on RAM through overproduction. They find that firms tend to produce more than the quantity required to meet sales and normal target inventory levels to decrease the reported cost of goods sold, thereby increasing reported earnings.

preprint
accepted manuscript
8
because of RAM is more severe than that resulting from accrual-based earnings management.
Other studies report the negative (positive) association between RAM and accounting
performance (stock price crash) in the subsequent period (Leggett et al. 2009; Francis et al.
2011). Facing resource constraints, auditors might be less willing to retain clients with potential
financial trouble that limits future possible business opportunities with the client.
Second, a client’s poor financial condition may also be costly for the auditor if the auditor
is held liable for the client’s stakeholder losses, even if the auditor is not directly responsible for
the losses (O’Malley 1993; Arthur Andersen & Co. et al. 1992).7 Stice (1991) contends that
clients’ poor financial conditions may provide plaintiffs with an incentive for recovering from
auditors, who are perceived to have “deep pockets.” Willenborg (1999) argues that larger,
prestigious auditors are perceived to provide an ex ante signal of increased insurance coverage in
the event of securities litigation. That is, investors view larger auditors as providing financial
statement users with a form of insurance. More recently, Mansi et al. (2004) find evidence that
investors value the insurance role of auditors in addition to their information role. Other studies
also suggest that investors rely on auditors as a potential source for recovery of losses (Menon
and Williams 1994; Baber, Kumar, and Verghese 1995).
Third, auditors of clients engaging in RAM could also be exposed to a greater audit risk going
forward. Overproduction to reduce the cost of goods sold in the current period leads to inventory
buildup. Excessive credit sales to boost current-period sales increase receivables in current and
subsequent periods. Prior studies (e.g., Simunic 1980; Stice 1991) report that both inventory build-up
and having more receivables increase audit risk because inventory build-up raises the probability of
7 To the extent that recent legislations (i.e., the Private Securities Litigation Reform Act of 1995 and the related Securities Litigation Uniform Standards Act of 1998) alter an audit firm’s liability from joint-and-several to proportional liability in an effort to reduce attempts to sue the “deep pockets” of the audit firm and its related insurance carriers, an auditor’s legal exposure to shareholder losses might have decreased in more recent years.

preprint
accepted manuscript
9
inventory write-downs and increases in receivables elevate the risk of bad debt. Cohen et al. (2008) find
that a significant growth in accounts receivables and inventory is associated with large magnitudes of
abnormal accruals.
Finally, RAM reflects the managements’ opportunistic attitude toward financial reporting
(e.g., Roychowdhury 2006; Cohen et al. 2008; Cohen and Zarowin 2010; Zang 2012). Managerial
opportunism in financial reporting is often considered as an outcome of poor managerial integrity
(AICPA 2007). The discovery of an irregularity, such as opportunistic operating decisions that
dissipate firm value, casts doubt on the integrity of management and its financial statements. A
lack of managerial integrity could lead to fraudulent reporting.8 Auditing standards require auditors
to explicitly consider management integrity in planning their audits and client retention decisions
(e.g., SAS No. 99, AU sec. 316.78, AICPA 2002 and PCAOB 2002). Johnstone and Bedard (2004)
find that auditors’ assessments of management integrity are highly significant in distinguishing
auditor resignations from continuing clients.
Research on the association between RAM and audit-related variables is limited. Cohen
and Zarowin (2010) find that clients audited by large audit firms and those with longer auditor
relationships are more likely to engage in RAM. A concurrent working paper by Sohn (2011) finds
a positive relation between audit fees and real earnings management. The enactment of SOX has
resulted in large increases in required audit work, SOX-induced resource constraints, and public
scrutiny. Facing resource constraints, auditors have incentives to shed from their portfolios riskier
clients and clients that offer limited future business opportunities. Bockus and Gigler (1998) show
that it may be more rational for an incumbent auditor to withdraw from a risky engagement than to
8 Kim et al. (2012) find that socially responsible firms engage in less RAM than firms that do not meet the same social criteria. In addition, they find that incidences of Accounting and Auditing Enforcement Releases (AAERs) against CEOs/CFOs are less frequent for socially responsible firms, indicating that traits of firm executives are important and closely related to opportunistic accounting decisions that may be subject to AAERs. Their findings suggest that RAM might be closely associated with managerial integrity.

preprint
accepted manuscript
10
demand higher fees for such an engagement. Therefore, to the extent that RAM is associated with
the client’s future financial trouble and opportunism in financial reporting, we predict that auditor
resignations are more likely when clients engage in RAM aggressively. Our empirical prediction
follows:
Empirical Prediction: Ceteris paribus, auditors are more likely to resign when clients aggressively engage in real activities manipulation prior to auditor switches.
III. RESEARCH DESIGN
Data and Sample Selection
We obtain a sample of auditor changes between January 2000 and December 2010 from the
Audit Analytics database. We exclude auditor changes associated with 2002 Andersen dismissals.
After merging with the COMPUSTAT and CRSP databases, we have an initial sample of 5,660
auditor changes. We obtain financial data from the COMPUSTAT database and stock price, trading
volume, and returns from the CRSP database. The sample is restricted to auditor changes of firms
that are in neither regulated industries nor financial institutions and have available data to calculate
RAM, abnormal accruals, and a proxy for auditor litigation risk, based on Shu’s (2000) model. After
applying these restrictions, we have 2,189 sample auditor changes, of which 589 are auditor
resignations and 1,600 are client-initiated dismissals. All continuous variables, including RAM
proxies, are winsorized at the top and bottom 1% of the distribution. Panel A of Table 1 reports the
sample distribution of auditor changes by two-digit Standard Industrial Classification (SIC) industry
code, and for comparison, that of all continuing audit clients.
[Insert Table 1 here.]
For the auditor resignation subsample, the most represented industry is Business Services,
which comprises 20.20 percent of the resignation sample. Electronic & Other Electric Equipment

preprint
accepted manuscript
11
comprises 15.62 percent, followed by Industrial Machinery & Computer Equipment at 9.68
percent. The same two industries make up the largest two shares of the auditor dismissal and
continuing client samples, whereas Instruments & Related Products is ranked fifth in auditor
resignations but third in the auditor dismissal and continuing client samples.
Panel B of Table 1 provides the sample distribution of auditor changes by year. The last
column shows that the relative proportion of auditor resignations as a percentage of all auditor
changes (resignation rate) generally increases over the sample period. Specifically, auditor
resignation rates average 21 percent over the 2000-2002 period versus 29 percent over the 2003-
2010 period. One possible reason for this increase is that Big 4 audit firms are shedding clients
who do not fit their risk profile; another reason may be that because they face compliance
challenges under SOX, Big 4 audit firms are reallocating resources and focusing on more
profitable clients.
Measurement of RAM
We follow prior studies (e.g., Roychowdhury 2006; Cohen et al. 2008; Cohen and
Zarowin 2010) in developing our proxies for RAM. Specifically, our three measures are (1)
abnormal levels of cash flow from operations (CFO), (2) abnormal production costs, and (3)
abnormal discretionary expenses. We measure the abnormal level of each activity as the residual
from the relevant estimation models by year and the two-digit SIC industry. Roychowdhury
(2006) defines sales manipulation as managers’ attempts to temporarily boost sales during the
year by offering price discounts or more lenient credit terms, which in turn lowers the cash
inflow. Hence, sales manipulation is expected to result in a lower current-period CFO. Following
prior studies (Roychowdhury 2006; Cohen et al. 2008; Cohen and Zarowin 2010), we estimate
the following model for firm i’s normal level of CFO:
CFOit /Ait-1 = α0 + α1(1/Ait-1) + β1(Sit /Ait-1) + β2( Δ Sit /Ait -1) + εit (1)

preprint
accepted manuscript
12
where CFOit is cash flow from operations in year t, Ait-1 is total assets at year t-1, Sit is net sales
in year t, and Δ Sit = Sit -Sit-1. For every firm-year, abnormal cash flow from operations is the
difference between the actual CFO and estimated “normal” CFO from equation (1).
The second measure of RAM is abnormal production costs. Managers of manufacturing
firms can manage earnings upward by producing more goods than necessary. With higher levels of
production, firms can spread fixed overhead costs over a larger number of units, thereby lowering
fixed costs per unit. Thus, overproduction results in a lower cost of goods sold (COGS) and better
operating margins. Prior studies (Roychowdhury 2006; Cohen et al. 2008; Cohen and Zarowin 2010)
define production costs as the sum of the COGS and the change in inventory during the year.
Following these studies, we estimate the following model for firm i’s normal COGS:
COGSit /Ait -1 = α0 + α1(1/Ait -1) + β(Sit /Ait -1) + εit (2)
where COGSit is the cost of goods sold in year t. Similarly, we estimate the model for firm i’s
normal inventory growth using the following equation:
Δ INVit /Ait -1 = α0 + α1 (1/Ait -1) + β1( Δ Sit /Ait -1) + β2( Δ Sit-1 /Ait -1) + εit (3)
where Δ INVit is the change in inventory in year t. Using equations (2) and (3), we estimate firm
i’s normal production costs from the following equation:
PRODit/Ait-1 = α0 + α1(1/Ait-1) + β1(Sit/Ait-1) + β2( Δ Sit/Ait-1) + β3( Δ Sit-1 /Ait-1) + εit (4)
The abnormal production cost is the difference between actual production costs and estimated “normal”
production costs. Unusually high production costs result in an increase in current period earnings.
The third measure of RAM is abnormal discretionary expenses. Prior studies
(Roychowdhury 2006; Cohen et al. 2008; Cohen and Zarowin 2010) express normal
discretionary expenses as a function of current sales. Following these studies, we estimate firm
i’s normal level of discretionary expenses using the following equation:

preprint
accepted manuscript
13
DISEXPit /Ait -1 = α0 + α1(1/Ait-1) + β (Sit -1 /Ait-1) + ε it (5)
where DISEXPit is discretionary expenses in year t, defined as the sum of research and development
(R&D), advertising, and selling, general, and administrative (SG&A) expenses. As Roychowdhury
(2006) and Cohen et al. (2008) note, modeling discretionary expenses as a function of current sales
creates a mechanical problem if firms manage sales upward to increase reported earnings in a certain
year, resulting in significantly lower residuals from a regression using current sales in that year. To
address this issue and estimate normal discretionary expenses, we express discretionary expenses as a
function of lagged sales. For every firm-year, the abnormal discretionary expenditure is the
difference between actual discretionary expenses and estimated “normal” discretionary expenses.
Unusually low discretionary expenses result in an increase in current period earnings.
An important concern in examining the relation between RAM and auditor resignation is the
confounding effect of clients’ performance. A client’s abnormal cash flows, production costs, and
discretionary expenses can be attributable to its poor performance. At the same time, auditors may
resign from poorly performing clients (Beneish et al. 2005). That is, clients’ financial performance may
explain the relation between RAM and auditor resignation. To mitigate this concern, we construct our
RAM measures after adjusting for financial performance. We follow the performance-matching
procedure that Kothari et al. (2005) propose in calculating performance-matched abnormal accruals.
We match each sample firm with all control firms from the same two-digit SIC industry, with ROA
(net income before extraordinary items divided by total assets) in the fiscal year greater than 50% but
less than 150% of the sample firms’ ROA.9 We measure the performance-adjusted abnormal cash flow
9 We restrict the range of comparable ROAs to ensure that the control firm's ROA is truly comparable to that of the sample firm. Without this restriction, even the ROA of the firm that has the closest ROA could be quite different from the ROA of the sample firm. We drop the sample observation if we cannot find a match within the 50% to 150% bound. We subtract the mean values of RAM measures of the matched control firms in the comparable performance range to mitigate the influence of measurement errors in RAM measures. We also attempt to apply a narrower cut-off of ROA greater than 80% but less than 120%. Although the number of usable observations is much smaller because of the limited availability of control firms, untabulated results are qualitatively similar. Throughout

preprint
accepted manuscript
14
from operations (AB_CFO), the performance-adjusted abnormal production costs (AB_PROD), and the
performance-adjusted abnormal discretionary expenses (AB_EXP) as the sample firm’s three individual
RAM proxies minus the mean values of corresponding measures for the matched control firms.
Cohen et al. (2008) contend that given sales levels, firms that manage earnings upward
experience some combination of unusually low cash flow from operations, unusually high production
costs, and unusually low discretionary expenses. Thus, they analyze the three individual RAM proxies
and also compute a single combined proxy by summing the three individual RAM variables. Similarly,
we use three individual proxies (AB_CFO, AB_PROD, and AB_EXP) and a combined proxy
(AB_COMBINED) in the analyses. Considering the expected directions of the three variables, we
calculate AB_COMBINED as (AB_PROD – AB_CFO – AB_EXP). Thus, our combined RAM proxy
increases as firms engage in more aggressive earnings management through real activities.
Empirical Model
To examine the relation between auditor resignation and RAM, we estimate the following
cross-sectional logistic regression model with an auditor resignation dummy (RESIGN) as a
dependent variable and real activities manipulation (RAM_PROXY) as an independent variable,
along with control variables:10
Pr (RESIGN =1) =F( α0 + α1 RAM_PROXY +∑=
9
2jjα OTHER AUDIT RISK CONTROL VARIABLES
+∑=
14
10kkα FINANCIAL PERFORMANCE CONTROL VARIABELS
+ ∑=
19
15llα OTHER CONTROL VARIABLES + INDUSTRY INDICATORS) (6)
RESIGN is an indicator variable that takes the value of one if the auditor resigns, and zero
otherwise. RAM_PROXY is one of our four proxies for RAM: performance-adjusted abnormal cash
the paper, we use the words “similar” or “consistent” to mean that the coefficients on variables of interest have the same signs and similar levels of statistical significances as those tabulated. 10 Industry indicators based on the client’s two-digit SIC are also included in model (6).

preprint
accepted manuscript
15
flows from operation (AB_CFO), performance-adjusted abnormal production costs (AB_PROD),
performance-adjusted abnormal discretionary expenses (AB_EXP), or a combined measure of
abnormal activities manipulation (AB_COMBINED). Control variables are defined in Appendix A.
In this study, we define unusually lower level of abnormal operating cash flows, unusually
lower level of discretionary expenses, and/or unusually high level of production costs as earnings
management through RAM. If clients with aggressive RAM are more likely to experience a high
probability of auditor resignation, we predict the coefficient estimates on AB_CFO and AB_EXP
(AB_PROD) to be negative (positive). We also expect the coefficient on AB_COMBINED to be
positive because the combined RAM proxy increases as firms engage in more aggressive earnings
management through real activities.
Johnstone and Bedard (2004) view the auditor’s portfolio management decisions as
functions of the client’s financial risk, audit risk, audit fees, and other client- and auditor-specific
variables. Thus, to isolate the incremental effect of RAM on auditor resignations, we include
other audit risk-related control variables that previous literature identifies as determinants of
audit risk and auditor changes, to minimize concerns about the correlated omitted variable
problem. To mitigate concerns about a potential endogeneity problem, especially one arising
from future financial performance, we include several control variables that are related to the
client’s financial performance. We also control for client size, auditor’s industry specialization,
resource constraints, and industry.
Prior research (Krishnan and Krishnan 1997; Shu 2000; Stice 1991) documents that
auditor litigation risk is positively associated with auditor resignations. To gauge the net effect of
RAM on auditor resignations after controlling for the effect of auditor litigation risk that can be
explained by factors other than RAM, we include the auditor litigation risk proxy,
AUDITOR_LIT, as a control variable. Note that we calculate the proxy for auditor litigation risk
preprint
accepted manuscript
16
based on Shu’s (2000) model, which does not incorporate RAM.11 We compute AUDITOR_LIT
at the end of the fiscal year prior to auditor changes, using the coefficients suggested in Shu
(2000).12 We also conduct additional analyses using an alternative version of Shu’s (2000) model,
as in Krishnan and Zhang (2005),13 and untabulated results are qualitatively similar.
To control for the potential substitution effect between accrual-based earnings management
and RAM (Cohen et al. 2008), we include abnormal accruals, AB_ACC, as an independent variable.
Ashbaugh-Skaife et al. (2008) find that internal control weakness affects the quality of accruals and
is positively associated with idiosyncratic risk and systematic risk, which in turn would increase audit
risk. Therefore we control for internal control deficiency (ICD). We also control for the variables that
represent the relationship between the auditor and the client, including an indicator for a going
concern opinion (OP_GC), an indicator for a long auditor tenure (LONG_TENURE), non-audit fee
(NON_AUDFEE), and audit fee (AUDFEE). Krishnan and Krishnan (1997) find that auditors are
more likely to resign from clients with going-concern opinions and less likely to resign from clients
with whom they have a long-term relationship, as evidenced by a long tenure. Cohen et al. (2010),
however, show that clients with longer auditor relationships are more likely to engage in RAM.
Following Johnson et al. (2002), we define auditor tenure as long if the predecessor auditor audited
the client for nine or more years. If an audit firm generates large non-audit and/or audit fees from the
client, it would be less likely to resign from the engagement. We also include a Big 4 indicator, BIG4,
as Cohen et al. (2010) find that clients of large audit firms are more likely to engage in RAM. At the
same time, Big 4 audit firms are more likely to resign from risky clients.
11 The untabulated results for the logistic model excluding the auditor litigation proxy, AUDITOR_LIT, are qualitatively similar. 12 AUDITOR_LIT = 0.276(SIZE) + 1.153(INV) + 2.075(REC) + 1.251(ROA) – 0.088(CURRENT RATIO) + 1.501(LEVERAGE) + 0.301(GROWTH) - 0.371(RETURN) – 2.309 (STOCK VOLATILITY) + 0.235(BETA) + 1.464(TURNOVER) + 1.060(DELIST) + 0.928(TECH) + 0.463(OPINION) - 10.049. Variables are defined in Appendix A. 13 To reduce noise in the computed measure, Krishnan and Zhang (2005) use only the significant variables in Shu’s (2000) model.

preprint
accepted manuscript
17
Auditors may resign from clients that experience declining profit or revenue (Beneish
et al. 2005). Poor financial performance may also trigger clients to engage in RAM. To control
for the client’s financial performance, we include several performance proxies, including ROA
(Johnstone and Bedard 2004), a loss indicator (LOSS), changes in sales (ΔSALES), a proxy for
financial distress (DISTRESS) (Krishnan and Krishnan 1997; Shu 2000), and a proxy for
expected future performance (F_PERF).
We also include other client- and auditor-specific variables, such as client’s leverage
(LEVERAGE), client’s sales growth (GROWTH), client’s size (SIZE), auditor’s industry market
share (MSHARE), and an indicator for a busy season audit (BUSY_FYE) as well as industry fixed
effects. Because auditors are more likely to resign from riskier clients, we expect a positive relation
between leverage and propensity for auditor resignations. If GROWTH proxies for risk, it would be
positively related to auditor resignation. Alternatively, auditors may prefer clients with high growth,
thus predicting a negative relation between GROWTH and auditor resignation. Krishnan and
Krishnan (1997) predict that client size is positively related to auditor resignations because it is
positively related to litigation risk, but find an insignificant relation. Auditors may want to retain
bigger clients, however. Thus, a priori, it is difficult to predict the sign of the relation between the
client’s size and auditor resignation propensity.
IV. EMPIRICAL RESULTS
To examine the association between RAM and auditor resignations, we use three
different control samples. The first control sample consists of client-initiated auditor changes
(i.e., auditor dismissals). Several prior studies use this approach to examine auditor resignations
(e.g., Krishnan and Krishnan 1997; Shu 2000). As the second control sample, we use continuing
audit clients, as in Johnstone and Bedard (2004). Finally, to further control for the effect of

preprint
accepted manuscript
18
clients’ performance on the relation between RAM and auditor resignations, we use
performance-matched continuing audit clients as the third control sample. Table 2, Panel A
reports descriptive statistics by auditor change and continuing audits.
[Insert Table 2 here.]
The mean and median values of the AB_CFO and AB_EXP (AB_COMBINED) for the
sample of auditor resignations are significantly lower (higher) than those for the samples of client-
initiated auditor dismissals and continuing audits. Note that our combined RAM proxy,
AB_COMBINED, increases as firms engage in more aggressive earnings management through real
activities. The results show that the differences in mean and median values between resignation
and dismissal samples are statistically significant at conventional levels. We observe similar results
between resignation and continuing audit samples. For AB_PROD, we find no significant
difference between auditor resignation and dismissal samples and between auditor resignation and
continuing audit samples. In sum, the descriptive statistics suggest that clients tend to have
unusually low cash flows and discretionary expenses prior to auditor resignations. We find no
evidence, however, that production costs are unusually high for clients with auditor resignations.
Panel A of Table 2 also provides evidence that the auditor resignation sample has
significantly higher litigation risk based on Shu’s (2000) model,14 and higher audit-related fees but
lower non-audit fees than the auditor dismissal sample. The descriptive statistics show that the
auditor resignation sample has relatively less effective internal controls, a higher probability of
going-concern opinion, and shorter auditor tenure. It is noted that approximately half of auditor
resignations are initiated by Big 4 auditors, while about 72 percent of dismissals are related to Big 4
14 Auditor litigation is a rare event. The mean auditor litigation score from the Shu model, AUDITOR_LIT, for the resignation sample is -5.6836, which corresponds to the 34 basis points of the auditor litigation probability (exp(-5.6836)/(1+exp(-5.6836)). In contrast, the mean value of the auditor litigation score is –6.0677 for the dismissal sample, which is equivalent to the 23 basis points of the litigation probability.

preprint
accepted manuscript
19
auditors. The results also show that the auditor resignation sample has, on average, a higher
likelihood of reporting a loss, lower ROA, greater financial distress, and worse future earnings,
compared to both dismissal and continuing audit samples. Furthermore, we observe that auditor
resignation sample features both a smaller client size and a smaller auditor’s market share than the
two control samples.
Panel B of Table 2 presents Pearson correlation coefficients for selected variables. As
shown, RESIGN is significantly and negatively (positively) correlated with AB_CFO and
AB_EXP (AB_COMBINED). Note that unusually low cash flows, unusually high production
costs, and unusually low discretionary expenses represent more aggressive RAM to manage
earnings upward. Our combined RAM proxy increases as firms engage in more aggressive
earnings management through real activities. Thus, bivariate correlations suggest that auditors
are more likely to resign from clients engaging in RAM, except overproduction. We also observe
that RESIGN is positively (negatively) correlated with auditor litigation, internal control
weakness, going-concern opinion, audit fee, loss, and financial distress (auditor tenure, non-audit
fee, Big 4 auditor indicator, ROA, a proxy for future performance, client size, and auditor market
share). Consistent with the findings of Cohen et al. (2008), AB_CFO and AB_EXP are negatively
correlated. Furthermore, the results show that while AB_CFO is positively (negatively)
correlated with change in sales and financial distress (ROA), AB_EXP is positively (negatively)
correlated to ROA (financial distress). We find little evidence, however, of correlations between
COMBINED_RAM and the financial performance variables, except change in sales.
Analysis with Auditor Dismissals as a Control Sample
Table 3 presents the results of the cross-sectional logistic regression analyses using a
control sample of auditor dismissals. In this table and all subsequent tables, we report test
statistics and significance levels based on standard errors adjusted for firm clustering.

preprint
accepted manuscript
20
[Insert Table 3 here.]
The coefficients on AB_CFO and AB_EXP are negative and significant at the p<0.01 or
p<0.05 level in models 1 and 3. The coefficient on the combined proxy, AB_COMBINED, is
positive and significant at the p<0.01 level in model 4, indicating that client firms that experience
auditor resignations are more likely to make opportunistic operating decisions that deviate from
normal business practices prior to the auditor change than are client firms which dismiss their
auditors. In contrast, the coefficient on AB_PROD is not statistically significant in model 2. Note
that we obtain these results after controlling for abnormal accruals. The coefficient on
AUDITOR_LIT is positive and significant at the five-percent level in all models, indicating that
auditors are more likely to resign from engagements when the auditor litigation risk increases,
which is consistent with Shu (2000).
Our results also show that the likelihood of auditor resignation is significantly higher for
clients having internal control deficiencies, auditors’ going-concern opinions, and financial
distress. Auditor tenure, audit fee, Big 4 auditor indicator, expected future performance, and
client size are significantly negatively associated with the probability of auditor resignation.15 In
sum, the results reported in Table 3 suggest that although auditor resignation is driven by several
factors, auditors seem to view a client's aggressive RAM, with the exception of that through
overproduction, as an important factor in their client portfolio management decisions.
Analysis with Continuing Audit Clients as a Control Sample
This section provides evidence of the effect of RAM on auditor resignations, using
continuing clients as an alternative control sample. This approach enables us to examine the
effect of RAM on audit firms’ client portfolio-management decisions more directly by
comparing RAM for clients with auditor resignations versus clients without auditor changes. 15 Big 4 auditors may be more likely to resign from risky clients, but they are not necessarily more likely to resign from all clients. See Table 7 and related discussions for analyses by incoming and outgoing auditor types.

preprint
accepted manuscript
21
Table 4 presents the logistic regression results of auditor resignation on RAM and control
variables. The coefficients on AB_CFO and AB_EXP (AB_COMBINED) are again negative
(positive) and significant at the p<0.05 or p<0.01 level. These results are consistent with those
reported in Table 3. Overall, the results presented in Table 4 show that clients with auditor
resignations tend to make more opportunistic operating decisions, except those for
overproduction, than do clients with continuing auditors.
[Insert Table 4 here.]
Analysis with Performance-Matched Continuing Audit Clients as a Control Sample
This section presents results based on performance-matched continuing audit clients as an
alternative control sample. We match each auditor resignation with the firm from the same two-
digit SIC industry that retains its auditor and has the closest ROA to the auditor resignation firm.
Through this one-to-one matching, we further control for the potential effect of clients’ financial
performance on the relation between RAM and auditor resignations.
Panel A of Table 5 reports descriptive statistics of RAM proxies for the auditor
resignation sample and the matching sample of continuing audit clients. The mean values of
AB_CFO and AB_EXP (AB_COMBINED) are significantly lower (higher) for the resignation
subsample than for the matching sample.
[Insert Table 5 here.]
Panel B of Table 5 reports the logistic regression results of auditor resignation on RAM and
control variables. Consistent with the results reported in Tables 3 and 4, the coefficients on
AB_CFO and AB_EXP (AB_COMBINED) are negative (positive) and significant at conventional
levels. The coefficient on AB_PROD is insignificant, however. In sum, the evidence based on one-
to-one matching is consistent with our prediction that auditors are more likely to resign from
engagements when their clients actively engage in RAM, except for RAM through overproduction.

preprint
accepted manuscript
22
Analysis with “Suspect” Clients
Prior studies (e.g., Roychowdhury 2006; Cohen et al. 2008) conduct additional analyses
using “suspect” firms (SUSPECT) that are particularly likely to manage earnings based on the
three benchmarks of zero earnings, non-negative changes in earnings, and analysts’ forecasts.
Graham et al. (2005) also conclude that managers choose real actions over accounting actions to
meet earnings benchmarks. This suggests that RAM is more likely to occur if the firm would
otherwise miss its earnings targets. Examining the “suspect” sample of “meet or beat” clients
also mitigates concerns about possible measurement errors in RAM proxies.
Following prior studies, we examine whether clients whose auditors resign from engagements
more aggressively engage in earnings management through RAM to meet these benchmarks prior to
auditor changes. First, we identify SUSPECT firm-years as those observations with net income before
extraordinary items, scaled by total assets that fall in the interval [0, 0.01).16 In the upper section of
Panel A of Table 6, we report mean and median values of RAM proxies for clients in the auditor
resignation sample and the auditor dismissal and continuing audit samples where the client firms
manage earnings to “just” avoid reporting a loss (i.e., fall within the interval).
Next, the middle section of Panel A of Table 6 reports results using a second measure of
SUSPECT firm-years, in which the change in net income before extraordinary items scaled by total
assets falls in the interval [0, 0.01). The mean and median values of RAM proxies for clients “just”
meeting or beating last year’s earnings are reported. Finally, the lower section of Panel A of Table 6
reports results for clients that manage earnings to “just” meet or beat the existing analysts’ consensus
forecasts prior to the earnings announcement. We define the analyst forecast error (AFE) as the
16 Roychowdhury (2006) and Cohen et al. (2008) identify and use firm-year observations with net income or change in net income before extraordinary items scaled by total assets that fall in the interval [0, 0.005) as SUSPECT firm-years. In this study, we use the broader interval [0, 0.01) as SUSPECT firm-years, because the number of firm-year observations is too small when we use the interval [0, 0.005). We also replicate our analyses using the interval [0, 0.005) as SUSPECT firm-years, however, and find the results qualitatively similar to those reported using the broader interval [0, 0.01).

preprint
accepted manuscript
23
difference between actual earnings per share (EPS) as reported by the Institutional Brokers’ Estimate
System (I/B/E/S) less the last consensus EPS forecast prior to the earnings announcement. We focus
on firm-year observations in which the AFE is one cent per share or less.
[Insert Table 6 here]
We find little evidence from the first benchmark, RAM to “just” avoid reporting losses,
potentially because of the small sample size. As shown for the last two benchmarks (i.e., RAM to “just”
meet or beat last year’s net income, and RAM to “just” meet or beat analyst forecasts by one cent per
share), the suspect clients with auditor resignation have significantly lower (higher) mean and median
values of AB_CFO and AB_EXP (COMBINED_RAM) than suspect clients with auditor dismissals,
except for the median difference in AB_EXP. This is also the case when we compare clients whose
auditors resign to continuing audit clients. Overall, these results suggest that clients whose auditors
resign tend to make more opportunistic operating decisions, except for overproduction, than those with
auditor dismissals or continuing audits when facing potential benchmark incentives.
We also re-estimate the logistic regressions by including the indicator for suspect clients,
SUSPECT, which takes the value of one if the firm-year observation belongs to any suspect firm
categories discussed above and zero otherwise, and the interaction of this indicator and RAM proxies.
Panel B of Table 6 presents the results with auditor dismissals as a control sample. Consistent with the
previously reported results, AB_CFO and AB_EXP (COMBINED_RAM) are significantly and
negatively (positively) associated with the likelihood of auditor resignation. More importantly, the
coefficients on the interactions of the suspect client indicator and RAM proxies, AB_CFO*SUSPECT
and AB_EXP*SUSPECT (AB_COMBINED*SUSPECT), are negative (positive) and significant at
conventional levels, indicating that auditors are even more likely to resign from suspect clients. The
sum of coefficients on RAM proxies and the interaction term, (α1+α3), are negative (positive) for
AB_CFO and AB_EXP (COMBINED_RAM) and significant at the p<0.05 or p<0.01 level.

preprint
accepted manuscript
24
Powers (2005) points out that an inference based on the coefficient of interaction term in logit
and probit models can be misleading. More generally, Ai and Norton (2003) argue that the
magnitude of the interaction effects (marginal effect of changes in two variables) in nonlinear models
does not equal the marginal effect of the interaction term, and that the statistical significance of the
former is not easily calculated. They present a consistent estimator of the interaction effect for
nonlinear models by taking cross-derivative and cross-difference into account. Following prior
studies (Ai and Norton 2003; Norton, Wang, and Ai 2004), we calculate the consistent estimators
and standard errors of the interaction effects in our logit models. We report the interaction effect and
Z-statistics, as well as statistical significance, for each logit model at the bottom of Panel B of Table
6. Consistent with the results reported earlier, interaction effects are significantly negative (positive)
for AB_CFO and AB_EXP (AB_COMBINED). Taken together, the results reported in Table 6
suggest that, with the exception of overproduction, the association between the likelihood of auditor
resignations and real operating decisions tends to be more pronounced for the suspect clients.17
V. ADDITIONAL ANALYSES
Auditor Resignations and RAM by Types of Incoming and Outgoing Auditors
For every auditor resignation, there is another auditor willing to pick up the same client. That
is, in an environment in which audits of all publicly traded companies are required, auditors cannot
collectively resign from riskier clients en masse — some audit firms must audit these risky clients.
Bockus and Gigler (1998) establish conditions under which an incumbent auditor prefers to resign
from the client and a different audit firm agrees to audit the client firm. Therefore, the direction of
auditor change is not necessarily from big to small auditors.
17 Untabulated results with the control sample of continuing audits are qualitatively similar to those reported in Panel B of Table 6.

preprint
accepted manuscript
25
Shu (2000) reports that compared to clients who dismiss auditors, clients whose auditors
resign are more likely to switch to small auditors. A recent report by the Government Accountability
Office (GAO, 2006) suggests that smaller firms move to smaller auditors because of concerns related
to audit and other costs, and because large auditor resignations are related to client profitability and
risk concerns. In this section, we investigate how RAM is associated with the allocation of clients
among different auditors surrounding auditor resignations.
SOX expands auditors’ responsibilities to include providing opinions on the effectiveness
of the clients’ internal controls and increased regulatory scrutiny of audit firms’ practices. Big 4
auditors may shed some low-quality clients when they make their client portfolio decisions
because of an increase in compliance challenges associated with SOX. By examining incoming
and outgoing auditors’ characteristics, we provide more insight into the association between RAM
and auditor-client realignments.
[Insert Table 7 here.]
Table 7 presents the results from the logistic regression including an indicator for non-Big 4
incoming auditor and its interaction with RAM proxies. The coefficients on four RAM proxies are all
insignificant, while the coefficients on AB_CFO*IN_NON-BIG4 and AB_EXP*IN_NON-BIG4
(AB_COMBINED*IN_NON-BIG4) are negative (positive) and significant at conventional levels. As
shown at the bottom of Table 7, the interaction effects are also statistically significant. The combined
coefficient estimates (α1+α3) for RAM proxies, AB_CFO and AB_EXP (AB_COMBINED), are
negative (positive) and significant at the p<0.01 level, suggesting that our results are driven primarily
by auditor changes with non-Big 4 incoming auditors.
Untabulated results from the logistic regression including an indicator for Big 4 outgoing
auditor and its interaction with RAM proxies show that while the coefficients on AB_CFO and
AB_EXP (AB_COMBINED) are negative (positive) and significant at conventional levels, those on

preprint
accepted manuscript
26
the interaction terms are insignificant. The interaction effects are also insignificant. Taken together,
we interpret these results to mean that while both Big 4 and non-Big 4 auditors shed risky clients
with aggressive RAM, smaller auditors generally acquire these clients.
Effect of the Sarbanes-Oxley Act of 2002
Cohen et al. (2008) report that the level of RAM increases significantly after the passage
of SOX. To investigate whether an increase in RAM around SOX explains our evidences
reported earlier, we conduct additional analyses by partitioning our sample into two sub-periods:
pre- and post-SOX. We classify years 2000 and 2001 as the pre-SOX period and 2002 through
2010 as the post-SOX period.18 Table 8 presents the results from the logistic regression including
a post-SOX indicator, POST, and its interaction with RAM proxies.
[Insert Table 8 here]
The coefficients on AB_CFO, AB_PROD, AB_EXP, and AB_COMBINED are all
insignificant. 19 In contrast, the coefficients on interaction terms, AB_CFO*POST and
AB_EXP*POST (AB_COMBINED*POST), are negative (positive) and significant at conventional
levels. The interaction effects are consistent with this result. The combined coefficients are
negative (positive) and statistically significant for AB_CFO and AB_EXP (AB_COMBINED). Thus,
our findings reported earlier appear to be driven mainly by abnormal operating decisions that
become more prevalent in the post-SOX period, which is consistent with Cohen et al. (2008).
Analysis by Manufacturing versus Non-manufacturing Clients
As RAM through overproduction is applicable only to manufacturing firms, the insignificant
coefficient on AB_PROD in our logistic regressions may result from including non-manufacturing
firms in the sample. Following Cohen et al. (2008), who provide an additional analysis only for
18 Untabulated results excluding year 2002 (the transition year) from the post SOX period are qualitatively similar. 19 Low power because of the small pre-SOX sample may be preventing significance in the pre-SOX period.
preprint
accepted manuscript
27
manufacturing firms, we estimate the logistic regression analysis including an indicator for
manufacturing firms, MANUFACT, and the interaction of this indicator and RAM proxies. Table 9
summarizes the results where we define a firm as a manufacturing firm if its two-digit SIC falls
between 20 and 39 (Cohen et al., 2008). Consistent with the results reported in Table 3, we continue
to find significantly negative (positive) coefficients on AB_CFO and AB_EXP (AB_COMBINED) at
the p<0.05 or p<0.01 level. For AB_PROD, the interaction effect is significantly positive, but the
combined coefficient is statistically insignificant. Overall, the results in Table 9 suggest that our
results are similar between manufacturing clients and other clients.20
[Insert Table 9 here]
Analysis of the Effect of Clients’ Size
Larger clients typically provide more business opportunities to audit firms, and thus even if
such clients are risky, audit firms might be reluctant to resign from the engagements. To see if the
relation between auditor resignation and real operating decisions differs across client’s size, we
conduct an additional analysis. We partition our sample into big and small clients based on the
median value of the client size in our sample. Untabulated results show that our results are largely
driven by auditor changes from small clients.
Association between RAM and Litigations against Auditors
To corroborate our main analyses and provide evidence that RAM exposes auditors to an
increased litigation risk, we examine the association between clients’ abnormal operating
decisions and the incidence of auditor litigations. We obtain a sample of litigations against
auditors from the Audit Analytics Litigation database between 2000 and 2010. Several recent
studies (e.g., Arena and Julio 2011; Crane 2011; Hackenbrack et al. 2011; DeFond et al. 2012)
20 Cohen et al. (2008) also find that the results for non-manufacturing firms are consistent with those for manufacturing firms.

preprint
accepted manuscript
28
also rely on the Audit Analytics Litigation database to identify auditor litigations. The Audit
Analytics Litigation database includes legal cases against auditors as well as other parties. We
carefully screen legal cases against auditors by examining auditors in the legal exposure periods.
We merge the sample with the COMPUSTAT and CRSP and restrict sample observations to
those having the necessary data to calculate variables for RAM, abnormal accruals, and other
variables to be included in the logit model. If there are multiple auditor litigations for a client, we
retain only the first litigation in the sample. Because auditor litigation is a rare event, we do not
limit this analysis to the clients with auditor changes. Our final sample consists of 174 auditor
litigations. We construct the control sample based on the fiscal year and four-digit SIC industry
code. We identify 6,003 control firm years not subject to auditor litigation.
By incorporating RAM proxies and abnormal accruals after controlling for variables in
Shu’s (2000) model, we estimate the following logistic regression model:
Pr(LIT = 1) = F(α0 + α1 RAM_PROXY + α2 AB_ACC + α3 SIZE + α4 INV + α5 REC + α6 ROA + α7 CURRENT RATIO + α8 LEVERAGE + α9 GROWTH + α10 RETURN + α11 STOCK VOLATILITY + α12 BETA + α13 TURNOVER + α14 DELIST + α15 TECH + α16 OPINION) (7) where LIT = an indicator variable that takes the value of one if the client’s auditor is named in a lawsuit, and zero otherwise. Other variables are defined in Appendix A.21 If aggressive RAM is positively associated with auditor litigation risk, the coefficients on
AB_CFO and AB_EXP (AB_PROD) will be negative (positive). If RAM and auditor litigation risk
are positively associated, the coefficient on AB_COMBINED, which increases in aggressive RAM,
will be positive. Table 10 presents the results of the logistic regression model.
[Insert Table 10 here.]
As predicted, the coefficients on AB_CFO and AB_EXP are negative and significant at 21 All variables are measured in the year associated with litigation. To reduce the effect of outliers, all continuous variables are winsorized at the top and bottom 1% of the distribution.

preprint
accepted manuscript
29
conventional levels. The combined proxy, AB_COMBINED, shows a positive and significant
relation to the incidence of auditor litigation at the p<0.01 level. In contrast, the coefficient on
AB_PROD is insignificant. Coefficients on the control variables are in the predicted directions,
and their magnitudes are comparable to those in Shu (2000). In sum, these results are consistent
with clients’ aggressive abnormal operating decisions, except those for overproduction, being
positively associated with auditor litigation risk. This evidence suggests that aggressive RAM
may lead to increased legal exposure for auditors.
VI. SUMMARY AND CONCLUSION
It is well known that auditors have become more conservative in their clients' portfolio
management in the post-SOX era. Extant literature reports that RAM is an alternative tool of earnings
management (e.g., Roychowdhury 2006; Cohen et al. 2008; Cohen and Zarowin 2010) and that
managers tend to trade off RAM and accrual-based management as substitutes, a phenomenon that is
more prevalent in post-SOX periods (e.g., Cohen et al. 2008). In this study, we examine the relation
between the auditor’s client retention decision and RAM. We predict that auditors are more likely to
resign when clients engage in RAM aggressively prior to auditor switches.
Consistent with our prediction, we find that, with the exception of RAM through
overproduction, clients’ opportunistic operating decisions are positively associated with the
likelihood of auditor resignations. Our results are robust to three sets of control samples: client-
initiated auditor changes, all continuing audit clients, and performance-matched continuing audit
clients. We also find that clients with auditor resignations tend to engage in RAM, except for
RAM through overproduction, more aggressively to meet or beat their earnings benchmarks
prior to auditor changes compared to those with auditor dismissals or continuing audits. In

preprint
accepted manuscript
30
addition, we find that, except for overproduction, auditors are especially sensitive to clients’
RAM to just meet or beat earnings benchmarks in their clients' retention decisions.
Additional analysis shows that clients whose auditors resign from the engagement tend to
hire non-Big 4 auditors as successor auditors and that these clients engage in RAM more actively
than other clients whose incoming auditors are Big 4. We further find that the association between
RAM and the likelihood of auditor resignation is particularly pronounced for small clients and
during the post-SOX period. Finally, we find that client’s RAM, specifically abnormal cash flows
and abnormal discretionary expenses, is significantly associated with litigations against auditors.
Our findings should be of interest to auditors, investors, clients’ audit committees, and
regulators. Disclosure about auditor resignations may reveal useful information about clients’
financial-reporting practices. Since auditor resignations potentially signal risk arising from clients’
opportunistic financial reporting behavior, investors can make more informed decisions when they
understand the linkage between RAM and auditor resignations. Our study also has an implication
for clients’ audit committees, because these committees can help avoid potential negative
consequences associated with RAM and auditor resignations by overseeing management reporting
practices. Further, our study has an implication for regulators, because they are concerned about
auditor changes that are triggered by management opportunism (see Securities and Exchange
Commission, 1988).

preprint
accepted manuscript
31
REFERENCES
Ai, C. and E. C. Norton. 2003. Interaction terms in logit and probit models. Economic Letters 80: 123-129.
American Institute of Certified Public Accountants (AICPA). 2002. Consideration of Fraud in a Financial Statement Audit. Statement on Auditing Standards No. 99. New York, NY: AICPA.
American Institute of Certified Public Accountants (AICPA). 2007. A Firm’s System of Quality Control. Statements on Quality Control Standards No. 7 (QC sec. 10). New York, NY: AICPA.
Arena, M., and B. Julio. 2011. Litigation risk, cash holdings, and corporate investment. Working paper, Marquette University and London Business School.
Arthur Andersen & Co., Coopers & Lybrand, Deloitte & Touche, Ernst & Young, KPMG Peat Marwick, & Price Waterhouse. 1992. The Liability Crises in the United States: Impact on the Accounting Profession.
Ashbaugh-Skaife, H., D. Collins, W. Kinney, and R. LaFond. 2008. The effect of SOX internal control deficiencies and their remediation on accrual quality. The Accounting Review 83 (1): 217-50.
Baber, W., P. Fairfield, and J. Haggard. 1991. The effect of concern about reported income on discretionary spending decisions: the case of research and development. The Accounting Review 66: 818–829.
__________., K. Kumar, and T. Verghese. 1995. Client security price reactions to the Laventhol and Horwath bankruptcy. Journal of Accounting Research 33 (Autumn): 385-95.
Beneish, M. D., P. E. Hopkins, I. P. Jansen, and R. Martin. 2005. Do auditor resignations reduce uncertainty about the quality of firms’ financial reporting? Journal of Accounting and Public Policy 5: 357-390.
Bens, D., V. Nagar, and M. Wong. 2002. Real investment implications of employee stock option exercises. Journal of Accounting Research 40: 359–393.
Bockus, K., and F. Gigler. 1998. A theory of auditor resignation. Journal of Accounting Research 36:191-208.
Bushee, B. 1998. The influence of institutional investors on myopic R&D investment behavior. The Accounting Review 73: 305–333.
Cohen, D., A. Dey, and T. Lys. 2008. Real and accrual-based earnings management in the pre- and post-Sarbanes-Oxley periods. The Accounting Review 83: 757–787.
_________., and P. Zarowin. 2010. Accrual-based and real earnings management activities around seasoned equity offerings. Journal of Accounting and Economics 50: 2-19.
Crane, A. D. 2011. The litigation environment of a firm and its impact on financial policy. Working paper, Rice University.
Dechow, P., and R. Sloan. 1991. Executive incentives and the horizon problem: an empirical investigation. Journal of Accounting and Economics 14: 51–89.
DeFond, M. L., C. Y. Lim, and Y. Zhang. 2012. Do auditors value client conservatism? Working paper, University of Southern California and Singapore Management University.
_________., and K. Subramanyam. 1998. Auditor changes and discretionary accruals. Journal of Accounting & Economics 25 (February): 35–67.
Ewert, R., and A. Wagenhofer. 2005. Economic effect of tightening accounting standards to restrict earnings management. The Accounting Review 80: 1101-1124.
Francis, B., I. Hasan, and L. Li. 2011. Firms’ real earnings management and subsequent stock price crash risk. Working Paper. Rensselaer Polytechnic Institute.
Government Accountability Office (GAO). 2006. Sarbanes-Oxley Act: Consideration of key principles needed in addressing implementation for smaller public companies. (GAO-06-361).

preprint
accepted manuscript
32
Graham, J., C. Harvey, and S. Rajgopal. 2005. The economics implications of corporate financial reporting. Journal of Accounting and Economics 40: 3-73.
Gunny K. 2010. The relation between earnings management using real activities manipulation and future performance: Evidence from meeting earnings benchmarks. Contemporary Accounting Research 27(3): 855-888.
Hackenbrack, K., N. T. Jenkins, and M. Pevzner. 2011. Relevant but delayed information in negotiated audit fees. Working paper, Vanderbilt University and George Mason University.
Healy, P, and J. Wahlen. 1999. A review of the earnings management literature and its implications for standard setting. Accounting Horizons 13: 365–383.
Heninger, W. 2001. The association between auditor litigation and abnormal accruals. The Accounting Review 76: 111-126.
Johnson, V. E., I. K. Khurana, and J.K. Reynolds. 2002. Audit-firm tenure and the quality of financial reports. Contemporary Accounting Research 19 (4): 637-660.
Johnstone, K. M., and J. Bedard. 2004. Audit firm portfolio management decisions. Journal of Accounting Research 42 (4): 659-690.
Jones, J. 1991. Earnings management during import relief investigations. Journal of Accounting Research 29: 193–228.
Kim, Y., M. Park, and B. Wier. 2012. Is earnings quality associated with corporate social responsibility?. The Accounting Review 87 (3): 761-796.
Koonce, L. 1992. Explanation and counterexplanation during audit analytical review. The Accounting Review 67: 59-76.
Kothari, S., A. Leone, and C. Wasley. 2005. Performance matched abnormal accrual measures. Journal of Accounting & Economic 39 (February): 163–197.
Krishnan J., and J. Krishnan. 1997. Litigation risk and auditor resignations. The Accounting Review 72: 539-560.
_________. and Y. Zhang. 2005. Auditor litigation risk and corporate disclosure of quarterly review report. Auditing: A Journal of Theory & Practice 24 (Supplement): 115-138.
Leggett, D., L. Parsons, and A. Reitenga. 2009. Real earnings management and subsequent operating performance. Working paper. University of Alabama.
Mansi, S., W. Maxwell, and D. Miller. 2004. Does auditor quality and tenure matter to investors? Evidence from the bond market. Journal of Accounting Research 42 (4): 755-793.
Menon, K., and D. Williams. 1994. The insurance hypothesis and market prices. The Accounting Review (April): 327-42.
Mizik, N. 2010. The theory and practice of myopic management. Journal of Marketing Research 47: 594-611.
_________. and R. Jacobson. 2008. Earnings inflation through accruals and real activity manipulation: Its prevalence at the time of an SEO and the financial market consequences. Working Paper, Columbia University and University of Washington.
Norton, E. C., H. Wang, and C. Ai. 2004. Computing interaction effects and standard errors in logit and probit models. The Stata Journal 4: 154-167.
Ohlson, J. 1980. Financial ratios and the probabilistic prediction of bankruptcy. Journal of Accounting Research 18 (1): 109-31.
O’Malley, S. F. 1993. Legal liability is having a chilling effect on the auditor’s role. Accounting Horizons 7: 82–87.
Palmrose, Z., and S. Scholz. 2004. The circumstances and legal consequences of Non-GAAP reporting: Evidence from restatements. Contemporary Accounting Research 21 (Spring): 139-80.

preprint
accepted manuscript
33
Powers, E. A. 2005. Interpreting logit regressions with interaction terms: an application to the management turnover literature. Journal of Corporate Finance 11: 504-522.
Public Company Accounting Oversight Board (PCAOB). 2002. Consideration of Fraud in a Financial Statement Audit. AU Section 316. Washington D.C.: PCAOB.
_______________________________________________. 2002. Analytical Procedures. AU Section 329. Washington D.C.: PCAOB.
Roychowdhury, S. 2006. Earnings management through real activities manipulation. Journal of Accounting and Economics 42: 335-370.
Securities and Exchange Commission, 1988. Financial Reporting Release No. 31, Washington D.C.
Sohn, B. 2011. Do Auditors care about real earnings management in their audit fee decisions? Working Paper. City University of Hong Kong.
Stice, J. 1991. Using financial and market information to identify pre-engagement factors associated with lawsuits against auditors. The Accounting Review 66: 516-553.
Shu, S. 2000. Auditor resignations: Clientele effects and legal liability. Journal of Accounting and Economics 29: 173-205.
Simunic, D. 1980. The pricing of audit services: Theory and evidence. Journal of Accounting Research 18: 161–90.
Thomas, J., and H. Zhang. 2002. Inventory changes and future returns. Review of Accounting Studies 7: 163–187.
Willenborg, M. 1999. Empirical analysis of the economic demand for auditing in the initial public offerings market. Journal of Accounting Research 37: 225-238.
Wright, A., and R. Ashton. 1989. Identifying audit adjustments with attention-directing procedures. The Accounting Review 64 (October): 710-719.
Zang, A. 2012. Evidence on the trade-off between real activities manipulation and accrual-based earnings management. The Accounting Review 87 (2): 675-705.

preprint
accepted manuscript
34
APPENDIX A Variable Definitions
Variable Definition <Dependent Variables> RESIGN LIT
An indicator variable that takes the value of one if the auditor resigned, and zero otherwise An indicator variable that takes the value of one if the client’s auditor is named in a lawsuit, and zero otherwise
<Variable of Interests> RAM_PROXY
Proxies for real activities manipulation: either performance-adjusted abnormal cash flows from operations (AB_CFO), performance-adjusted abnormal production costs (AB_PROD), and performance-adjusted abnormal discretionary expenses (AB_EXP), or a combined measure of real activities manipulation (AB_COMBINED). We first estimate abnormal cash flows from operations, abnormal production costs, and abnormal discretionary expenses for each firm based on equations (1)-(5) for the fiscal year ending prior to the auditor change. We then match each sample firm with all control firms from the same two-digit SIC industry, with ROA (net income before extraordinary items divided by total assets) in the fiscal year greater than 50% but less than 150% of the sample firms’ ROA. Performance-adjusted RAM proxies are RAM proxies for each sample firm minus the mean of corresponding measures for the matched control firms.
<Other Independent variables> AUDITOR_LIT
A proxy for auditor litigation risk measured at the fiscal year-end before the auditor change, and estimated based on Shu’s (2000) model
AB_ACC Performance-matched abnormal accruals. We first estimate abnormal accruals based on the cross-sectional Jones model (1991). We then match each sample firm with control firms from the same two-digit SIC industry, with ROA (net income before extraordinary items divided by total assets) in the fiscal year greater than 50% and less than 150% of the sample firms’ ROA. Performance-adjusted abnormal accruals are abnormal accruals for each sample firm minus the mean of abnormal accruals for the matched control firms.
ICD
An indicator variable that takes the value of one if the client reports either ineffective internal controls, a material weakness, or a significant deficiency during the one-year period prior to the auditor change, and zero otherwise
OP_GC
An indicator variable that takes the value of one if a going concern opinion is issued in either of the two years preceding the auditor change, and zero otherwise
LONG_TENURE
An indicator variable that takes the value of one if the predecessor auditor audited the client for nine or more years, and zero otherwise,
NON_AUDFEE
Non-audit service fees as a percent of total fees paid to the auditor for the fiscal year ending prior to the auditor change
AUDFEE
Audit service fees as a percentage of total assets for the fiscal year ending prior to the auditor change
BIG4 An indicator variable that takes the value of one if the outgoing auditor is one of the big 4 auditors, and zero otherwise
LOSS
An indicator variable that takes the value of one if net income is less than zero in the year preceding the auditor change, and zero otherwise
ROA
Return on assets in the year preceding the auditor change, measured as net income before extraordinary items divided by total assets
ΔSALES Changes in sales from the prior period scaled by lagged total assets DISTRESS Probability of bankruptcy based on Ohlson (1980) F_PERF Proxy for expected future performance, measured as [Income before extraordinary items
(t+1) - Income before extraordinary items (t)] / Total assets (t)

preprint
accepted manuscript
35
LEVERAGE Ratio of debt to total assets in the year preceding the auditor change GROWTH Percentage increase in sales of the client in the year preceding the auditor change from
the prior year SIZE Natural logarithm of total assets of the client in the year preceding the auditor change MSHARE Predecessor auditor’s industry market share based on audit clients’ sales revenue BUSY_FYE
An indicator variable that takes the value of one if the client’s fiscal year end is in December, January, February, or March, and zero otherwise
INV Inventory divided by lagged total assets REC Receivables divided by lagged total assets CURRENT RATIO The ratio of current assets to current liability RETURN The compounded stock return over the year STOCK VOLATILITY The standard deviation of daily stock returns over the year BETA
The slope coefficient of a regression of daily stock returns on equally weighted market returns over the year
TURNOVER
The proportion of shares that were traded at least once during the year, computed as [1- Π t (1 - volume traded Day t / total shares Day t)]
DELIST
An indicator variable that takes the value of one if the company is delisted because of financial difficulties within the next year, and 0 otherwise
TECH
An indicator variable that takes the value of one if the company’s SIC industry code is in the 2830s, 3570s, 7370s, 8730s, and between 3825 and 3839, and 0 otherwise
OPINION
An indicator variable that takes the value of one if the company received a qualified opinion in the previous year, and 0 otherwise

preprint
accepted manuscript
36
TABLE 1 Sample Description
Panel A: Distribution of Auditor Changes by Industry Auditor Resignations Auditor Dismissals Continuing clients Industry Two-digit Code # of obs % of sample # of obs % of sample # of obs % of sample Metal Mining, Ores 10 7 1.19% 12 0.75% 362 1.14% Oil & Gas 13 13 2.21% 60 3.75% 1,462 4.59% Heavy construction, Except building 16 4 0.68% 5 0.31% 138 0.43% Food, Beverage 20 14 2.38% 37 2.31% 987 3.10% Apparel & Other Textile Products 23 7 1.19% 18 1.13% 368 1.15% Furniture & Fixtures 25 7 1.19% 5 0.31% 239 0.75% Paper & Allied Products 26 2 0.34% 11 0.69% 423 1.33% Printing & Publishing 27 6 1.02% 26 1.63% 433 1.36% Chemicals & Allied Products 28 49 8.32% 101 6.31% 2,616 8.20% Rubber 30 6 1.02% 22 1.38% 373 1.17% Primary Metal Industries 33 5 0.85% 28 1.75% 591 1.85% Fabricated Metal Products 34 12 2.04% 31 1.94% 522 1.64% Industrial Machinery & Computer Equipment 35 57 9.68% 114 7.13% 2,605 8.17% Electronic & Other Electric Equipment 36 92 15.62% 208 13.00% 3,842 12.05% Transportation Equipment 37 11 1.87% 42 2.63% 757 2.37% Instruments & Related Products 38 36 6.11% 159 9.94% 2,787 8.74% Miscellaneous Manufacturing 39 13 2.21% 28 1.75% 362 1.14% Wholesale--Durable Goods 50 22 3.74% 54 3.38% 918 2.88% Wholesale--Non-durable Goods 51 8 1.36% 34 2.13% 515 1.62% General Merchandise Store 53 3 0.51% 6 0.38% 238 0.75% Food Stores 54 2 0.34% 7 0.44% 193 0.61% Apparel & Accessory Stores 56 6 1.02% 13 0.81% 416 1.30% Eating & Drinking 58 6 1.02% 29 1.81% 599 1.88% Miscellaneous Retail 59 11 1.87% 41 2.56% 816 2.56% Business Services 73 119 20.20% 296 18.50% 4,929 15.46% Amusements & Recreation Services 79 4 0.68% 21 1.31% 311 0.98% Health Services 80 17 2.89% 31 1.94% 545 1.71% Engineering & Management Services 87 16 2.72% 32 2.00% 770 2.42% Other 34 5.77% 129 8.06% 2,767 8.68% Total 589 100.00% 1,600 100.00% 31,884 100.00%

preprint
accepted manuscript
37
TABLE 1: continued
Panel B: Distribution of Auditor Changes by Year
Auditor Resignation Auditor Dismissal Total Resignation Rate
Year #of obs Percent #of obs Percent #of obs Percent Percent
2000 46 7.81% 146 9.13% 192 8.77% 23.96% 2001 42 7.13% 169 10.56% 211 9.64% 19.91% 2002 30 5.09% 131 8.19% 161 7.35% 18.63% 2003 50 8.49% 193 12.06% 243 11.10% 20.58% 2004 92 15.62% 201 12.56% 293 13.39% 31.40% 2005 87 14.77% 170 10.63% 257 11.74% 33.85% 2006 55 9.34% 126 7.88% 181 8.27% 30.39% 2007 55 9.34% 128 8.00% 183 8.36% 30.05% 2008 28 4.75% 131 8.19% 159 7.26% 17.61% 2009 41 6.96% 119 7.44% 160 7.31% 25.63% 2010 63 10.70% 86 5.38% 149 6.81% 42.28% Total 589 100.00% 1,600 100.00% 2,189 100.00% 26.91%
In Panel B, resignation rate represents the proportion of the number of auditor resignations out of total number of auditor changes.

preprint
accepted manuscript
38
TABLE 2 Descriptive Statistics of Selected Variables
Panel A: Descriptive Statistics by Auditor Change and Continuing Audits
Difference tests: p-value Auditor Resignation Auditor Dismissal Continuing Audit Resig vs Diss Resig vs Continuing
Variable Mean Median Mean Median Mean Median t-test Wilcoxon
test t-test Wilcoxon
test N 589 1,600 31,884
Variables of Interests: AB_CFO -0.0996 -0.0175 -0.0180 0.0083 0.0082 0.0119 0.0155 0.0013 <.0001 <.0001 AB_PROD -0.0113 -0.0334 -0.0019 -0.0129 -0.0267 -0.0298 0.6341 0.3443 0.5516 0.8695 AB_EXP -0.2150 -0.0699 0.2023 -0.0217 0.1035 -0.0214 0.0002 0.0105 <.0001 0.0038 AB_COMBINED 0.3033 0.1006 -0.1862 0.0108 -0.1385 -0.0163 <.0001 0.0104 <.0001 0.0003 Other Audit Risk Control Variables AUDITOR_LIT -5.6836 -6.0258 -6.0677 -6.1505 -5.7739 -5.7433 <.0001 0.0018 0.0518 0.0089 AB_ACC -0.0377 -0.0211 -0.0644 -0.0268 -0.0052 -0.0270 0.5112 0.3356 0.1770 0.3742 ICD 0.3141 0.0000 0.2181 0.0000 0.1389 0.0000 <.0001 <.0001 <.0001 <.0001 OP_GC 0.1868 0.0000 0.0788 0.0000 0.0337 0.0000 <.0001 <.0001 <.0001 <.0001 LONG_TENURE 0.1087 0.0000 0.2313 0.0000 0.3101 0.0000 <.0001 <.0001 <.0001 <.0001 NON_AUDFEE 0.1532 0.0906 0.1834 0.1268 0.2193 0.1663 0.0012 0.0025 <.0001 <.0001 AUDFEE 0.0062 0.0035 0.0051 0.0027 0.0030 0.0015 0.0070 0.0003 <.0001 <.0001 BIG4 0.5314 1.0000 0.7150 1.0000 0.7927 1.0000 <.0001 <.0001 <.0001 <.0001 Financial Performance Control Variables LOSS 0.6333 1.0000 0.4981 0.0000 0.3376 0.0000 <.0001 <.0001 <.0001 <.0001 ROA -0.2801 -0.0786 -0.1263 0.0027 -0.0366 0.0347 <.0001 <.0001 <.0001 <.0001 ΔSALES 0.0548 0.0269 0.0826 0.0474 0.1039 0.0694 0.2289 0.0408 0.0237 <.0001 DISTRESS 0.2974 0.0624 0.1690 0.0246 0.0924 0.0084 <.0001 <.0001 <.0001 <.0001 F_PERF -0.1758 -0.0186 -0.0614 0.0057 -0.1127 0.0009 <.0001 <.0001 <.0001 0.0058 Other Control Variables LEVERAGE 0.2299 0.1374 0.2102 0.1483 0.1919 0.1424 0.1582 0.8877 <.0001 0.2532 GROWTH 0.1426 0.0325 0.1514 0.0563 0.1683 0.0808 0.7939 0.0948 0.6355 <.0001 SIZE 4.0314 3.9886 4.6538 4.5060 5.8701 5.7731 <.0001 <.0001 <.0001 <.0001 MSHARE 0.1292 0.0829 0.1738 0.1673 0.1990 0.1983 <.0001 <.0001 <.0001 <.0001 BUSY_FYE 0.1375 0.0000 0.1175 0.0000 0.1242 0.0000 0.2059 0.2059 0.3748 0.3748

preprint
accepted manuscript
39
TABLE 2: continued
Panel B: Correlation among Selected Variables Variable 1) 2) 3) 4) 5) 6) 7) 8) 9) 10) 11) 1) RESIGN 1.0000 2) AB_CFO -0.0517b 1.0000 3) AB_PROD -0.0355 -0.1847a 1.0000 4) AB_EXP -0.0788a -0.1699a -0.0556a 1.0000 5) AB_COMBINED 0.0852a -0.1568a 0.2832a -0.9317a 1.0000 6) AUDITOR_LIT 0.0989a 0.0792a -0.0605a -0.0273 -0.0028 1.0000 7) AB_ACC 0.0141 -0.0608a 0.0040 -0.0199 0.0376c -0.0229 1.0000 8) ICD 0.0991a -0.0008 0.0094 -0.0201 0.0214 0.0943a -0.0292 1.0000 9) OP_GC 0.1544a 0.0105 -0.0532b -0.0513b 0.0374c 0.2789a 0.0137 0.0701a 1.0000 10) LONG_TENURE -0.1364a -0.0078 0.0290 -0.0108 0.0178 -0.0697a 0.0146 0.0030 -0.0620a 1.0000 11) NON_AUDFEE -0.0690a 0.0591a 0.0206 0.0490b -0.0611a 0.0187 -0.0126 -0.0473b -0.0303 0.0359c 1.0000 12) AUDFEE 0.0576a -0.0309 -0.0920a 0.0080 -0.0150 0.1335a 0.0298 0.1869a 0.2537a -0.0384c -0.0282 13) BIG4 -0.1726a 0.0200 -0.0256 0.0397c -0.0489b 0.0514b 0.0055 -0.0573a -0.0939a 0.2821a 0.1157a 14) LOSS 0.1202a 0.0290 -0.0574a 0.0008 -0.0193 0.2347a -0.0684b 0.0311 0.2683a -0.0849a -0.0935a 15) ROA -0.1362a -0.0803a 0.1079a 0.0369c 0.0064 -0.5835a 0.0075 -0.0017 -0.4245a 0.0700a 0.0264 16) ΔSALES -0.0257 0.1111a -0.0355c 0.0291 -0.0667a 0.1356a -0.0012 0.0489b -0.1157a -0.0455b -0.0120 17) DISTRESS 0.1769a 0.0606a -0.0732 -0.0471b 0.0153 0.4408a -0.0422b -0.0208 0.4860a -0.1201a -0.0640a 18) F_PERF -0.1176a 0.0437b 0.0353 0.0026 -0.0089 -0.1421a -0.0614a 0.0358c -0.1138a 0.0514b 0.1260a 19) LEVERAGE 0.0302 -0.0004 -0.0005 -0.0143 0.0139 0.4459a 0.0480b -0.0167 0.2052a -0.0475b 0.0100 20) GROWTH -0.0056 0.0941a -0.0278 -0.0045 -0.0278 0.2266a -0.0516b 0.0475b -0.0054 -0.0682a 0.0207 21) SIZE -0.1558a 0.0201 0.0716a 0.0076 -0.0006 0.1750a -0.0205 0.1011a -0.2456a 0.1814a 0.1250a 22) MSHARE -0.1301a 0.0317 -0.0052 0.0385c -0.0474b 0.0467b -0.0071 0.0005 -0.0672a 0.2265a 0.1332a 23) BUSY_FYE 0.0270 -0.0382c 0.0104 0.0101 0.0031 -0.0084 0.0458b 0.0531b -0.0045 0.0372c -0.0403c

preprint
accepted manuscript
40
TABLE 2: continued
Panel B: continued 12) 13) 14) 15) 16) 17) 18) 19) 20) 21) 22) 23) 12) AUDFEE 1.0000 13) BIG4 -0.0777a 1.0000 14) LOSS 0.2078a -0.0286 1.0000 15) ROA -0.3698a 0.0562a -0.4471a 1.0000 16) ΔSALES -0.1749a -0.0268 -0.1810a 0.1570a 1.0000 17) DISTRESS 0.3170a -0.1300a 0.5319a -0.7494a -0.1494a 1.0000 18) F_PERF 0.0414c 0.0843a -0.0254 0.1087a 0.0276 -0.0653a 1.0000 19) LEVERAGE 0.0299 -0.0063 0.1203a -0.2696a 0.0285 0.2884a -0.0406c 1.0000 20) GROWTH -0.0413c -0.0132 -0.0431b -0.0025 0.5488a -0.0123 -0.0318 0.0290 1.0000 21) SIZE -0.3924a 0.3254a -0.2992a 0.3507a 0.1196a -0.4351a 0.0668a 0.0547b 0.0535b 1.0000 22) MSHARE -0.0799a 0.6681a -0.0662a 0.0967a 0.0138 -0.1419a 0.0674a -0.0037 -0.0246 0.3431a 1.0000 23) BUSY_FYE -0.0028 -0.0119 -0.0301 0.0254 0.0542b -0.0161 0.0155 0.0206 0.0017 -0.0197 0.0057 1.0000
Variables are defined in Appendix A. In Panel A, significance of differences in means and medians are evaluated based on the t-test and Wilcoxon signed rank test, respectively (p-values for the t-statistic and Z-statistic are two-tailed). In Panel B, correlations are based on 2,189 observations (including both resignation and dismissal sample). a ,b, and c denote significance at the p<0.01, p<0.05, and p<0.10 levels, respectively based on two-tailed tests.

preprint
accepted manuscript
41
TABLE 3 Logistic Regression of Auditor Resignation (N=2,189)
Model 1 Model 2 Model 3 Model 4
Variable Pred. sign Coeff. Z-stat Coeff. Z-stat Coeff. Z-stat Coeff. Z-stat Intercept 0.6119 1.01 0.6258 1.05 0.6023 1.00 0.5950 0.99 Variables of Interests: AB_CFO - -0.2706 -3.37 *** AB_PROD + -0.1125 -0.97 AB_EXP - -0.0631 -2.53 ** AB_COMBINED + 0.0744 3.14 *** Audit Risk Control Variables: AUDITOR_LIT + 0.1332 2.45 ** 0.1296 2.42 ** 0.1267 2.35 ** 0.1271 2.34 ** AB_ACC + 0.0239 0.37 0.0370 0.59 0.0326 0.52 0.0289 0.46 ICD + 0.6027 4.81 *** 0.6030 4.82 *** 0.5982 4.74 *** 0.5967 4.73 *** OP_GC + 0.4472 2.58 ** 0.4413 2.56 ** 0.4281 2.49 ** 0.4277 2.49 ** LONG_TENURE - -0.6045 -3.76 *** -0.5948 -3.70 *** -0.6088 -3.76 *** -0.6144 -3.79 *** NON_AUDFEE - -0.2461 -0.89 -0.2795 -1.02 -0.2522 -0.92 -0.2411 -0.88 AUDFEE - -0.0165 -2.34 ** -0.0159 -2.25 ** -0.0149 -2.07 ** -0.0148 -2.06 ** BIG4 ? -0.4334 -2.89 *** -0.4369 -2.92 *** -0.4257 -2.86 *** -0.4218 -2.83 *** Financial Performance Control Variables LOSS + 0.1650 1.25 0.1632 1.24 0.1733 1.31 0.1754 1.33 ROA - 0.1915 1.00 0.2461 1.37 0.2385 1.30 0.2201 1.17 ΔSALES - -0.0225 -0.19 -0.0664 -0.56 -0.0393 -0.33 -0.0217 -0.18 DISTRESS + 0.5046 1.95 * 0.4864 1.90 * 0.4648 1.80 * 0.4653 1.79 * F_PERF - -0.3455 -2.86 *** -0.3523 -2.96 *** -0.3630 -3.01 *** -0.3636 -2.99 *** Other Control Variables LEVERAGE + -0.3190 -1.75 * -0.2571 -1.43 -0.2483 -1.37 -0.2645 -1.45 GROWTH ? -0.0637 -0.67 -0.0681 -0.73 -0.0774 -0.83 -0.0777 -0.83 SIZE ? -0.1593 -3.45 *** -0.1601 -3.49 *** -0.1625 -3.55 *** -0.1630 -3.56 *** MSHARE + 0.0018 0.00 -0.0349 -0.07 -0.0070 -0.01 0.0100 0.02 BUSY_FYE + 0.1718 1.01 0.1936 1.16 0.1979 1.18 0.1929 1.15 INDUSTRY INDICATORS Included Included Included Included
Pseudo R2 (%) 15.70 15.06 15.51 15.76 The dependent variable is RESIGN, an indicator variable that takes the value of one if the auditor resigned, and zero otherwise. Other variables are defined in Appendix A. All statistics and significance levels are based on standard errors adjusted for firm clustering. *, **, *** indicate statistical significance at the p<0.10, p<0.05, and p<0.01 levels, respectively, based on two-tailed tests.

preprint
accepted manuscript
42
TABLE 4 Logistic Regression of Auditor Resignation using Control Sample of Continuing Audit Clients (N=32,473)
Model 1 Model 2 Model 3 Model 4
Variable Pred. sign Coeff. Z-stat Coeff. Z-stat Coeff. Z-stat Coeff. Z-stat Intercept -0.8989 -1.93 * -0.8078 -1.75 * -0.7531 -1.64 * -0.7663 -1.67 * Variables of Interests: AB_CFO - -0.1958 -2.43 ** AB_PROD + 0.0823 0.89 AB_EXP - -0.1047 -2.93 *** AB_COMBINED + 0.1271 3.69 *** Audit Risk Control Variables: AUDITOR_LIT + 0.1039 2.89 *** 0.1111 3.13 *** 0.1172 3.28 *** 0.1150 3.22 *** AB_ACC + 0.0252 0.46 0.0373 0.68 0.0346 0.63 0.0295 0.54 ICD + 1.0589 10.31 *** 1.0536 10.27 *** 1.0472 10.20 *** 1.0446 10.16 *** OP_GC + 0.6553 4.78 *** 0.6519 4.77 *** 0.6488 4.76 *** 0.6403 4.67 *** LONG_TENURE - -0.5891 -4.04 *** -0.5850 -4.01 *** -0.5794 -3.97 *** -0.5812 -3.98 *** NON_AUDFEE - -0.8950 -3.52 *** -0.8842 -3.50 *** -0.8453 -3.36 *** -0.8465 -3.36 *** AUDFEE - -0.0272 -3.69 *** -0.0259 -3.60 *** -0.0250 -3.53 *** -0.0250 -3.49 *** BIG4 ? -0.0959 -0.54 -0.1036 -0.58 -0.1035 -0.58 -0.0901 -0.51 Financial Performance Control Variables LOSS + 0.3446 3.03 *** 0.3368 2.97 *** 0.3455 3.05 *** 0.3491 3.09 *** ROA - 0.1242 0.95 0.1485 1.16 0.1628 1.28 0.1325 1.03 ΔSALES - 0.0376 0.62 0.0272 0.45 0.0427 0.73 0.0541 1.01 DISTRESS + 0.3336 1.71 * 0.3377 1.74 * 0.3134 1.61 0.2897 1.48 F_PERF - -0.1471 -1.64 -0.1475 -1.66 * -0.1499 -1.70 * -0.1471 -1.67 * Other Control Variables LEVERAGE + 0.1126 0.86 0.1080 0.84 0.1136 0.88 0.1199 0.92 GROWTH ? -0.0515 -3.69 *** -0.0544 -3.99 *** -0.0567 -4.19 *** -0.0557 -4.10 *** SIZE ? -0.5189 -12.46 *** -0.5259 -12.68 *** -0.5302 -12.97 *** -0.5319 -12.95 *** MSHARE + 0.4789 0.86 0.4859 0.87 0.4790 0.86 0.4840 0.87 BUSY_FYE + 0.1191 0.88 0.1173 0.86 0.1182 0.87 0.1113 0.82 INDUSTRY INDICATORS Included Included Included Included
Pseudo R2 (%) 16.37 16.25 16.59 16.77 The dependent variable is RESIGN, an indicator variable that takes the value of one if the auditor resigned, and zero otherwise. Other variables are defined in Appendix A. All statistics and significance levels are based on standard errors adjusted for firm clustering. *, **, *** indicate statistical significance at the p<0.10, p<0.05, and p<0.01 levels, respectively, based on two-tailed tests.

preprint
accepted manuscript
43
TABLE 5 Auditor Resignation using Matching Sample of Continuing Audit Clients
Panel A: Descriptive Statistics of RAM Proxies: Auditor Resignation versus Matching Sample of Continuing Audit Clients
Difference tests Auditor Resignation (N=589) Matching sample (N=589) t-test Wilcoxon test
Variable Mean Median Mean Median p-value p-value AB_CFO -0.0996 -0.0175 -0.0124 0.0206 0.0344 0.0053 AB_PROD -0.0113 -0.0334 -0.0540 -0.0455 0.1050 0.2247 AB_EXP -0.2150 -0.0699 0.1570 -0.0356 0.0297 0.2557 AB_COMBINED 0.3033 0.1006 -0.1986 0.0116 0.0040 0.0618
Panel B: Logistic Regressions of Auditor Resignation Using Matching Sample of Continuing Audit Clients (N=1,178)
Model 1 Model 2 Model 3 Model 4 Variable Pred. sign Coeff. Z-stat Coeff. Z-stat Coeff. Z-stat Coeff. Z-stat Intercept 4.6723 5.65 *** 4.7236 5.70 *** 4.5934 5.59 *** 4.5427 5.49 *** Variables of Interests: AB_CFO - -0.1892 -1.80 * AB_PROD + 0.2285 1.38 AB_EXP - -0.0550 -2.71 *** AB_COMBINED + 0.0680 3.26 *** Audit Risk Control Variables: Included Included Included Included Financial Performance Control Variables Included Included Included Included Other Control Variables Included Included Included Included
Pseudo R2 (%) 28.42 28.26 28.69 29.00 In Panels B, the dependent variable is RESIGN, an indicator variable that takes the value of one if the auditor resigned, and zero otherwise. Other variables are defined in Appendix A. In Panel B. all statistics and significance levels are based on standard errors adjusted for firm clustering. *, **, *** indicate statistical significance at the p<0.10, p<0.05, and p<0.01 levels, respectively, based on two-tailed tests.

preprint
accepted manuscript
44
TABLE 6 Association between RAM and Auditor Resignation of Suspect Clients
Panel A: Descriptive statistics of RAM proxies for Suspect Clients Difference tests: p-value Auditor Resignation Auditor Dismissal Continuing Audit Resig. vs Dismissal Resig. vs Continuing
Variable Mean Median Mean Median Mean Median t-test Wilcoxon
test t-test Wilcoxon
test < RAM to "Just" Avoid Reporting Losses>
N 11 49 1,161 AB_CFO 0.0778 -0.0368 0.0182 -0.0282 0.0298 0.0041 0.7122 0.8560 0.5087 0.3622 AB_PROD -0.0091 -0.0118 0.1587 0.0409 -0.0104 -0.0141 0.3641 0.6126 0.3881 0.2103 AB_EXP -0.0143 0.0448 0.3457 0.0420 0.2020 0.0068 0.5821 0.8410 0.2458 0.1690 AB_COMBINED -0.0726 0.0690 -0.2052 0.1054 -0.2422 -0.0441 0.8453 0.9012 0.1386 0.0348 <RAM to "Just" Meet or Beat Last Year's Net Income>
N 24 113 3,438 AB_CFO -0.1424 -0.0551 0.0301 0.0416 -0.0076 0.0030 0.0039 0.0028 0.0624 0.0168
AB_PROD 0.0040 0.0616 -0.0083 -0.0314 -0.0143 -0.0189 0.8631 0.0670 0.4533 0.1714
AB_EXP -0.3419 -0.0450 0.2381 0.0144 0.1347 -0.0148 0.0395 0.1561 0.0098 0.4387
AB_COMBINED 0.4884 0.1822 -0.2766 -0.1252 -0.1414 -0.0163 0.0083 0.0041 0.0069 0.0388
<RAM to "Just" Meet or Beat Analyst Forecasts by a Cent per Share> N 317 750 11,375
AB_CFO -0.0909 -0.0266 -0.0153 0.0041 -0.0094 0.0010 0.0617 0.0269 0.0220 0.0198
AB_PROD -0.0147 -0.0281 0.0040 -0.0163 -0.0282 -0.0256 0.5511 0.9374 0.9972 0.6579
AB_EXP -0.2834 -0.1324 0.2496 -0.0307 0.1462 -0.0165 0.0006 0.0017 <.0001 0.0038
AB_COMBINED 0.3596 0.1441 -0.2302 0.0122 -0.1650 -0.0081 0.0002 0.0015 <.0001 0.0005

preprint
accepted manuscript
45
TABLE 6: continued
Panel B: Logistic Regression of Auditor Resignation by Suspect Clients (N=2,189)
Model 1 Model 2 Model 3 Model 4
Variable Pred. sign Coeff. Z-stat Coeff. Z-stat Coeff. Z-stat Coeff. Z-stat
Intercept 0.3260 0.54 0.2878 0.48 0.3170 0.52 0.3327 0.55 Variables of Interests: AB_CFO - -0.1670 -2.25 ** AB_PROD + -0.0691 -0.56 AB_EXP - -0.0548 -2.09 ** AB_COMBINED + 0.0658 2.64 *** SUSPECT - 0.0007 0.00 0.0185 0.11 -0.0502 -0.30 -0.0577 -0.34 AB_CFO*SUSPECT - -0.9160 -1.97 ** AB_PROD*SUSPECT + -0.1545 -0.42 AB_EXP*SUSPECT - -0.2255 -2.65 *** AB_COMBINED*SUSPECT + 0.2233 2.56 ** Audit Risk Control Variables: Included Included Included Included Financial Performance Control Variables Included Included Included Included Other Control Variables Included Included Included Included
Pseudo R2 (%) 15.53 14.93 15.80 16.05
Combined Coefficient Tests: Com_coeff Chi-sq Com_coeff Chi-sq Com_coeff Chi-sq Com_coeff Chi-sq α1 +α3 = 0 -1.0830 5.56 ** -0.2236 0.42 -0.2803 12.28 *** 0.2891 12.12 *** Interaction effect: Int_eff Z-stat Int_eff Z-stat Int_eff Z-stat Int_eff Z-stat -0.1518 -1.89 ** -0.0274 -0.42 -0.0368 -2.30 ** 0.0361 2.23 **
In Panel A, in the upper section, firm-year observations where net income before extraordinary items scaled by total assets falls in the interval [0, 0.01) are identified as SUSPECT firm-years. In the middle section, firm-year observations where change in net income before extraordinary items scaled by total assets lies in the interval [0, 0.01) are identified as SUSPECT firm-years. In the lower section, firm-year observations where analyst forecast error, defined as actual earnings per share less the consensus forecast of earnings per share, is one cent per share or less are identified as SUSPECT firm-years. In panel B, the dependent variable is RESIGN, an indicator variable that takes the value of one if the auditor resigned, and zero otherwise. SUSPECT is an indicator variable that takes the value of one if the firm-year observation belongs to any suspect firm categories defined in Panel A, and zero otherwise. Other variables are defined in Appendix A. In Panel B, α1 is the coefficient on RAM_PROXY and α3 is the coefficient on RAM_PROXY*SUSPECT. All statistics and significance levels are based on standard errors adjusted for firm clustering. *, **, *** indicate statistical significance at the p<0.10, p<0.05, and p<0.01 levels, respectively, based on two-tailed tests.

preprint
accepted manuscript
46
TABLE 7 Auditor Resignation by Type of Incoming Auditors (N=2,189)
Model 1 Model 2 Model 3 Model 4
Variable Pred. sign Coeff. Z-stat Coeff. Est. Z-stat Coeff. Z-stat Coeff. Z-stat
Intercept -0.8401 -1.31 -0.8679 -1.36 -0.8582 -1.34 -0.8487 -1.31 Variables of Interests: AB_CFO - -0.0531 -0.37 AB_PROD + -0.4098 -1.38 AB_EXP - 0.0167 0.21 AB_COMBINED + -0.0219 -0.32 IN_NON-BIG4 ? 1.0744 7.01 *** 1.1419 7.42 *** 1.1141 7.20 *** 1.0978 7.05 *** AB_CFO*IN_NON-BIG4 - -0.4397 -2.52 ** AB_PROD*IN_NON-BIG4 + 0.3328 1.04 AB_EXP*IN_NON-BIG4 - -0.1536 -1.85 * AB_COMBINED*IN_NON-BIG4 + 0.1835 2.53 ** Audit Risk Control Variables: Included Included Included Included Financial Performance Control Variables Included Included Included Included Other Control Variables Included Included Included Included
Pseudo R2 (%) 19.71 18.40 19.84 20.49
Combined Coefficient Tests: Com_coeff Chi-sq Com_coeff Chi-sq Com_coeff Chi-sq Com_coeff Chi-sq α1 +α3 = 0 -0.4928 24.27 *** -0.0770 0.37 -0.1369 32.04 *** 0.1616 39.50 *** Interaction effect: Int_eff Z-stat Int_eff Z-stat Int_eff Z-stat Int_eff Z-stat -0.0910 -3.12 *** 0.0323 0.68 -0.0290 -2.58 *** 0.0341 3.19 ***
The dependent variable is RESIGN, an indicator variable that takes the value of one if the auditor resigned, and zero otherwise. IN_NON-BIG4 is an indicator variable that takes the value of 1 if the incoming auditor is a non-Big 4 auditor, and 0 otherwise. Other variables are defined in Appendix A. α1 is the coefficient on RAM_PROXY and α3 is the coefficient on RAM_PROXY*IN_NON-BIG4. All statistics and significance levels are based on standard errors adjusted for firm clustering. *, **, *** indicate statistical significance at the p<0.10, p<0.05, and p<0.01 levels, respectively, based on two-tailed tests.

preprint
accepted manuscript
47
TABLE 8 Logistic Regression of Auditor Resignation: Pre- versus Post-Sarbanes-Oxley Act of 2002 (N=2,189)
Model 1 Model 2 Model 3 Model 4
Variable Pred. sign Coeff. Z-stat Coeff. Z-stat Coeff. Z-stat Coeff. Z-stat Intercept 0.5217 0.84 0.5699 0.91 0.5952 0.95 0.5672 0.90 Variables of Interests: AB_CFO - -0.0263 -0.16 AB_PROD + 0.6197 1.29 AB_EXP - -0.0084 -0.11 AB_COMBINED + 0.0308 0.48 POST ? 0.5936 3.47 *** 0.6054 3.55 *** 0.6332 3.70 *** 0.6117 3.55 *** AB_CFO*POST - -0.3521 -1.88 * AB_PROD*POST + -0.7984 -1.61 AB_EXP*POST - -0.2258 -2.84 *** AB_COMBINED*POST + 0.2079 2.98 *** Audit Risk Control Variables: Included Included Included Included Financial Performance Control Variables Included Included Included Included Other Control Variables Included Included Included Included
Pseudo R2 (%) 15.79 15.16 18.35 18.78
Combined Coefficient Tests: Com_coeff Chi-sq Com_coeff Chi-sq Com_coeff Chi-sq Com_coeff Chi-sq α1 + α3 = 0 -0.3784 15.41 *** -0.1787 2.05 -0.2342 64.70 *** 0.2387 64.98 *** Interaction effect: Int_eff Z-stat Int_eff Z-stat Int_eff Z-stat Int_eff Z-stat -0.0620 -2.17 ** -0.1124 -1.59 -0.0386 -3.02 *** 0.0362 3.13 ***
The dependent variable is RESIGN, an indicator variable that takes the value of one if the auditor resigned, and zero otherwise. POST is an indicator variable that takes the value of one if sample periods are year 2002 through 2010, and zero otherwise. Other variables are defined in Appendix A. α1 is the coefficient on RAM_PROXY and α3 is the coefficient on RAM_PROXY*POST. All statistics and significance levels are based on standard errors adjusted for firm clustering. *, **, *** Indicate statistical significance at the p<0.10, p<0.05, and p<0.01 levels, respectively, based on two-tailed tests.
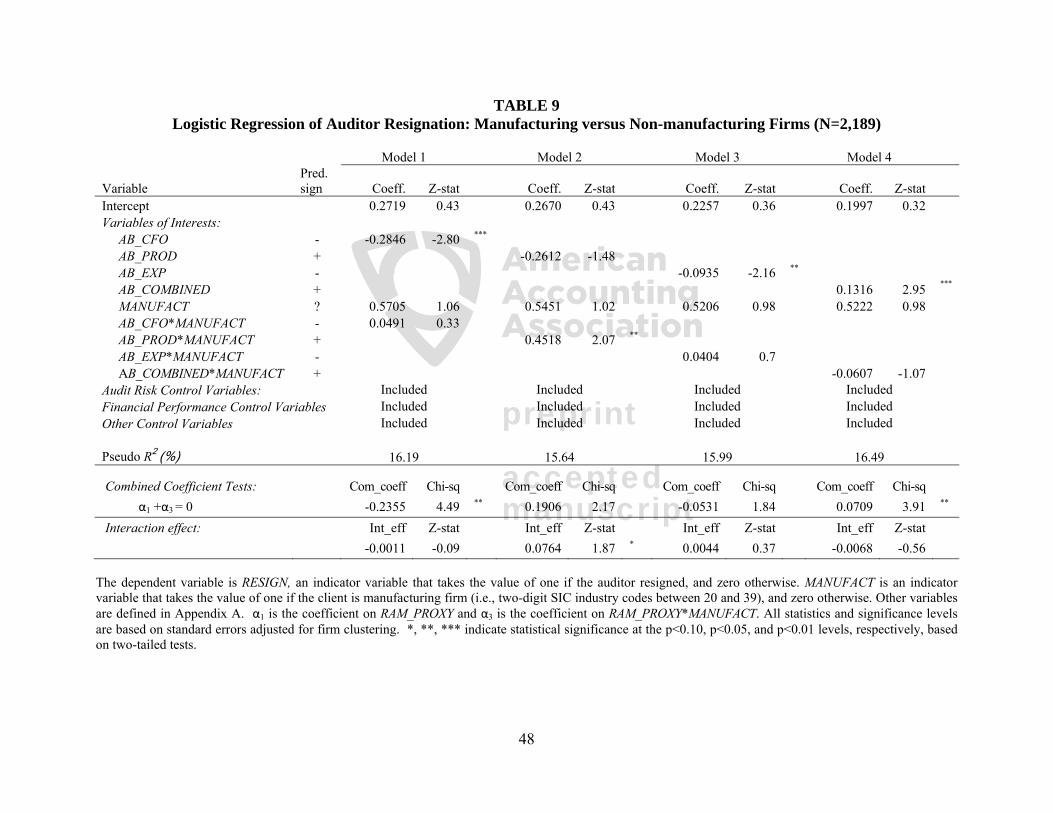
preprint
accepted manuscript
48
TABLE 9 Logistic Regression of Auditor Resignation: Manufacturing versus Non-manufacturing Firms (N=2,189)
Model 1 Model 2 Model 3 Model 4
Variable Pred. sign Coeff. Z-stat Coeff. Z-stat Coeff. Z-stat Coeff. Z-stat
Intercept 0.2719 0.43 0.2670 0.43 0.2257 0.36 0.1997 0.32 Variables of Interests: AB_CFO - -0.2846 -2.80 *** AB_PROD + -0.2612 -1.48 AB_EXP - -0.0935 -2.16 ** AB_COMBINED + 0.1316 2.95 *** MANUFACT ? 0.5705 1.06 0.5451 1.02 0.5206 0.98 0.5222 0.98 AB_CFO*MANUFACT - 0.0491 0.33 AB_PROD*MANUFACT + 0.4518 2.07 ** AB_EXP*MANUFACT - 0.0404 0.7 AB_COMBINED*MANUFACT + -0.0607 -1.07 Audit Risk Control Variables: Included Included Included Included Financial Performance Control Variables Included Included Included Included Other Control Variables Included Included Included Included
Pseudo R2 (%) 16.19 15.64 15.99 16.49
Combined Coefficient Tests: Com_coeff Chi-sq Com_coeff Chi-sq Com_coeff Chi-sq Com_coeff Chi-sq α1 +α3 = 0 -0.2355 4.49 ** 0.1906 2.17 -0.0531 1.84 0.0709 3.91 ** Interaction effect: Int_eff Z-stat Int_eff Z-stat Int_eff Z-stat Int_eff Z-stat -0.0011 -0.09 0.0764 1.87 * 0.0044 0.37 -0.0068 -0.56
The dependent variable is RESIGN, an indicator variable that takes the value of one if the auditor resigned, and zero otherwise. MANUFACT is an indicator variable that takes the value of one if the client is manufacturing firm (i.e., two-digit SIC industry codes between 20 and 39), and zero otherwise. Other variables are defined in Appendix A. α1 is the coefficient on RAM_PROXY and α3 is the coefficient on RAM_PROXY*MANUFACT. All statistics and significance levels are based on standard errors adjusted for firm clustering. *, **, *** indicate statistical significance at the p<0.10, p<0.05, and p<0.01 levels, respectively, based on two-tailed tests.

preprint
accepted manuscript
49
TABLE 10 Association between RAM and the Incidence of Litigations against Auditors (N=6,177)
Model 1 Model 2 Model 3 Model 4
Variable Pred. sign Coeff. Z-stat Coeff. Z-stat Coeff. Z-stat Coeff. Z-stat
Intercept -7.0630 -10.74 *** -6.8735 -10.84 *** -6.6990 -10.43 *** -6.7342 -10.31 *** AB_CFO - -0.6129 -2.31 ** AB_PROD + 0.0681 0.26 AB_EXP - -0.6319 -4.90 *** AB_COMBINED + 0.6135 6.04 *** AB_ACC + 0.0956 2.51 ** 0.0986 2.71 *** 0.0664 1.98 ** 0.0598 1.79 * SIZE + 0.3737 6.84 *** 0.3577 6.80 *** 0.3271 5.96 *** 0.3364 6.10 *** INV + 2.5184 4.31 *** 2.6041 4.47 *** 2.6791 4.48 *** 2.4318 4.04 *** REC + 1.7488 4.35 *** 1.7181 4.38 *** 2.0310 5.09 *** 1.8691 4.77 *** ROA - -0.4727 -2.17 ** -0.4187 -1.90 * -0.0850 -0.26 -0.2692 -0.92 CURRENT RATIO - -0.0913 -1.92 * -0.0949 -1.96 ** -0.1030 -2.01 ** -0.1017 -1.99 ** LEVERAGE + 0.6456 1.83 * 0.6488 1.85 * 0.6139 1.53 0.5574 1.38 GROWTH + 0.0717 0.82 0.0529 0.55 0.0363 0.31 0.0492 0.48 RETURN - -0.1398 -1.21 -0.1408 -1.22 -0.1155 -0.96 -0.0917 -0.76 STOCK VOLATILITY + -9.7679 -1.64 -11.0194 -1.85 * -10.7805 -1.75 * -10.6224 -1.75 * BETA + 0.0916 0.73 0.0950 0.76 0.1594 1.30 0.1468 1.21 TURNOVER + 1.0803 2.26 ** 1.0631 2.26 ** 0.9457 2.04 ** 0.9805 2.09 ** DELIST + 0.5694 2.16 ** 0.5387 2.04 ** 0.5048 1.83 * 0.5481 2.02 ** TECH + -0.2605 -1.42 -0.2806 -1.50 -0.3791 -1.99 ** -0.3129 -1.67 * OPINION + -10.5093 0.00 -10.4441 0.00 -10.4420 0.00 -10.6613 0.00
Pseudo R2 (%) 15.60 15.01 17.47 17.97
The dependent variable is LIT, an indicator variable that takes the value of one if the client’s auditor is named in a lawsuit, and zero otherwise. Other variables are defined in Appendix A. All statistics and significance levels are based on standard errors adjusted for firm clustering. *, **, *** indicate statistical significance at the p<0.10, p<0.05, and p<0.01 levels, respectively, based on two-tailed tests.