reading 2 - metallurgical and materials engineering
TRANSCRIPT
CALPHAD: Computer Coupling of Phase Diagrams and Thermochemistry 33 (2009) 295–311
Contents lists available at ScienceDirect
CALPHAD: Computer Coupling of Phase Diagrams andThermochemistry
journal homepage: www.elsevier.com/locate/calphad
FactSage thermochemical software and databases — recent developmentsC.W. Bale a,∗, E. Bélisle a, P. Chartrand a, S.A. Decterov a, G. Eriksson b, K. Hack b, I.-H. Jung a, Y.-B. Kang a,J. Melançon a, A.D. Pelton a, C. Robelin a, S. Petersen ba CRCT - Center for Research in Computational Thermochemistry, Department of Chemical Eng., École Polytechnique (Campus de Université de Montréal), Box 6079, StationDowntown, Montréal, Québec, Canada H3C 3A71b GTT-Technologies, Kaiserstrasse 100, 52134 Herzogenrath, Germany2
a r t i c l e i n f o
Article history:Received 29 May 2008Received in revised form8 September 2008Accepted 10 September 2008Available online 9 October 2008
Keywords:ThermodynamicsFactSageComputational modelingPhase diagramsGibbs energy
a b s t r a c t
FactSage r© was introduced in 2001 as the fusion of the F*A*C*T/FACT-Win and ChemSagethermochemical packages. The FactSage package runs on a PC operating under MicrosoftWindows r© andconsists of a series of information, database, calculation and manipulation modules that enable oneto access and manipulate pure substances and solution databases. With the various modules one canperform awide variety of thermochemical calculations and generate tables, graphs and figures of interestto chemical and physical metallurgists, chemical engineers, corrosion engineers, inorganic chemists,geochemists, ceramists, electrochemists, environmentalists, etc. This paper presents a summary of therecent developments in the FactSage thermochemical software and databases. In the article, emphasis isplaced on the new databases and the calculation andmanipulation of phase diagrams and complex phaseequilibria.
© 2009 Published by Elsevier Ltd
0. Introduction
FactSage r© was introduced in 2001 as the fusion of twowell-known software packages in the field of computationalthermochemistry: F*A*C*T/FACT-Win and ChemSage. It is usedworldwide at approximately 400 installations in universities,governmental and non-governmental research laboratories andindustry. The original F*A*C*T package [1] was designed tosimulate the thermochemistry of pyrometallurgical processing.With the migration to the Windows-based FACT-Win and thento FactSage the applications have been expanded to includehydrometallurgy, electrometallurgy, corrosion, glass technology,combustion, ceramics, geology, environmental studies, etc.While an understanding of chemical thermodynamics is useful
in order to run the modules, it is not essential to be an expertin the field. With program usage and the assistance of extensivedocumentation, one can acquire a practical understanding ofthe principles of thermochemistry especially as these relate tocomplex phase equilibria.An article on FactSage Thermochemical Software and
Databases was published [2] in this journal. Since then extensive
∗ Corresponding author. Tel.: +1 514 340 4770; fax: +1 514 340 5840.E-mail address: [email protected] (C.W. Bale).
1 http://www.crct.polymtl.ca.2 http://www.gtt-technologies.de.
0364-5916/$ – see front matter© 2009 Published by Elsevier Ltddoi:10.1016/j.calphad.2008.09.009
modifications and additions have been carried out to both the soft-ware and the databases. These developments are the subject of thiscurrent article with emphasis placed on the new databases andthe calculation and manipulation of phase diagrams and complexphase equilibria. The reader who is unfamiliar with FactSage is en-couraged to consult the original publication [2].The FactSage package runs on a PC operating under Microsoft
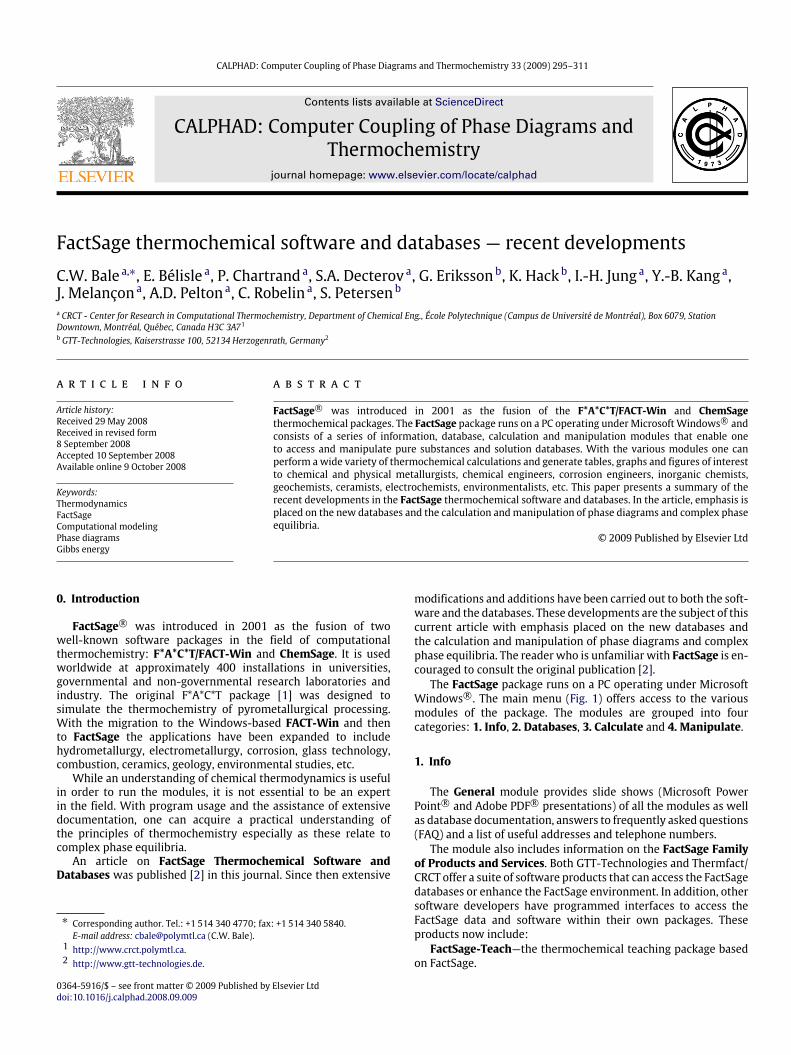
Windows r©. The main menu (Fig. 1) offers access to the variousmodules of the package. The modules are grouped into fourcategories: 1. Info, 2. Databases, 3. Calculate and 4. Manipulate.
1. Info
The General module provides slide shows (Microsoft PowerPoint r© and Adobe PDF r© presentations) of all the modules as wellas database documentation, answers to frequently asked questions(FAQ) and a list of useful addresses and telephone numbers.The module also includes information on the FactSage Family
of Products and Services. Both GTT-Technologies and Thermfact/CRCT offer a suite of software products that can access the FactSagedatabases or enhance the FactSage environment. In addition, othersoftware developers have programmed interfaces to access theFactSage data and software within their own packages. Theseproducts now include:
FactSage-Teach—the thermochemical teaching package basedon FactSage.
296 C.W. Bale et al. / CALPHAD: Computer Coupling of Phase Diagrams and Thermochemistry 33 (2009) 295–311
Fig. 1. FactSage Main Menu and About Window.
ChemApp—the thermochemistry library dynamically linked forsoftware applications.
ChemSheet—the spreadsheet tool for process simulation.SimuSage—the component library for rapid process modeling.CSFAP—ChemSage File Administrator Program.OLI Systems—FactSage Interface: the link to the OLI aqueous
databanks.METSIM—FactSage Link for the coupled chemical process
simulation.
2. Databases
In FactSage there are two types of thermochemical databases— compound (pure substances) databases and solution databases.The View Data, Compound and Solution modules permit oneto list and manipulate the database files. These modules werepresented in the previous FactSage article.TheDocumentationmodule is new. A large amount of time has
been devoted to developing new databases, introducing extensivedocumentation and displaying calculated phase diagrams.In the Documentation module a new program, the FactSage
Browser, has been developed that enables one to manipulatethe database and documentation files in a ‘phase diagramfriendly’ environment. For example, a ‘click’ on the Databases‘Documentation’ button (Fig. 1) opens the FactSage Browser(Fig. 2) that displays database information, documentation andphase diagram previews. There is a ‘search phase diagram’ modethat scans the hundreds of phase diagrams stored in FactSage;Fig. 3 lists the phase diagrams and database source for systemscontaining SiO2 or Al2O3.
FactSage accesses both solution databases and pure compounddatabases. The former contain the optimized parameters forsolution phases. The latter contain the properties of stoichiometriccompounds, either obtained from phase diagram optimizations ortaken from standard compilations, for example [3–7]. The FACTand SGTE compound and solution databases were presented in theprevious publication. During the past five years the diversity andnumber of databases have been expanded. The new databases aresummarized in the following sections.
2.1. FACT databases — FToxid, FTsalt, FThall, FThelg, FTmisc, FTpulp
The FACT databases are the largest set of evaluated andoptimized thermodynamic databases for inorganic systems inthe world and have been under development for over 25 years.During the period 2001–2003, major additions and modificationswere made as part of the ‘‘FACT Database Consortium Project’’with funding from the Natural Sciences and Engineering Research
Council of Canada and15 industries (Noranda, INCO, Teck Cominco,Rio Tinto, Alcoa, Shell, Corning, Dupont, Pechiney (now Alcan), St.Gobain Recherche, Schott Glass, Sintef, Norsk Hydro, Mintek, IISMaterials). The updated databases were publicly released in 2004so the present databases are much expanded beyond what wasavailable in the former FACT databases.
FToxid — oxide database for slags, glasses, minerals, ceramics,refractories, etc. contains data for stoichiometric oxides and oxidesolutions of the following components: Al2O3,As2O3, B2O3, CaO,CoO, CrO, Cr2O3, Cu2O, FeO, Fe2O3,GeO2,K2O,MgO,MnO,Na2O,NiO, PbO, SiO2, SnO, TiO2, Ti2O3, ZnO, ZrO2. Not all binary, ternaryand higher-order subsystems have been evaluated and opti-mized, nor are all composition ranges covered. However, thesystem Al2O3–CaO–FeO–Fe2O3–MgO–SiO2 has been fully op-timized from 25 ◦C to above the liquidus temperatures atall compositions and oxygen partial pressures. ComponentsCoO, CrO, Cr2O3, Cu2O,MnO,NiO, PbO, SnO, TiO2, Ti2O3, ZnOand ZrO2 were added to this core six-component system and therelevant subsystems were optimized over the composition rangesimportant for applications in ferrous and non-ferrous metallurgy,production of ceramics, refractories and paint pigments. Currentlywe are working on the addition of B2O3,K2O and Na2O to thecore six-component system for applications in the glass industry,combustion, coal gasification and waste management. Many sub-systems with these three components are being re-evaluated andre-optimized using more advanced solution models that we haverecently developed. The documentationmodule containsmore de-tailed description of the systems that have been optimized.The liquid/glass solution phase is called FToxid-Slag. As well
as all the oxide components mentioned above, it includesdilute solutions of S, SO4, PO4,H2O/OH, CO3, F, Cl, I. We have alsodeveloped a new model for the viscosity of oxide melts [8]. Ittakes into account the information on the short-range orderingand formation of a silica network in liquid oxides obtained fromthe thermodynamic modeling of slags. The model uses manyfewer adjustable parameters than the other viscosity modelspresently available and shows very good predictive ability. Bycritical evaluation of experimental viscosity data and optimizationof the model parameters, a state-of-the-art viscosity database isbeing built which will soon become available to FactSage users.There are many oxide solid solutions in the database. Some of
the most extensive solutions includeSpinel: (Al, Co2+, Co3+, Cr2+, Cr3+, Fe2+, Fe3+,Mg,Ni2+, Zn)T[Al,Co2+, Co3+, Cr3+, Fe2+, Fe3+,Mg,Ni2+, Zn]O2O4Pyroxene: (Ca, Fe2+,Mg)M2(Al, Fe2+, Fe3+,Mg)M1(Al, Fe3+, Si)T1SiT2O6Melilite: (Ca, Pb)A2 [Al, Fe
2+, Fe3+,Mg, Zn]T1{Al, Fe3+, Si}T22 O7

C.W. Bale et al. / CALPHAD: Computer Coupling of Phase Diagrams and Thermochemistry 33 (2009) 295–311 297
Fig. 2. FactSage Browsermodule — databases and preview window.
Olivine: (Ca, Co, Fe2+,Mg,Mn,Ni, Zn)M2[Ca, Co, Fe2+,Mg,Mn,Ni, Zn]M1SiO4.
FTsalt — salt database contains data for pure salts and saltsolutions formed among various combinations of the 20 cationsLi, Na, K, Rb, Cs, Mg, Ca, Sr, Ba, Mn, Al, Fe(II), Fe(III), Co, Ni, Pb,La, Ce, Nd and 8 anions F, Cl, Br, I,NO3,OH, CO3, SO4. The moltensalt phase is called FTsalt-Salt and includes dilute solutions ofO2− and OH−. FTsalt is by far the most extensive thermodynamicdatabase available in the world on salt systems.
FThall—Hall aluminumdatabase contains data for all pure sub-stances and 17 solution phases formed among Al–Mg–Na–Li–Ca–F–O. The molten cryolite phase is called FThall-bath and the moltenalloy phase is called FThall-liq. Calculations with NaF–AlF3–CaF2–Al2O3 electrolytes containing LiF,MgF2 and dissolved metal
can be made for liquidus calculations, emfs, partial pressures,etc. With this database, accurate liquidus temperatures ofNa3AlF6, CaF2,AlF3,Na5Al3F14,NaCaAlF6 and NaF among otherscan be calculated. Alumina solubility in standard cryolite-basedelectrolyte can be computed from low eutectic temperatures(>690 ◦C) up to 1100 ◦C. This is also valid for low concentrationsof additives such as LiF, Li3AlF6 andMgF2. Cubic-Na3AlF6 high tem-perature solid solutionwith excess AlF3, CaF2 and LiF has also beenmodeled. The gaseous species from the FACT53 database are con-sistent with phases found in FThall.
FThelg — aqueous (Helgeson) database contains infinitedilution properties for over 1400 aqueous solute species takenfrom the GEOPIG-SUPCRT Helgeson public database and includethe Helgeson equation of state for temperatures up to 350 ◦C and

298 C.W. Bale et al. / CALPHAD: Computer Coupling of Phase Diagrams and Thermochemistry 33 (2009) 295–311
Fig. 3. FactSage Browsermodule — phase diagram search mode for systems with SiO2 and Al2O3 .
Fig. 4. Equilib module — Reactants and Data Search Windows Fe-slag system. Entry of reactants including a variable amounts of Al2O3 and CaO; selection of FToxid andFTmisc databases.
Fig. 5. EquilibmoduleMenu and List Windows Fe-slag system. Selection of possible product phases and definition of final conditions; summary of selected species.
pressures up to 165 bar. The data are stored as 3 aqueous solutionsFThelg-AQID, -AQDH, -AQDD. FThelg-AQID assumes an ideal dilutesolution and is generally valid up to approximately 0.001 molal.FThelg-AQDH incorporates the Debye–Huckel equation, and isgenerally valid up to approximately 0.02 molal. FThelt-AQDDincorporates the extended Debye–Huckel (Davies) equation andis generally valid up to 0.5 molal. The FThelg pure compounddatabase contains data for 185 pure solid compounds and gases
which are thermodynamically consistent with the FThelg aqueoussolution database.
FTmisc—miscellaneous databases for copper, nickel, lead, zinc,etc. sulphides, alloys, etc. includes the following systems: theS–Fe–Ni–Co–Cr system; the matte smelting system S–Cu–Fe–Ni–Co–Pb–Zn–As; liquid Fe with dilute solutes Al, B, Bi, C, Ca, Ce, Co,Cr, Mg, Mn, Mo, N, Nb, Ni, O, P, Pb, S, Sb, Si, Te, Ti, V, W, Zn, Zr.[FTmisc-FeLQ]; liquid Sn with dilute solutes Al, Ca, Ce, Co, Cr, Cu,
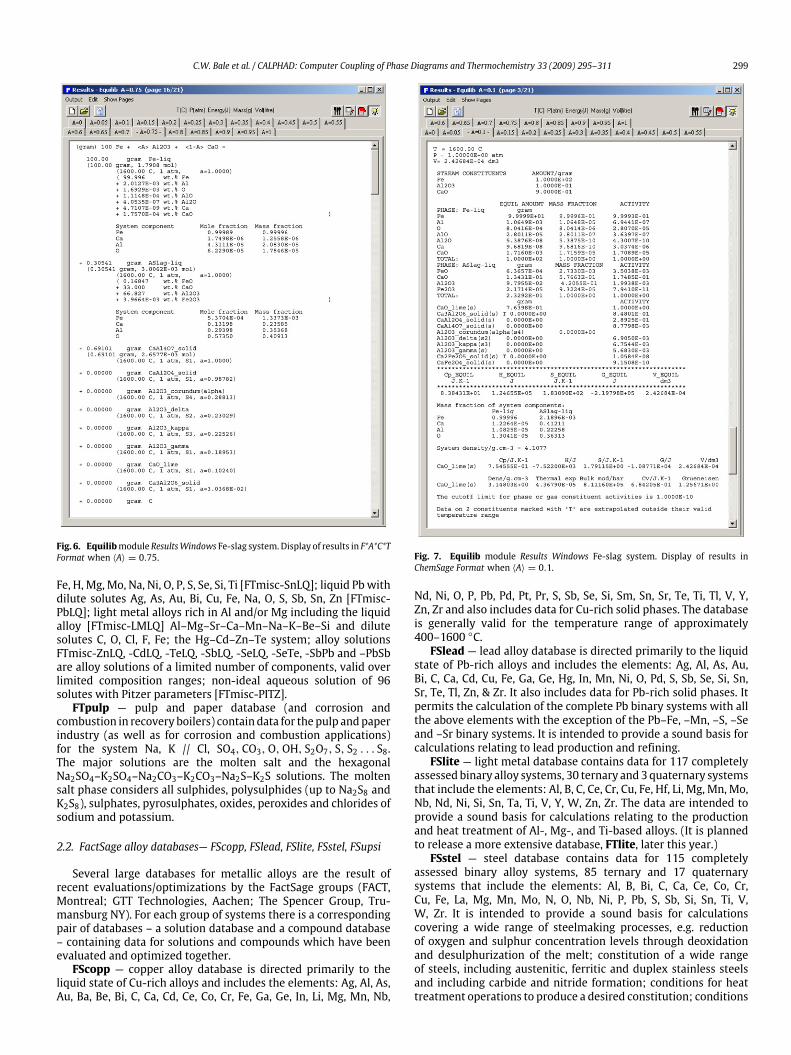
C.W. Bale et al. / CALPHAD: Computer Coupling of Phase Diagrams and Thermochemistry 33 (2009) 295–311 299
Fig. 6. Equilibmodule ResultsWindows Fe-slag system. Display of results in F*A*C*TFormat when 〈A〉 = 0.75.
Fe, H, Mg, Mo, Na, Ni, O, P, S, Se, Si, Ti [FTmisc-SnLQ]; liquid Pbwithdilute solutes Ag, As, Au, Bi, Cu, Fe, Na, O, S, Sb, Sn, Zn [FTmisc-PbLQ]; light metal alloys rich in Al and/or Mg including the liquidalloy [FTmisc-LMLQ] Al–Mg–Sr–Ca–Mn–Na–K–Be–Si and dilutesolutes C, O, Cl, F, Fe; the Hg–Cd–Zn–Te system; alloy solutionsFTmisc-ZnLQ, -CdLQ, -TeLQ, -SbLQ, -SeLQ, -SeTe, -SbPb and –PbSbare alloy solutions of a limited number of components, valid overlimited composition ranges; non-ideal aqueous solution of 96solutes with Pitzer parameters [FTmisc-PITZ].
FTpulp — pulp and paper database (and corrosion andcombustion in recovery boilers) contain data for the pulp andpaperindustry (as well as for corrosion and combustion applications)for the system Na, K // Cl, SO4, CO3,O,OH, S2O7, S, S2 . . . S8.The major solutions are the molten salt and the hexagonalNa2SO4–K2SO4–Na2CO3–K2CO3–Na2S–K2S solutions. The moltensalt phase considers all sulphides, polysulphides (up to Na2S8 andK2S8), sulphates, pyrosulphates, oxides, peroxides and chlorides ofsodium and potassium.
2.2. FactSage alloy databases— FScopp, FSlead, FSlite, FSstel, FSupsi
Several large databases for metallic alloys are the result ofrecent evaluations/optimizations by the FactSage groups (FACT,Montreal; GTT Technologies, Aachen; The Spencer Group, Tru-mansburg NY). For each group of systems there is a correspondingpair of databases – a solution database and a compound database– containing data for solutions and compounds which have beenevaluated and optimized together.
FScopp — copper alloy database is directed primarily to theliquid state of Cu-rich alloys and includes the elements: Ag, Al, As,Au, Ba, Be, Bi, C, Ca, Cd, Ce, Co, Cr, Fe, Ga, Ge, In, Li, Mg, Mn, Nb,
Fig. 7. Equilib module Results Windows Fe-slag system. Display of results inChemSage Format when 〈A〉 = 0.1.
Nd, Ni, O, P, Pb, Pd, Pt, Pr, S, Sb, Se, Si, Sm, Sn, Sr, Te, Ti, Tl, V, Y,Zn, Zr and also includes data for Cu-rich solid phases. The databaseis generally valid for the temperature range of approximately400–1600 ◦C.
FSlead — lead alloy database is directed primarily to the liquidstate of Pb-rich alloys and includes the elements: Ag, Al, As, Au,Bi, C, Ca, Cd, Cu, Fe, Ga, Ge, Hg, In, Mn, Ni, O, Pd, S, Sb, Se, Si, Sn,Sr, Te, Tl, Zn, & Zr. It also includes data for Pb-rich solid phases. Itpermits the calculation of the complete Pb binary systems with allthe above elements with the exception of the Pb–Fe, –Mn, –S, –Seand –Sr binary systems. It is intended to provide a sound basis forcalculations relating to lead production and refining.
FSlite — light metal database contains data for 117 completelyassessed binary alloy systems, 30 ternary and3quaternary systemsthat include the elements: Al, B, C, Ce, Cr, Cu, Fe, Hf, Li, Mg, Mn, Mo,Nb, Nd, Ni, Si, Sn, Ta, Ti, V, Y, W, Zn, Zr. The data are intended toprovide a sound basis for calculations relating to the productionand heat treatment of Al-, Mg-, and Ti-based alloys. (It is plannedto release a more extensive database, FTlite, later this year.)
FSstel — steel database contains data for 115 completelyassessed binary alloy systems, 85 ternary and 17 quaternarysystems that include the elements: Al, B, Bi, C, Ca, Ce, Co, Cr,Cu, Fe, La, Mg, Mn, Mo, N, O, Nb, Ni, P, Pb, S, Sb, Si, Sn, Ti, V,W, Zr. It is intended to provide a sound basis for calculationscovering a wide range of steelmaking processes, e.g. reductionof oxygen and sulphur concentration levels through deoxidationand desulphurization of the melt; constitution of a wide rangeof steels, including austenitic, ferritic and duplex stainless steelsand including carbide and nitride formation; conditions for heattreatment operations to produce a desired constitution; conditions

300 C.W. Bale et al. / CALPHAD: Computer Coupling of Phase Diagrams and Thermochemistry 33 (2009) 295–311
Fig. 8. Equilib module Results Windows Cu–matte–slag system. Display of resultsin F*A*C*T Format for silica saturation (〈A〉 = 40) — taken from [2].
for scrap remelting to maintain as low concentrations as possibleof undesirable ‘‘tramp elements’’; melt–crucible interactions, etc.
FSupsi— ultrapure silicon database is directed primarily to theliquid state of Si-rich alloys, with the particular aim of enablingcalculation of impurity concentration levels in ultrapure silicon. Itincludes the following elements as impurities in liquid silicon: Al,Au, B, C, Ca, Co, Cr, Cu, Fe, Ge, In, Mg, Mn, N, Ni, O, P, Pb, Sb, Sn, Te,Ti, V, Zn. The elements included in the Si-rich solid solution are B,C, Ge, N, Sn, Ti, Zn. All other elements are treated as insoluble insolid Si.
2.3. SGTE databases — SGnobl, SGnucl, SGTE, BINARY
The following databases prepared by the international SGTEconsortium (http://www.sgte.org) are available in FactSage.
SGTE — (2004) alloy database is an extensive update (2004) ofthe previous SGSL (1991) alloy database. It contains data for over300 completely assessed binary alloy systems and 120 ternary andhigher-order systems that include the 78 elements: Ag, Al, Am, As,Au, B, Ba, Be, Bi, C, Ca, Cd, Ce, Co, Cr, Cs, Cu, Dy, Er, Eu, Fe, Ga, Gd, Ge,Hf, Hg, Ho, In, Ir, K, La, Li, Lu,Mg,Mn,Mo,N, Na, Nb, Nd, Ni, Np, O, Os,P, Pa, Pb, Pd, Pr, Pt, Pu, Rb, Re, Rh, Ru, S, Sb, Sc, Se, Si, Sm, Sn, Sr, Ta,Tb, Tc, Te, Th, Ti, Tl, Tm, U, V, W, Y, Yb, Zn, Zr. A more extensiveSGTE database (2007) will be added to FactSage in the nearfuture.
SGnobl — noble metal database contains evaluated thermody-namic parameters for alloys of Ag, Au, Ir, Os, Pd, Pt, Rh, Ru alloyedamongst themselves and also in alloys with the metals: Al, As, Bi,C, Co, Cr, Cu, Fe, Ge, In, Mg, Ni, Pb, Sb, Si, Sn, Ta, Te, Ti, Tl, Zn, Zr. No-ble metals and their alloys have a wide variety of applications, andcalculations of relevant phase equilibria in a particular case are im-portant e.g. for optimizing suitable alloy compositions or predict-ing reaction products in chemically aggressive environments.
SGnucl — nuclear database includes the elements: O, U, Zr,Fe, Cr, Ni, Ar, H. Also included are systems formed among thesix oxides UO2, ZrO2, FeO, Fe2O3, Cr2O3,NiO. The database wasgenerated by Thermodata [9] as part of a much bigger databaseeffort to cover many thermochemical aspects related to the fieldof nuclear reactors. The SGnucl database is specially made forthe investigation of in-vessel chemical reactions. It is an SGTE-approved database and has been converted for use with FactSageby GTT Technologies.
BINARY — (2004) free alloy database is the SGTE free binaryalloy database and comprises some115of the binary systems takenfrom the SGTE alloy databases.
2.4. Other databases — OLI, TDnucl
FactSage offers access to a variety of other specialty databasesincluding:
OLI-Systems [10] — aqueous databases. OLIP (Public.ddb) con-tains core data for the thermodynamic, transport, and physicalproperties for 79 inorganic elements (including actinides, heavyand precious metals) and their associated aqueous species. Thedatabank also includes over 3000 organics (including electrolytes,
Fig. 9. Fact-XMLmodule Cu–matte–slag system. Data manipulation and display.
C.W. Bale et al. / CALPHAD: Computer Coupling of Phase Diagrams and Thermochemistry 33 (2009) 295–311 301
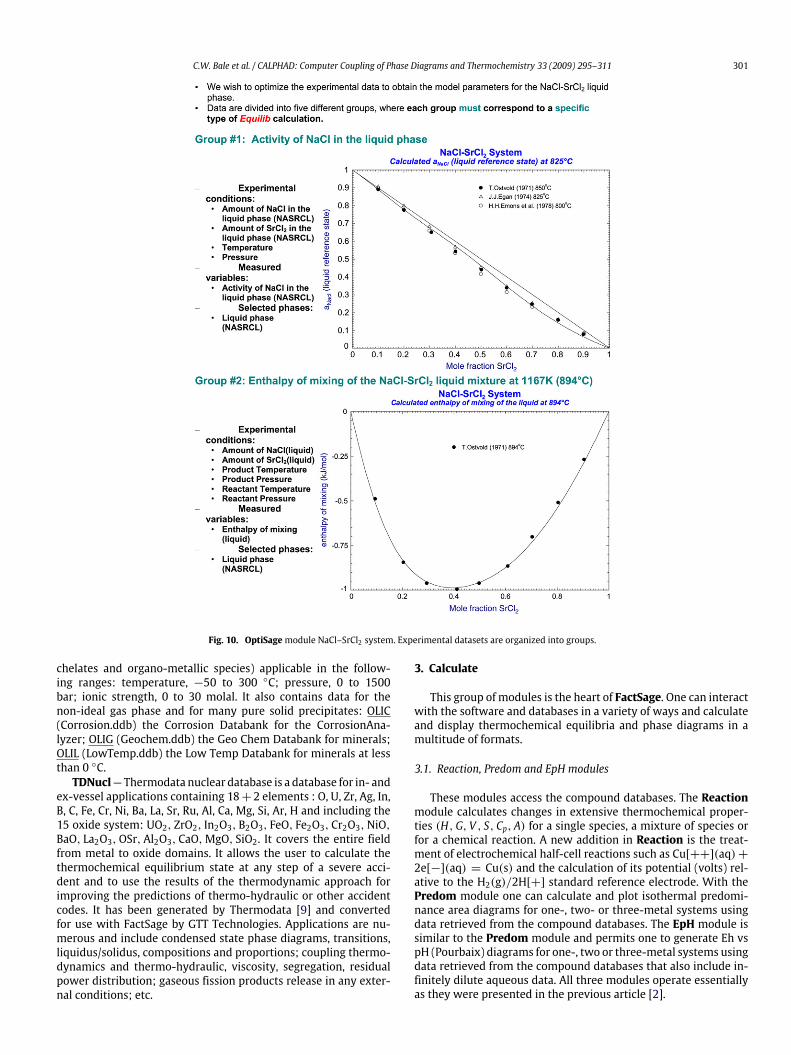
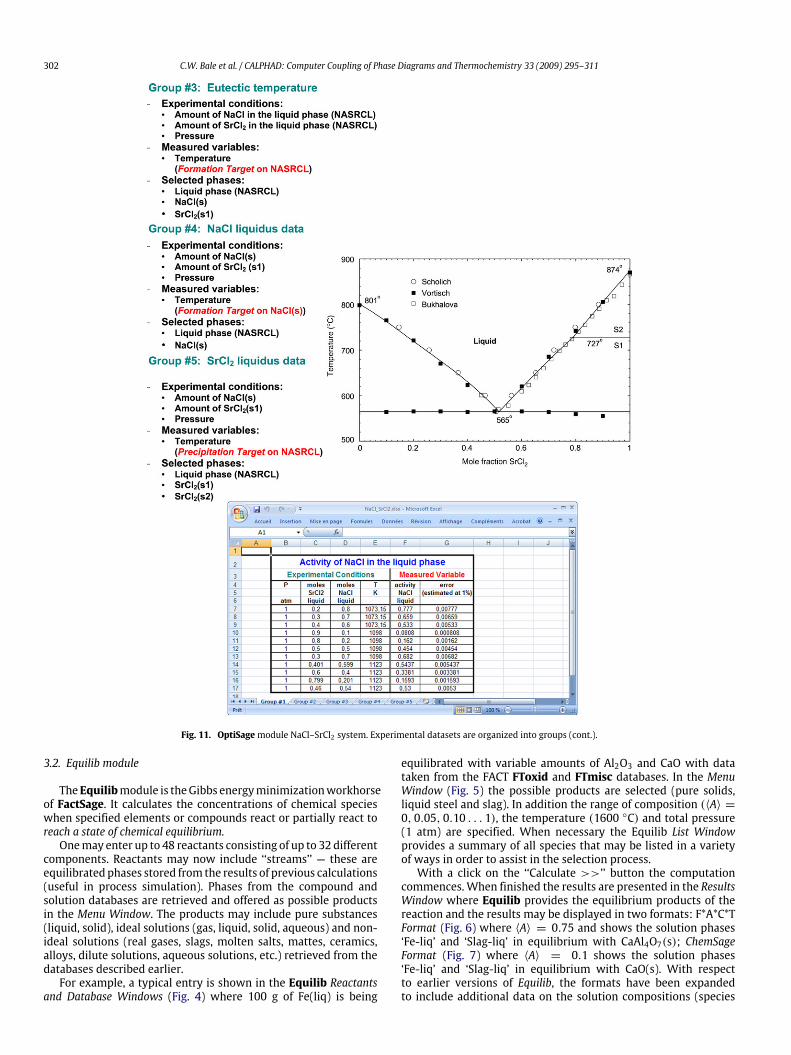
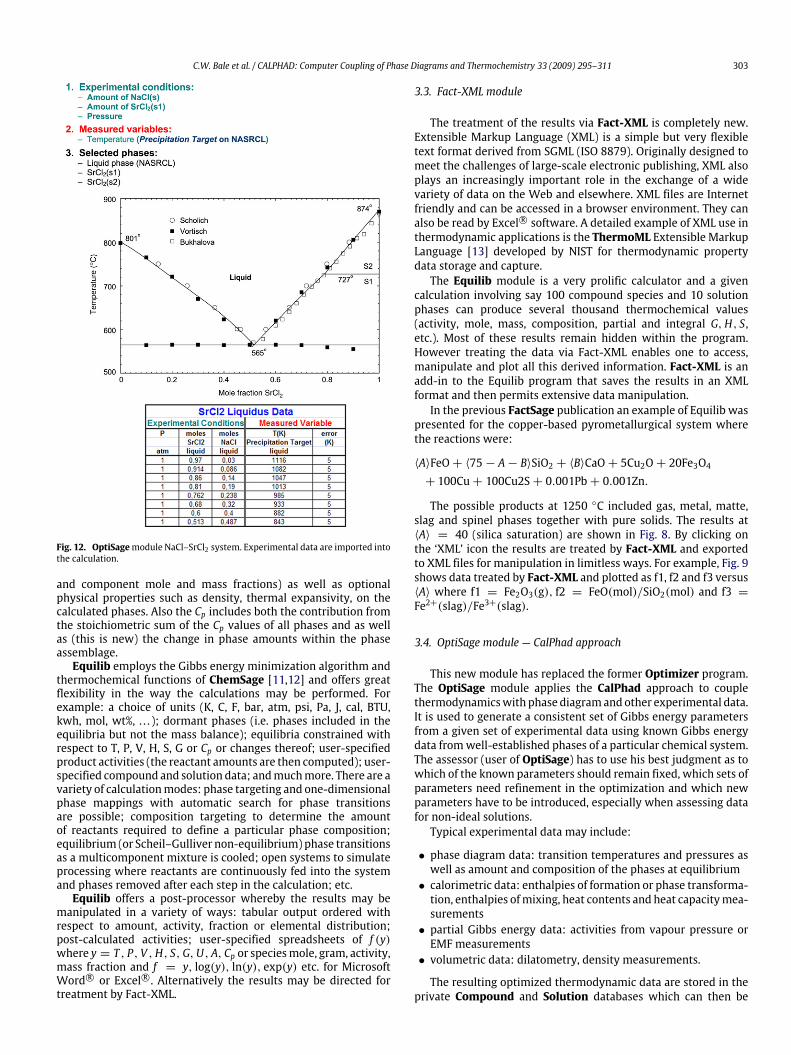
Fig. 10. OptiSagemodule NaCl–SrCl2 system. Experimental datasets are organized into groups.
chelates and organo-metallic species) applicable in the follow-ing ranges: temperature, −50 to 300 ◦C; pressure, 0 to 1500bar; ionic strength, 0 to 30 molal. It also contains data for thenon-ideal gas phase and for many pure solid precipitates: OLIC(Corrosion.ddb) the Corrosion Databank for the CorrosionAna-lyzer; OLIG (Geochem.ddb) the Geo Chem Databank for minerals;OLIL (LowTemp.ddb) the Low Temp Databank for minerals at lessthan 0 ◦C.
TDNucl—Thermodata nuclear database is a database for in- andex-vessel applications containing 18+ 2 elements : O, U, Zr, Ag, In,B, C, Fe, Cr, Ni, Ba, La, Sr, Ru, Al, Ca, Mg, Si, Ar, H and including the15 oxide system: UO2, ZrO2, In2O3, B2O3, FeO, Fe2O3, Cr2O3,NiO,BaO, La2O3,OSr,Al2O3, CaO,MgO, SiO2. It covers the entire fieldfrom metal to oxide domains. It allows the user to calculate thethermochemical equilibrium state at any step of a severe acci-dent and to use the results of the thermodynamic approach forimproving the predictions of thermo-hydraulic or other accidentcodes. It has been generated by Thermodata [9] and convertedfor use with FactSage by GTT Technologies. Applications are nu-merous and include condensed state phase diagrams, transitions,liquidus/solidus, compositions and proportions; coupling thermo-dynamics and thermo-hydraulic, viscosity, segregation, residualpower distribution; gaseous fission products release in any exter-nal conditions; etc.
3. Calculate
This group of modules is the heart of FactSage. One can interactwith the software and databases in a variety of ways and calculateand display thermochemical equilibria and phase diagrams in amultitude of formats.
3.1. Reaction, Predom and EpH modules
These modules access the compound databases. The Reactionmodule calculates changes in extensive thermochemical proper-ties (H,G, V , S, Cp, A) for a single species, a mixture of species orfor a chemical reaction. A new addition in Reaction is the treat-ment of electrochemical half-cell reactions such as Cu[++](aq)+2e[−](aq) = Cu(s) and the calculation of its potential (volts) rel-ative to the H2(g)/2H[+] standard reference electrode. With thePredom module one can calculate and plot isothermal predomi-nance area diagrams for one-, two- or three-metal systems usingdata retrieved from the compound databases. The EpH module issimilar to the Predom module and permits one to generate Eh vspH (Pourbaix) diagrams for one-, two or three-metal systems usingdata retrieved from the compound databases that also include in-finitely dilute aqueous data. All three modules operate essentiallyas they were presented in the previous article [2].
302 C.W. Bale et al. / CALPHAD: Computer Coupling of Phase Diagrams and Thermochemistry 33 (2009) 295–311
Fig. 11. OptiSagemodule NaCl–SrCl2 system. Experimental datasets are organized into groups (cont.).
3.2. Equilib module
TheEquilibmodule is theGibbs energyminimizationworkhorseof FactSage. It calculates the concentrations of chemical specieswhen specified elements or compounds react or partially react toreach a state of chemical equilibrium.Onemay enter up to 48 reactants consisting of up to 32 different
components. Reactants may now include ‘‘streams’’ — these areequilibrated phases stored from the results of previous calculations(useful in process simulation). Phases from the compound andsolution databases are retrieved and offered as possible productsin the Menu Window. The products may include pure substances(liquid, solid), ideal solutions (gas, liquid, solid, aqueous) and non-ideal solutions (real gases, slags, molten salts, mattes, ceramics,alloys, dilute solutions, aqueous solutions, etc.) retrieved from thedatabases described earlier.For example, a typical entry is shown in the Equilib Reactants
and Database Windows (Fig. 4) where 100 g of Fe(liq) is being
equilibrated with variable amounts of Al2O3 and CaO with datataken from the FACT FToxid and FTmisc databases. In the MenuWindow (Fig. 5) the possible products are selected (pure solids,liquid steel and slag). In addition the range of composition (〈A〉 =0, 0.05, 0.10 . . . 1), the temperature (1600 ◦C) and total pressure(1 atm) are specified. When necessary the Equilib List Windowprovides a summary of all species that may be listed in a varietyof ways in order to assist in the selection process.With a click on the ‘‘Calculate >>’’ button the computation
commences. When finished the results are presented in the ResultsWindow where Equilib provides the equilibrium products of thereaction and the results may be displayed in two formats: F*A*C*TFormat (Fig. 6) where 〈A〉 = 0.75 and shows the solution phases‘Fe-liq’ and ‘Slag-liq’ in equilibrium with CaAl4O7(s); ChemSageFormat (Fig. 7) where 〈A〉 = 0.1 shows the solution phases‘Fe-liq’ and ‘Slag-liq’ in equilibrium with CaO(s). With respectto earlier versions of Equilib, the formats have been expandedto include additional data on the solution compositions (species
C.W. Bale et al. / CALPHAD: Computer Coupling of Phase Diagrams and Thermochemistry 33 (2009) 295–311 303
Fig. 12. OptiSagemodule NaCl–SrCl2 system. Experimental data are imported intothe calculation.
and component mole and mass fractions) as well as optionalphysical properties such as density, thermal expansivity, on thecalculated phases. Also the Cp includes both the contribution fromthe stoichiometric sum of the Cp values of all phases and as wellas (this is new) the change in phase amounts within the phaseassemblage.
Equilib employs the Gibbs energy minimization algorithm andthermochemical functions of ChemSage [11,12] and offers greatflexibility in the way the calculations may be performed. Forexample: a choice of units (K, C, F, bar, atm, psi, Pa, J, cal, BTU,kwh, mol, wt%, . . . ); dormant phases (i.e. phases included in theequilibria but not the mass balance); equilibria constrained withrespect to T, P, V, H, S, G or Cp or changes thereof; user-specifiedproduct activities (the reactant amounts are then computed); user-specified compound and solution data; andmuchmore. There are avariety of calculationmodes: phase targeting and one-dimensionalphase mappings with automatic search for phase transitionsare possible; composition targeting to determine the amountof reactants required to define a particular phase composition;equilibrium (or Scheil–Gulliver non-equilibrium) phase transitionsas a multicomponent mixture is cooled; open systems to simulateprocessing where reactants are continuously fed into the systemand phases removed after each step in the calculation; etc.
Equilib offers a post-processor whereby the results may bemanipulated in a variety of ways: tabular output ordered withrespect to amount, activity, fraction or elemental distribution;post-calculated activities; user-specified spreadsheets of f (y)where y = T , P, V ,H, S,G,U, A, Cp or speciesmole, gram, activity,mass fraction and f = y, log(y), ln(y), exp(y) etc. for MicrosoftWord r© or Excel r©. Alternatively the results may be directed fortreatment by Fact-XML.
3.3. Fact-XML module
The treatment of the results via Fact-XML is completely new.Extensible Markup Language (XML) is a simple but very flexibletext format derived from SGML (ISO 8879). Originally designed tomeet the challenges of large-scale electronic publishing, XML alsoplays an increasingly important role in the exchange of a widevariety of data on the Web and elsewhere. XML files are Internetfriendly and can be accessed in a browser environment. They canalso be read by Excel r© software. A detailed example of XML use inthermodynamic applications is the ThermoML Extensible MarkupLanguage [13] developed by NIST for thermodynamic propertydata storage and capture.The Equilib module is a very prolific calculator and a given
calculation involving say 100 compound species and 10 solutionphases can produce several thousand thermochemical values(activity, mole, mass, composition, partial and integral G,H, S,etc.). Most of these results remain hidden within the program.However treating the data via Fact-XML enables one to access,manipulate and plot all this derived information. Fact-XML is anadd-in to the Equilib program that saves the results in an XMLformat and then permits extensive data manipulation.In the previous FactSage publication an example of Equilib was
presented for the copper-based pyrometallurgical system wherethe reactions were:
〈A〉FeO+ 〈75− A− B〉SiO2 + 〈B〉CaO+ 5Cu2O+ 20Fe3O4+ 100Cu+ 100Cu2S+ 0.001Pb+ 0.001Zn.
The possible products at 1250 ◦C included gas, metal, matte,slag and spinel phases together with pure solids. The results at〈A〉 = 40 (silica saturation) are shown in Fig. 8. By clicking onthe ‘XML’ icon the results are treated by Fact-XML and exportedto XML files for manipulation in limitless ways. For example, Fig. 9shows data treated by Fact-XML and plotted as f1, f2 and f3 versus〈A〉 where f1 = Fe2O3(g), f2 = FeO(mol)/SiO2(mol) and f3 =Fe2+(slag)/Fe3+(slag).
3.4. OptiSage module — CalPhad approach
This new module has replaced the former Optimizer program.The OptiSage module applies the CalPhad approach to couplethermodynamicswith phase diagramandother experimental data.It is used to generate a consistent set of Gibbs energy parametersfrom a given set of experimental data using known Gibbs energydata fromwell-established phases of a particular chemical system.The assessor (user of OptiSage) has to use his best judgment as towhich of the known parameters should remain fixed, which sets ofparameters need refinement in the optimization and which newparameters have to be introduced, especially when assessing datafor non-ideal solutions.Typical experimental data may include:
• phase diagram data: transition temperatures and pressures aswell as amount and composition of the phases at equilibrium• calorimetric data: enthalpies of formation or phase transforma-tion, enthalpies ofmixing, heat contents and heat capacitymea-surements• partial Gibbs energy data: activities from vapour pressure orEMF measurements• volumetric data: dilatometry, density measurements.
The resulting optimized thermodynamic data are stored in theprivate Compound and Solution databases which can then be
304 C.W. Bale et al. / CALPHAD: Computer Coupling of Phase Diagrams and Thermochemistry 33 (2009) 295–311
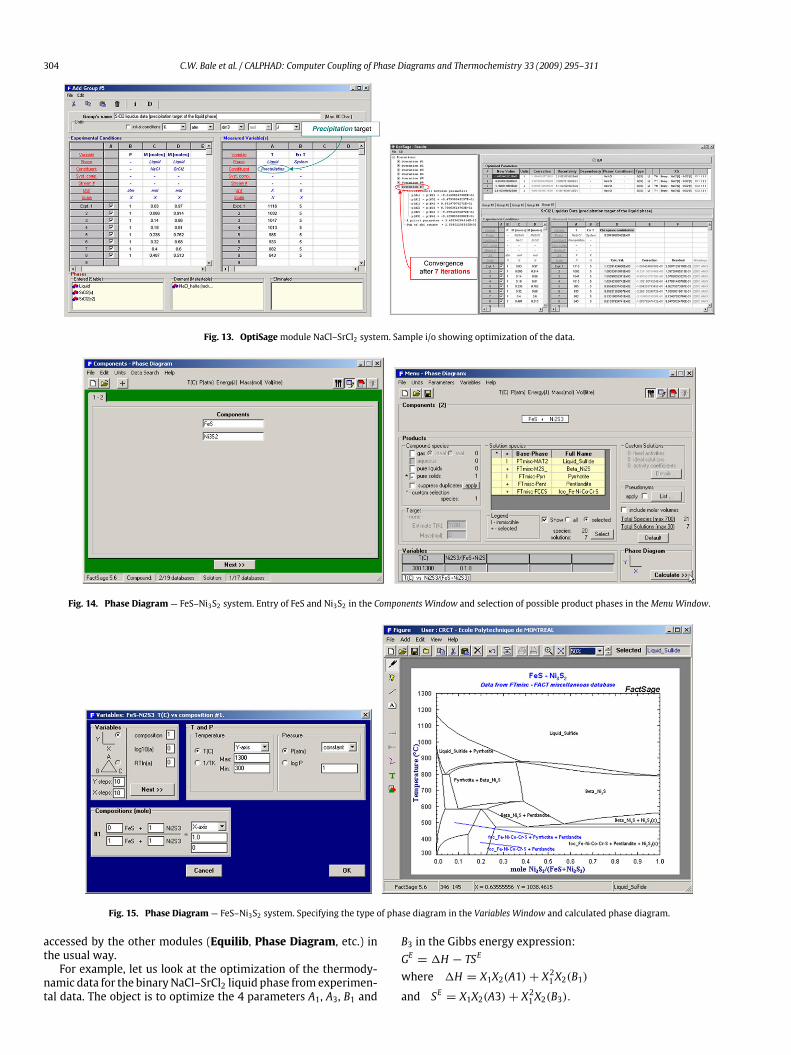
Fig. 13. OptiSagemodule NaCl–SrCl2 system. Sample i/o showing optimization of the data.
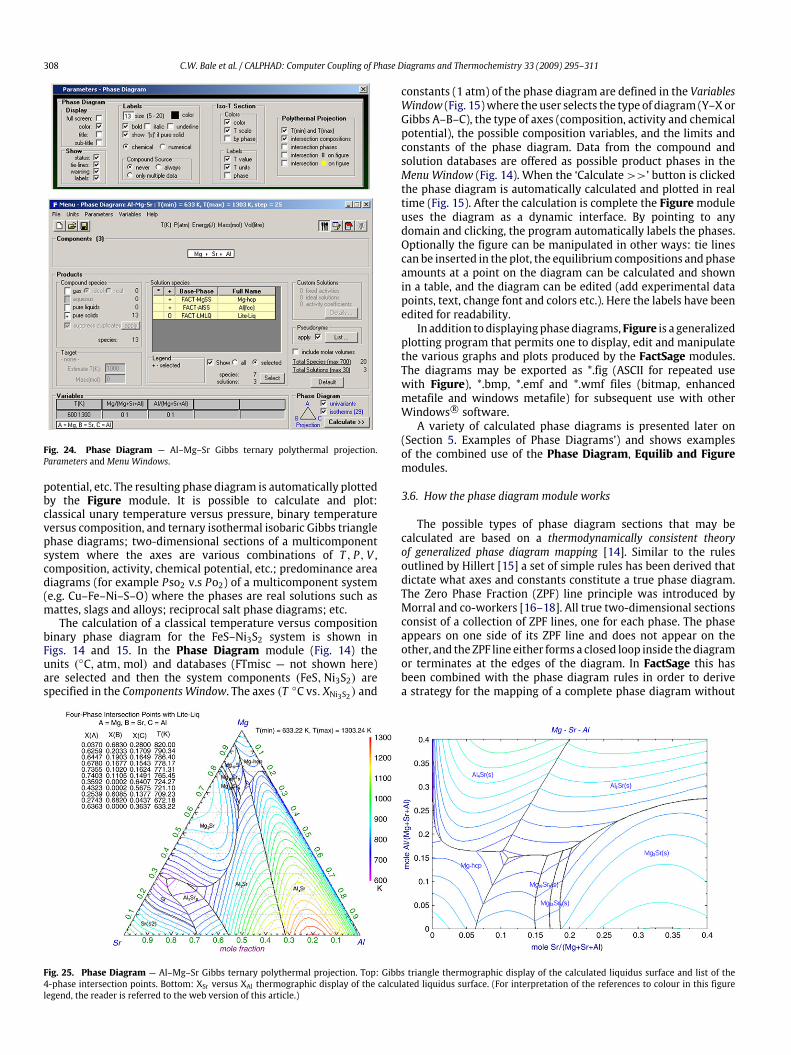
Fig. 14. Phase Diagram — FeS–Ni3S2 system. Entry of FeS and Ni3S2 in the Components Window and selection of possible product phases in theMenu Window.
Fig. 15. Phase Diagram — FeS–Ni3S2 system. Specifying the type of phase diagram in the Variables Window and calculated phase diagram.
accessed by the other modules (Equilib, Phase Diagram, etc.) inthe usual way.For example, let us look at the optimization of the thermody-
namic data for the binaryNaCl–SrCl2 liquid phase fromexperimen-tal data. The object is to optimize the 4 parameters A1, A3, B1 and
B3 in the Gibbs energy expression:GE = 1H − TSE
where 1H = X1X2(A1)+ X21X2(B1)
and SE = X1X2(A3)+ X21X2(B3).

C.W. Bale et al. / CALPHAD: Computer Coupling of Phase Diagrams and Thermochemistry 33 (2009) 295–311 305
Fig. 16. Phase Diagram — Fe2O3–MgO–SiO2–O2 system. Entry of components and selection of data from the FToxid databases.
Fig. 17. Phase Diagram—Fe2O3–MgO–SiO2–O2 system. T ◦C versusmass fraction Fe2O3/(MgO+Fe2O3+SiO2) phase diagram in air at SiO2/(MgO+Fe2O3+SiO2) = 5wt%.
Fig. 18. Phase Diagram — Fe–Cr–S2–O2 system. Two-metal log10 P(S2) versus log10 P(O2) predominance area diagram at 1000 ◦C where mole Fe/Cr = 1.
Figs. 10 and 11 show the experimental datasets organized intogroups. Figs. 12 and 13 show Group #5 experimental data beingimported into the calculation and being manipulated by OptiSage.The algorithm is iterative and requires a continuous comparisonbetween experimental data and the results of the optimization
— this is assisted by repeatedly calculating the phase diagram(Fig. 11).
OptiSage is by no means limited to optimizing binary systems.It can be used for systems containing any number of components.Any type of datum which can be calculated by the Equilibmodule

306 C.W. Bale et al. / CALPHAD: Computer Coupling of Phase Diagrams and Thermochemistry 33 (2009) 295–311
Fig. 19. Phase Diagram — inclusion formation in liquid steels. Top: Fe–0.1% C–1.5% Mn–0.1% Si–0.0078% S–0.005% O–x(ppm)Ti system and formation of manganesetitanate [19]. Bottom: oxide inclusion and liquid slag formation in the Fe–Ca–Al–O system at 1600 ◦C with log[wt% Ca] versus log[wt% Al] in Fe-liq [25].
Fig. 20. Phase Diagram — Cu–H2O–HCl–NaOH–H2 system taken from [20]. A novel way of representing aqueous phase equilibria — mole H2O/(HCl + NaOH) = 55.508,mole Cu/(HCl+ NaOH) = 0.1.

C.W. Bale et al. / CALPHAD: Computer Coupling of Phase Diagrams and Thermochemistry 33 (2009) 295–311 307
Fig. 21. FactSage — CaO–SiO2 binary phase diagram showing the effect of pressure (1 bar and 1 GPa) and comparison with experimental data [21].
Fig. 22. Phase Diagram — Al–Mg–Sr system. Components andMenu Windows.
Fig. 23. Phase Diagram — Al–Mg–Sr system. Variables Window and calculated phase diagram at 850 K.
(eutectic points, vapour pressures, equilibrium phase amounts,etc.) can be used as experimental input datum. OptiSage is ahighly complex module, offering high flexibility and scope for theexperienced user — it is an excellent tool for graduate studentstaking a course on solution thermodynamics. It offers a widevariety of input windows and options.
3.5. Phase diagram and figure modules
The Phase Diagram module is a generalized module thatpermits one to calculate, plot and edit unary, binary, ternary andmulticomponent phase diagram sections where the axes can bevarious combinations of T , P, V , composition, activity, chemical
308 C.W. Bale et al. / CALPHAD: Computer Coupling of Phase Diagrams and Thermochemistry 33 (2009) 295–311
Fig. 24. Phase Diagram — Al–Mg–Sr Gibbs ternary polythermal projection.Parameters andMenu Windows.
potential, etc. The resulting phase diagram is automatically plottedby the Figure module. It is possible to calculate and plot:classical unary temperature versus pressure, binary temperatureversus composition, and ternary isothermal isobaric Gibbs trianglephase diagrams; two-dimensional sections of a multicomponentsystem where the axes are various combinations of T , P, V ,composition, activity, chemical potential, etc.; predominance areadiagrams (for example Pso2 v.s Po2) of a multicomponent system(e.g. Cu–Fe–Ni–S–O) where the phases are real solutions such asmattes, slags and alloys; reciprocal salt phase diagrams; etc.The calculation of a classical temperature versus composition
binary phase diagram for the FeS–Ni3S2 system is shown inFigs. 14 and 15. In the Phase Diagram module (Fig. 14) theunits (◦C, atm,mol) and databases (FTmisc — not shown here)are selected and then the system components (FeS,Ni3S2) arespecified in the Components Window. The axes (T ◦C vs. XNi3S2) and
constants (1 atm) of the phase diagram are defined in the VariablesWindow (Fig. 15)where the user selects the type of diagram (Y–XorGibbs A–B–C), the type of axes (composition, activity and chemicalpotential), the possible composition variables, and the limits andconstants of the phase diagram. Data from the compound andsolution databases are offered as possible product phases in theMenu Window (Fig. 14). When the ‘Calculate>>’ button is clickedthe phase diagram is automatically calculated and plotted in realtime (Fig. 15). After the calculation is complete the Figuremoduleuses the diagram as a dynamic interface. By pointing to anydomain and clicking, the program automatically labels the phases.Optionally the figure can be manipulated in other ways: tie linescan be inserted in the plot, the equilibrium compositions and phaseamounts at a point on the diagram can be calculated and shownin a table, and the diagram can be edited (add experimental datapoints, text, change font and colors etc.). Here the labels have beenedited for readability.In addition to displayingphase diagrams, Figure is a generalized
plotting program that permits one to display, edit and manipulatethe various graphs and plots produced by the FactSage modules.The diagrams may be exported as *.fig (ASCII for repeated usewith Figure), *.bmp, *.emf and *.wmf files (bitmap, enhancedmetafile and windows metafile) for subsequent use with otherWindows r© software.A variety of calculated phase diagrams is presented later on
(Section 5. Examples of Phase Diagrams’) and shows examplesof the combined use of the Phase Diagram, Equilib and Figuremodules.
3.6. How the phase diagram module works
The possible types of phase diagram sections that may becalculated are based on a thermodynamically consistent theoryof generalized phase diagram mapping [14]. Similar to the rulesoutlined by Hillert [15] a set of simple rules has been derived thatdictate what axes and constants constitute a true phase diagram.The Zero Phase Fraction (ZPF) line principle was introduced byMorral and co-workers [16–18]. All true two-dimensional sectionsconsist of a collection of ZPF lines, one for each phase. The phaseappears on one side of its ZPF line and does not appear on theother, and the ZPF line either forms a closed loop inside the diagramor terminates at the edges of the diagram. In FactSage this hasbeen combined with the phase diagram rules in order to derivea strategy for the mapping of a complete phase diagram without
Fig. 25. Phase Diagram — Al–Mg–Sr Gibbs ternary polythermal projection. Top: Gibbs triangle thermographic display of the calculated liquidus surface and list of the4-phase intersection points. Bottom: XSr versus XAl thermographic display of the calculated liquidus surface. (For interpretation of the references to colour in this figurelegend, the reader is referred to the web version of this article.)
C.W. Bale et al. / CALPHAD: Computer Coupling of Phase Diagrams and Thermochemistry 33 (2009) 295–311 309
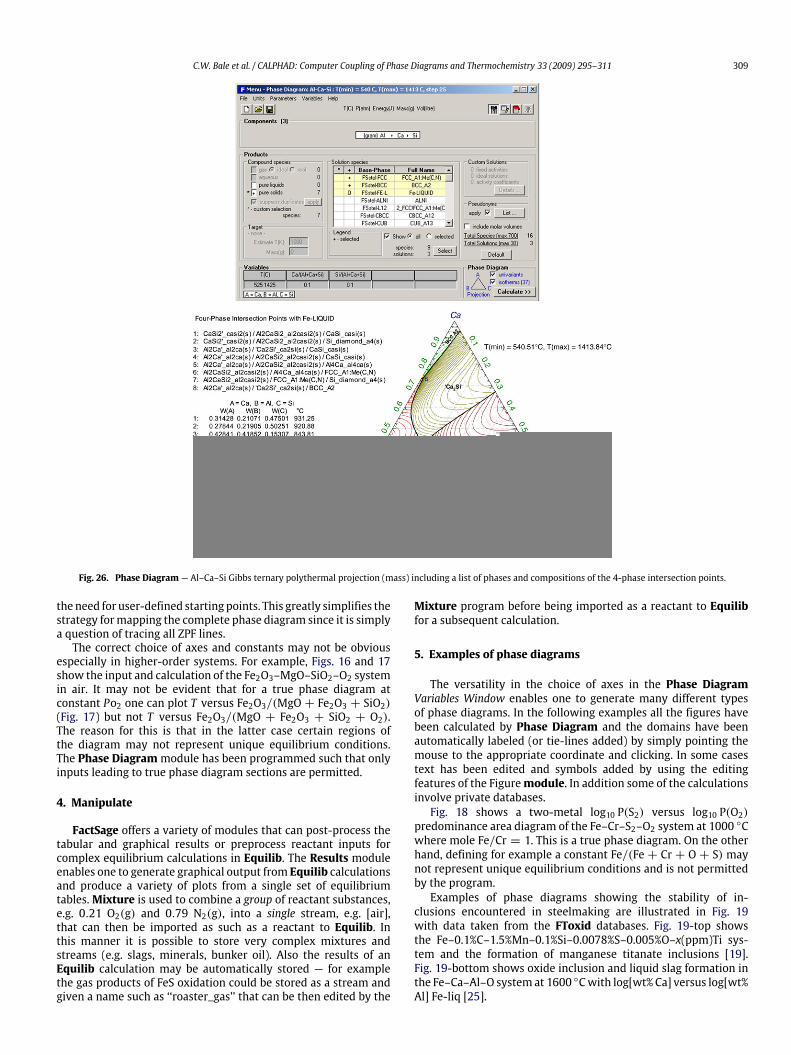
Fig. 26. Phase Diagram — Al–Ca–Si Gibbs ternary polythermal projection (mass) including a list of phases and compositions of the 4-phase intersection points.
the need for user-defined starting points. This greatly simplifies thestrategy formapping the complete phase diagram since it is simplya question of tracing all ZPF lines.The correct choice of axes and constants may not be obvious
especially in higher-order systems. For example, Figs. 16 and 17show the input and calculation of the Fe2O3–MgO–SiO2–O2 systemin air. It may not be evident that for a true phase diagram atconstant Po2 one can plot T versus Fe2O3/(MgO + Fe2O3 + SiO2)(Fig. 17) but not T versus Fe2O3/(MgO + Fe2O3 + SiO2 + O2).The reason for this is that in the latter case certain regions ofthe diagram may not represent unique equilibrium conditions.The Phase Diagrammodule has been programmed such that onlyinputs leading to true phase diagram sections are permitted.
4. Manipulate
FactSage offers a variety of modules that can post-process thetabular and graphical results or preprocess reactant inputs forcomplex equilibrium calculations in Equilib. The Results moduleenables one to generate graphical output from Equilib calculationsand produce a variety of plots from a single set of equilibriumtables.Mixture is used to combine a group of reactant substances,e.g. 0.21 O2(g) and 0.79 N2(g), into a single stream, e.g. [air],that can then be imported as such as a reactant to Equilib. Inthis manner it is possible to store very complex mixtures andstreams (e.g. slags, minerals, bunker oil). Also the results of anEquilib calculation may be automatically stored — for examplethe gas products of FeS oxidation could be stored as a stream andgiven a name such as ‘‘roaster_gas’’ that can be then edited by the
Mixture program before being imported as a reactant to Equilibfor a subsequent calculation.
5. Examples of phase diagrams
The versatility in the choice of axes in the Phase DiagramVariables Window enables one to generate many different typesof phase diagrams. In the following examples all the figures havebeen calculated by Phase Diagram and the domains have beenautomatically labeled (or tie-lines added) by simply pointing themouse to the appropriate coordinate and clicking. In some casestext has been edited and symbols added by using the editingfeatures of the Figuremodule. In addition some of the calculationsinvolve private databases.Fig. 18 shows a two-metal log10 P(S2) versus log10 P(O2)
predominance area diagram of the Fe–Cr–S2–O2 system at 1000 ◦Cwhere mole Fe/Cr = 1. This is a true phase diagram. On the otherhand, defining for example a constant Fe/(Fe + Cr + O + S) maynot represent unique equilibrium conditions and is not permittedby the program.Examples of phase diagrams showing the stability of in-
clusions encountered in steelmaking are illustrated in Fig. 19with data taken from the FToxid databases. Fig. 19-top showsthe Fe–0.1%C–1.5%Mn–0.1%Si–0.0078%S–0.005%O–x(ppm)Ti sys-tem and the formation of manganese titanate inclusions [19].Fig. 19-bottom shows oxide inclusion and liquid slag formation inthe Fe–Ca–Al–O system at 1600 ◦Cwith log[wt% Ca] versus log[wt%Al] Fe-liq [25].

310 C.W. Bale et al. / CALPHAD: Computer Coupling of Phase Diagrams and Thermochemistry 33 (2009) 295–311
Fig. 27. Phase Diagram — AlCl3–KCl–NaCl Gibbs ternary polythermal projectionof the liquidus surface.
For aqueous equilibria, a novel way of representing the phasediagrams is shown in Fig. 20 for the Cu–H2O–HCl–NaOH–H2system. The following conditions were set for the calculations: atotal of onemole of acid–basemixturewith a variablemole fractionis entered for definition of the x-axis; partial pressure H2 is usedfor the y-axis; 55.508 mol of water, i.e. 1 kg, is set as a constant;a constant molar amount relative to the given water amount isentered as molality of the metallic component.It should be noted that an increasing partial pressure of H2 on
the y-axis is inverse to the classical Eh value while an increasein mole fraction of the basic component of the acid–base pairdefines the same direction along the x-axis as an increase ofpH. It must also be noted that the resulting diagram is a truephase diagram containing an electroneutral aqueous phase. Thestability fields relate to the stable phases at equilibrium and not toparticular species, be they stable solids or species in the aqueousphase. The diagram therefore shows on the lower left (high acidityand low H2 potential, i.e. high Eh) the field of stability of thesingle phase water equilibrium while at higher mole fractions ofNaOH, i.e. high basicity and thus high pH, the precipitations ofCu-hydroxide, Cu-oxide and Cu-metal occur with increasing H2,i.e. decreasing Eh. This is all in accord with the classical Pourbaixdiagram for copper. More details of this type of representation aregiven elsewhere [20].The effect of pressure (1 bar and 1 GPa) on the CaO–SiO2 binary
system is shown in Fig. 21 where calculated phase boundaries arecompared with experimental data [21].The Gibbs ternary isothermal section of the Al–Mg–Sr system at
850 K with FACT data is shown in Figs. 22 and 23. In the VariablesWindow the Gibbs A–B–C triangle has been selected together withthe components of the A, B and C corners.A recent addition to the Phase Diagram module is the ability
to generate polythermal projections as illustrated for the liquidusprojection of the Al–Mg–Sr system in Figs. 24 and 25. In theVariables Window the ‘projection’ is selected as the temperaturevariable togetherwith optional values ofminimum,maximum andstep in temperature for the isotherms. If the optional temperaturesare not set then default values are automatically assigned bythe program. The Parameters Window (Fig. 24) includes a varietyof new options that control the type, format and display oflabels, compositions, phases, temperature units, color, etc. on thecalculated diagram. In the Menu Window the ‘liquid’ is designatedas ‘O’ (Only plot this phase) since the phase diagram will bea polythermal projection of the liquidus surface. At the bottom
Fig. 28. Phase Diagram — (LiCl)2–(LiF)2–CaF2–CaCl2 reciprocal polythermalprojection of the liquidus surface.
right of the Menu Window ‘invariants’ or ‘isotherms’ (both in thepresent case) are selected. The resulting thermographic Gibbsphase diagram (red hot lines at high temperatures, cold bluelines at low temperatures) is shown in Fig. 25 together with thecoordinates of the 4-phase intersection points. The thermographicscale on the right helps the reader to couple the colored isothermswith its corresponding temperature.The Mg-rich corner of the same Al–Mg–Sr phase diagram is
plotted as XSr vs. XAl in Fig. 26. Here the axes have been changed inVariablesWindow (Fig. 23) by selecting an X–Y diagram rather thanthe Gibbs A–B–C diagram.Figs. 26 and 27 show the Gibbs polythermal projections of
an alloy system, Al–Ca–Si, and a salt system, AlCl3–KCl–NaCl. Fora salt phase diagram it may be more practical to project thereciprocal systemas shown in Fig. 28 for (LiCl)2–(LiF)2–CaF2–CaCl2or Li+, Ca++//Cl−, F−.The last phase diagram (Fig. 29) is the Gibbs ternary thermo-
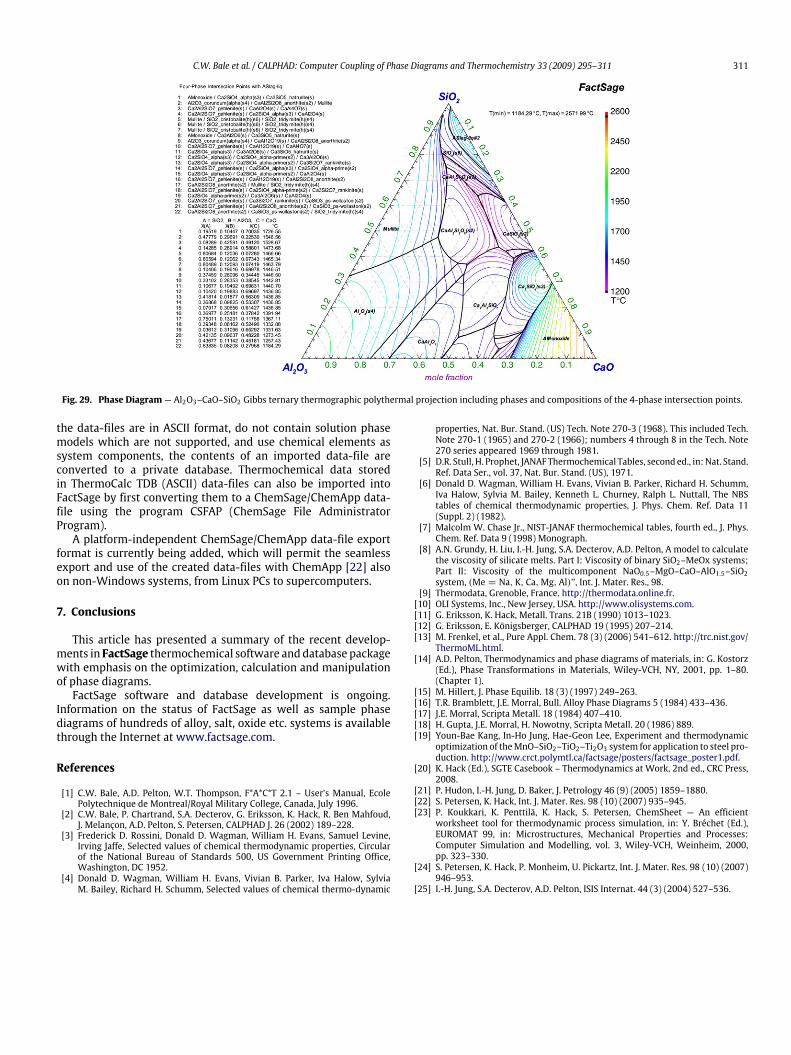
graphic polythermal projection of the Al2O3–CaO–SiO2 liquidussurface and includes the list of phases and compositions of the 4-phase intersection points. This ternary oxide is considered bymanypyrometallurgists to be themost important of all three-componentslags.It is should be noted that the Phase Diagram module requires
no starting values or initial estimates. All phase diagrams shownhere were calculated and plotted by simply clicking on the‘‘Calculate>>’’ button.
6. Other applications
Users of FactSage are able to export thermochemical datafor use with ChemApp [22] and any member of the FactSageFamily of Products built on ChemApp. This not only includesChemSheet [23] and SimuSage [24], but also opens the way forthese data to be used in third-party programs which use ChemAppas an add-on module, such as AspenPlus(R) and Fluent(R). Thethermochemical data are exported using the Equilib module(Menu window) to ChemSage/ChemApp data-files. Supported areall databases and solution models with the exception of the OLIdatabases.The opposite direction, i.e. the import of thermochemical data
from ChemSage/ChemApp data-files is also possible. Provided that
C.W. Bale et al. / CALPHAD: Computer Coupling of Phase Diagrams and Thermochemistry 33 (2009) 295–311 311
Fig. 29. Phase Diagram — Al2O3–CaO–SiO2 Gibbs ternary thermographic polythermal projection including phases and compositions of the 4-phase intersection points.
the data-files are in ASCII format, do not contain solution phasemodels which are not supported, and use chemical elements assystem components, the contents of an imported data-file areconverted to a private database. Thermochemical data storedin ThermoCalc TDB (ASCII) data-files can also be imported intoFactSage by first converting them to a ChemSage/ChemApp data-file using the program CSFAP (ChemSage File AdministratorProgram).A platform-independent ChemSage/ChemApp data-file export
format is currently being added, which will permit the seamlessexport and use of the created data-files with ChemApp [22] alsoon non-Windows systems, from Linux PCs to supercomputers.
7. Conclusions
This article has presented a summary of the recent develop-ments in FactSage thermochemical software anddatabase packagewith emphasis on the optimization, calculation and manipulationof phase diagrams.FactSage software and database development is ongoing.
Information on the status of FactSage as well as sample phasediagrams of hundreds of alloy, salt, oxide etc. systems is availablethrough the Internet at www.factsage.com.
References
[1] C.W. Bale, A.D. Pelton, W.T. Thompson, F*A*C*T 2.1 – User’s Manual, EcolePolytechnique de Montreal/Royal Military College, Canada, July 1996.
[2] C.W. Bale, P. Chartrand, S.A. Decterov, G. Eriksson, K. Hack, R. Ben Mahfoud,J. Melançon, A.D. Pelton, S. Petersen, CALPHAD J. 26 (2002) 189–228.
[3] Frederick D. Rossini, Donald D. Wagman, William H. Evans, Samuel Levine,Irving Jaffe, Selected values of chemical thermodynamic properties, Circularof the National Bureau of Standards 500, US Government Printing Office,Washington, DC 1952.
[4] Donald D. Wagman, William H. Evans, Vivian B. Parker, Iva Halow, SylviaM. Bailey, Richard H. Schumm, Selected values of chemical thermo-dynamic
properties, Nat. Bur. Stand. (US) Tech. Note 270-3 (1968). This included Tech.Note 270-1 (1965) and 270-2 (1966); numbers 4 through 8 in the Tech. Note270 series appeared 1969 through 1981.
[5] D.R. Stull, H. Prophet, JANAF Thermochemical Tables, second ed., in: Nat. Stand.Ref. Data Ser., vol. 37, Nat. Bur. Stand. (US), 1971.
[6] Donald D. Wagman, William H. Evans, Vivian B. Parker, Richard H. Schumm,Iva Halow, Sylvia M. Bailey, Kenneth L. Churney, Ralph L. Nuttall, The NBStables of chemical thermodynamic properties, J. Phys. Chem. Ref. Data 11(Suppl. 2) (1982).
[7] Malcolm W. Chase Jr., NIST-JANAF thermochemical tables, fourth ed., J. Phys.Chem. Ref. Data 9 (1998) Monograph.
[8] A.N. Grundy, H. Liu, I.-H. Jung, S.A. Decterov, A.D. Pelton, A model to calculatethe viscosity of silicate melts. Part I: Viscosity of binary SiO2–MeOx systems;Part II: Viscosity of the multicomponent NaO0.5–MgO–CaO–AlO1.5–SiO2system, (Me = Na,K, Ca,Mg,Al)’’, Int. J. Mater. Res., 98.
[9] Thermodata, Grenoble, France. http://thermodata.online.fr.[10] OLI Systems, Inc., New Jersey, USA. http://www.olisystems.com.[11] G. Eriksson, K. Hack, Metall. Trans. 21B (1990) 1013–1023.[12] G. Eriksson, E. Königsberger, CALPHAD 19 (1995) 207–214.[13] M. Frenkel, et al., Pure Appl. Chem. 78 (3) (2006) 541–612. http://trc.nist.gov/
ThermoML.html.[14] A.D. Pelton, Thermodynamics and phase diagrams of materials, in: G. Kostorz
(Ed.), Phase Transformations in Materials, Wiley-VCH, NY, 2001, pp. 1–80.(Chapter 1).
[15] M. Hillert, J. Phase Equilib. 18 (3) (1997) 249–263.[16] T.R. Bramblett, J.E. Morral, Bull. Alloy Phase Diagrams 5 (1984) 433–436.[17] J.E. Morral, Scripta Metall. 18 (1984) 407–410.[18] H. Gupta, J.E. Morral, H. Nowotny, Scripta Metall. 20 (1986) 889.[19] Youn-Bae Kang, In-Ho Jung, Hae-Geon Lee, Experiment and thermodynamic
optimization of theMnO–SiO2–TiO2–Ti2O3 system for application to steel pro-duction. http://www.crct.polymtl.ca/factsage/posters/factsage_poster1.pdf.
[20] K. Hack (Ed.), SGTE Casebook – Thermodynamics at Work, 2nd ed., CRC Press,2008.
[21] P. Hudon, I.-H. Jung, D. Baker, J. Petrology 46 (9) (2005) 1859–1880.[22] S. Petersen, K. Hack, Int. J. Mater. Res. 98 (10) (2007) 935–945.[23] P. Koukkari, K. Penttilä, K. Hack, S. Petersen, ChemSheet — An efficient
worksheet tool for thermodynamic process simulation, in: Y. Bréchet (Ed.),EUROMAT 99, in: Microstructures, Mechanical Properties and Processes:Computer Simulation and Modelling, vol. 3, Wiley-VCH, Weinheim, 2000,pp. 323–330.
[24] S. Petersen, K. Hack, P. Monheim, U. Pickartz, Int. J. Mater. Res. 98 (10) (2007)946–953.
[25] I.-H. Jung, S.A. Decterov, A.D. Pelton, ISIS Internat. 44 (3) (2004) 527–536.