plagioclase growth rates control three-grain junction ...eprints.esc.cam.ac.uk/3649/1/j....
TRANSCRIPT

Plagioclase Growth Rates Control Three-grain
Junction Geometry in Dolerites and Gabbros
Marian B. Holness
Department of Earth Sciences, University of Cambridge, Downing Street, Cambridge CB2 3EQ, UK
E-mail: [email protected]
Received May 8, 2015; Accepted October 27, 2015
ABSTRACT
Measurements of dihedral angles at three-grain junctions in gabbros, involving two grains ofplagioclase and one grain of another mineral, demonstrate that the median dihedral angle is gener-
ally the same for all minerals in any sample. The few exceptions to this can be attributed to reaction
or to the cessation of growth of plagioclase during the last stages of solidification of highly evolved
liquids that do not crystallize volumetrically important amounts of plagioclase. The dihedral angle
is therefore primarily controlled by the growth behavior of plagioclase in the last remaining liquid.
The final value of the dihedral angle is controlled by the extent to which plagioclase growth isaccommodated on the (010) faces: low angles form when growth on the (010) faces is minor
compared with that on the other growth faces, and high angles form when the (010) faces accom-
modate significant growth. The response of dihedral angles to changes in crystallization time is
therefore explained by the changing response of plagioclase growth to cooling rate, with limited
growth on (010) faces during rapid cooling (leading to a low dihedral angle) and more significant
growth at slow cooling (leading to high dihedral angle). The correspondence between dihedral
angle and plagioclase grain shape (as quantified by the average apparent aspect ratio observed inthin section) is clearly evident for non-fractionated bodies such as dolerite sills. Although the strati-
graphic variation of the overall plagioclase grain shape in the floor cumulates of the Skaergaard
Intrusion is broadly similar to that observed in sills, there is no correspondence to observed
augite–plagioclase–plagioclase dihedral angles, which show a step-wise stratigraphic variation,
corresponding to changes in the liquidus assemblage. This decoupling occurs because plagioclase
growth in layered intrusions occurs in two stages, the first at, or close to, the magma–mush inter-face and the second within the mush. Chemical maps of samples on either side of the augite-in
dihedral angle step demonstrate a step-wise change in the aspect ratio of the plagioclase grown
during the second stage, with the aspect ratio of this stage corresponding to that predicted from
the dihedral angles. Plagioclase shape in layered intrusions thus records two separate thermal re-
gimes, with the overall shape controlled by the global cooling rate of the intrusion, and the second
(minor) stage within the mushy layer reflecting local thermal buffering controlled by the liquidusassemblage of the bulk magma. Dihedral angles in layered intrusions record the second thermal
regime.
Key words: microstructure; plagioclase; dihedral angle; gabbro; dolerite; Skaergaard Intrusion;Bushveld Intrusion; Sept Iles Intrusion; Rum Intrusion
INTRODUCTION
Recent work has expanded the potential of microstruc-ture to provide quantitative constraints on the cooling
and crystallization history of basaltic intrusions by the
addition of two new parameters to the more usually
deployed crystal size distribution. One of these new
microstructural parameters is the geometry of three-grain junctions involving one grain of clinopyroxene
(augite) and two of plagioclase, as quantified by the me-
dian value of the clinopyroxene–plagioclase–plagioclase
VC The Author 2015. Published by Oxford University Press. 2117
This is an Open Access article distributed under the terms of the Creative Commons Attribution License (http://creativecommons.org/licenses/by/4.0/), which permits
unrestricted reuse, distribution, and reproduction in any medium, provided the original work is properly cited.
J O U R N A L O F
P E T R O L O G Y
Journal of Petrology, 2015, Vol. 56, No. 11, 2117–2144
doi: 10.1093/petrology/egv065
Advance Access Publication Date: 15 December 2015
Original Article
at Pendlebury Library of M
usic on April 28, 2016
http://petrology.oxfordjournals.org/D
ownloaded from

dihedral angle, Hcpp (e.g. Holness et al., 2012a, 2012b).
The other is the shape of plagioclase crystals, specifically
the average apparent aspect ratio as measured in thin
section (Holness, 2014).
Although we do not yet know precisely how it isachieved, and do not yet have quantitative experimental
data, the changing shape of plagioclase with cooling
rate or extent of supercooling [previously reported by
Cashman (1992)] is familiar to any petrologist. It is
clearly illustrated by comparison of the blocky shape of
plagioclase phenocrysts in basaltic volcanic rocks with
the generally more platy grains in the groundmass. Thechanging shape of plagioclase can be simply under-
stood in terms of differences in the response of the dif-
ferent faces to changes in growth conditions (e.g.
Cashman, 1992; Hammer et al., 1999; Higgins, 2006). In
contrast, the mechanism controlling the response of
three-grain junction geometry to changing cooling rate,resulting in the observed systematic variation of dihe-
dral angles within and between mafic intrusions, is not
known. There is only scarce published work in either
the materials science or geological sciences literature
addressing the mechanisms and processes of grain
junction formation, and no theoretical framework uponwhich to build. So far, all progress in understanding this
phenomenon has been made by careful and exhaustive
observation of natural examples of three-grain junction
formation in mafic rocks (e.g. Holness et al., 2012a). In
this contribution I present a further series of detailed
observations, leading to the hypothesis that the funda-
mental underlying control on the geometry of three-grain junctions, and hence on Hcpp, is the change in
relative rates of growth of the different faces of plagio-
clase in response to changes in cooling rate.
PREVIOUS WORK
Variation in the median dihedral angle, Hcpp
The observed values of Hcpp range between 78� and a
maximum of 105� in basaltic crustal intrusions. These
are lower than the value of 109� observed for fully
equiIibrated microstructures (Holness, 2010; Holness
et al., 2012a), pointing to the generally disequilibrium
nature of microstructures in gabbros and dolerites. Thegeometry of three-grain junctions in the great majority
of studied gabbros and dolerites is essentially unmodi-
fied from the initial geometry created during solidifica-
tion (the ‘igneous process’ of dihedral angle formation;
Holness et al., 2012a).
Hcpp varies symmetrically in essentially non-fractio-
nated dolerite sills, with the highest values in the centre(Holness et al., 2012b) (Fig. 1). The dihedral angle maps
directly onto the time taken to crystallize at any point
within the sill, providing a robust and sensitive speed-
ometer for timescales of 10–1000 years (Holness et al.,
2012b). In the most rapidly cooled dolerites, three-grain
junctions are characterized by planar augite–plagioclasegrain boundaries (Fig. 2a and b). The almost perfect
pseudomorphing by augite of the original melt-filled
space attests to the rapid growth of augite relative to
that of the (010) growth faces of the plagioclase that gen-erally bound the melt-filled pore. The narrower junc-
tions, with the lowest impingement angles between the
two plagioclase grains, are commonly filled with glass
or very fine-grained intergrowths crystallized from late-
stage liquid (Fig. 2a and b). Because the narrowest junc-
tions are not filled with augite, the median value of Hcpp
in rapidly cooled rocks is higher (�78�) than the value of
60� expected for perfect pseudomorphing of all pores
formed by randomly impinging plagioclase grains.
Those samples in which Hcpp> 78� show curvature of
the augite–plagioclase grain boundaries in the vicinity of
the three-grain junction, indicative of simultaneous
growth of the plagioclase forming the walls of the porein which the augite is growing (Fig. 2c and d). The in-
crease in Hcpp is therefore achieved by a change in the
relative rate of growth of the plagioclase pore walls and
the infilling augite during the final stages of solidification
(Holness et al., 2012a).
In fractionated bodies such as layered intrusions,Hcpp varies in a fundamentally different way, exhibiting
a constant value over great stretches of stratigraphy fol-
lowed by discrete step-wise changes associated with
changes in the liquidus assemblage (Fig. 3a). Hcpp in-
creases when the number of phases in the assemblage
Fig. 1. The variation of Hcpp with stratigraphic height in doleritesills. Data from Holness et al. (2012b), with the addition of datafor the Traigh Bhan na Sgurra sill (shown in Table 1).
2118 Journal of Petrology, 2015, Vol. 56, No. 11
at Pendlebury Library of M
usic on April 28, 2016
http://petrology.oxfordjournals.org/D
ownloaded from

increases, with a corresponding decrease when the
liquidus assemblage loses a phase (Holness et al.,2013a). This behavior has been ascribed to step-wise
changes in the cooling rate caused by changes in the la-
tent heat of crystallization (Morse, 2011; Holness et al.,
2013a). Because the formation of three-grain junctions
occurs during the last stages of solidification, Hcpp is
therefore providing information about solidification at
or near the base of the crystal mushy layer (Holnesset al., 2012a).
An exception to the generally observed step-wise be-
havior of Hcpp in layered intrusions is found in the
upper parts of the floor cumulates of the Skaergaard
Intrusion, East Greenland. In these highly evolved, and
last to crystallize, cumulates, which one might expect tohave had the slowest crystallization rate, Hcpp is �78�, a
value typical of rapidly cooled dolerites (Holness et al.,
2007b, 2013a). Importantly, in contrast to stratigraphic-
ally lower, high-Hcpp samples (Fig. 4a), the grain boun-
daries between (ferro-)augite and plagioclase in these
more evolved cumulates are not curved in the vicinity
of the three-grain junction but are planar, like those
seen in rapidly cooled dolerites (Fig. 4b). Many of the
narrower junctions between plagioclase grains are filledwith granophyre (Fig. 4c and d), again similar to doler-
ites. These microstructural characteristics, coupled with
the much greater grain size typical of slowly cooled
gabbros, suggest the term ‘macro-dolerite’ to differenti-
ate these rocks from less-evolved cumulates with high
Hcpp. The macro-dolerite microstructure has been
attributed by Holness et al. (2013a) to cessation ofplagioclase growth during the final stages of solidifica-
tion at the base of the mushy layer. The growth behav-
ior of plagioclase therefore appears to play a vital role
in determining Hcpp. This is supported by the observa-
tion of Holness et al. (2012b, 2013a) that the dihedral
angle population is the same for low-Ca pyroxene andCa-rich pyroxene in the same sample: the composition
and mineral structure of the second phase (at least in
the pyroxene group of minerals) appears to be imma-
terial to the final dihedral angle population.
Because the population of dihedral angles preserved
in mafic intrusions is not in textural equilibrium, the
range of angles in any one sample is some function of
Fig. 2. (a) A coarse-grained, glass-rich vein from the crust of the Kilauea Iki lava lake. Although many of the plagioclase–plagioclasejunctions have been filled with augite, many still contain glass (asterisk). It should be noted how the plagioclase–augite grain boun-daries are planar at the junctions (arrows). The value of Hcpp in this sample is �78�. Sample KI76-140.3, plane-polarized light. Thescale bar is 1 mm long. (b) Sample ROM48-219 from the Traigh Bhan na Sgurra sill, in which Hcpp is 78�5 6 4�5� (Table 1). Theaugite–plagioclase grain boundaries are planar where they meet to form three-grain junctions (arrowed), whereas the narrowerjunctions between impinging plagioclase grains are filled with (partially devitrified) glass (asterisks). Plane-polarized light. Scalebar is 200mm long. (c, d) A glass-rich vein from the crust of the Kilauea Iki lava lake (sample KI76-143.3), showing the developmentof slight curvature of the left-hand augite–plagioclase grain boundary at the three-grain junction (arrowed) [(c) plane-polarized light;(d) crossed polars of the same field of view as (c)]. The scale bar is 1 mm long.
Journal of Petrology, 2015, Vol. 56, No. 11 2119
at Pendlebury Library of M
usic on April 28, 2016
http://petrology.oxfordjournals.org/D
ownloaded from
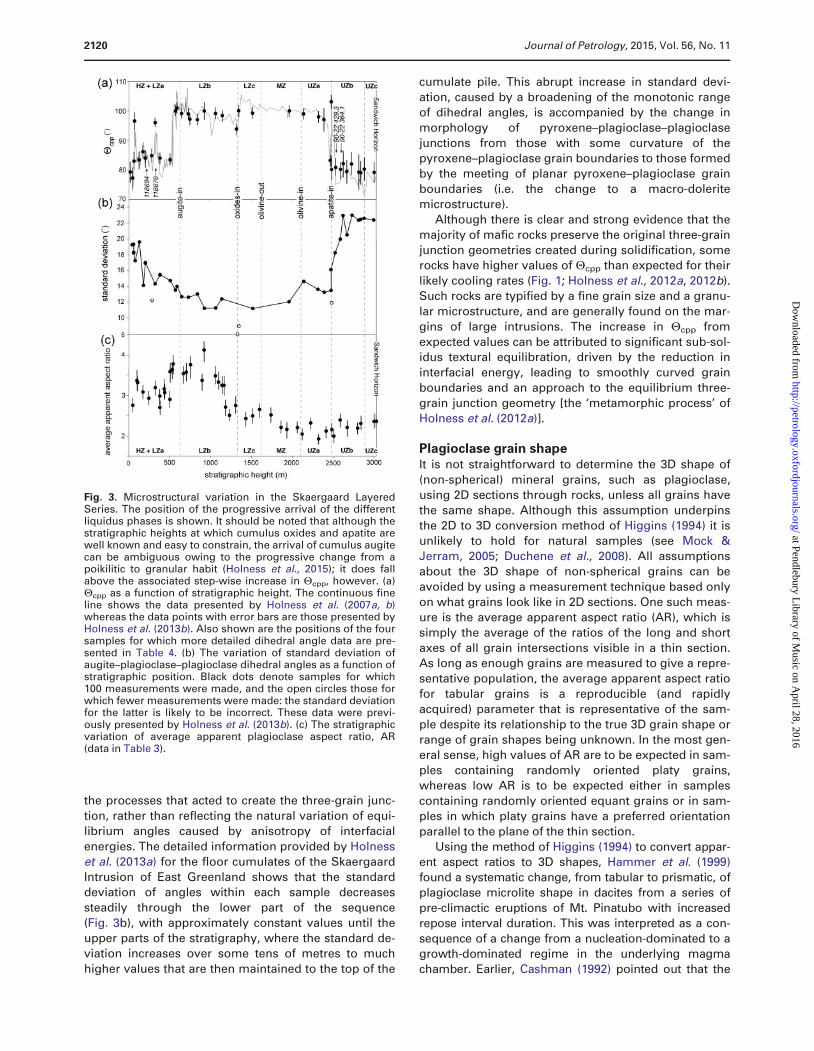
the processes that acted to create the three-grain junc-
tion, rather than reflecting the natural variation of equi-
librium angles caused by anisotropy of interfacial
energies. The detailed information provided by Holness
et al. (2013a) for the floor cumulates of the Skaergaard
Intrusion of East Greenland shows that the standarddeviation of angles within each sample decreases
steadily through the lower part of the sequence
(Fig. 3b), with approximately constant values until the
upper parts of the stratigraphy, where the standard de-
viation increases over some tens of metres to much
higher values that are then maintained to the top of the
cumulate pile. This abrupt increase in standard devi-
ation, caused by a broadening of the monotonic range
of dihedral angles, is accompanied by the change in
morphology of pyroxene–plagioclase–plagioclase
junctions from those with some curvature of thepyroxene–plagioclase grain boundaries to those formed
by the meeting of planar pyroxene–plagioclase grain
boundaries (i.e. the change to a macro-dolerite
microstructure).
Although there is clear and strong evidence that the
majority of mafic rocks preserve the original three-grain
junction geometries created during solidification, somerocks have higher values of Hcpp than expected for their
likely cooling rates (Fig. 1; Holness et al., 2012a, 2012b).
Such rocks are typified by a fine grain size and a granu-
lar microstructure, and are generally found on the mar-
gins of large intrusions. The increase in Hcpp from
expected values can be attributed to significant sub-sol-idus textural equilibration, driven by the reduction in
interfacial energy, leading to smoothly curved grain
boundaries and an approach to the equilibrium three-
grain junction geometry [the ‘metamorphic process’ of
Holness et al. (2012a)].
Plagioclase grain shapeIt is not straightforward to determine the 3D shape of
(non-spherical) mineral grains, such as plagioclase,
using 2D sections through rocks, unless all grains have
the same shape. Although this assumption underpins
the 2D to 3D conversion method of Higgins (1994) it is
unlikely to hold for natural samples (see Mock &Jerram, 2005; Duchene et al., 2008). All assumptions
about the 3D shape of non-spherical grains can be
avoided by using a measurement technique based only
on what grains look like in 2D sections. One such meas-
ure is the average apparent aspect ratio (AR), which is
simply the average of the ratios of the long and short
axes of all grain intersections visible in a thin section.As long as enough grains are measured to give a repre-
sentative population, the average apparent aspect ratio
for tabular grains is a reproducible (and rapidly
acquired) parameter that is representative of the sam-
ple despite its relationship to the true 3D grain shape or
range of grain shapes being unknown. In the most gen-eral sense, high values of AR are to be expected in sam-
ples containing randomly oriented platy grains,
whereas low AR is to be expected either in samples
containing randomly oriented equant grains or in sam-
ples in which platy grains have a preferred orientation
parallel to the plane of the thin section.
Using the method of Higgins (1994) to convert appar-ent aspect ratios to 3D shapes, Hammer et al. (1999)
found a systematic change, from tabular to prismatic, of
plagioclase microlite shape in dacites from a series of
pre-climactic eruptions of Mt. Pinatubo with increased
repose interval duration. This was interpreted as a con-
sequence of a change from a nucleation-dominated to agrowth-dominated regime in the underlying magma
chamber. Earlier, Cashman (1992) pointed out that the
Fig. 3. Microstructural variation in the Skaergaard LayeredSeries. The position of the progressive arrival of the differentliquidus phases is shown. It should be noted that although thestratigraphic heights at which cumulus oxides and apatite arewell known and easy to constrain, the arrival of cumulus augitecan be ambiguous owing to the progressive change from apoikilitic to granular habit (Holness et al., 2015); it does fallabove the associated step-wise increase in Hcpp, however. (a)Hcpp as a function of stratigraphic height. The continuous fineline shows the data presented by Holness et al. (2007a, b)whereas the data points with error bars are those presented byHolness et al. (2013b). Also shown are the positions of the foursamples for which more detailed dihedral angle data are pre-sented in Table 4. (b) The variation of standard deviation ofaugite–plagioclase–plagioclase dihedral angles as a function ofstratigraphic position. Black dots denote samples for which100 measurements were made, and the open circles those forwhich fewer measurements were made: the standard deviationfor the latter is likely to be incorrect. These data were previ-ously presented by Holness et al. (2013b). (c) The stratigraphicvariation of average apparent plagioclase aspect ratio, AR(data in Table 3).
2120 Journal of Petrology, 2015, Vol. 56, No. 11
at Pendlebury Library of M
usic on April 28, 2016
http://petrology.oxfordjournals.org/D
ownloaded from

average apparent aspect ratio for plagioclase in the
groundmass of Mount St. Helens dacite decreased
with an assumed decrease in undercooling, and Higgins
(1994) proposed that plagioclase becomes more platy
(which would lead to higher values of AR) in situ-ations where there is a high chemical potential gradient
around the growing crystal. Higgins & Chandrasekharam
(2007) developed this concept and suggested that plagio-
clase departs further from an equant habit (leading to
higher AR) as the velocity of liquid flowing past the
growing crystal increases. Thus highly tabular or platy
grains are expected have grown in strongly convectingmagmas.
Variation of plagioclase shape was put into a spatial
and temporal context by Holness (2014), who showed
that AR for plagioclase varies systematically across
dolerite sills and in basaltic lava lakes (Fig. 5). In gen-
eral, the lowest values of AR (expected to be generallyassociated with relatively equant grains, as the plagio-
clase grains are randomly oriented) are seen in the
centres of sills. Furthermore, when sills of different
thickness are compared, it is found that AR maps onto
the crystallization time (calculated assuming diffusive
heat transport): thus the highest values of AR (and
greater departure from an equant shape) are observed
in thin sills, and the lowest values are observed in thicksills. Because convection is expected to be strongest in
thicker sills, this demonstrates that plagioclase grain
shape in these bodies is not a function of convective
vigour (see Higgins & Chandrasekharam, 2007), but is
controlled by the differing response of the growth faces
to undercooling (see Cashman, 1992).
In dolerite sills and layered intrusions, plagioclase isgenerally tabular, with the large faces parallel to (010).
The high AR (and generally platy shape) of plagioclase
in rapidly cooled dolerites is therefore a consequence of
the (010) faces growing more slowly than the (100) and
(001) faces. As the cooling rate is reduced, the (010)
faces grow at a rate closer to that of the (100) and (001)faces, resulting in a more equant shape and a lower AR.
In detail, AR variation forms an M-shaped profile
across sills and lava lakes, with lower than expected
Fig. 4. Photomicrographs of microstructural features of the Skaergaard Layered Series. (a) Augite–plagioclase–plagioclase junctionwith pronounced curvature of the two augite–plagioclase grain boundaries, leading to a higher dihedral angle than that formed bythe original impingement of the two plagioclase grains. Sample 458285 (LZc) described by Tegner et al. (2009). Cross polars. Scalebar is 200mm long. (b) Sample 90-22 40.9 (UZb) from the 90-22 drill core. The planar augite–plagioclase grain boundaries forming alow dihedral angle should be noted. To the left of the image is a pocket of late-stage liquid that has crystallized to form a grain ofapatite (ap), with quartz (qtz) and granophyre. The plagioclase walls of this pocket have not grown significantly and remain planar.Scale bar is 200mm long. (c) Sample 90-22 47.7 (UZb) from the 90-22 drill core. The grain of augite has not grown into the narrowpore formed by the impingement of two plagioclase grains. Instead the pore has filled with granophyre. The planar walls boundingthis pore, attesting to minimal growth of plagioclase subsequent to impingement, should be noted. Crossed polars. Scale bar is200mm long. (d) Sample 90-22 87.7 (UZb) from the 90-22 drill core, showing abundant pockets of granophyre (arrowed). The gener-ally low aspect ratio of the cumulus plagioclase should also be noted. Crossed polars. Scale bar is 1 mm long.
Journal of Petrology, 2015, Vol. 56, No. 11 2121
at Pendlebury Library of M
usic on April 28, 2016
http://petrology.oxfordjournals.org/D
ownloaded from

values at the roof and floor (Fig. 5). This has been attrib-
uted to the higher nucleation density in the most rapidly
cooled parts of the body, resulting in early impinge-ment of plagioclase grains, which can continue to grow
only by becoming wider rather than longer (Holness,
2014).
There is no relationship between the AR and Hcpp in
the marginal samples of sills. For the thinner sills, the
M-shape variation of AR is not reflected in Hcpp, which
decreases smoothly down to the margins. For thosethicker sills in which sub-solidus textural equilibration
has been significant (resulting in higher than expected
Hcpp in the marginal samples as seen, for example, at
the floor of the Basement Sill, Fig. 1), the geometry of
three-grain junctions has been modified whereas the
overall shape of the plagioclase grains has not. This issimply because textural equilibration begins with the
establishment of the equilibrium dihedral angle,
whereas the continued reduction of internal energies
achieved by a change of grain shape to a granular
microstructure requires much longer times, particularly
in polymineralic materials.
HYPOTHESIS
Previously published studies have demonstrated that,in the absence of significant sub-solidus textural equili-
bration, the median augite–plagioclase–plagioclase
dihedral angle in a sample from an essentially unfrac-
tionated mafic body is a function of the time it took to
crystallize (Holness et al., 2012b). Furthermore, thepopulation of dihedral angles formed at the junctions of
two plagioclase grains and a pyroxene grain is the
same regardless of the composition or crystal structure
of the pyroxene (Holness et al., 2012b, 2013a). This sug-
gests that whatever is controlling the way dihedral
angles at plagioclase junctions respond to changes in
crystallization time is something that primarily affectsplagioclase. A significant further observation is that the
shape of plagioclase grains in dolerites is controlled by
the cooling rate, with platy grains common in rapidly
cooled dolerites whereas more blocky grains dominate
in slowly cooled dolerites.
Although Hcpp is the median of a population ofangles formed at junctions between impinging plagio-
clase grains with random orientations, the majority of
dihedral angles measured in thin section, particularly in
dolerites in which plagioclase has no preferred orienta-
tion, are formed by the infilling of pores created by the
impingement of the (010) faces of the two plagioclasegrains. A high dihedral angle is a consequence of sig-
nificant growth of these (010) faces during the forma-
tion of the three-grain junction (i.e. during the last
stages of solidification). If a relatively high proportion of
the volume of crystallizing plagioclase is added to (010)
faces, then the final median value of the dihedral angle
Fig. 5. The variation of average apparent aspect ratio (AR) of plagioclase across two sills and the prehistoric Makaopuhi lava lake(from Holness, 2014). The shaded band in the Makaopuhi plot shows the position of the highest olivine mode, assumed to repre-sent the slowest cooled horizon (Evans & Moore, 1968). The circled data points denote marginal samples with low average appa-rent aspect ratios (see Fig. 9).
2122 Journal of Petrology, 2015, Vol. 56, No. 11
at Pendlebury Library of M
usic on April 28, 2016
http://petrology.oxfordjournals.org/D
ownloaded from

will be high (Fig. 6a and c). A generally low dihedral
angle is formed if the (010) faces do not grow appre-
ciably so that the melt-filled pore is effectively filled en-
tirely by the mafic mineral (Fig. 6b and d).
If the critical variable is the proportion of plagioclase
volume added to the (010) faces relative to thatbeing added to the other growth faces for every vol-
ume increment of solidification (i.e. the increase in the
total volume of solids), then the growth rate of the
mafic mineral is immaterial. Therefore, although there is
a wide variation of the orientations of impinging plagio-
clase grains, and of the geometry of the junctions formedby this impingement, the behavior of (010) faces has a
dominant effect on the median value of the final popula-
tion. This leads to the hypothesis that the underlying con-
trol on the systematic variation of Hcpp is the response of
plagioclase growth faces to changes in cooling rate. In
this contribution this hypothesis is tested by a detailed
investigation of the relationship between plagioclasegrowth behavior and dihedral angle populations in a
wide variety of mafic igneous bodies.
MEASUREMENT TECHNIQUES
True dihedral angles were measured using a four-axis
Leitz universal stage mounted on a James Swift mon-
ocular optical microscope, with a UM32 Leitz objective
and a 10� eyepiece. The median value of a population
of angles can be determined satisfactorily for a min-
imum of 25 measurements (Riegger & van Vlack, 1960),
although reduction of the uncertainty on the median to
<64–5� generally requires more than 50 measurements
for those samples with a wide range of true angles
(Holness, 2010). Tight constraints can be placed on the
standard deviation of dihedral angle only as the popula-
tion approaches 100 (Holness, 2010). Accurately con-
straining the skew of the population (the third moment)
requires many more than 100 measurements. For each
sample, up to 100 measurements were made, although
for some only �25 measurements were possible.
Quoted uncertainties are the 2r confidence intervals
about the median calculated according to the method of
Stickels & Hucke (1964).
Fig. 6. The effects of changing the relative growth rates of augite and plagioclase on the final geometry of the three-grain junction.(a, b) Glassy olivine gabbro nodules entrained in an Icelandic lava flow. Scale bars in both images are 200mm long. (a) The olivine–plagioclase grain boundaries close to the remaining pockets of glass are curved, denoting simultaneous growth of the olivine andplagioclase (010) faces. If this were to continue the resultant olivine–plagioclase–plagioclase dihedral angle would be higher thanthat of the original impingement angle between the plagioclase grains (c). In (b) the olivine grain appears to be growing into themelt-filled pore formed by the impingement of two plagioclase grains with no associated growth of the plagioclase walls. Were thisto continue, the resultant olivine–plagioclase–plagioclase dihedral angle would be the same as that of the original impingementangle (d).
Journal of Petrology, 2015, Vol. 56, No. 11 2123
at Pendlebury Library of M
usic on April 28, 2016
http://petrology.oxfordjournals.org/D
ownloaded from
Average apparent aspect ratios for plagioclase were
determined from images of thin sections, following the
procedure of Holness (2014). The finer-grained samples
were imaged using a camera mounted on an optical
microscope, and images of the coarser-grained sam-ples were obtained with a high-resolution scanner using
two polaroid sheets. The long and short axes on each
grain in any given image were drawn on by hand, and
the aspect ratio was determined using ImageJ.
Between 115 and 306 grains were measured for each
sample. The 2r uncertainties on the average apparent
aspect ratio were determined using a bootstrap methodbased on random sampling of the measurement
population.
QEMSCAN (quantitative evaluation of minerals by
scanning electron microscopy) images were obtained
for two Skaergaard gabbros using a Quanta 650 F field
emission gun (FEG) scanning electron microscope(SEM), equipped with two Bruker XFlash 6130 energy
dispersive spectrometers (EDS) at the Department of
Earth Sciences, University of Cambridge. The fully auto-
mated system includes an automated spectrum acquisi-
tion and classification procedure. Analyses were
performed by obtaining field-scans, providing a com-plete characterization of particle surfaces above a pre-
defined electron backscatter threshold. In this study the
threshold was set to values above the backscatter coef-
ficient of resin, therefore effectively allowing the instru-
ment to ignore the resin in the sample during the scan.
The brightness coefficients were calibrated against
quartz, gold and copper. Spectra were collected at 25 kVand 10 nA with 2000 total X-ray counts at a 7�5 mm spac-
ing, and compared with a species identification protocol
(SIP) that discriminates between minerals on the basis
of their characteristic X-ray and electron backscatter
intensities.
The QEMSCAN images were used to create maps ofCa concentration, to distinguish between plagioclase
grain cores and rims. The division between core and
rim was placed at An62, the average composition for
plagioclase cores in the samples, with the rim having
lower anorthite content. Apparent aspect ratios were
obtained by measuring the long and short axes of 100
grains per sample, with two sets of measurements foreach grain, one for the overall shape and the other for
the compositionally unzoned grain core.
PETROGRAPHIC OBSERVATIONS OF MAFICINTRUSIONS
Progress towards understanding the systematic vari-ation of Hcpp in mafic intrusions can be made only by
careful observation of natural examples, documenting
the way in which Hcpp varies in a wide range of settings
to constrain the controlling parameters. This contribu-
tion involves a return to the group of small bodies that
were the focus of earlier work by Holness et al. (2012b,2013b) and Holness (2014) on the effects of cooling rate
on microstructure: the Traigh Bhan na Sgurra, Whin,
Portal Peak, Koffiefontein and Basement sills, the pre-
historic Makaopuhi lava lake, and the Skaergaard
Campsite dykes; the reader is referred to these publica-
tions for background details of the general geological
setting, and for the source of the previously publishedmicrostructural data, some of which is reproduced in
Figs 1 and 5. Whereas AR data have previously been re-
ported for all of these bodies (Holness, 2014), Hcpp data
have been published only for the Traigh Bhan na
Sgurra, Whin, Portal Peak and Basement sills (Holness
et al., 2012b), and for the Campsite Dykes (Holness
et al., 2013b). For the present study Hcpp data were col-lected for the Koffiefontein sill and the prehistoric
Makaopuhi lava lake, with further data collected from
the Traigh Bhan na Sgurra sill (Table 1).
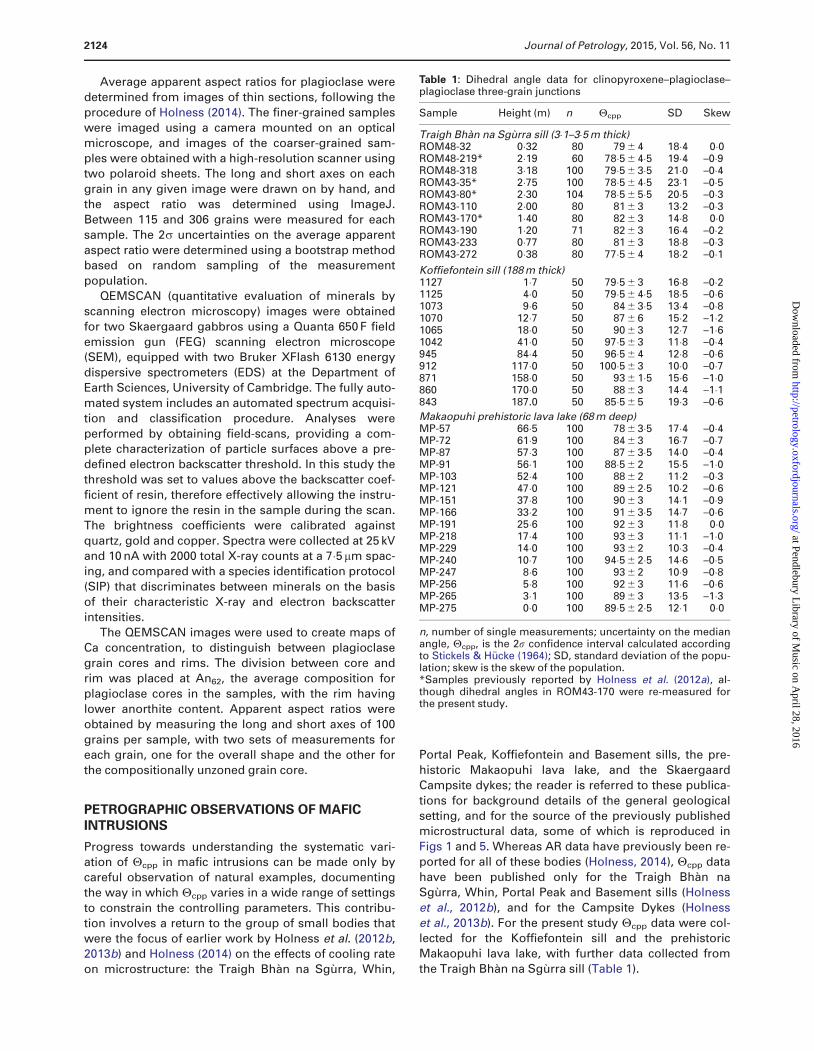
Table 1: Dihedral angle data for clinopyroxene–plagioclase–plagioclase three-grain junctions
Sample Height (m) n Hcpp SD Skew
Traigh Bhan na Sgurra sill (3�1–3�5 m thick)ROM48-32 0�32 80 79 6 4 18�4 0�0ROM48-219* 2�19 60 78�5 6 4�5 19�4 –0�9ROM48-318 3�18 100 79�5 6 3�5 21�0 –0�4ROM43-35* 2�75 100 78�5 6 4�5 23�1 –0�5ROM43-80* 2�30 104 78�5 6 5�5 20�5 –0�3ROM43-110 2�00 80 81 6 3 13�2 –0�3ROM43-170* 1�40 80 82 6 3 14�8 0�0ROM43-190 1�20 71 82 6 3 16�4 –0�2ROM43-233 0�77 80 81 6 3 18�8 –0�3ROM43-272 0�38 80 77�5 6 4 18�2 –0�1Koffiefontein sill (188 m thick)1127 1�7 50 79�5 6 3 16�8 –0�21125 4�0 50 79�5 6 4�5 18�5 –0�61073 9�6 50 84 6 3�5 13�4 –0�81070 12�7 50 87 6 6 15�2 –1�21065 18�0 50 90 6 3 12�7 –1�61042 41�0 50 97�5 6 3 11�8 –0�4945 84�4 50 96�5 6 4 12�8 –0�6912 117�0 50 100�5 6 3 10�0 –0�7871 158�0 50 93 6 1�5 15�6 –1�0860 170�0 50 88 6 3 14�4 –1�1843 187.0 50 85�5 6 5 19�3 –0�6Makaopuhi prehistoric lava lake (68 m deep)MP-57 66�5 100 78 6 3�5 17�4 –0�4MP-72 61�9 100 84 6 3 16�7 –0�7MP-87 57�3 100 87 6 3�5 14�0 –0�4MP-91 56�1 100 88�5 6 2 15�5 –1�0MP-103 52�4 100 88 6 2 11�2 –0�3MP-121 47�0 100 89 6 2�5 10�2 –0�6MP-151 37�8 100 90 6 3 14�1 –0�9MP-166 33�2 100 91 6 3�5 14�7 –0�6MP-191 25�6 100 92 6 3 11�8 0�0MP-218 17�4 100 93 6 3 11�1 –1�0MP-229 14�0 100 93 6 2 10�3 –0�4MP-240 10�7 100 94�5 6 2�5 14�6 –0�5MP-247 8�6 100 93 6 2 10�9 –0�8MP-256 5�8 100 92 6 3 11�6 –0�6MP-265 3�1 100 89 6 3 13�5 –1�3MP-275 0�0 100 89�5 6 2�5 12�1 0�0
n, number of single measurements; uncertainty on the medianangle, Hcpp, is the 2r confidence interval calculated accordingto Stickels & Hucke (1964); SD, standard deviation of the popu-lation; skew is the skew of the population.*Samples previously reported by Holness et al. (2012a), al-though dihedral angles in ROM43-170 were re-measured forthe present study.
2124 Journal of Petrology, 2015, Vol. 56, No. 11
at Pendlebury Library of M
usic on April 28, 2016
http://petrology.oxfordjournals.org/D
ownloaded from

To this group are added examples from four maficlayered intrusions: the Skaergaard Intrusion (East
Greenland), the Upper Zone of the Bushveld Complex
(South Africa), the Eastern Layered Intrusion of Rum
(Inner Hebrides, Scotland), and the Sept Iles Intrusion
(Quebec, Canada). Each of these intrusions has a gener-
ally basaltic composition, but with distinctly different li-quid lines of descent [a summary of which has been
given by Holness et al. (2013a)]. Dihedral angle data for
augite–plagioclase–plagioclase junctions in all samples
have previously been documented (Holness et al.,
2007a, 2007b, 2013a). Published datasets for Hcpp from
the upper part of the Skaergaard Layered Series wereaugmented by adding further measurements to create
the larger populations necessary to reduce the 95% con-
fidence intervals about the median value (Table 2).
Samples were chosen for which the greatest number
of possible phases formed three-grain junctions with
plagioclase, covering a large stratigraphic range and
range of Hcpp. Dihedral angles were measured at junc-tions between two plagioclase grains and a range of
other minerals including augite, low-Ca pyroxene
(orthopyroxene), amphibole, biotite and olivine,
regardless of whether the mafic phase is interstitial or
cumulus. No attempt was made to measure Fe–Ti
oxide–plagioclase–plagioclase junctions because theopacity of the oxide in thin sections of standard thick-
ness prevents determination of the orientation of
the grain boundaries. Olivine–plagioclase–plagioclase
dihedral angles were commonly difficult to measure ac-
curately because of late-stage hydrous alteration of the
edges of the olivine grains. Apatite–plagioclase–
plagioclase angles were not measured because therewas insufficient apatite in any sample to produce satis-
factory numbers of measurements. However, note was
taken of the morphology of interstitial apatite grains.
Sills, dykes and lava lakesHcpp data from samples of the Koffiefontein sill and the
prehistoric Makaopuhi lava lake are given in Table 1
and shown in Fig. 7. The dataset for the Traigh Bhan naSgurra sill [for which some data were presented by
Holness et al. (2012b)] is also given in Table 1.
Fig. 7. The stratigraphic variation of Hcpp in the Koffiefonteinsill and the prehistoric Makaopuhi lava lake. The data are pre-sented in Table 1.
Fig. 8. The augite–plagioclase–plagioclase dihedral angle as afunction of the original angle at which the two plagioclasegrains impinged. The 100 junctions were measured in sample87-110 from the Portal Peak sill. The two orthogonal lines showthe median values of the two separate populations. The 1:1slope is also shown.
Table 2: Dihedral angle data for clinopyroxene–plagioclase–plagioclase three-grain junctions in the 90-22 drill core
Sample n Hcpp SD Skew
90-22 585.8 100 97 6 2�5 13�3 �0�890-22 563.3 50 96 6 2 14�2 �1�090-22 530.9 50 94 6 4 11�2 �0�390-22 490.8 32 92�5 6 4 9�8 �0�490-22 487.15 50 91 6 3 11�7 �0�490-22 486.05 40 88 6 2�5 12�7 �2�490-22 485 100 80 6 4 13�5 0�590-22 483.3 100 83 6 2�5 16�1 �1�290-22 482.2 30 82 6 3 7�0 1�190-22 480.1 50 82 6 2 12�4 0�390-22 478.2 50 83 6 3 8�2 0�690-22 477.1 50 84�5 6 2 12�0 0�090-22 475.5 50 90 6 2 8�6 �1�890-22 475 50 103 6 2�5 12�0 �0�790-22 471.8 50 96�5 6 3 14�0 2�390-22 466.97 50 95 6 2 10�7 �0�590-22 461.8 50 89 6 5 23�4 �0�590-22 455 50 90�5 6 2 12�7 �2�090-22 450 50 90�5 6 3 13�7 �2�490-22 441.7 50 90�5 6 4 14�2 0�790-22 429.3 50 83 6 3 11�5 0�090-22 421 100 80�5 6 4 18�2 0�090-22 364.1 100 80 6 3 20�0 �0�390-22 323.8 95 82 6 4 22�9 �0�690-22 210.9 100 82 6 4 23�0 �0�8
The number in the sample name, after the prefix 90-22, givesthe depth in the core in metres. n, number of single measure-ments; uncertainty on the median angle, Hcpp, is the 2r confi-dence interval calculated according to Stickels & Hucke (1964);SD, standard deviation of the population; skew is the skew ofthe population.
Journal of Petrology, 2015, Vol. 56, No. 11 2125
at Pendlebury Library of M
usic on April 28, 2016
http://petrology.oxfordjournals.org/D
ownloaded from
For a single sample of the Portal Peak sill, 87-110, the
angle formed by the impingement of two plagioclase
grains at 100 three-grain junctions was measured; that
is, the angle made by the two bounding (010) faces ofthe impinging grains far from the actual junction. For
comparison, the actual augite–plagioclase–plagioclase
dihedral angle at each of these junctions was also
measured. The value of Hcpp for this sample is
94�5�6 3�5� with a standard deviation of 15� (Holness
et al., 2012b). In contrast, the median impingementangle is 81�5�6 8�, with a standard deviation of 25�,
similar to the impingement angle populations found in
glassy nodules (Holness et al., 2012a). The actual
augite–plagioclase–plagioclase dihedral angle at each
of the 100 junctions is plotted in Fig. 8 as a function of
the angle at which the two (010) plagioclase faces
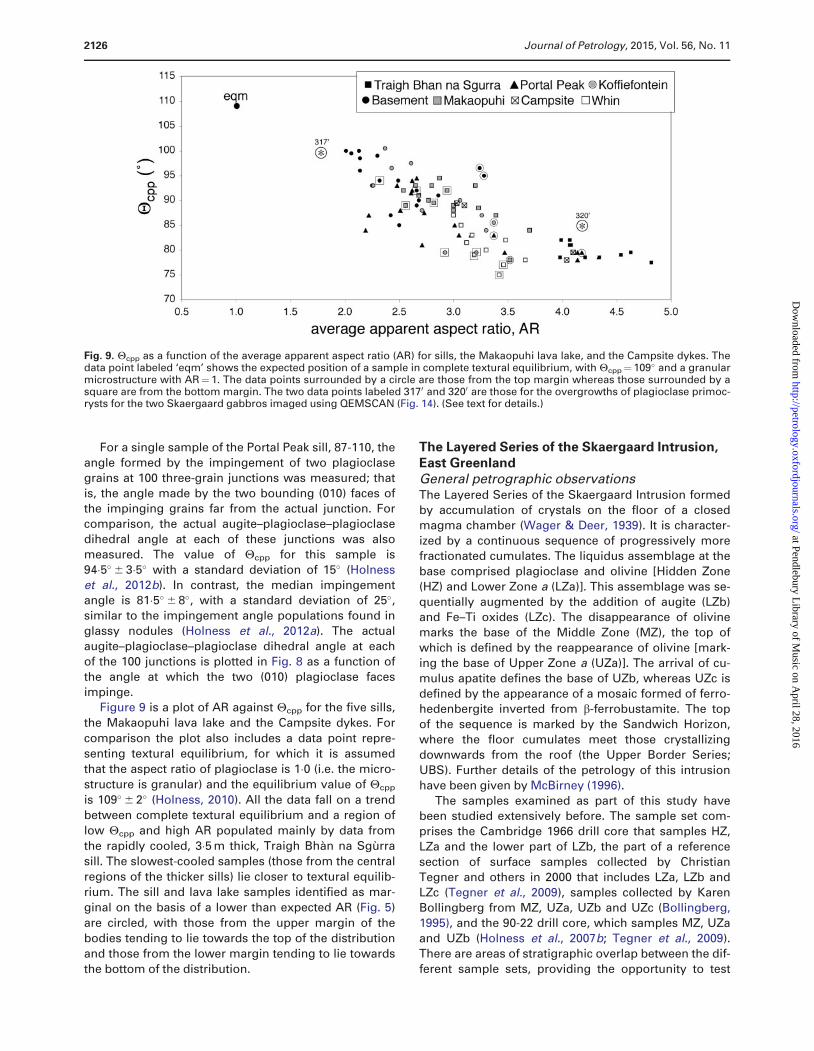
impinge.Figure 9 is a plot of AR against Hcpp for the five sills,
the Makaopuhi lava lake and the Campsite dykes. For
comparison the plot also includes a data point repre-
senting textural equilibrium, for which it is assumed
that the aspect ratio of plagioclase is 1�0 (i.e. the micro-
structure is granular) and the equilibrium value of Hcpp
is 109�6 2� (Holness, 2010). All the data fall on a trend
between complete textural equilibrium and a region of
low Hcpp and high AR populated mainly by data from
the rapidly cooled, 3�5 m thick, Traigh Bhan na Sgurra
sill. The slowest-cooled samples (those from the central
regions of the thicker sills) lie closer to textural equilib-
rium. The sill and lava lake samples identified as mar-
ginal on the basis of a lower than expected AR (Fig. 5)
are circled, with those from the upper margin of the
bodies tending to lie towards the top of the distribution
and those from the lower margin tending to lie towards
the bottom of the distribution.
The Layered Series of the Skaergaard Intrusion,East GreenlandGeneral petrographic observationsThe Layered Series of the Skaergaard Intrusion formedby accumulation of crystals on the floor of a closed
magma chamber (Wager & Deer, 1939). It is character-
ized by a continuous sequence of progressively more
fractionated cumulates. The liquidus assemblage at the
base comprised plagioclase and olivine [Hidden Zone
(HZ) and Lower Zone a (LZa)]. This assemblage was se-
quentially augmented by the addition of augite (LZb)and Fe–Ti oxides (LZc). The disappearance of olivine
marks the base of the Middle Zone (MZ), the top of
which is defined by the reappearance of olivine [mark-
ing the base of Upper Zone a (UZa)]. The arrival of cu-
mulus apatite defines the base of UZb, whereas UZc is
defined by the appearance of a mosaic formed of ferro-hedenbergite inverted from b-ferrobustamite. The top
of the sequence is marked by the Sandwich Horizon,
where the floor cumulates meet those crystallizing
downwards from the roof (the Upper Border Series;
UBS). Further details of the petrology of this intrusion
have been given by McBirney (1996).
The samples examined as part of this study havebeen studied extensively before. The sample set com-
prises the Cambridge 1966 drill core that samples HZ,
LZa and the lower part of LZb, the part of a reference
section of surface samples collected by Christian
Tegner and others in 2000 that includes LZa, LZb and
LZc (Tegner et al., 2009), samples collected by KarenBollingberg from MZ, UZa, UZb and UZc (Bollingberg,
1995), and the 90-22 drill core, which samples MZ, UZa
and UZb (Holness et al., 2007b; Tegner et al., 2009).
There are areas of stratigraphic overlap between the dif-
ferent sample sets, providing the opportunity to test
Fig. 9. Hcpp as a function of the average apparent aspect ratio (AR) for sills, the Makaopuhi lava lake, and the Campsite dykes. Thedata point labeled ‘eqm’ shows the expected position of a sample in complete textural equilibrium, with Hcpp¼109� and a granularmicrostructure with AR¼1. The data points surrounded by a circle are those from the top margin whereas those surrounded by asquare are from the bottom margin. The two data points labeled 3170 and 3200 are those for the overgrowths of plagioclase primoc-rysts for the two Skaergaard gabbros imaged using QEMSCAN (Fig. 14). (See text for details.)
2126 Journal of Petrology, 2015, Vol. 56, No. 11
at Pendlebury Library of M
usic on April 28, 2016
http://petrology.oxfordjournals.org/D
ownloaded from

whether any microstructural variations might be local-
ized or general to the intrusion. The locations of cores
and surface samples are shown in Fig. 10. Stratigraphic
heights are assigned to each sample according to the
stratigraphy used by Holness et al. (2007b), which wasbased on the model of Nielsen (2004); the zero point of
the stratigraphy is placed at the base of the Cambridge
1966 drill core.
Augite–plagioclase grain boundaries in the lower
parts of the Layered Series are curved in the immediate
vicinity of the three-grain junctions, often with some
asymmetry, and commonly have relatively Na-richplagioclase immediately adjacent to the junction. The
sense of the asymmetry is generally such that the con-
vex grain boundary involves that plagioclase grain
whose (010) face defines the orientation of the
plagioclase–plagioclase grain boundary (Holness et al.,
2013a) (Fig. 11a). The curvature of augite–plagioclasegrain boundaries at three-grain junctions decreases at
the top of UZa, resulting in a reduction of Hcpp (and a
macro-dolerite microstructure). The arrival of cumulus
apatite is marked by the reappearance of grain bound-
ary curvature and high Hcpp, but high values of Hcpp
persist for only a few tens of metres of stratigraphy be-fore grain boundaries become planar again; they re-
main planar, resulting in Hcpp of �78� (i.e. a macro-
dolerite microstructure), for the rest of UZb and all of
UZc (Figs 3 and 4b). Planar augite–plagioclase grain
boundaries at three-grain junctions are closely associ-
ated with a tendency for all mafic phases to infill small
pores between plagioclase grains.Apatite is anhedral at the top of UZa in the low Hcpp
macro-dolerites below apatite-in (Fig. 11b), becoming
euhedral in UZb, once apatite joins the liquidus assem-
blage. Apatite is also locally anhedral in the lowest part
of the Layered Series, in LZa and the lower part of LZb
(Holness et al., 2013a), becoming invariably euhedralabove 754 m stratigraphic height (i.e. between the two
samples 458225 and 458226 of the reference section of
surface samples (Tegner et al., 2009)) until the macro-
dolerites of upper UZa—this change corresponds to a
significant and sharp reduction in the calculated volume
of trapped liquid (Tegner et al., 2009).
Because dihedral angles form during the last stagesof solidification, the amount, composition and behavior
of the late-stage evolved liquid are of great importance
in any effort to understand their formation. There is
considerable disagreement in the literature concerning
the Skaergaard liquid line of descent, with some argu-
ing for Fe-enrichment in the last liquids (Wager, 1960;McBirney & Naslund, 1990; Tegner, 1997; Thy et al.,
2009; Tegner & Cawthorn, 2010) whereas others have
argued for progressive Si-enrichment (Hunter & Sparks,
1987; Toplis & Carroll, 1995, 1996). Recent work has
shown that, as it evolved, the bulk magma (Jakobsen
et al., 2011) and the interstitial liquid (Holness et al.,
2011) entered the two-liquid field, splitting into Fe-richand Si-rich immiscible conjugates. The history of inter-
stitial crystallization in the Skaergaard cumulates is
thus characterized by the presence or absence of fea-
tures such as reactive symplectites (Fig. 11c), pockets of
granophyre (Fig. 11d) and ilmenite-rich intergrowths
(Fig. 11e). Holness et al. (2011) showed that reactive
symplectites are a consequence of loss of the silica-richconjugate liquid from the crystal mushy layer once
the interstitial liquid intersects the two-liquid solvus.
The Fe-rich liquid that remains reacts with the primoc-
rysts, forming symplectites of anorthitic plagioclase
and a mafic phase (usually clinopyroxene, but it may
also be olivine) that grow outwards from Fe–Ti oxide
grains and replace plagioclase (Fig. 11c). Reactive sym-plectites are present throughout the lower part of the
Layered Series but are absent from much of UZ
(Holness et al., 2011). In their place are coexisting inter-
stitial pockets of granophyre (intergrowths of K-feldspar
and quartz, generally closely associated with plagio-
clase-rich regions of the rock; Fig. 11d) and patches of il-menite intergrown with a variety of different minerals
(e.g. olivine in Fig. 11e, but may also be intergrown with
clinopyroxene, apatite or feldspar). Ilmenite-rich inter-
growths are generally concentrated in regions rich in
mafic minerals. This transition has been interpreted as
marking the stratigraphic height at which the viscoussilica-rich conjugate liquid was no longer lost but was
retained in the mush (Holness et al., 2011), perhaps be-
cause it became the volumetrically dominant phase in
the emulsion. The transition is transgressive with rela-
tion to the stratigraphy, occurring at lower stratigraphic
heights at the margins compared with the centre of
the intrusion [Holness et al., 2011; see also fig. 5of McBirney (1996), which shows the transition as ‘the
limit of rocks containing abundant interstitial
granophyre’].
In detail, the transition occurs over 100–200 m of stra-
tigraphy in which symplectites coexist with small inter-
stitial pockets of quartz (invariably surrounded byplagioclase; Fig. 11f), with a gradual appearance of
granophyre (i.e. the arrival of K-feldspar as an intersti-
tial phase) and disappearance of symplectites higher in
the stratigraphy. In the suite of samples examined here,
the transition from a symplectite-dominated late-stage
assemblage to one containing granophyre and ilmen-
ite-rich intergrowths is seen in drill core 90-22, in thevicinity of the UZa–b boundary. The lowest appearance
of quartz pockets occurs at about 550 m depth in the
core, with the final disappearance of reactive symplec-
tites at about 450 m depth, where the first interstitial
granophyre appears (Fig. 12). Granophyre is a common
constituent at �430 m and increases in abundance up-wards through the rest of the core. The volume of
granophyre is invariably greater than that of the
ilmenite-rich intergrowths; this difference increases
with increasing stratigraphic height as ilmenite-rich
intergrowths become rare or absent in UZc. We meas-
ured Hcpp in closely spaced samples from the transition
zone in drill core 90-22, which coincides with the grad-ual appearance of the macro-dolerite microstructure at
the top of UZa (Fig. 12; Table 2).
Journal of Petrology, 2015, Vol. 56, No. 11 2127
at Pendlebury Library of M
usic on April 28, 2016
http://petrology.oxfordjournals.org/D
ownloaded from

Fig. 10. Simplified geological map of the Skaergaard Intrusion, after McBirney (1989), showing the position of the two drill coresand the surface samples used to determine the stratigraphic variation of AR (Fig. 3a).
2128 Journal of Petrology, 2015, Vol. 56, No. 11
at Pendlebury Library of M
usic on April 28, 2016
http://petrology.oxfordjournals.org/D
ownloaded from

Plagioclase grain shapeThe average apparent aspect ratio of plagioclase, AR,varies systematically in the Layered Series (Fig. 3c,
Table 3). AR in the lowest parts of the stratigraphy is �3
(Fig. 13a), and increases in a step-wise manner at
�500 m stratigraphic height, with a step-wise decreaseat �1170 m. The step-wise decrease is associated with
an increase in evidence for intra-crystalliine
Fig. 11. Photomicrographs of late-stage features in the Skaergaard Intrusion. (a) Sample from 2520400 depth in the Cambridge drillcore (LZb). The curvature of the augite–plagioclase grain boundaries is asymmetrical at each of the two three-grain junctions, al-though the asymmetry is much less marked at the left-hand junction than at the right-hand junction. On the left, the two plagioclasegrains have similar orientations [with a low angle between their (010) planes] whereas the two on the right have very different orien-tations. The sense of the asymmetry is such that the most strongly curved boundary is associated with the plagioclase grain whose(010) plane is nearly parallel to the plagioclase–plagioclase grain boundary, so only weak asymmetry is seen if the two plagioclasegrains have a low original impingement angle. Crossed polars. Scale bar is 200mm long. (b) Sample with macro-dolerite microstruc-ture showing anhedral apatite (ap) filling pores between plagioclase grains. Crossed polars. Scale bar is 200mm long. (c) Sample 90-22 893.6 from drill core 90-22 (UZa) showing reactive symplectite of anorthitic plagioclase and clinopyroxene replacing primocrystplagioclase. Plane-polarized light. Scale bar is 200mm long. (d) Sample 90-22 87.7 from the 90-22 drill core (UZc), showing pockets ofgranophyre bounded by planar plagioclase walls. Crossed polars. Scale bar is 200mm long. (e) Sample 90-22 364.1 from the 90-22drill core (UZb) showing ilmenite intergrown with fayalitic olivine. The large cumulus grains of apatite should be noted. Plane-polar-ized light. Scale bar is 200mm long. (f) Sample 90-22 482.2 from the 90-22 drill core (UZa) showing pockets filled with quartz (qtz). Theirregularity of the plagioclase walls and the strong compositional zoning should be noted; both features denote significant over-growth of the pore walls during quartz crystallization. Crossed polars. Scale bar is 200mm long.
Journal of Petrology, 2015, Vol. 56, No. 11 2129
at Pendlebury Library of M
usic on April 28, 2016
http://petrology.oxfordjournals.org/D
ownloaded from

deformation of plagioclase (Fig. 13b and c). Further up
the stratigraphy AR decreases to a minimum of �2�0 at�2300 m stratigraphic height (Figs 3b and 13d), fol-
lowed by a slow increase to �2�4 at the Sandwich
Horizon. There is no obvious relationship between ei-
ther the median or the standard deviation of Hcpp and
AR (Fig. 3).
The data shown in Fig. 3c and Table 3 concern theoverall, final, shape of plagioclase in the Layered
Series. However, plagioclase grows in two stages, with
the first being the cumulus stage, when it grows in dir-
ect contact with the bulk magma, whereas the second
occurs in the mushy layer when plagioclase grows pre-
dominantly from the interstitial liquid. Dihedral angles
are primarily formed during this second stage (Holnesset al., 2012a). The distinction between the two growth
stages can be made using plagioclase composition; in
particular, the presence of compositionally distinct
outer rims (Toplis et al., 2008; Humphreys, 2009; Namur
et al., 2014). Zoning is generally normal, although lo-
cally rims may have a constant composition, inter-preted as a consequence of local thermal buffering
during the crystallization of the interstitial liquid (Namur
et al., 2014).
The variation in shape of plagioclase cumulus cores
and overgrowths in thin section was examined using
QEMSCAN images. Figure 14 shows images of two
samples, 1 m apart, from the 1966 Cambridge drill core.The two samples are on either side of the step-change
in dihedral angle at 540 m stratigraphic height attributed
to the arrival of liquidus augite. Because dihedral angles
are formed during the last stages of solidification, the
position of the step-wise change closely approximates
the stratigraphic horizon corresponding to the base ofthe mushy layer at the moment the bulk liquid became
saturated in augite—the two samples are therefore
some distance below the actual LZa–b boundary (the
precise position of which is difficult to determine in the
drill core; Holness et al., 2015) and contain the same
liquidus assemblage of olivineþplagioclase (with inter-
stitial augite). The composition of the plagioclase pri-
mocryst cores is also the same in both. The colours in
each image are graded to highlight Ca content. The
core region of each plagioclase grain is shown in green,with a darker blue–green used for the rims, thus distin-
guishing those parts of each grain that grew close to
the magma–mush interface from those that grew from
interstitial liquid at deeper levels in the mush. It should
be noted that no rims are present on the plagioclase
where it is directly adjacent to olivine. The absence of
any intercumulus overgrowth on the cumulus plagio-clase here shows that the grain boundaries between the
two cumulus phases (plagioclase and olivine) formed
early.
One hundred plagioclase grains, each with a clearly
defined core and rim, were measured in each sample.
In the sample from 320 ft depth in the 1966 Cambridgedrill core (Fig. 14a; Hcpp¼ 85�, Holness et al., 2007b) the
overall AR of the entire grains (4�2 6 0�3, based on these
100 grains) was the same as that of the inner, unzoned
cores (4�1 6 0�3), with an average apparent thickness of
70mm of rim material grown on the (010) faces and a
corresponding 290mm of rim material on the ends ofthe elongate grains [although because the grains are
randomly oriented this may not be representative of the
average true thickness of overgrowth]. Were the core
not present, this overgrowth would have created grains
with an AR of 4�2. A datum representing such a hypo-
thetical grain is shown in Fig. 9.
In the sample from 317 ft depth in the core (Fig. 14b;Hcpp¼99�5�, Holness et al., 2007b), the (010) faces grew
by an average of 100 mm during overgrowth in the
mush whereas the ends of the elongate grains grew by
an average of 180mm (as viewed in thin section). The
overall average apparent aspect ratio is significantly
lower (3�8 6 0�3) than that of the inner unzoned core(4�5 6 0�3), whereas the overgrowth alone would create
grains with AR of 1�8. A datum representing such a
hypothetical grain is shown in Fig. 9.
It should be noted that the average overall aspect
ratios for the two samples plotted in Fig. 3c are
3�64 6 0�2 (320 ft depth in core) and 3�6 6 0�25 (317 ft
depth in core) (Table 3). The difference between these
values and those obtained from the QEMSCAN images
is likely to be a result both of the smaller sample size of
the QEMSCAN-based measurements and of only grains
showing clearly defined cores and rims being measured
on the QEMSCAN images—this selection is unlikely to
be representative of all the grains visible in the thin
section.
Dihedral angles for minerals other thanclinopyroxeneAt LZa times, the crystal mushy layer on the chamber
floor contained up to 45 vol. % liquid (Tegner et al.,2009) that crystallized abundant interstitial augite, bio-
tite, apatite, low-Ca pyroxene, and oxides. Biotite takes
Fig. 12. Details of the stratigraphic variation of Hcpp in drill core90-22, plotted as a function of depth in the core (data inTable 2). For clarity only a few of these data points are shownin Fig. 3a. The stratigraphic ranges of the various late-stagefeatures are also shown.
2130 Journal of Petrology, 2015, Vol. 56, No. 11
at Pendlebury Library of M
usic on April 28, 2016
http://petrology.oxfordjournals.org/D
ownloaded from

several forms: some is interstitial, with shapes con-
trolled by growth faces of the surrounding grains,
whereas some forms rims and radiating sheaves ofcrystals that surround oxide grains, apparently owing
to some reaction between the oxide and late liquids
(Fig. 15a). The sheaves of biotite grains cut across
plagioclase, often presenting the (001) faces of the bio-
tite to the plagioclase–plagioclase grain boundaries
(thus making a dihedral angle of 180�). In contrast, the
three-grain junctions formed by the growth of intersti-tial biotite are not dominated by the biotite (001) faces,
thus creating a biotite–plagioclase–plagioclase dihedral
angle population with a median value of �86�6 4� in
sample 118676 (290 m stratigraphic height) (Table 4).The high standard deviation of 19�4� reflects the strong
anisotropy of biotite interfacial energies.
Amphibole forms patchy replacement of interstitial
augite, and also grows instead of augite during the last
stages of primary solidification (Fig. 15b), presumably
as the interstitial liquid becomes sufficiently enriched in
H2O to permit amphibole to crystallize instead of pyrox-ene. The resultant amphibole–plagioclase–plagioclase
Table 3: Plagioclase grain shape data for the Skaergaard Layered Series
Sample Height n Apparent aspect ratio Sample set
(m) Average Min. Max.
118738 HZ 50 261 2�76 2�58 2�94 Cambridge drill core118727 HZ 104 260 3�37 3�12 3�63 Cambridge drill core118726 HZ 109 211 3�32 3�11 3�47 Cambridge drill core87901200 HZ 175 260 3�08 2�91 3�26 Cambridge drill core118684 HZ 248 259 2�93 2�78 3�11 Cambridge drill core6510200 LZa 326 259 3�19 3 3�37 Cambridge drill core458242 LZa 381 257 2�98 2�76 3�16 Tegner, 20005610100 LZa 383 277 2�7 2�53 2�86 Cambridge drill core118645 LZa 434 244 3�16 2�94 3�41 Cambridge drill core458212 LZa 439 278 3�07 2�89 3�27 Tegner, 2000458213 LZa 505 262 2�9 2�69 3�11 Tegner, 20003710700 LZa 507 266 3�59 3�32 3�81 Cambridge drill core3200600 LZa 534 211 3�64 3�41 3�83 Cambridge drill core31706�500 LZa 542 305 3�78 3�52 4 Cambridge drill core458219 LZa 668 281 3�54 3�29 3�73 Tegner, 2000458224 LZb 703 248 3�58 3�34 3�82 Tegner, 2000458225 LZb 754 221 3�75 3�41 3�97 Tegner, 2000458227 LZb 898 147 3�36 3�12 3�54 Tegner, 2000458231 LZb 922 189 4�12 3�83 4�33 Tegner, 2000458201 LZb 1062 122 3�48 3�28 3�73 Tegner, 2000458202 LZb 1097 191 3�33 3�15 3�59 Tegner, 2000458203 LZb 1143 201 3�25 3�04 3�48 Tegner, 2000458204 LZb 1168 152 3�25 2�99 3�49 Tegner, 2000458205 LZb 1183 135 2�71 2�5 2�89 Tegner, 2000458206 LZb 1231 115 2�51 2�37 2�67 Tegner, 2000458277 LZb 1310 247 2�75 2�54 2�98 Tegner, 2000458280 LZc 1434 235 2�43 2�23 2�61 Tegner, 2000458285 LZc 1517 251 2�49 2�31 2�69 Tegner, 2000458287 LZc 1598 164 2�66 2�46 2�81 Tegner, 2000SK84-404 MZ 1739 306 2�52 2�33 2�7 BollingbergSK84-363 MZ 1865 271 2�21 2�06 2�38 BollingbergSK84-409 MZ 1936 186 2�16 1�95 2�34 BollingbergSK84-367 MZ 2063 152 2�21 2�07 2�36 Bollingberg90/22 893.6 UZa 2121 165 2�05 1�91 2�19 90-22 drill core90/22 769.1 UZa 2228 140 2�32 2�16 2�46 90-22 drill core90/22 660.6 UZa 2322 304 1�92 1�8 2�05 90-22 drill core90/22 555.5 UZa 2412 236 2�12 1�96 2�25 90-22 drill core90/22 471.8 UZb 2485 134 2�16 1�98 2�33 90-22 drill core90/22 450 UZb 2505 188 1�99 1�84 2�14 90-22 drill core90/22 364.1 UZb 2585 153 2�39 2�22 2�56 90-22 drill core90/22 270.3 UZb 2672 217 2�21 1�98 2�39 90-22 drill coreSK84-373 UZb 2800 244 2�19 2�07 2�32 Bollingberg90/22 87.7 UZb 2841 284 2�31 2�15 2�5 90-22 drill coreSK84-376 UZc 3003 195 2�36 2�19 2�56 BollingbergSK84-377 UZc 3027 303 2�36 2�23 2�54 Bollingberg
The stratigraphic height is calculated using the scheme of Holness et al. (2007b). n, number of single grains measured in each sam-ple. The average apparent aspect ratio is bracketed by minimum and maximum values that are the 95% confidence intervals calcu-lated using a bootstrap method. Tegner, 2000 refers to the reference section of surface samples collected by Christian Tegner andothers in 2000 (Tegner et al., 2009). Bollingberg refers to the sample suite described by Bollingberg (1995). (See the text for detailsof the sample origin and Fig. 10 for an indication of sample localities.)
Journal of Petrology, 2015, Vol. 56, No. 11 2131
at Pendlebury Library of M
usic on April 28, 2016
http://petrology.oxfordjournals.org/D
ownloaded from

dihedral angles form a population with a median of
�85�5�6 2�. In 118676, Hcpp is 85�6 1�5�, the same as
those angles measured for biotite and amphibole. A fur-
ther sample from LZa, 118694 (200 m stratigraphicheight) shows a similar pattern, with identical median
values of dihedral angle for augite, amphibole, ortho-
pyroxene (inverted pigeonite) and olivine forming junc-
tions with plagioclase grains. Two samples from UZb
macro-dolerites were also investigated, and in both the
olivine–plagioclase–plagioclase dihedral angle popula-tion is indistinguishable from that of augite–
plagioclase–plagioclase (Table 4).
The Eastern Layered Intrusion, RumThe Eastern Layered Intrusion of the Rum Igneous
Complex formed in a sub-volcanic magma chamber
that experienced multiple episodes of magma replen-
ishment and eruption (Renner & Palacz, 1987; Emeleus
et al., 1996; Holness & Winpenny, 2009). The cumulate
pile is formed of alternating layers of olivine cumulatesand plagioclase-bearing cumulates. For this study
two samples were chosen of troctolitic cumulates
[plagioclase and olivine on the liquidus; the samples
are from Traverse J of Holness & Winpenny (2009) and
Hcpp has previously been reported by Holness et al.
(2013a)], and two of olivine gabbroic cumulates [withaugite as an additional cumulus phase; the samples are
from the top of Traverse i of Holness (2005)].
The troctolitic allivalites contain primocrysts of oliv-
ine and plagioclase. Neither mineral has significant
compositional zoning. Minor primocrystic Cr-spinel
may be present. Minor interstitial augite forms thinmonocrystalline rims around olivine primocrysts. The
gabbroic allivalites contain equant primocrysts of aug-
ite in addition to olivine and plagioclase. Both the
troctolites and gabbros are close to adcumulate, with al-
most no interstitial minerals that might have grown
from evolved liquid. Augite–plagioclase grain bounda-
ries are generally curved (denoting simultaneousgrowth of the two phases), often with some asymmetry
at the junction itself.
In the two troctolites, the augite–plagioclase–
plagioclase dihedral angle population is indistinguish-
able from the olivine–plagioclase–plagioclase dihedral
Fig. 13. Photomicrographs (all under crossed polars) showing the shape of plagioclase as a function of height in the SkaergaardLayered Series. (a) Sample 118727 from the Cambridge drill core (104 m stratigraphic height. AR¼3�37). The prominent rim on thegrain marked with an asterisk should be noted; rims of this kind are shown clearly in the QEMSCAN images in Fig. 14. Scale bar is1 mm long. (b) Sample 90-22 555.5 from the 90-22 drill core (2412 m stratigraphic height, AR¼2�12). The large grain in the centre ofthe image has been bent and deformed with the development of deformation twins. It is possible that the two grains immediatelybelow it in the image (marked with asterisks) were also part of a single, now recrystallized, grain. Scale bar is 1 mm long. (c)Sample 458285 from the Tegner (2000) reference section (1517 m stratigraphic height, AR¼2�49). The grain in the centre of theimage is very significantly bent and appears to be recrystallizing into three separate grains. Scale bar is 1 mm long. (d) Sample 90-22 893.6 from the 90-22 drill core (2121 m stratigraphic height, AR¼2�05), showing almost equant cumulus plagioclase grains.Scale bar is 1 mm long.
2132 Journal of Petrology, 2015, Vol. 56, No. 11
at Pendlebury Library of M
usic on April 28, 2016
http://petrology.oxfordjournals.org/D
ownloaded from

angle population, despite augite being intercumulus
(with a mode< 10 vol. %) and olivine having cumulus
status (Table 4). In each sample the dihedral angle was
measured at both augite–plagioclase–plagioclase junc-
tions (i.e. the mafic phase is intercumulus) and olivine–plagioclase–plagioclase junctions (i.e. the mafic phase
is cumulus). In the two gabbros (in which both augite
and olivine are cumulus), the olivine–plagioclase–
plagioclase dihedral angle population is again indistin-
guishable from that at augite–plagioclase–plagioclase
junctions. In sample 8A1, from immediately below an
intrusive peridotite body (Holness, 2005), the two me-dian angles are 103�5�6 3�5� and 104�6 2�5�, whereas
those from 8A6, collected far from the intrusive perido-
tite, are both 92� with 95% confidence limits of 2�5� and
3� respectively (Table 4).
The Upper Zone of the Bushveld Complex, SouthAfricaThe Upper Zone of the Bushveld Complex, sampled forthis study by two of the three Bierkraal drill cores,
formed from a single, fractionating, body of magma
(von Gruenewaldt, 1973; Molyneux, 1974; Kruger et al.,
1987), with the liquidus assemblage of the lowermost
cumulates comprising plagioclase, augite and low-Ca
pyroxene (hypersthene), with interstitial Fe–Ti oxides,biotite and minor quartz. The arrival of Fe–Ti oxides as a
cumulus phase is marked by a significant increase in
the Fe–Ti oxide mode and a step-wise change in Hcpp
(Holness et al., 2013a). Higher in the stratigraphy, the ar-
rival of cumulus olivine is associated with the gradual
loss of orthopyroxene (which it replaces), resulting in
an unchanging value of Hcpp. The last phase to arrive isapatite (Tegner et al., 2006), although the presence of
cumulus apatite is cyclical (Cawthorn & Walsh, 1988;
Tegner et al., 2006) and is associated with a bimodal
variation of Hcpp (Holness et al., 2013a).
The most highly evolved rocks sampled by the
Bierkraal drill cores are ferrodiorites typified by a cumu-lus assemblage of plagioclase (An43), fayalitic olivine,
ferro-augite, Fe-Ti oxides and apatite, with abundant
oikocrystic amphibole (Fig. 16a) and biotite [see Tegner
Fig. 14. QEMSCAN images of (a) sample 3200 and (b) sample3170 from the Cambridge drill core, with colours according tothe Ca concentration. Olivine is grey and augite is bright blue.Low-Ca pyroxene (inverted pigeonite) is a mottled grey.Plagioclase grains are turquoise with dark rims. The cores ofthe plagioclase grains formed close to the magma–mush inter-face whereas the rims, of composition <An61, formed withinthe mush. It should be noted that the rims on the ends of theplagioclase laths are generally thicker in comparison with therims on the sides of the laths in (a) compared with (b). Bothimages are 1 cm across.
Fig. 15. Photomicrographs in plane-polarized light of late-stageminerals in sample 118676 from the Cambridge drill core (HZ,stratigraphic height 294 m). (a) Biotite can grow either intersti-tially (left) or as reactive polycrystalline rims around interstitialgrains of Fe–Ti oxides (right). Meaningful values of biotite–plagioclase–plagioclase dihedral angles can be measured onthe former. Scale bar is 200mm long. (b) Amphibole (amph)grows as localized replacive patches in intercumulus augite,and on the outer edges of augite grains, interpreted as topotac-tic overgrowths during solidification as the interstitial liquid be-comes sufficiently rich in H2O to stabilize amphibole ratherthan pyroxene. Scale bar is 200mm long.
Journal of Petrology, 2015, Vol. 56, No. 11 2133
at Pendlebury Library of M
usic on April 28, 2016
http://petrology.oxfordjournals.org/D
ownloaded from

et al. (2006) for mineral compositions]. The augite com-
monly contains abundant and irregular patches
replaced by brown amphibole (Fig. 16a and b). K-
feldspar and quartz form large interstitial grains gener-
ally enclosing rounded grains of cumulus plagioclase(Fig. 16c and d). The three-grain junctions formed by
the three late-stage phases (amphibole, K-feldspar and
quartz) are generally typified by straight grain bounda-
ries and a consequently low median angle (Fig. 16d and
e), in contrast to the curved boundaries at augite– (and
olivine)–plagioclase–plagioclase junctions (Fig. 16b).
Dihedral angles for augite–plagioclase–plagioclase
junctions in samples 3 W 300 (from 300 m depth in drill
core 3) and 1 W 1423.4 (from 1423�4 m depth in drill
core 1) have been previously presented by Holness
et al. (2013a). For the present study these data wereaugmented by measurements of olivine–plagioclase–
plagioclase angles in the two samples (olivine is a cu-
mulus phase in both): for both, the olivine angle is indis-
tinguishable from that for coexisting augite (Table 4).
For comparison with the most evolved rocks of
the Skaergaard Layered Series the dihedral angle
Table 4: Dihedral angle data for three-grain junctions involving two grains of plagioclase and one of another mineral phase
Sample Cumulus Mineral n Hxpp SD Skew Reference
Skaergaard Layered Series118676 po-C augite 70 85 6 1�5 12�8 �0�3 Holness et al. (2007b)
amphibole 50 85�5 6 2 13�7 �0�6biotite 43 86 6 4 19�4 2�1
118694 po-C augite 60 85 6 2�5 12�3 �0�8 Holness et al. (2007b)amphibole 50 85 6 3 11�5 0�6orthopyroxene 50 85�5 6 2 11�2 0�3olivine 40 85 6 7 12�1 0�8
90-22 429.3 pocmia-C augite 50 83 6 3 11�5 0�0 Holness et al. (2007b)olivine 25 85 6 5 18�0 �2�1
90-22 364.1 pocmia-C augite 100 80 6 3 20�0 �0�3 Holness et al. (2007b)olivine 26 82�5 6 7 15�7 �0�4
Rum Eastern Layered IntrusionR12-J5 po-C augite 100 79 6 4 23�4 0�1 Holness et al. (2013a)
olivine 50 79�5 6 5 15�7 0�1 Holness & Winpenny (2009)R12-J4 po-C augite 100 83�5 6 4�5 22�5 �0�3 Holness et al. (2013a)
olivine 50 82�5 6 4 16�7 �1�2 Holness & Winpenny (2009)8A1 poa-C augite 100 104 6 2�5 11�7 0�6 Holness (2005)
olivine 50 103�5 6 3�5 7�7 0�28A6 poa-C augite 100 92 6 2�5 14�8 �0�6 Holness (2005)
olivine 40 92 6 3 11�3 0�7Bushveld Complex Upper Zone3 W 300 pocmi-C augite 100 91 6 2�5 8�8 0�1 Holness et al. (2013a)
olivine 50 91�5 6 2 7�6 0�11 W 1423.4 pocmia-C augite 60 96 6 1�5 10�4 �0�9 Holness et al. (2013a)
olivine 50 95�5 6 2�5 10�9 �0�71 W 446.6 pocmia-C augite 40 97þ2�5 13�5 �2�1
amphibole 30 77�5 6 5 14�0 �0�31 W 441.4 pocmia-C augite 40 98 6 3 10�3 �0�2
amphibole 60 78 6 4 17�5 �0�4quartz 40 70�5 6 10 26�1 0�2
1 W 426.0 pocmia-C augite 40 95 6 3 10�6 0�6olivine 35 96�5 6 5 12�4 0�9amphibole 50 77 6 3 16�2 �0�2
Sept Iles Megacyclic Unit IDC99-2382.5 po-C augite 50 83 6 2 13�0 �0�8 Holness et al. (2013a)
orthopyroxene 33 84 6 3 13�9 �0�1amphibole 50 98�5 6 5 14�3 �0�9olivine 50 96�5 6 4�5 13�3 �0�1
DC99-2363.5 po-C augite 50 85�5 6 2�5 12�7 0�6 Holness et al. (2013a)amphibole 50 98�5 6 4 13�0 0�5olivine 40 102 6 3 12�6 0�6
DC99-1833.5 pomi-C augite 50 93 6 1�5 7�3 0�2 Holness et al. (2013a)amphibole 49 98 6 5 12�7 �0�3olivine 50 100 6 2�5 11�6 �0�3
DC99-1081 pmic-C augite 50 99 6 3 12�7 �1�8 Holness et al. (2013a)olivine 40 100 6 2�5 12�4 0�3
DC99-740.5 pmic-C augite 41 97 6 3 10�3 0�8olivine 40 98 6 3 7�9 �0�3
The cumulus assemblage is given following Irvine (1982). n, number of single measurements; uncertainty on the median angle,Hxpp, is the 2r confidence interval calculated according to Stickels & Hucke (1964); SD, standard deviation of the population. Thefinal column gives the first published reference to Hcpp in the sample. The stratigraphic position of the four Skaergaard samples isshown in Fig. 3a.
2134 Journal of Petrology, 2015, Vol. 56, No. 11
at Pendlebury Library of M
usic on April 28, 2016
http://petrology.oxfordjournals.org/D
ownloaded from
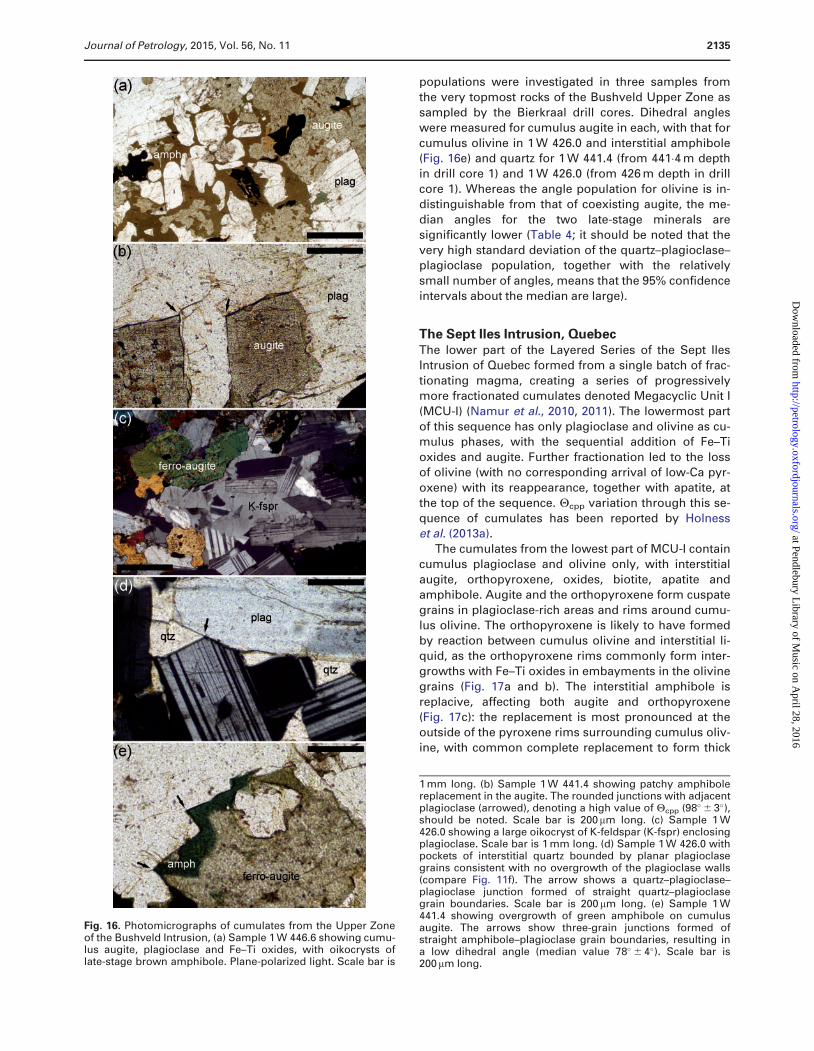
populations were investigated in three samples from
the very topmost rocks of the Bushveld Upper Zone as
sampled by the Bierkraal drill cores. Dihedral angles
were measured for cumulus augite in each, with that for
cumulus olivine in 1 W 426.0 and interstitial amphibole(Fig. 16e) and quartz for 1 W 441.4 (from 441�4 m depth
in drill core 1) and 1 W 426.0 (from 426 m depth in drill
core 1). Whereas the angle population for olivine is in-
distinguishable from that of coexisting augite, the me-
dian angles for the two late-stage minerals are
significantly lower (Table 4; it should be noted that the
very high standard deviation of the quartz–plagioclase–plagioclase population, together with the relatively
small number of angles, means that the 95% confidence
intervals about the median are large).
The Sept Iles Intrusion, QuebecThe lower part of the Layered Series of the Sept Iles
Intrusion of Quebec formed from a single batch of frac-
tionating magma, creating a series of progressively
more fractionated cumulates denoted Megacyclic Unit I
(MCU-I) (Namur et al., 2010, 2011). The lowermost part
of this sequence has only plagioclase and olivine as cu-mulus phases, with the sequential addition of Fe–Ti
oxides and augite. Further fractionation led to the loss
of olivine (with no corresponding arrival of low-Ca pyr-
oxene) with its reappearance, together with apatite, at
the top of the sequence. Hcpp variation through this se-
quence of cumulates has been reported by Holnesset al. (2013a).
The cumulates from the lowest part of MCU-I contain
cumulus plagioclase and olivine only, with interstitial
augite, orthopyroxene, oxides, biotite, apatite and
amphibole. Augite and the orthopyroxene form cuspate
grains in plagioclase-rich areas and rims around cumu-
lus olivine. The orthopyroxene is likely to have formedby reaction between cumulus olivine and interstitial li-
quid, as the orthopyroxene rims commonly form inter-
growths with Fe–Ti oxides in embayments in the olivine
grains (Fig. 17a and b). The interstitial amphibole is
replacive, affecting both augite and orthopyroxene
(Fig. 17c): the replacement is most pronounced at theoutside of the pyroxene rims surrounding cumulus oliv-
ine, with common complete replacement to form thick
Fig. 16. Photomicrographs of cumulates from the Upper Zoneof the Bushveld Intrusion, (a) Sample 1 W 446.6 showing cumu-lus augite, plagioclase and Fe–Ti oxides, with oikocrysts oflate-stage brown amphibole. Plane-polarized light. Scale bar is
1 mm long. (b) Sample 1 W 441.4 showing patchy amphibolereplacement in the augite. The rounded junctions with adjacentplagioclase (arrowed), denoting a high value of Hcpp (98�6 3�),should be noted. Scale bar is 200mm long. (c) Sample 1 W426.0 showing a large oikocryst of K-feldspar (K-fspr) enclosingplagioclase. Scale bar is 1 mm long. (d) Sample 1 W 426.0 withpockets of interstitial quartz bounded by planar plagioclasegrains consistent with no overgrowth of the plagioclase walls(compare Fig. 11f). The arrow shows a quartz–plagioclase–plagioclase junction formed of straight quartz–plagioclasegrain boundaries. Scale bar is 200mm long. (e) Sample 1 W441.4 showing overgrowth of green amphibole on cumulusaugite. The arrows show three-grain junctions formed ofstraight amphibole–plagioclase grain boundaries, resulting ina low dihedral angle (median value 78�6 4�). Scale bar is200mm long.
Journal of Petrology, 2015, Vol. 56, No. 11 2135
at Pendlebury Library of M
usic on April 28, 2016
http://petrology.oxfordjournals.org/D
ownloaded from

amphibole rims. Dihedral angles were measured in two
samples (DC99-2382.5 and DC99-2363.5) with cumulus
plagioclase and olivine. The dihedral angle populations
for the two pyroxenes in each sample are indistinguish-able, whereas those for both olivine and amphibole are
significantly higher (Fig. 17d, Table 4). In both samples
the 2r confidence intervals on the median amphibole–
plagioclase–plagioclase dihedral angle are relatively
large (Table 4), attesting to highly variable junctiongeometry.
Fig. 17. Photomicrographs of microstructures in MCU-I of the Sept Iles Intrusion. (a) Sample 9-2382.5, containing cumulus plagioclaseand olivine. The olivine grain is embayed and surrounded by orthopyroxene, suggestive of a reaction relationship between cumulusolivine and interstitial liquid. The later replacement of the orthopyroxene by amphibole should be noted. Plane-polarized light. Scalebar is 200mm long. (b) Sample 9-2363.5, with a cumulus assemblage of olivine and plagioclase. The olivine has been partly replacedby orthopyroxene, locally in a symplectic intergrowth with Fe–Ti oxides. This intergrowth is locally replaced by amphibole. Plane-polarized light. Scale bar is 200mm long. (c) Sample 2363.5 showing olivine surrounded by orthopyroxene and augite, with both pyrox-enes being replaced by amphibole. Plane-polarized light. Scale bar is 200mm long. (d) Sample 9-2382.5 showing the contrast in dihe-dral angle between the amphibole–plagioclase–plagioclase junctions (high dihedral angle, arrowed on the left) and augite–plagioclase–plagioclase dihedral angles (arrowed on the right). The partial replacement of the olivine grain on the left by an inter-growth of orthopyroxene and Fe–Ti oxides should be noted. Data for this sample are in Table 3. Plane-polarized light. Scale bar is1 mm long. (e) Sample 9-1833.5 with a cumulus assemblage of plagioclase, olivine and Fe–Ti oxides. Cumulus grains of olivine andFe–Ti oxides are enclosed by a thick rim of late-stage amphibole. Plane-polarized light. Scale bar is 1 mm long. (f) Sample 9-1081 witha cumulus assemblage of plagioclase, Fe–Ti oxides and augite. The localized internal replacement of cumulus augite by amphiboleshould be noted. Intercumulus olivine is present as irregular patches and rims. Plane-polarized light. Scale bar is 1 mm long.
2136 Journal of Petrology, 2015, Vol. 56, No. 11
at Pendlebury Library of M
usic on April 28, 2016
http://petrology.oxfordjournals.org/D
ownloaded from

Further up the stratigraphy, progressive fractionation
leads to the saturation of the liquid with Fe–Ti oxides,
which form abundant rounded grains. Interstitial
pyroxene is locally replaced by brown amphibole,
which may form extensive rims and patches surround-ing cumulus oxide and olivine grains (Fig. 17e). The
median dihedral angle at olivine– and amphibole–
plagioclase–plagioclase junctions is higher than that at
augite–plagioclase–plagioclase junctions (Table 4),
similar to the lowest cumulates. The mode of the repla-
cive amphibole decreases up-section: it is uncommon
by the point at which the bulk liquid became saturatedin augite, probably owing to decreasing amounts of re-
sidual liquid in the cumulates (Namur & Charlier, 2012).
The arrival of cumulus augite is marked by a change
in morphology and an increase in mode, together with
the disappearance of interstitial orthopyroxene. Augite
now forms large grains, with local internal replacementby brown amphibole (Fig. 17f): there is no longer any
evidence for extensive late-stage reaction and replace-
ment. Dihedral angles were measured in two samples
from cumulates in which olivine was no longer a cumu-
lus phase. In these rocks olivine tends to grow as exten-
sive rims around oxides (Fig. 17f). In both samples(DC99-1081 and DC99-740.5) the median dihedral
angles for olivine and augite are indistinguishable
(Table 4).
DISCUSSION
Effect on dihedral angle of replacing augite withother mineralsIn the Skaergaard and Rum intrusions, and in the lower
parts of the Bushveld Upper Zone, the dihedral angle at
junctions formed by two grain of plagioclase and one
grain of another mineral is the same for all minerals in
the rock, regardless of the nature of the mafic mineralforming the three-grain junction (ignoring instances
where highly anisotropic phases such as biotite and
apatite locally grow with highly prominent planar
faces), and regardless of whether that phase is intersti-
tial or cumulus. This supports the earlier finding of
Holness et al. (2012b) that the dihedral angle popula-tions are the same for monoclinic Ca-rich and ortho-
rhombic Ca-poor pyroxene in the Basement Sill, and
that of Holness et al. (2013a) that pyroxene composition
and structure does not affect three-grain junction geom-
etry in the lower parts of the Sept Iles Intrusion. These
results support the hypothesis that whatever is control-
ling the geometry of three-grain junctions is primarilyaffecting plagioclase. There are, however, notable ex-
ceptions to this, and these are found in the most
evolved parts of the Bushveld Upper Zone and in the
lower parts of Sept Iles MCU-I.
In contrast to the amphibole observed in the
Skaergaard Intrusion, which crystallizes locally insteadof augite during the last stages of solidification, the
Sept Iles amphibole is replacive after original pyroxene
(Fig. 17b). Although it most probably crystallized from a
silicate liquid (rather than being a result of post-
solidification metasomatism) its replacive relationship
with the augite shows that it did not grow simultan-
eously with the adjacent plagioclase. The medianamphibole–plagioclase–plagioclase dihedral angles are
the same in the three samples investigated here, and
have a generally wide range in any one sample, leading
to 2r confidence intervals of the order 5� (the measure-
ment population is not sufficiently large to determine
the standard deviation with much accuracy). I suggest
that the higher median and greater spread of angles,compared with augite, show that the two types of three-
grain junction are not equivalent in terms of formation
processes, and thus cannot be directly compared.
The olivine–plagioclase–plagioclase junctions in the
Sept Iles MCU-I cumulates are not so straightforward to
explain. They have an unchanging geometry throughthe stratigraphy, with higher median angles than
augite–plagioclase–plagioclase junctions in the lower
parts of MCU-I, but with the same median as the augite
junctions in the upper parts (Table 3). Olivine is cumu-
lus, but is locally resorbed in the lower parts of the stra-
tigraphy. Interestingly, the Skaergaard olivines alsoshow evidence for localized reaction with late liquids,
resulting in partial replacement by orthopyroxene and
Fe–Ti oxides (Holness et al., 2011), but in the case of
Skaergaard this does not result in a median dihedral
angle different from that of augite junctions. The simi-
larity of olivine–plagioclase–plagioclase junctions to
augite–plagioclase–plagioclase junctions in theSkaergaard, Bushveld and Rum intrusions is consistent
with the former being generally subject to the same
controls as the latter, suggesting that there is some-
thing unusual about the olivine–plagioclase–plagioclase
junctions in the lower part of MCU-I. They have perhaps
been affected by the late-stage reactions that resulted inamphibole growth.
The amphibole and quartz in the upper part of the
Bushveld Upper Zone are primary, but late-crystallizing,
magmatic minerals, with no microstructural evidence
for reaction with earlier-crystallizing minerals. Both
have significantly lower median dihedral angles com-
pared with augite. Importantly, these low angles arecaused by an absence of plagioclase growth at the
three-grain junctions (Fig. 16d and e), which are formed
by generally straight grain boundaries, in contrast to
the rounded boundaries caused by plagioclase growth
at junctions with augite. Amphibole and quartz (and K-
feldspar) were the last-crystallizing major phases inthese ferro-gabbros and it seems that plagioclase had
simply ceased to grow from the highly evolved liquid
present during the last stages of solidification—it was
not a major part of the mineral assemblage at the time
of amphibole, quartz and K-feldspar crystallization.
In conclusion, for minerals growing simultaneously
with plagioclase, the dihedral angle populations formedat junctions between two grains of plagioclase and one
of the other mineral are the same, regardless of
Journal of Petrology, 2015, Vol. 56, No. 11 2137
at Pendlebury Library of M
usic on April 28, 2016
http://petrology.oxfordjournals.org/D
ownloaded from
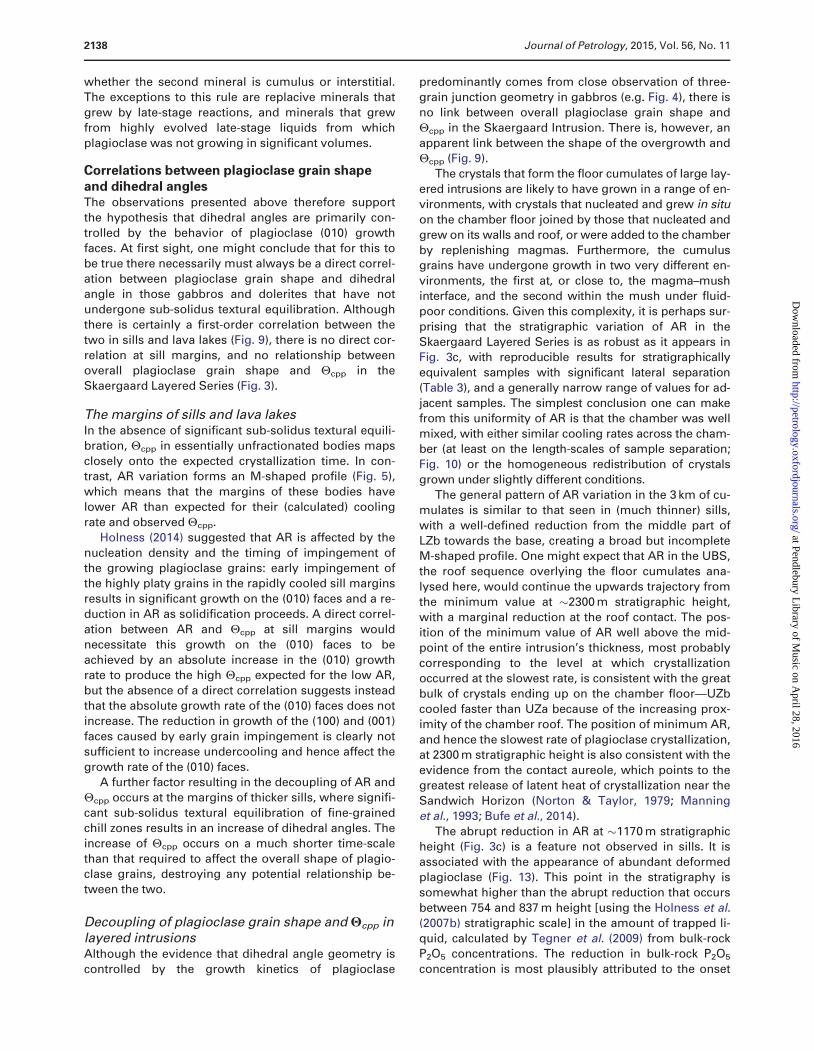
whether the second mineral is cumulus or interstitial.
The exceptions to this rule are replacive minerals that
grew by late-stage reactions, and minerals that grew
from highly evolved late-stage liquids from which
plagioclase was not growing in significant volumes.
Correlations between plagioclase grain shapeand dihedral anglesThe observations presented above therefore support
the hypothesis that dihedral angles are primarily con-
trolled by the behavior of plagioclase (010) growth
faces. At first sight, one might conclude that for this to
be true there necessarily must always be a direct correl-ation between plagioclase grain shape and dihedral
angle in those gabbros and dolerites that have not
undergone sub-solidus textural equilibration. Although
there is certainly a first-order correlation between the
two in sills and lava lakes (Fig. 9), there is no direct cor-
relation at sill margins, and no relationship betweenoverall plagioclase grain shape and Hcpp in the
Skaergaard Layered Series (Fig. 3).
The margins of sills and lava lakesIn the absence of significant sub-solidus textural equili-
bration, Hcpp in essentially unfractionated bodies maps
closely onto the expected crystallization time. In con-trast, AR variation forms an M-shaped profile (Fig. 5),
which means that the margins of these bodies have
lower AR than expected for their (calculated) cooling
rate and observed Hcpp.
Holness (2014) suggested that AR is affected by the
nucleation density and the timing of impingement of
the growing plagioclase grains: early impingement ofthe highly platy grains in the rapidly cooled sill margins
results in significant growth on the (010) faces and a re-
duction in AR as solidification proceeds. A direct correl-
ation between AR and Hcpp at sill margins would
necessitate this growth on the (010) faces to be
achieved by an absolute increase in the (010) growthrate to produce the high Hcpp expected for the low AR,
but the absence of a direct correlation suggests instead
that the absolute growth rate of the (010) faces does not
increase. The reduction in growth of the (100) and (001)
faces caused by early grain impingement is clearly not
sufficient to increase undercooling and hence affect the
growth rate of the (010) faces.A further factor resulting in the decoupling of AR and
Hcpp occurs at the margins of thicker sills, where signifi-
cant sub-solidus textural equilibration of fine-grained
chill zones results in an increase of dihedral angles. The
increase of Hcpp occurs on a much shorter time-scale
than that required to affect the overall shape of plagio-clase grains, destroying any potential relationship be-
tween the two.
Decoupling of plagioclase grain shape and Hcpp inlayered intrusionsAlthough the evidence that dihedral angle geometry is
controlled by the growth kinetics of plagioclase
predominantly comes from close observation of three-
grain junction geometry in gabbros (e.g. Fig. 4), there is
no link between overall plagioclase grain shape and
Hcpp in the Skaergaard Intrusion. There is, however, an
apparent link between the shape of the overgrowth andHcpp (Fig. 9).
The crystals that form the floor cumulates of large lay-
ered intrusions are likely to have grown in a range of en-
vironments, with crystals that nucleated and grew in situ
on the chamber floor joined by those that nucleated and
grew on its walls and roof, or were added to the chamber
by replenishing magmas. Furthermore, the cumulusgrains have undergone growth in two very different en-
vironments, the first at, or close to, the magma–mush
interface, and the second within the mush under fluid-
poor conditions. Given this complexity, it is perhaps sur-
prising that the stratigraphic variation of AR in the
Skaergaard Layered Series is as robust as it appears inFig. 3c, with reproducible results for stratigraphically
equivalent samples with significant lateral separation
(Table 3), and a generally narrow range of values for ad-
jacent samples. The simplest conclusion one can make
from this uniformity of AR is that the chamber was well
mixed, with either similar cooling rates across the cham-ber (at least on the length-scales of sample separation;
Fig. 10) or the homogeneous redistribution of crystals
grown under slightly different conditions.
The general pattern of AR variation in the 3 km of cu-
mulates is similar to that seen in (much thinner) sills,
with a well-defined reduction from the middle part of
LZb towards the base, creating a broad but incompleteM-shaped profile. One might expect that AR in the UBS,
the roof sequence overlying the floor cumulates ana-
lysed here, would continue the upwards trajectory from
the minimum value at �2300 m stratigraphic height,
with a marginal reduction at the roof contact. The pos-
ition of the minimum value of AR well above the mid-point of the entire intrusion’s thickness, most probably
corresponding to the level at which crystallization
occurred at the slowest rate, is consistent with the great
bulk of crystals ending up on the chamber floor—UZb
cooled faster than UZa because of the increasing prox-
imity of the chamber roof. The position of minimum AR,
and hence the slowest rate of plagioclase crystallization,at 2300 m stratigraphic height is also consistent with the
evidence from the contact aureole, which points to the
greatest release of latent heat of crystallization near the
Sandwich Horizon (Norton & Taylor, 1979; Manning
et al., 1993; Bufe et al., 2014).
The abrupt reduction in AR at �1170 m stratigraphicheight (Fig. 3c) is a feature not observed in sills. It is
associated with the appearance of abundant deformed
plagioclase (Fig. 13). This point in the stratigraphy is
somewhat higher than the abrupt reduction that occurs
between 754 and 837 m height [using the Holness et al.
(2007b) stratigraphic scale] in the amount of trapped li-
quid, calculated by Tegner et al. (2009) from bulk-rockP2O5 concentrations. The reduction in bulk-rock P2O5
concentration is most plausibly attributed to the onset
2138 Journal of Petrology, 2015, Vol. 56, No. 11
at Pendlebury Library of M
usic on April 28, 2016
http://petrology.oxfordjournals.org/D
ownloaded from

of efficient loss of interstitial liquid, perhaps by an
abrupt increase in the efficiency of gravitationally
driven compaction. The change in plagioclase grain
shape, as measured by the reduction in AR at �1170 m,
suggests that, at the point in the intrusion’s historymarked by this horizon, the cooling rate had reduced
sufficiently for plagioclase to begin to respond to gravi-
tationally driven compaction by bending and recrystall-
izing, rather than by mechanical rearrangement of
essentially undeformed grains. At least some of the AR
signature from this point is therefore affected by recrys-
tallization of primocrysts. This is unlikely to have hadany effect on Hcpp, however, as any such recrystalliza-
tion is likely to have occurred while there was still abun-
dant liquid present.
Although the details of the changing plagioclase
grain shape (as measured in thin section) are worthy of
further study and refinement, the data presented in Fig.3c are sufficient to demonstrate that the overall strati-
graphic variation of AR is essentially that expected for a
large intrusion for which the rate of heat loss is gov-
erned by the thermal conductivity of the country rocks.
The relevance of these data to understanding the vari-
ation of Hcpp lies in the difference between AR deter-mined from the overall shape of plagioclase grains and
that determined from the shape of the plagioclase grain
cores (Fig. 14). The overall grain shape is an integral of
growth at, or close to, the magma–mush interface and
growth within the mushy layer. The first stage generally
dominates the overall shape, as is clear from Fig. 14.
However, it is the second stage of growth, within themushy layer, that controls Hcpp. The two samples on ei-
ther side of the step-wise increase of Hcpp associated
with the arrival of liquidus augite demonstrate this
clearly (Fig. 14). The sample with low Hcpp (3200, Fig.
14a) has significantly more overgrowth in directions
parallel to the (010) faces than the sample with highHcpp (3170, Fig. 14b). If the overgrowth alone is con-
sidered, there is an excellent correlation between AR
and Hcpp of these two samples and the data collected
from the sills and lava lakes (Fig. 9). The step-wise in-
crease in Hcpp at this stratigraphic level is thus linked to
an increase in the rate of growth of the (010) faces and,
by comparison with the sills, to an increase in the timetaken to fully solidify. What this means is that the step-
wise changes in crystallization time associated with the
changing number of liquidus phases, and manifest by a
step-wise change in Hcpp, are recorded in the changing
shape of the interstitial overgrowths on cumulus plagio-
clase grains and not by the overall shape of the plagio-clase in the fully solidified gabbro.
The corollary is that Hcpp is controlled by the thermal
history on a different length-scale from that of the en-
tire intrusion. The intrusion as a whole cools at a
rate determined by the difference in temperature be-
tween it and its surroundings, together with the conduct-
ivity of its surroundings, and this coolinghistory is recorded in the smoothly changing overall
shape of the cumulus plagioclase in the floor cumulates
(Fig. 3c). The growth behavior of plagioclase within
the lower parts of the mushy layer, where dihedral
angles are forming, changes in a step-wise manner in re-
sponse to step-wise changes in the enthalpy budget in
the immediate environment—this is essentially the ‘la-tent heat hump’ of Morse (1986), where the thermal pro-
file at the chamber floor is determined by the latent heat
release where most of the crystallization is happening.
Recent work on plagioclase in the Skaergaard
Layered Series has shown that overgrowth rims of con-
stant composition form during localized thermal buffer-
ing by crystallization of the interstitial liquid, with step-wise compositional changes corresponding to the sat-
uration of the interstitial liquid in an additional mineral
(Namur et al., 2014). In contrast, dihedral angles re-
spond to the liquidus assemblage of the bulk magma.
Thus a gabbro from LZa will have a dihedral angle cor-
responding to thermal buffering by the assemblageolivineþplagioclase, but will contain plagioclase with
rims buffered by the interstitial assemblage oliv-
ineþplagioclaseþ augite. Similarly, an LZc gabbro will
have a dihedral angle corresponding to buffering by the
assemblage olivineþplagioclaseþ augiteþoxides,
whereas any plagioclase rims present would be buf-fered by an apatite-bearing assemblage. That the dihe-
dral angles are not apparently affected by localized
thermal buffering by the interstitial liquid suggests that
it provides only a small component to the overall ther-
mal budget in the crystal mush.
The macro-dolerite microstructureThe uppermost rocks of the Skaergaard Layered Series,
display a significant decoupling between Hcpp and the
liquidus phase assemblage. Hcpp is reduced despite
there being no change in the number of phases on the
liquidus of the bulk magma, and low AR (Fig. 3c) con-
sistent with slow cooling rates. In detail, this reductionhappens twice in drill core 90-22, both below the arrival
of cumulus apatite and above (Fig. 12). This reduction
of Hcpp (and of dihedral angles at all three-grain junc-
tions involving two plagioclase grains; Table 4) is
caused by the essentially complete cessation of plagio-
clase growth from the last liquids present near the baseof the mush, as shown by the planar plagioclase grains
bounding the pockets of granophyre, with little evi-
dence of overgrowth from the interstitial liquid (Figs 4b,
c and 11d). Plagioclase is clearly not a volumetrically
significant crystallizing phase in the late-stage liquid in
these rocks. By comparison with the highly evolved
rocks of the Bushveld Upper Zone, I suggest that themacro-dolerite microstructure results when the late-
stage, highly evolved, interstitial liquid reaches a com-
position that cannot crystallize significant quantities of
plagioclase.
The bulk magma from which the Sandwich Horizon
primocrysts grew (i.e. the most evolved bulk liquidcomposition) was evidently saturated in plagioclase, as
this mineral forms up to 30 vol. % of the primocryst
Journal of Petrology, 2015, Vol. 56, No. 11 2139
at Pendlebury Library of M
usic on April 28, 2016
http://petrology.oxfordjournals.org/D
ownloaded from
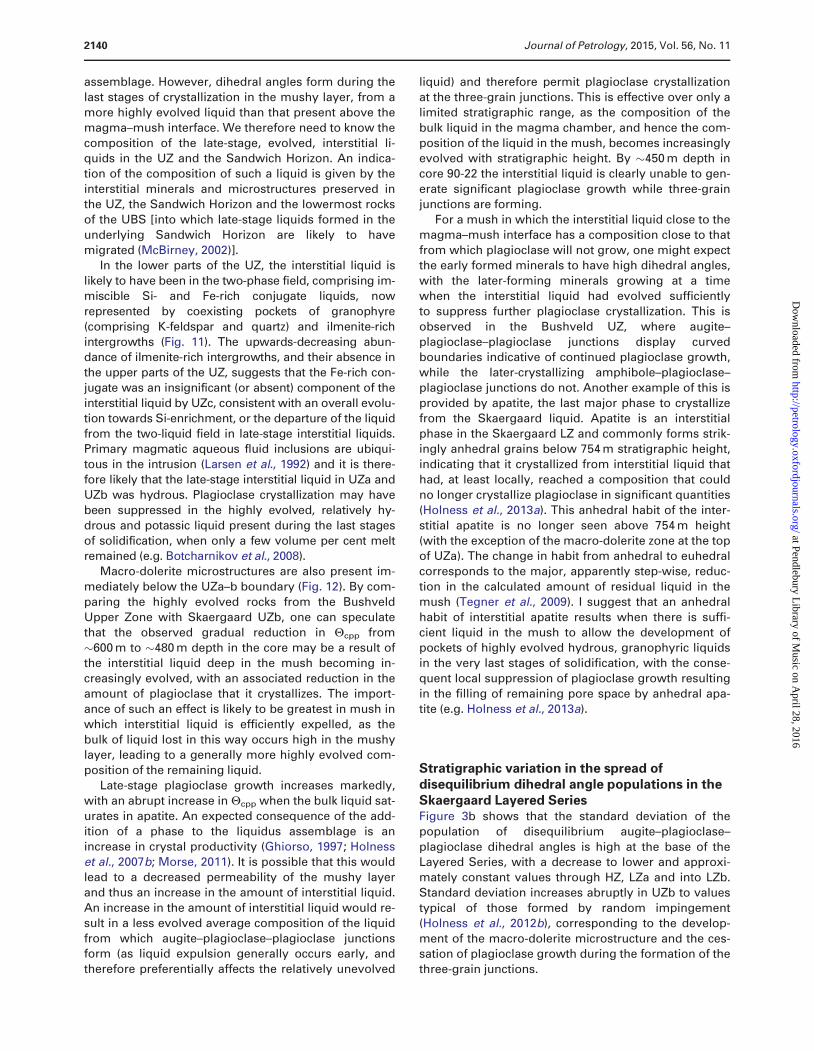
assemblage. However, dihedral angles form during the
last stages of crystallization in the mushy layer, from a
more highly evolved liquid than that present above the
magma–mush interface. We therefore need to know the
composition of the late-stage, evolved, interstitial li-quids in the UZ and the Sandwich Horizon. An indica-
tion of the composition of such a liquid is given by the
interstitial minerals and microstructures preserved in
the UZ, the Sandwich Horizon and the lowermost rocks
of the UBS [into which late-stage liquids formed in the
underlying Sandwich Horizon are likely to have
migrated (McBirney, 2002)].In the lower parts of the UZ, the interstitial liquid is
likely to have been in the two-phase field, comprising im-
miscible Si- and Fe-rich conjugate liquids, now
represented by coexisting pockets of granophyre
(comprising K-feldspar and quartz) and ilmenite-rich
intergrowths (Fig. 11). The upwards-decreasing abun-dance of ilmenite-rich intergrowths, and their absence in
the upper parts of the UZ, suggests that the Fe-rich con-
jugate was an insignificant (or absent) component of the
interstitial liquid by UZc, consistent with an overall evolu-
tion towards Si-enrichment, or the departure of the liquid
from the two-liquid field in late-stage interstitial liquids.Primary magmatic aqueous fluid inclusions are ubiqui-
tous in the intrusion (Larsen et al., 1992) and it is there-
fore likely that the late-stage interstitial liquid in UZa and
UZb was hydrous. Plagioclase crystallization may have
been suppressed in the highly evolved, relatively hy-
drous and potassic liquid present during the last stages
of solidification, when only a few volume per cent meltremained (e.g. Botcharnikov et al., 2008).
Macro-dolerite microstructures are also present im-
mediately below the UZa–b boundary (Fig. 12). By com-
paring the highly evolved rocks from the Bushveld
Upper Zone with Skaergaard UZb, one can speculate
that the observed gradual reduction in Hcpp from�600 m to �480 m depth in the core may be a result of
the interstitial liquid deep in the mush becoming in-
creasingly evolved, with an associated reduction in the
amount of plagioclase that it crystallizes. The import-
ance of such an effect is likely to be greatest in mush in
which interstitial liquid is efficiently expelled, as the
bulk of liquid lost in this way occurs high in the mushylayer, leading to a generally more highly evolved com-
position of the remaining liquid.
Late-stage plagioclase growth increases markedly,
with an abrupt increase in Hcpp when the bulk liquid sat-
urates in apatite. An expected consequence of the add-
ition of a phase to the liquidus assemblage is anincrease in crystal productivity (Ghiorso, 1997; Holness
et al., 2007b; Morse, 2011). It is possible that this would
lead to a decreased permeability of the mushy layer
and thus an increase in the amount of interstitial liquid.
An increase in the amount of interstitial liquid would re-
sult in a less evolved average composition of the liquid
from which augite–plagioclase–plagioclase junctionsform (as liquid expulsion generally occurs early, and
therefore preferentially affects the relatively unevolved
liquid) and therefore permit plagioclase crystallization
at the three-grain junctions. This is effective over only a
limited stratigraphic range, as the composition of the
bulk liquid in the magma chamber, and hence the com-
position of the liquid in the mush, becomes increasinglyevolved with stratigraphic height. By �450 m depth in
core 90-22 the interstitial liquid is clearly unable to gen-
erate significant plagioclase growth while three-grain
junctions are forming.
For a mush in which the interstitial liquid close to the
magma–mush interface has a composition close to that
from which plagioclase will not grow, one might expectthe early formed minerals to have high dihedral angles,
with the later-forming minerals growing at a time
when the interstitial liquid had evolved sufficiently
to suppress further plagioclase crystallization. This is
observed in the Bushveld UZ, where augite–
plagioclase–plagioclase junctions display curvedboundaries indicative of continued plagioclase growth,
while the later-crystallizing amphibole–plagioclase–
plagioclase junctions do not. Another example of this is
provided by apatite, the last major phase to crystallize
from the Skaergaard liquid. Apatite is an interstitial
phase in the Skaergaard LZ and commonly forms strik-ingly anhedral grains below 754 m stratigraphic height,
indicating that it crystallized from interstitial liquid that
had, at least locally, reached a composition that could
no longer crystallize plagioclase in significant quantities
(Holness et al., 2013a). This anhedral habit of the inter-
stitial apatite is no longer seen above 754 m height
(with the exception of the macro-dolerite zone at the topof UZa). The change in habit from anhedral to euhedral
corresponds to the major, apparently step-wise, reduc-
tion in the calculated amount of residual liquid in the
mush (Tegner et al., 2009). I suggest that an anhedral
habit of interstitial apatite results when there is suffi-
cient liquid in the mush to allow the development ofpockets of highly evolved hydrous, granophyric liquids
in the very last stages of solidification, with the conse-
quent local suppression of plagioclase growth resulting
in the filling of remaining pore space by anhedral apa-
tite (e.g. Holness et al., 2013a).
Stratigraphic variation in the spread ofdisequilibrium dihedral angle populations in theSkaergaard Layered SeriesFigure 3b shows that the standard deviation of the
population of disequilibrium augite–plagioclase–
plagioclase dihedral angles is high at the base of theLayered Series, with a decrease to lower and approxi-
mately constant values through HZ, LZa and into LZb.
Standard deviation increases abruptly in UZb to values
typical of those formed by random impingement
(Holness et al., 2012b), corresponding to the develop-
ment of the macro-dolerite microstructure and the ces-sation of plagioclase growth during the formation of the
three-grain junctions.
2140 Journal of Petrology, 2015, Vol. 56, No. 11
at Pendlebury Library of M
usic on April 28, 2016
http://petrology.oxfordjournals.org/D
ownloaded from

We can understand the stratigraphic variation of
standard deviation below UZ by examining the behav-
ior of single junctions as recorded by the ‘before’ and
‘after’ dihedral angle populations in the Portal Peak
sample 87-110 (Fig. 8). In this sample, those dihedralangles formed at junctions created by the low-angle im-
pingement of two plagioclase grains are incommensur-
ately wider than those dihedral angles formed at
junctions created by relatively high-angle impingement.
Dihedral angles formed where two plagioclase grains
have impinged at a high angle are lower than the ori-
ginal impingement angle. What this shows is that thereis significantly more outwards growth of the (010)
plagioclase growth faces in the narrower pores com-
pared with the wider pores. This is most probably due
to the effects of pore size on growth rates: at any given
undercooling flat interfaces can grow more rapidly than
curved interfaces (Cahn, 1980; Scherer, 1999). Theplagioclase–melt interfaces bounding the pore at the
nascent three-grain junction are generally flat, whereas
the augite–melt interface is more rounded, with a radius
of curvature that decreases with a decreasing angle of
impingement of the plagioclase (compare the geometry
of the pore walls shown in Fig. 6). This means that aug-ite growth is inhibited in the narrower pores, whereas
that of the plagioclase is unchanged (ignoring the ef-
fects of mass transport limitations in the narrowest
pores, which should affect both phases equally). This
provides a mechanism whereby the narrower pores re-
sult in incommensurately greater final dihedral angles
than the wider pores, leading to not only a higher Hcpp,but also a lower standard deviation of augite–
plagioclase–plagioclase angles, compared with the ori-
ginal population of impingement angles.
Such an effect of surface curvature on the relative
growth rates of augite and plagioclase as a function of pore
width, superimposed on the first-order control on Hcpp bythe rate of growth of (010) faces, will be controlled by the
global cooling rate. At greater global cooling rates and
hence undercoolings, the effect will be least but, as the
country rocks warm up and the global cooling rate of the in-
trusion decreases, the undercooling will also decrease,
leading to an increase in the importance of this effect. This
is consistent with the gradual reduction of standard devi-ation upwards through the Layered Series. It also explains
why the standard deviation of augite–plagioclase–
plagioclase dihedral angle populations is generally higher
in (rapidly cooled) dolerite sills.
CONCLUSIONS
Observations from a wide range of basaltic bodies dem-
onstrate that the underlying control on Hcpp is the
growth behavior of plagioclase, specifically the extent
to which growth occurs on the (010) faces, with a clear
relationship between plagioclase crystal shape and
Hcpp in unfractionated bodies, resulting from the controlof cooling rate on the relative rates of growth of the dif-
ferent plagioclase faces. The relationship between
plagioclase shape and Hcpp is obscured in layered intru-
sions. The main reason for this is that the dominant
control on the overall plagioclase grain shape is the
macro-scale cooling rate of the intrusion, with much of
each grain growing either above or close to themagma–mush interface with a shape controlled primar-
ily by the global cooling rate. The dihedral angle is cre-
ated deep in the mush, by overgrowth of the
plagioclase primocrysts: the extent to which over-
growth occurs on (010) faces (and hence the resultant
dihedral angle population) is controlled by the local
thermal budget and latent heat buffering. A further fac-tor preventing a universal direct correlation between
plagioclase grain shape and dihedral angle is the cessa-
tion of plagioclase crystallization from highly evolved
late-stage interstitial liquids in layered intrusions.
These observations suggest that attempts to quantify
the time-scales of crystallization on the magma cham-ber floor should involve two stages. Quantification of
crystallization times at or near the magma–mush inter-
face in layered intrusions (leading to the creation of a
porous mushy layer) could be achieved by comparison
of the shape of plagioclase primocryst cores with that in
dolerite sills, whereas the second stage of crystalliza-tion, leading to a completely solidified mushy layer,
could be quantified by comparing either Hcpp with
dolerite sills, or the shape of intercumulus overgrowths
on plagioclase primocrysts with the shape of plagio-
clase in dolerite sills. These ideas will be explored in a
later contribution.
It might be asked whether dihedral angles could be ofgeneral application to speedometry in crystallizing sys-
tems. The detailed work described above concerns three-
grain junctions involving two grains of plagioclase, and it
is the particular growth behavior of plagioclase that deter-
mines the way cooling history is recorded by dihedral
angles. One might expect a similar pattern to be presentat junctions formed by other minerals with a strong cool-
ing-rate control on the relative growth rates of different
faces, but few data are available. Spatial variations of
olivine–olivine–pyroxene dihedral angles have been
observed in clinopyroxene oikocrysts enclosing rounded
olivine primocrysts in an olivine cumulate, with higher di-
hedral angles in the oikocryst centre and lower angles onthe margin (Holness et al., 2005). Given that fluctuations
in cooling rate (and therefore the shape of growing
grains) are very unlikely over the short length-scales
involved, the published interpretation that these angle
variations are the result of variable extents of sub-solidus
textural equilibration, with a greater approach to sub-sol-idus equilibrium of the earlier-formed junctions in the
centre of the oikocryst, is almost certainly correct. Similar
variations of dihedral angle are observed at junctions
involving quartz and feldspar in migmatites (Holness &
Sawyer, 2008) and, again, this is most probably a sub-sol-
idus effect rather than a consequence of growth rate
mediated changes in mineral shape. It would be instruct-ive, however, to examine other systems in which cooling
rate results in measurable shape changes, such as
Journal of Petrology, 2015, Vol. 56, No. 11 2141
at Pendlebury Library of M
usic on April 28, 2016
http://petrology.oxfordjournals.org/D
ownloaded from

quartz–plagioclase–plagioclase junctions in silicic plutons,
or to explore the possibility that potassium feldspar may
also exhibit a cooling rate control on shape.
ACKNOWLEDGEMENTS
This contribution is the result of many years’ work with
numerous colleagues, including Troels Nielsen, Christian
Tegner, Dan McKenzie, Mike Cheadle, Tony Morse,Madeleine Humphreys, Ilya Veksler, Ed Sawyer, Roz Helz,
Chris Richardson, Grant Cawthorn and Jens Christian
Andersen. I am grateful to them all for their support, en-
couragement and robust discussions. More recent discus-
sions with Jerome Neufeld, Rob Farr, Olivier Namur and
Mike Bickle led to refinement of the ideas expressed here.Troels Nielsen is thanked for the loan of the Bollingberg
samples. Iris Buisman generated the QEMSCAN images.
Constructive and helpful comments by Michael Higgins
and Tony Morse resulted in significant improvements to
an earlier version of this paper.
FUNDING
This work was funded by the Natural Environment
Research Council (grant number NE/J021520/1).
REFERENCES
Bollingberg, K. (1995). Textural and chemical evolution of theFe–Ti oxide minerals during the late- and post-magmaticcooling of the Skaergaard intrusion, East Greenland. PhDthesis, University of Copenhagen.
Botcharnikov, R. E., Almeev, R. R., Koepke, J. & Holtz, F. (2008).Phase relations and liquid lines of descent in hydrousferrobasalt—implications for the Skaergaard intrusionand Columbia River flood basalts. Journal of Petrology 49,1687–1727.
Bufe, N. A., Holness, M. B. & Humphreys, M. C. S. (2014). Contactmetamorphism of Precambrian gneiss by the SkaergaardIntrusion. Journal of Petrology 55, 1595–1617.
Cahn, J. W. (1980). Surface stress and the chemical equilibriumof small crystals: I. The case of the isotropic surface. ActaMetallurgica 28, 1333–1338.
Cashman, K. V. (1992). Groundmass crystallization of Mount St.Helens dacite, 1980–1986. Contributions to Mineralogy andPetrology 109, 431–449.
Cawthorn, R. G. & Walsh, K. L. (1988). The use of phosphoruscontents in yielding estimates of the proportion of trapped li-quid in cumulates of the Upper Zone of the BushveldComplex. Mineralogical Magazine 52, 81–89.
Duchene, S., Pupier, E., Le Carlier De Veslud, C. & Toplis, M. J.(2008). A 3D reconstruction of plagioclase crystals in a syn-thetic basalt. American Mineralogist 93, 893–901.
Emeleus, C. H., Cheadle, M. J., Hunter, R. H., Upton, B. G. J. &Wadsworth, W. J. (1996). The Rum Layered Suite. In:Cawthorn, R. G. (ed.) Layered Intrusions. Developments inPetrology 15, 403–440.
Evans, B. W. & Moore, J. G. (1968). Mineralogy as a functionof depth in the prehistoric Makaopuhi tholeiitic lavalake, Hawaii. Contributions to Mineralogy and Petrology 17,85–115.
Ghiorso, M. S. (1997). Thermodynamic models of igneous proc-esses. Annual Review of Earth and Planetary Sciences 25,221–241.
Hammer, J. E., Cashman, K. V., Hoblitt, R. P. & Newman, S.(1999). Degassing and microlite crystallization during pre-climactic events of the 1991 eruption of Mt.Pinatubo, Philippines. Bulletin of Volcanology 60, 355–380.
Higgins, M. D. (1994). Numerical modeling of crystalshapes in thin sections: estimation of crystal habit andtrue size. American Mineralogist 79, 113–119.
Higgins, M. D. (2006). Quantitative Textural Measurements in Igneousand Metamorphic Petrology. Cambridge University Press.
Higgins, M. D. & Chandrasekharam, D. (2007). Nature of sub-volcanic magma chambers, Deccan Province, India: evi-dence from quantitative textural analysis of plagioclasemegacrysts in the Giant Plagioclase Basalts. Journal ofPetrology 48, 885–900.
Holness, M. B. (2005). Spatial constraints on magma chamberreplenishment events from textural observations of cumu-lates: the Rum Layered Intrusion, Scotland. Journal ofPetrology 46, 1585–1601.
Holness, M. B. (2010). Decoding dihedral angles in melt-bearingand solidified rocks. Journal of the Virtual Explorer 35, paper3, doi:10.3809/jvirtex.2010.00265.
Holness, M. B. (2014). The effect of crystallization time onplagioclase grain shape in dolerites. Contributions toMineralogy and Petrology 168, 1076.
Holness, M. B. & Sawyer, E. W. (2008). On the pseudomorphingof melt-filled pores during the crystallization of migmatites.Journal of Petrology 49, 1343–1363.
Holness, M. B. & Winpenny, B. (2009). The Unit 12 allivalite,Eastern Layered Intrusion, Isle of Rum: a textural and geo-chemical study of an open-system magma chamber.Geological Magazine 146, 437–450.
Holness, M. B., Cheadle, M. J. & McKenzie, D. (2005). Onthe uses of changes in dihedral angle to decode late-stagetextural evolution in cumulates. Journal of Petrology 46,1565–1583.
Holness, M. B., Nielsen, T. F. D. & Tegner, C. (2007a).Textural maturity of cumulates: a record of chamberfilling, liquidus assemblage, cooling rate and large-scaleconvection in mafic layered intrusions. Journal of Petrology48, 141–157.
Holness, M. B., Tegner, C., Nielsen, T. F. D., Stripp, G. & Morse,S. A. (2007b). A textural record of solidification and coolingin the Skaergaard Intrusion, East Greenland. Journal ofPetrology 48, 2359–2377.
Holness, M. B., Stripp, G., Humphreys, M. C. S., Veksler, I. V.,Nielsen, T. F. D. & Tegner, C. (2011). Silicate liquid immisci-bility within the crystal mush: late-stage magmatic micro-structures in the Skaergaard Intrusion, East Greenland.Journal of Petrology 52, 175–222.
Holness, M. B., Humphreys, M. C. S., Sides, R., Helz, R. T. &Tegner, C. (2012a). Towards an understanding of disequilib-rium dihedral angles in mafic rocks. Journal of GeophysicalResearch doi:10.1029/2011JB008902.
Holness, M. B., Richardson, C. & Helz, R. T. (2012b).Disequilibrium dihedral angles in dolerite sills: a new proxyfor cooling rate. Geology 40, 795–798.
Holness, M. B., Namur, O. & Cawthorn, R. G. (2013a).Disequilibrium dihedral angles in layered intrusions: amicrostructural record of fractionation. Journal of Petrology54, 2067–2093.
Holness, M. B., Richardson, C. & Andersen, J. C. Ø. (2013b). Thecampsite dykes: a window into the early post-solidificationhistory of the Skaergaard Intrusion, East Greenland. Lithos182–183, 134–149.
Holness, M. B., Tegner, C., Namur, O. & Pilbeam, L. (2015). Theearliest history of the Skaergaard magma chamber: a tex-tural and geochemical study of the Cambridge Drill Core.Journal of Petrology 56, 1199–1227.
2142 Journal of Petrology, 2015, Vol. 56, No. 11
at Pendlebury Library of M
usic on April 28, 2016
http://petrology.oxfordjournals.org/D
ownloaded from

Humphreys, M. C. S. (2009). Chemical evolution ofintercumulus liquid as recorded in plagioclase overgrowthrims from the Skaergaard intrusion. Journal of Petrology 50,127–145.
Hunter, R. H. & Sparks, R. S. J. (1987). The differentiation of theSkaergaard intrusion. Contributions to Mineralogy andPetrology 95, 451–461.
Irvine, T. N. (1982). Terminology for layered intrusions. Journalof Petrology 23, 127–162.
Jakobsen, J. K., Veksler, I. V., Tegner, C. & Brooks, C. K. (2011).Crystallisation of the Skaergaard Intrusion from an emulsionof immiscible iron- and silica-rich liquids: evidence from meltinclusions in plagioclase. Journal of Petrology 52, 345–373.
Kruger, F. J., Cawthorn, R. G. & Walsh, K. L. (1987). Strontiumisotopic evidence against magma addition in the UpperZone of the Bushveld Complex. Earth and Planetary ScienceLetters 84, 51–58.
Larsen, R. B., Brooks, C. K. & Bird, D. K. (1992). Methane-bearing, aqueous, saline solutions in the Skaergaard intru-sion, East Greenland. Contributions to Mineralogy andPetrology 112, 428–437.
Manning, C. E., Ingebritsen, S. E. & Bird, D. K. (1993). Missingmineral zones in contact metamorphosed basalts. AmericanJournal of Science 293, 894–938.
McBirney, A. R. (1989). Geological map of the SkaergaardIntrusion, East Greenland, scale 1:20 000. Eugene, OR:Department of Geology, University of Oregon.
McBirney, A. (1996). The Skaergaard Intrusion. In: Cawthorn, R.G. (ed.) Layered Intrusions. Developments in Petrology 15,147–180.
McBirney, A. R. (2002). The Skaergaard layered series. Part VI.Excluded trace elements. Journal of Petrology 43, 535–556.
McBirney, A. R. & Naslund, H. R. (1990). A discussion of Hunter& Sparks. Contributions to Mineralogy and Petrology 104,235–247.
Mock, A. & Jerram, D. A. (2005). Crystal size distributions (CSD)in three dimensions: insights from the 3D reconstructionof a highly porphyritic rhyolite. Journal of Petrology 46,1525–1541.
Molyneux, T. G. (1974). A geological investigation of theBushveld Complex in Sekhukhuneland and part of theSteelport valley. Transactions of the Geological Society ofSouth Africa 77, 329–338.
Morse, S. A. (1986). Convection in aid of adcumulus growth.Journal of Petrology 27, 1183–1214.
Morse, S. A. (2011). The fractional latent heat of crystallisingmagma. American Mineralogist 96, 682–689.
Namur, O. & Charlier, B. (2012). Efficiency of compac-tion and compositional convection during mafic crys-tal mush solidification: the Sept Iles layered intrusion,Canada. Contributions to Mineralogy and Petrology 163,1049–1068.
Namur, O., Charlier, B., Toplis, M. J., Higgins, M. D., Liegeois,J.-P. & Vander Auwera, J. (2010). Crystallisation sequenceand magma chamber processes in the ferrobasaltic SeptIles layered intrusion, Canada. Journal of Petrology 51,1203–1236.
Namur, O., Charlier, B., Toplis, M. J., Higgins, M. D., Hounsell,V., Liegeois, J. P. & Vander Auwera, J. (2011). Differentiationof tholeiitic basalt to A-type granite in the Sept Iles layeredintrusion, Canada. Journal of Petrology 52, 487–539.
Namur, O., Humphreys, M. C. S. & Holness, M. B. (2014).Crystallisation of interstitial liquid and latent heat buffering
in solidifying gabbros: Skaergaard Intrusion, Greenland.Journal of Petrology 55, 1389–1427.
Nielsen, T. F. D. (2004). The shape and volume of the SkaergaardIntrusion, East Greenland: Implications for mass balance andbulk composition. Journal of Petrology 45, 507–530.
Norton, D. & Taylor, H. P. (1979). Quantitative simulation ofthe hydrothermal systems of crystallizing magmas on thebasis of transport theory and oxygen isotope data: an ana-lysis of the Skaergaard Intrusion. Journal of Petrology 20,421–486.
Renner, R. & Palacz, Z. (1987). Basaltic replenishment of theRhum magma chamber: evidence from unit 14. Journal ofthe Geological Society, London 144, 961–970.
Riegger, O. K. & van Vlack, L. H. (1960). Dihedral angle measure-ments. Transactions of the Metallurgical Society of theAIME 218, 933–935.
Scherer, G. W. (1999). Crystallisation in pores. Cement andConcrete Research 29, 1347–1358.
Stickels, C. A. & Hucke, E. E. (1964). Measurement of dihedralangles. Transactions of the Metallurgical Society of theAIME 230, 795–801.
Tegner, C. (1997). Iron in plagioclase as a monitor of the differ-entiation of the Skaergaard intrusion. Contributions toMineralogy and Petrology 128, 45–51.
Tegner, C. & Cawthorn, R. G. (2010). Iron in plagioclase in theBushveld and Skaergaard intrusions: implications for ironcontents in evolving basic magmas. Contributions toMineralogy and Petrology 159, 719–730.
Tegner, C., Cawthorn, R. G. & Kruger, F. J. (2006). Cyclicity inthe Main and Upper Zones of the Bushveld complex, SouthAfrica: crystallization from a zoned magma sheet. Journal ofPetrology 47, 2257–2279.
Tegner, C., Thy, P., Holness, M. B., Jakobsen, J. K. & Lesher, C.(2009). Differentiation and compaction in the Skaergaard in-trusion. Journal of Petrology 50, 813–840.
Thy, P., Lesher, C. E. & Tegner, C. (2009). The Skaergaard liquidline of descent revisited. Contributions to Mineralogy andPetrology 157, 735–747.
Toplis, M. J. & Carroll, M. R. (1995). An experimental study ofthe influence of oxygen fugacity on Fe–Ti oxide stability,phase relations, and mineral–melt equilibria in ferro-basalticsystems. Journal of Petrology 36, 1137–1170.
Toplis, M. J. & Carroll, M. R. (1996). Differentiation of ferro-bas-altic magmas under conditions open and closed to oxygen:implications for the Skaergaard intrusion and other naturalsystems. Journal of Petrology 37, 837–858.
Toplis, M. J., Brown, W. L. & Pupier, E. (2008). Plagioclase in theSkaergaard intrusion. Part. I: Core and rim compositions inthe Layered Series. Contributions to Mineralogy andPetrology 155, 329–340.
von Gruenewaldt, G. (1973). The main and upper zones of theBushveld Complex in the Roossenekal area, EasternTransvaal. Geological Society of South Africa Transactions76, 207–227.
Wager, L. R. (1960). The major element variation of the layeredseries of the Skaergaard intrusion and a re-estimation of theaverage compositions of the hidden layered series and ofthe successive residual magmas. Journal of Petrology 1,364–398.
Wager, L. R. & Deer, W. A. (1939). Geological investigations inEast Greenland. Pt III. The petrology of the Skaergaard intru-sion, Kangerdlugssuaq, East Greenland. Meddeleser omGrønland 105, 1–352.
Journal of Petrology, 2015, Vol. 56, No. 11 2143
at Pendlebury Library of M
usic on April 28, 2016
http://petrology.oxfordjournals.org/D
ownloaded from