history and status of the hybrid electric vehicle (hev) · history and status of the hybrid...
TRANSCRIPT

History and Status of the Hybrid Electric Vehicle (HEV)
By Pat Murphy, Plan Curtail
1997 Toyota Prius – First Delivered in December 1997
2012 Toyota Prius c – Delivered in Mid 2012 January 2012

i
Contents
Introduction 1
HEV History – Shipments 1
HEV History – Costs and CO2 Savings 3
HEV Life Cycle Benefits – Cost Savings & CO2 Reductions 7
Rate of Automobile MPG Improvement 9
Car Technology Development Time 12
The Prius HEV Achievement 13
The Future of the Gasoline Engine 15
Conclusion 16

1
Introduction The Prius Hybrid Electric Vehicle (HEV) represented approximately a billion dollar investment by Toyota to develop a compact car rated at 41 MPG. The program began in 1993 with initial Japan shipments in late 1997 and first shipments in the U.S. in late 2000. The MPG rating was about twice the average MPG of an equivalent 2000 car in the U.S.1 The research and development (R&D) budget for the automobile industry is over $100 billion dollars annually.2 For about 1 percent of one year’s R & D, an innovative major improvement was made in gasoline engine efficiency. There have been other billion-dollar efforts in the past that have resulted in little or no difference in MPG, including the diesel hybrids of the U.S. PNGV program, fuel cell cars, and the BEVs of the Californian Air Resources Board (CARB) era of the late 1990s. The gasoline HEV represents the most significant technological improvement in fuel economy achieved in the last three decades. A very fuel efficient car such as the Prius HEV will sacrifice some attributes, including weight, size, style, convenience, and a sense of personal power. On the other hand, the car is much less expensive to buy and operate, and it does far less environmental damage. Typically, a car is purchased, driven for some time by its original owner, sold into the used car market, and passed through other owners for a period of about 14 years, at which time it is scrapped. It requires a substantial owner investment, including the purchase price, the costs of fuel, insurance, and repairs. If the purchaser’s objective is both economical and ecological, then the Prius is the best choice available over hundreds of other cars. In 2009, Consumer Reports found the Prius to have the highest value rating of more than 300 cars it had recently tested.3 In 2011, a similar Consumer Reports value study was made. The Prius was ranked third.4 However, its 50 MPG rating was much higher than the 30 MPG and 39 MPG ratings for the other two value leaders. As noted in earlier reports, the battery electric vehicle (BEV) and plug-in hybrid electric vehicle (PHEV) MPG numbers have been misrepresented by our government, automobile companies, utility organizations, large nonprofit organizations, and special-interest nonprofit groups. 5, 6 There is little economic or ecological advantage to buying such cars. For the next two decades, gasoline HEVs such as the Prius will have a significant MPG advantage over both BEVs and PHEVs. A national policy to make high MPG HEVs more available is preferred to the government investments in high-risk unproven electricity-centric technologies. This chapter will provide a brief history of the HEV and review the current HEV models available. It will become apparent that the Prius HEV is a unique development—a product much more fuel efficient than other HEVs. The Prius and its derivatives could serve as the basis for a paradigm shift for an economical, ecological way of driving. HEV History – Shipments The first early commercial models of the HEV in the U.S. were the Honda Insight, delivered in 1999, the Toyota Prius, delivered in 2000, and the Honda Civic HEV, delivered in 2002. These three models dominated the HEV market until 2004. Table 17 shows the various HEVs available from 1999 to 2010. To conserve space, the sales are

2
shown for two year periods rather than for one year. The Honda Insight includes both the early, two-seat version (years 1999–2006) and the later, four-seat version (2009–2010).
HEV Electric Vehicle (HEV) Sales by Model
Vehicle 1999/ 2001/ 2003/ 2005/ 2007 2009/ Total
2000 2002 2004 2006 2008 2010
Honda Insight 3,805 6,942 1,783 1,388 0 41,534 55,452
Toyota Prius 5,562 35,675 78,591 214,868 339,795 280,610 955,101
Honda Civic 13,700 47,371 57,115 63,872 22,455 204,513
Ford Escape 2,993 38,946 38,559 25,969 106,467
Honda Accord 1,061 22,424 3,601 0 27,086
Lexus RX400h 40,835 32,491 29,583 102,909
Toyota Highlander 49,474 41,493 18,542 109,509
Mercury Mariner 4,172 6,051 2,583 12,806
Lexus GS 450h 1,784 2,323 774 4,881
Toyota Camry 31,341 100,749 37,474 169,564
Nissan Altima 17,207 16,067 33,274
Saturn Vue 7,323 2,706 10,029
Lexus LS600hL 1,844 387 2,231
Saturn Aura 1,057 581 1,638
Chevy Tahoe 3,745 4,726 8,471
GMC Yukon 1,610 3,154 4,764
Chevy Malibu 2,093 4,567 6,660
Cadillac Escalade 801 3,168 3,969
Chrysler Aspen 46 33 79
Dodge Durango 9 9
Ford Fusion 36,370 36,370
Mercury Milan 2,884 2,884
Lexus HS 250h 17,362 17,362
Sierra/Silverado 3,991 3,991
BMW ActiveHEV 7 102 102
BMW X6 205 205
Ford Lincoln MKZ 1,192 1,192
Honda CR-Z 5,249 5,249
Mazda Tribute 570 570
Mercedes ML450 627 627
Mercedes S400 801 801
Porsche Cayenne 206 206
Total 9,367 56,317 131,799 462,347 664,660 555,529 1,888,971
Table 1: Historical Shipments of HEVs, 1999–2010
The number of HEV models has increased from 2 to 32 in 11 years. Japanese manufacturers still dominate because of their better fuel economy. From a total of 274,210 HEV sales in 2010, over two-thirds (69 percent) were manufactured by Toyota. Ford and Honda together accounted for about a quarter of HEV sales, while GM and Nissan together sold about 5 percent. Other manufacturers’ products, including Porsche, Mazda, Mercedes, and BMW, totaled less than 1 percent of HEV sales. 8 (See fig. 1)

3
Figure 1: Manufacturers’ Market Share of HEVs, 2010 HEV History – Costs and CO2 Savings A 2010 British Columbia Automobile Association (BCAA) report 9 compared HEV cars with their corresponding conventional versions. It included a cost analysis over a five-year period as well as the CO2 savings realized. The report shows that HEVs’ costs for the first five years are higher than the costs of conventional vehicles. The author qualifies this point, however, by noting that cost is not typically the main motivator for someone who purchases a HEV and that many consumers are willing to pay a bit more for a HEV if it will reduce their carbon footprint. Table 2 summarizes the details for the 16 pairs of cars taken from the report.10 Each entry shows the conventional car on the first line and the HEV version on the second line. The initial purchase price and total five-year costs are listed, along with the dollar savings for the HEV. The next two columns show the CO2 emissions per year and the reduction in CO2 from the HEV version. With one exception, the Mercedes, the HEV cost is higher. But the CO2 savings in most cases are also higher than the Mercedes CO2 savings. If the costs were extended to cover total lifetime of the car, total dollar savings would be higher for the more efficient HEV versions in most cases. The five-year period, which is an important measure to many people, is somewhat arbitrary; it does not reflect the full life-cycle costs of the car.

4
R Make, Model and Type Purchase Total 5-year CO2 Reduction
a C - Conventional Price 5-year HEV emissions in CO2
n H - HEV (MSRP) cost ($) saving / kg/year emissions
k ($) (extra (%)
cost)
($)
1 Mercedes-Benz S450 - C 108,000 150,622 5,474
Mercedes-Benz S400 HEV - H 105,900 145,265 5,357 4,370 20%
2 Honda Civic EX - C 24,880 42,374 3,266
Honda Civic HEV - H 27,350 42,664 -290 2,070 37%
3 Honda Civic DX-G - C 20,780 37,154 3,266
Honda Insight - H 23,900 38,326 -1,172 2,162 34%
4 Toyota Matrix XR - C 21,800 38,606 3,664
Toyota Prius - H 27,500 40,324 -1,718 1,748 55%
5 Lexus IS 250 - C 36,000 58,245 3,864
Lexus HS 250h - H 39,900 60,084 -1,839 2,622 32%
6 Toyota Camry SE Auto - C 27,310 44,667 3,542
Toyota Camry HEV - H 30,900 46,815 -2,148 2,622 26%
7 Toyota Highlander AWD V6 SUV - C 37,150 60,760 4,968
Toyota Highlander HEV SUV - H 42,315 63,578 -2,818 3,542 29%
8 Ford Fusion SEL I4 - C 25,799 44,778 3,888
Ford Fusion HEV - H 31,999 49,260 -4,482 2,352 38%
9 Ford Escape XLT SUV - C 27,999 49,497 4,416
Ford Escape HEV SUV - H 34,899 54,388 -4,891 2,806 36%
10 Nissan Altima 2.5S - C 24,495 41,194 3,542
Nissan Altima HEV - H 33,398 50,053 -8,862 2,668 25%
11 Cadillac Escalade - C 84,575 128,985 6,716
Cadillac Escalade HEV - H 94,775 138,740 -9,755 5,336 21%
12 Lexus RX 350 Premium SUV - C 46,900 73,403 5,009
Lexus RX400h HEV SUV - H 59,500 84,941 -11,538 3,390 32%
13 Chevrolet Silv./Sierra Pickup - C 31,845 58,991 6,210
Chevrolet Silv./Sierra HEV Pkup - H 47,505 74,679 -15,688 4,370 30%
14 GM Tahoe/Yukon SLT SUV - C 54,045 83,647 5,980
GM Tahoe/Yukon HEV SUV - H 68,255 101,635 -17,988 4,370 27%
15 Lexus LS460 L - C 103,150 145,813 4,968
Lexus LS600h L - H 119,950 168,382 -20,463 4,554 8%
16 Lexus GS 350 - C 52,500 82,504 4,600
Lexus GS 450h HEV - H 71,900 103,889 -21,384 3,772 18%
Table 2: Comparison of HEV and Conventional Equivalent Models
The cost differential between the conventional/HEV pairs covers a wide range—almost nothing for the Honda Civic and over $20,000 for the Lexus GS. The CO2 reductions also cover a wide range—from 8 percent for the Lexus LS to 55 percent for the Prius. One could conclude that there are HEV cars designed to reduce fuel consumption and CO2 emissions as well as ones designed for style, luxury, or speed. Some manufacturers have used the HEV concept to provide faster acceleration rather than better miles per gallon.

5
Table 3 shows a 2009 HEV analysis from the Union of Concerned Scientists that has a slightly different format, including a grade for each car. 11,12
HEV Car MPG EIS* Grade HEV Forced CO2
Value Features Cut
Non-Luxury Models
Toyota Prius 50 9.2 B $3,665 $0 44%
Honda Civic HEV 41 7.2 B $3,658 $3,687 29%
Honda Insight 41 6.5 C $4,000 -$1,700 24%
Ford Fusion HEV 39 7.8 B $4,190 $3,435 33%
Hyundai Sonata HEV 37 6.8 C $5,400 $0 30%
Honda CR-Z 37 6.2 B $1,837 $1,753 22%
Toyota Camry HEV 33 6.1 C $4,350 $1,455 21%
Nissan Altima HEV 33 5.7 C $4,215 $2,295 18%
Ford Escape HEV FWD 32 7 C $5,505 $2,595 28%
Ford Escape HEV 4WD 29 6.5 C $5,505 $2,595 28%
Toyota Highlander HEV 28 7.1 C $5,230 $2,115 32%
Chevy Tahoe HEV 2WD 21 4.3 D $5,445 $7,720 19%
GMC Yukon HEV 2WD 21 4.3 D $5,446 $7,219 19%
Chevy Silverado HEV 4WD 21 4.3 C $5,115 $0 19%
GMC Sierra HEV 4Wd 21 4.3 D $4,033 $1,082 14%
Chevy Tahoe HEV 4WD 21 4.3 D $7,865 $8,250 10%
GMC Yukon HEV 4WD 21 4.3 D $5,401 $6,014 10%
Chevy Silverado HEV 2WD 21 3.7 F $5,115 $0 14%
GMC Sierra HEV 2WD 21 3.7 D $4,033 $1,082 14%
Volkswagen Touareg HEV 21 3 F $7,865 $8,250 10%
Luxury Models
Lexus CT 200h 42 8.6 A -$2,230 -$2,465 43%
Lincoln MKZ HEV 39 9.5 A $0 $0 46%
Lexus HS 250h 35 7.0 B $2,035 $0 31%
Lexus RX 450h FWD 30 6.8 C $5,010 $250 30%
Lexus RS 450h AWD 29 6.9 C $5,500 $250 31%
InifinitiM HEV 29 5.5 C $6,000 $0 28%
Lexus GS 450h 23 4.5 C $2,320 $1,160 16%
Mercedes-Benz S400 HEV 21 5.2 A -$2,000 $0 14%
Cadillac Escalade 4WD 21 5.6 B $3,170 $7,510 24%
Cadillac Escalade 2WD 21 5.0 B $3,170 $7,510 24%
Porsche Cayenne S HEV 21 3.7 C $3,300 $0 14%
Lexus LS 600h L 20 4.1 F $31,585 $10,930 10%
BMW ActiveHEV 750i 20 3.7 F $13,900 $2,900 15%
BMW ActiveHEV X6 18 3.2 F $7,700 $18,500 11%
*Envr. Improvement Score (EIS)
Table 3: UCS Ratings of HEVs

6
The referenced document uses grades of Superior, Very Good, Good, Poor, and Very Poor; I have substituted equivalent letter grades of A, B, C, D, and F. The report also includes a symbol rating from 1 to 5 for the Forced Features column. Forced Features are options that one must buy for the HEV model that may not be required to be purchased on an equivalent non-HEV car. These do not reflect the true cost of adding HEV functionality. I have provided the actual dollar numbers from the body of the report instead of the symbol. Table 3 shows the actual HEV additional costs, so it is better for determining the relative increase in price as compared to the five-year additional cost/savings value. An environmental rating is given, but it is not clear exactly how it is derived. Tables 1, 2, and 3 are extremely useful, showing first customer ship dates, volumes, five-year costs, HEV incremental costs, CO2 reductions, and MPG. Such information makes it much easier to do cost-benefit comparisons and also to determine which HEV manufacturers are more focused on fuel economy and which are focused on marketing. There are two important measures for a HEV: the incremental cost of the technical improvements over a conventional equivalent car and the MPG improvement. These numbers, combined with the lifespan of the car, provide the full life-cycle costs of a HEV compared to a conventional car. The HEV offers one major and significant benefit—it increases a car’s fuel economy, that is, its MPG. It does not substitute a different power train for the gasoline engine or attempt to have two different power trains running off two different fuel sources. It is essentially an optimizer of the gasoline internal combustion engine. In a HEV, a smaller, more efficient engine can be used, which provides better gas mileage. The architecture is an efficiency improvement that uses a small battery periodically to save up to 40 percent on fuel consumption, at least in the case of the Prius. BEVs and PHEVs, in comparison, are fuel substitution schemes that use batteries to substitute electric power for gasoline and replace the fuel tank.13 The HEV is a simple gasoline-motor MPG improvement. Table 4 is a comparison of two pairs of cars. The first is the HEV Civic, which is the second most popular HEV after the Toyota Prius (see table 1).
Car (All 2011) Honda Honda Toyota Toyota
Civic Civic Prius Matrix
HEV
Engine Size-liters 1.3 1.8 1.8 1.8
Volume (cu. ft) 91 91 94 94
City MPG 40 25 51 25
Hwy MPG 43 36 48 32
Combined MPG 41 29 50 28
BOE Annual Consumption 8.3 11.8 6.9 12.2
CO2 Annual Emissions (tons) 4.6 6.5 3.8 6.7
Prius Gas Savings 16.9% 41.5% 0.0% 43.4%
Prius CO2 Savings 17.4% 41.5% 0.0% 43.3%
Table 4: Comparison of Leading 2011 HEVs to Conventional Cars
The Honda Civic was the first car model with both an HEV version and a conventional version. The other car is the Toyota Prius, which does not have a non-HEV version. I

7
selected the Toyota Matrix as a comparison non-HEV for the Prius car on the basis of engine size, passenger volume, and weight. BOE stands for Barrel of Oil Equivalent. The Prius consumes 43.4 percent less gasoline than the Matrix and 41.5 percent less gasoline than the Honda Civic regular model. It consumes 16.9 percent less than the HEV Civic. The numbers are almost identical for CO2 comparisons. This shows that the Prius is a better HEV than the Honda Civic HEV for fuel economy. And it shows that a 40 percent reduction in energy use for a similar sized conventional car is possible for a well-designed and well-built HEV. There are many different HEVs, and some are better than others. The measurable key benefit of the Prius is a 40 percent cut in emissions and energy use. HEV Life Cycle Benefits – Cost Savings & CO2 Reductions A HEV costs somewhat more than a conventional model to buy but costs less to fuel. It is important to understand the initial cost for the HEV and the fuel savings over the lifetime of the car. It is also important to understand that the capability added to a conventional car to make it a HEV also requires more energy for manufacturing, referred to as additional “embodied energy.” And the additional energy used will generate more CO2. This difference can be measured by either the additional energy or the additional CO2 generated. Two cars, the Honda Civic and the Toyota Camry, are used to illustrate comparisons between a HEV and a conventional car. As previously noted, the Honda Civic HEV was first shipped in 2002.14 In August 2011, Toyota announced the 2012 version of the Toyota Camry and Toyota Camry HEV. The first version of the Camry HEV shipped in 2006. Both the HEV and the non-HEV Camry models showed a significant improvement in fuel economy. 15,16 The 2012 Camry HEV LE has a fuel economy of 43 MPG city/39 MPG highway/41 MPG combined. The earlier generation Camry HEV’s corresponding numbers are 31 MPG city/35 MPG highway/33 MPG combined. This is a 39 percent, 11 percent, and 24 percent boost in fuel economy for city, highway, and combined driving cycles, respectively, compared to the previous generation. This is due largely to a new HEV power train. The eight MPG improvement represents a 25 percent improvement over a six-year period, which is about 4 percent per year, far higher than historical improvements. For the non-HEV 2012 Camry with a 2.5 liter engine, fuel economy figures are 25 MPG city/35 highway/28 MPG combined. The previous conventional Camry was 22 MPG city/32 highway/26 MPG combined. The combined improvement is two MPG over the earlier conventional generation while the combined improvement for the HEV versions is eight MPG. This eight MPG for the HEV as contrasted to the two MPG improvement for the conventional model shows what is possible with the HEV synergy drive. The Camry has been described in detail because recent HEV models have obtained a surprising improvement in MPG. Table 5 shows a lifetime comparison for the conventional and HEV versions of the 2012 Honda Civic and 2012 Toyota Camry. Lifetime costs and lifetime CO2 emissions should be clearly understood and this understanding should influence purchase decisions. If the focus is on only the first 5 years of a car’s life, then purchasers are making bad economic and ecological decisions. The price of gasoline used for this comparison is

8
$4.00 per gallon. The CO2 consumption is calculated by assuming 20 pounds of CO2 per gallon of gasoline burned. Mileage per year is assumed to be 12,000 miles and average car life is 14 years, numbers from the Department of Energy’s Alternative Fuels and Advanced Vehicles Data Program.17 Total miles driven during the lifetime of the car is 170,000 miles.
Model (all 2012) Civic Gas
Civic HEV
Camry Gas
Camry HEV
Mileage and MPG
MPG 29 41 30 41
Mileage Lifetime-14 Yrs. 170,000 170,000 170,000 170,000
Years Lifetime 14 14 14 14
Gallons Burned Lifetime 5,862 4,146 5,667 4,146
Costs
MSRP (Price) $19,000 $23,000 $22,500 $25,900
Lifetime Gasoline Costs $23,448 $16,585 $22,667 $16,585
Lifetime Gas & Car Cost $42,448 $39,585 $45,167 $42,485
CO2 Emissions
Lifetime CO2 (lbs) 117,241 82,927 113,333 82,927
Embodied CO2 (lbs) 13,000 13,600 13,000 13,600
Total CO2 (lbs) 130,241 96,527 126,333 96,527
Table 5: Comparison of 2012 Civic and 2012 Camry—Gasoline and HEV Versions
Costs include the sales price (MSRP), the lifetime gasoline costs, and the sum of the two. This table is a simple, useful life-cycle analysis for purchase and operating cost, fuel consumed, and CO2 generated. Although the initial cost of the HEV is higher than the conventional version, the total cost of the car and gasoline over its lifetime is much lower for the HEV. In the same manner, more CO2 is generated in making an HEV than its conventional version while operating the HEV generates much less CO2. The lifetime CO2 emissions are lower for the HEV. The second row from the bottom, labeled Embodied CO2 (lbs), shows the amount of CO2 generated when making the car, including the mining, melting, and shaping of iron, and the manufacturing and shaping of glass. Making an HEV version takes more energy and generates more CO2 than making its conventional counterpart. Typically, the amount of CO2 generated in making a car is about 15 percent of its total lifetime CO2 generation, the other 85 percent being mostly from burning gasoline. Many reports, such as the 2010 Canadian report summarized in table 2, provides information on only the first five years of ownership, which is useful but incomplete. Another example of a short-term perspective is the new U.S. car window stickers published in May 2011, which provide fuel cost savings, compared to the average car, for only the first five years of a car’s life. But the total lifetime of a car should be considered because it will at some point go into the used car market until the end of its lifetime. Table 5 shows that the purchase price and gasoline costs of an HEV over the lifetime of a car are about 10 percent less than those of a comparable conventional car. Admittedly,

9
the initial purchase price is higher just as the price of an energy efficient house—with more insulation, better windows, and more fuel-efficient appliances—is higher. The two HEVs considered here reduce CO2 emissions by a sizable amount, in this case about 30 percent. A Prius would offer greater reductions because its fuel economy rating is 50 MPG compared to the 41 MPG of the Honda Civic and Toyota Camry in this comparison. Table 5 can be combined with tables 1, 2, and 3 to provide the basic understanding that for both emissions and costs, e.g., CO2 and fuel purchased, it is more economical and more ecologically positive to drive a HEV. As stated earlier, HEVs are focused on lower total costs and lower total CO2 emissions compared to equivalent conventional cars. Rate of Automobile MPG Improvement In testimony to the Senate Committee on Energy and Natural Resources on January 30, 2007 18, 19 John German, manager of Honda’s Environmental and Energy Analysis Office said,
From 1987 to 2006, technology has gone into the fleet at a rate that could have improved fuel economy by almost 1.5 percent per year, if it had not gone to other attributes demanded by the marketplace. . . . [T]here is a lot of room for improvement given sufficient lead time for technology development.
Automakers have not focused on energy efficiency so much as style and comfort. Efficiency was a choice but a choice that was not made. Figure 2 20 shows average MPG change from 13 MPG in 1975 to 22.4 MPG in 2009. Prior to the 1975 beginning of this curve, fuel efficiency was around 14 MPG from 1923 to 1935. It then declined gradually to about 12 MPG in 1973. 21 So, car MPG hardly improved from the 1920s to the mid-1970s. The chart shows a rapid increase in fuel economy from 1975 to 1981, followed by a slower increase until reaching a peak in 1997, and then a gradual decline until 2004. Since 2004, fuel economy has increased each year with the largest increase in 2009.

10
Figure 2: U.S. Fuel Economy (MPG) 1975–2009
In the six-year period from 1975 to 1980, mileage improved from about 13.1 MPG to 19.2 MPG, an impressive increase of about 50 percent or about 8 percent per year. The very significant improvement in this period was the result of the establishment of the Corporate Average Fuel Economy (CAFE) standards by Congress in 1975. The improvement from 1980 to the current time, about 30 years, was from 19.2 MPG to 22.4 MPG, about 17 percent or less than ½ percent per year. The improvement from 1975 to 2011, about 35 years, was from 13.1 miles to 22.4 MPG, about 1.5 percent per year. The SUV was a style change for a larger heavier vehicle with faster acceleration. The large number of new model cars announced every year has much to do with style and little to do with performance. Could there have been a three to one difference in overall performance for cars? Between 1975 and 1980, automobile efficiency went up by 50 percent. But performance stagnated after that because other factors became more important than reducing fuel consumption and CO2 emissions. Table 7 shows the change in key characteristics between the average light-duty vehicle in 1980 and 2007, a 27-year period, as well as a partial set of numbers for the 2011 Prius.
Model Year MPG Weight Horse power
0-60 Time
Top Speed
1980 19.2 3,228 104 14.3 107
2007 20.2 4,144 223 9.6 139
2011 Prius 50 3,042 134 10 112
Table 7: Vehicle Characteristics for Both Cars and Trucks, 1980–2007 22

11
One might think that better materials over the last 30 years would have led to lighter weight, even if the car size was the same as a car 30 years ago. This is only marginally true. In general weight has not decreased significantly over time. The latest Prius may be as large in terms of space as the typical 1980 car. A car with a top speed of 139 mph offers little benefit over one with a top speed of 112 mph, our maximum speed set by law being 75 mph. The Prius gets 2.5 times the MPG of the average 1980 car. The annual increase in performance over this period was about 3 percent. Hybridization is a technology concept that added a large MPG improvement jump of around 40 percent. Such shifts are rare. In the early years of car transportation, models did not change every year. Later cosmetic changes were made so the same model looked slightly different every year. However, the basic frame, engines, and other components were used for multiple years. To some extent, this is a marketing issue whereby manufacturers use styling changes to persuade people to buy new cars more frequently. Under the hood and body, however, the same drive trains and frames may be used for several years. Americans need to understand technological improvements and their limitations. Often we are mesmerized by rapid improvements in computer technology. It is noted that if cars advanced at the rate of computers, they would cost a few dollars. But progress is not that fast. Figure 3 shows the long-range trend of energy efficiency for passenger transport in International Energy Agency countries. 23 This is about .5 percent per year. Note that this .5 percent improvement is the rate of improvement that brought the fuel economy of U.S. cars from 20 MPG in 1981 to 23 MPG in 2004.
Figure 3: Long-Term Increase in Energy Efficiency
12
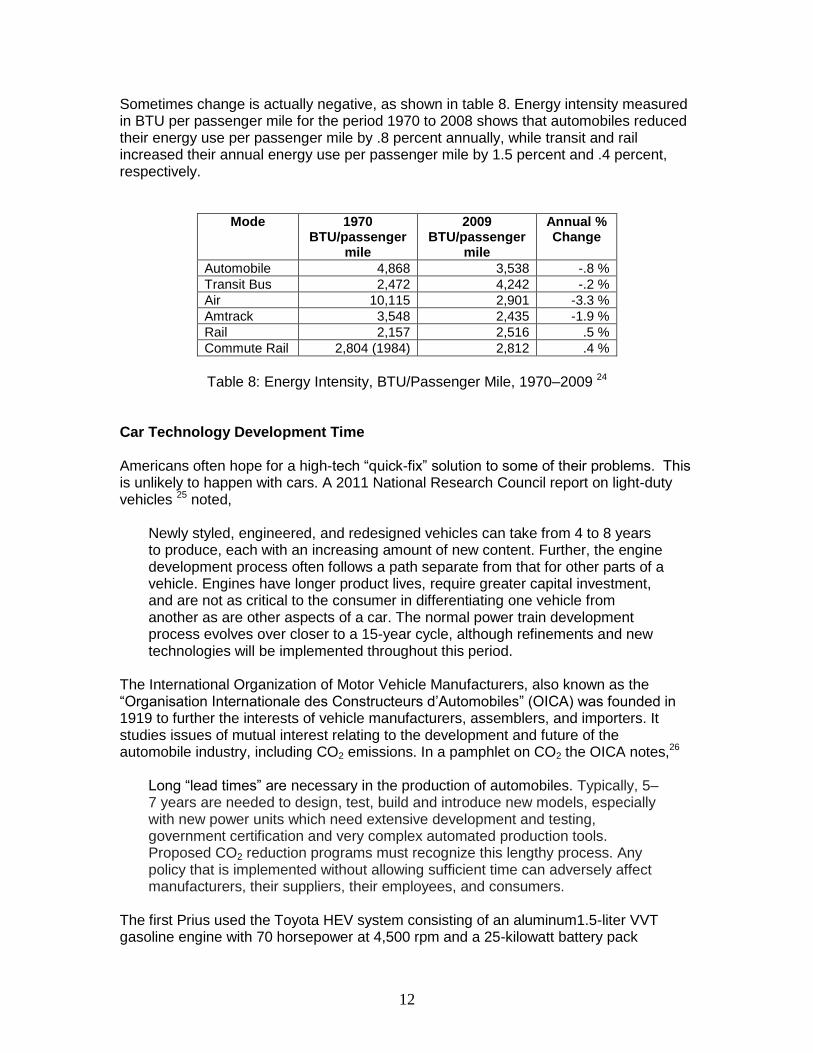
Sometimes change is actually negative, as shown in table 8. Energy intensity measured in BTU per passenger mile for the period 1970 to 2008 shows that automobiles reduced their energy use per passenger mile by .8 percent annually, while transit and rail increased their annual energy use per passenger mile by 1.5 percent and .4 percent, respectively.
Mode 1970 BTU/passenger
mile
2009 BTU/passenger
mile
Annual % Change
Automobile 4,868 3,538 -.8 %
Transit Bus 2,472 4,242 -.2 %
Air 10,115 2,901 -3.3 %
Amtrack 3,548 2,435 -1.9 %
Rail 2,157 2,516 .5 %
Commute Rail 2,804 (1984) 2,812 .4 %
Table 8: Energy Intensity, BTU/Passenger Mile, 1970–2009 24
Car Technology Development Time Americans often hope for a high-tech “quick-fix” solution to some of their problems. This is unlikely to happen with cars. A 2011 National Research Council report on light-duty vehicles 25 noted,
Newly styled, engineered, and redesigned vehicles can take from 4 to 8 years to produce, each with an increasing amount of new content. Further, the engine development process often follows a path separate from that for other parts of a vehicle. Engines have longer product lives, require greater capital investment, and are not as critical to the consumer in differentiating one vehicle from another as are other aspects of a car. The normal power train development process evolves over closer to a 15-year cycle, although refinements and new technologies will be implemented throughout this period.
The International Organization of Motor Vehicle Manufacturers, also known as the “Organisation Internationale des Constructeurs d’Automobiles” (OICA) was founded in 1919 to further the interests of vehicle manufacturers, assemblers, and importers. It studies issues of mutual interest relating to the development and future of the automobile industry, including CO2 emissions. In a pamphlet on CO2 the OICA notes,26
Long “lead times” are necessary in the production of automobiles. Typically, 5–7 years are needed to design, test, build and introduce new models, especially with new power units which need extensive development and testing, government certification and very complex automated production tools. Proposed CO2 reduction programs must recognize this lengthy process. Any policy that is implemented without allowing sufficient time can adversely affect manufacturers, their suppliers, their employees, and consumers.
The first Prius used the Toyota HEV system consisting of an aluminum1.5-liter VVT gasoline engine with 70 horsepower at 4,500 rpm and a 25-kilowatt battery pack

13
producing 34 horsepower. This was the Prius power train from 1997–2003 (U.S. 2001–2003 models). The 2004, second-generation Prius used the HEV Synergy Drive power train, which combined a 1.5-liter four-cylinder gasoline engine, providing 76 horsepower and an electric drive motor resulting in a maximum power of 60 kilowatts (80 horsepower). This drive train was used from 2004 through 2009. In 2010, a third drive train entered manufacturing with a 1.8 liter gasoline engine that provided 98 horsepower and a 110 kW electric drive mower that provided 134 hp. The first drive train was used from 1997 to 2003 and the second version from 2004 to 2009. The third version of the Prius drive train is in its early years of production. Three power train versions have been developed in the 14-year period. Furthermore, an initial development period began in 1993, adding 4 years to make the total development period of the three Prius drive trains about 18 years, or 6 years per drive train. It is important to understand that long development times apply to most transportation technologies. The same multi-year development period applies to airplanes, trucks, and rail engines. The yearly announcement of a multitude of new cars does not refute this basic idea. Many of the yearly changes are cosmetic and done for marketing reasons. If we could eliminate yearly model changes but only change models when there is a major improvement in drive trains, car value might be held longer, as is the case of the Prius. And people might drive their cars much longer, resulting in a decrease of embodied energy. Failed car technologies also take a lot of time. Fuel cell development efforts span four decades and only concept models are available. The PNGV program for diesel hybrids lasted eight years before cancellation and the BEV program has lasted 14 years with marginal results so far. Many of these efforts employed high-risk technologies that should have stayed in the research labs much longer. The important thing to remember is that the technology failures are still long term, taking years to design, then taking more years to get to market, before closing down. Understanding the development cycle for drive train technologies and their potential benefit gives a long-range perspective. The Prius HEV Achievement The Prius HEV stands head and shoulders above most of the other HEVs at 50 MPG. I project a continued annual 1.5% increase in MPG, which is the rate of performance increase from the 41 MPG of the 1997 Prius to the 50 MPG of the 2011 Prius version (a 14-year period). The Prius is a combination of better HEV technology, more efficient internal combustion engines, and a revolutionary change of attitude by car owners. It shows that a commitment to meeting the climate change goals of an 80 percent reduction in CO2
emissions by 2050 is possible. We do not have to give up the private car per se but could probably eliminate most of the approximately 300 different models, settling on a few dozen extremely well built ones designed to mitigate climate change. The nation could increase our current national average from 22 MPG and our proposed mileage of 34 MPG by 2025 to a fleet performance range of 50-60 MPG within 14 years. As noted before, a 1.5 percent annual performance improvement is assumed, which is approximately 7.5 percent every five years. Table 9 shows this potential improvement for the Prius. This evaluation is to show that very high MPG is possible with a HEV designed for the best mileage.

14
Year Prius MPG Year
Prius MPG
2010 50 2035 71.8
2015 53.8 2040 77.2
2020 57.8 2045 83
2025 62.1 2050 89.2
2030 66.8
Table 9: Suggested Future MPG from Prius Evolution The Prius is exceptional in its success. Figure 1 showed that Toyota has sold about 70 percent of all HEVs made.27 The Prius alone represents half of all the HEVs sold in the U.S. in 2010. 28 Toyota’s commitment has been stronger than that of other companies. Figure 4 shows the patents for HEVs.
Figure 4: Percent of Known HEV Car Patents Filed by Car Companies
The Prius and its recently announced derivatives, 29 including the larger Prius v (to be shipped in 2011) and the smaller Prius c (to be shipped in 2012) might be the basis for a new brand of highly efficient cars from Toyota that could force other manufacturers to develop competitive responses. There are already indications that this may be happening with the announcement of Ford’s first 1.0 liter engine 30 and its commitment to its use in a new Focus car in Europe to be delivered in 2012.31 The auto industry is beginning to shift to more efficient gasoline and diesel cars.

15
The Future of the Gasoline Engine Historically, the MPG for a car is determined largely by the thermal efficiency of a gasoline engine. In general, the current thermal efficiency is about 20–25 percent for the internal combustion engine and 75–80 percent for electric motors. Because the power plant that generates the electricity is only about 33 percent efficient after taking into account electricity generation and transmission line losses, then the 75–80 percent efficiency for electric motors is misleading—it might be closer to 25–27 percent (one third of 75–80 percent). One can argue that power plant efficiency will improve. But it is as difficult to improve heat engines that generate electricity as it is to improve the internal combustion heat engines that lead to the rotary motion that moves a car. Table 10 shows the historical efficiency evolution of electrical generation systems. 32 The rate of improvement for both natural gas and hard coal between 1974 and 2003 was 0.5 percent per year. New technologies, such as higher temperature combustion for coal or combined cycle natural gas plants, will increase efficiency, but these are relatively long-term projects and their efficiency improvements will still be in the 0.5 – 1.0 percent per year range.
Natural Gas Efficiency
Hard Coal Efficiency
1974 1990 2003 1974 1990 2003
US 37 37 43 34 37 37
Western Europe 39 40 49 32 38 39
Japan 40 42 44 25 39 42
China - 35 44 27 31 33
Russia 36 33 33 - - -
World 36 35 42 30 34 35
Table 10: Evolution of Electrical Efficiency - Natural Gas and Hard-Coal Plants (%)
Major thermal improvements have been made with the Prius. Toyota claims that the engine used in the first- and second-generation Prius (the 1.5L 1NZ-FXE) had a thermal efficiency of about 37 percent and that the thermal efficiency of the new 1.8L unit in the third-generation Prius (2ZR-FXE) has a thermal efficiency of about 38 percent. Toyota is targeting a thermal efficiency of more than 40 percent with its Future Concept 1, followed by thermal efficiency of more than 45 percent in its Future Concept 2. Toyota suggests that such an engine applied in a HEV would result in total lifecycle greenhouse gas emissions comparable to that of an electric vehicle.33 A unique development path to improve gasoline engine performance has been under way for 18 years—since 1993 when Toyota initiated the Prius project. As noted earlier, Toyota’s HEV development began at the same time as the diesel HEVs of the Program for a New Generation of Vehicles, which was not successful. Eight years later, the U.S. changed paths to the fuel cell car. Eight years later (note program changes seem to occur with new administrations), the path was changed again to the Plug-In HEV. The Prius represents a successful significant improvement over the conventional internal combustion engine. The good news is the internal combustion engine makes the gasoline HEV a strong candidate for the “car of the future.” Electric cars will probably

16
have very little effect unless there are breakthroughs in generating electricity without CO2 at power plants. Such a breakthrough could take decades to deploy. Conclusion In my opinion, early HEVs like the Prius, the Insight and the Civic, were the cause of the so called “killing of the electric car” a decade ago, which was ignored in the movie “Who Killed the Electric Car?” It is likely that the 2012 50 MPG Prius will effectively “kill” the current models of EVs and PHEVs, including the Nissan Leaf and the Chevrolet Volt. The gasoline HEV is the only major breakthrough in automobile fuel economy in decades. Fuel cells, BEVs, PHEVs, and other architectures cannot compete with its MPG performance. In addition, the Prius has been a strong contender against other HEV manufacturers, leveraging its HEV Synergy Drive into a family of power trains being implemented throughout its fleet. Its dominance in the market suggests that it may be able to maintain this lead for some time. The Prius itself is now moving into a family of products—larger, smaller, and “pluggable.” Its pluggable version is a very small step to provide some electric drive capability; but its advantage still lies in its high MPG. Prius sales in the US in 2009, 2010 and 2011 were respectively 140,000, 141,000 and 136,000 cars out of total hybrid sales for the same year of respectively 290,000, 274,000 and 269,000 cars. This is a consistent 50%. For those concerned about fossil fuel availability and climate change, the HEV is the technology of choice. HEVs can obtain 30-40% better MPG than their conventional versions. Toyota is the leader in HEV technology providing several models with very high MPG performance. Honda and Ford seem to be the next best providers. Other companies have yet to catch up. However, there are now sufficient models to choose from should a buyer want to focus on value and low CO2 emissions. There seems to no near term competition to this technology from BEVs, PHEVs or fuel cell cars. This will probably remain the case for at least a decade.
1 US DOE EERE program, Transportation Figures and Facts
http://www1.eere.energy.gov/vehiclesandfuels/facts/2011_fotw657.html Accessed Jan 2012 2 Key Figures, World Automotive Industry http://oica.net/wp-content/uplo ads/2007/06/oica-
depliant-final.pdf Accessed Jan 2012 3 Most Band for the Buck: Toyota Prius is the top value among 300 cars, Consumers Reports,
April 2009, page 18 4 Best Values 300 cars Consumers Reports, April 2011, page 19
5 New Solutions by Pat Murphy, Community Solutions, April 2007
6 Spinning Our Wheels by Pat Murphy, Community Solutions, 2009
7 Trend of sales by HEV models from 1999-2010
http://www.afdc.energy.gov/afdc/data/vehicles.html#afv_hev Select HEV Sales by Model Accessed Jan 2012 8 US DOE EERE program, Transportation Figures and Facts , Fact #678: June 6, 2011
Manufacturer Market Share of HEV Vehicles, Accessed Jan 2012 9 2010 Annual HEV Cost Analysis, July 21, 2010
http://www.bcaa.com/wps/portal/BCAA/search/search_details?rdePathInfo=xchg/bcaa-com/hs.xsl/11343.htm Accessed Jan 2012

17
10
http://www.bcaa.com/-/media/BCAA/files/brochures/BCAA_Backgrounder_BCAA_Hybrid_Cost_Analysis_2011_FINAL.ashx Accessed Dec 2011 11
UCS “Hybrid ScoreCard” Dings Automakers for Forced Features in Hybrid Offerings 28 January 2010 http://www.greencarcongress.com/2010/01/ucs-20100128.html Accessed Jan 2012 12
Hybrid Scorecard, http://www.HEVcenter.org/HEV-scorecard/index.html Accessed Jan 2012 13
Why Plug-In Vehicles Are a Luxury No Nation and No Investor Can Afford by: John Petersen, February 14, 2011 http://seekingalpha.com/article/252568-why-plug-in-vehicles-are-a-luxury-no-nation-and-no-investor-can-afford Accessed Dec 2011 14
Honda Civic Promotion http://automobiles.honda.com/civic-sedan/ http://automobiles.honda.com/civic-HEV/ Accessed Dec 2011 15
Toyota introduces 7th generation Camry for 2012 with improved fuel economy and performance across all models; ~39% jump in EPA city cycle fuel economy for the HEV 23 August 2011 http://www.greencarcongress.com/2011/08/camry-20110823.html Accessed Jan 2012 16
2012 Toyota Camry HEV Unveiled by Jeff Cobb, August 23, 2011 http://www.HEVcars.com/news/2012-toyota-camry-HEV-unveiled-30763.html Accessed Jan 2012 17
LDV Fuel Consumption by Fuel Economy http://www.afdc.energy.gov/afdc/data/vehicles.html Under the category Fuel Consumption and Efficiency select Light-Duty Vehicle Fuel Consumption by Fuel Economy. Accessed Jan 2012 18
http://energy.senate.gov/public/index.cfm?FuseAction=Hearings.Testimony&Hearing_ID=287981fa-c472-4862-857d-3913d416297e&Witness_ID=e2050b74-5cff-4f6f-9832-fec00f3ab26c Accessed Jan 2012 19
GM Urges Feds to Fund Major Battery Research and Development Effort 30 January 2007 – Click on German Testimony http://www.greencarcongress.com/2007/01/gm_urges_feds_t.html Accessed Jan 2012 20
US DOE EERE program, Transportation Figures and Facts http://www1.eere.energy.gov/vehiclesandfuels/facts/2011_fotw657.html Accessed Jan 2012 21
Historical Fuel Mileage No Change July 2009 A http://www.newscientist.com/article/dn17506-us-vehicle-efficiency-hardly-changed-since-model-t.html Accessed Jan 2012 22
US DOE EERE program, Transportation Figures and Facts http://www1.eere.energy.gov/vehiclesandfuels/facts/2008_fotw504.html Accessed Jan 2012 23
Energy Use in the New Millennium Trends in IEA Countries In support of the G8 Plan of Action OECD/IEA, 2007 http://www.iea.org/textbase/nppdf/free/2007/millennium.pdf Accessed Jan 2012 24
Table 2.13 and 2.14 Energy Intensities 1970-2009 for BTU/passenger mile Transportation Energy Data Book Edition 30, 2011 25
Assessment of Fuel Economy Technologies for Light-Duty Vehicles by Committee on the Assessment of Technologies for Improving Light-Duty Vehicle Fuel Economy; National Research Council, 2011 http://www.nap.edu/openbook.php?record_id=12924&page=10 Accessed Jan 2012 26
http://oica.net/wp-content/uploads/climate-change-and-co2-brochure.pdf Accessed Jan 2012 27
US DOE EERE program, Transportation Figures and Facts Fact #678: June 6, 2011 Manufacturer Market Share of HEV Vehicles, 2010 Accessed Jan 2012 http://www1.eere.energy.gov/vehiclesandfuels/facts/2011_fotw678.html Accessed Jan 2012 28
December 2010 Dashboard: Year End Tally Published January 7, 2011 http://www.HEVcars.com/HEV-clean-diesel-sales-dashboard/december-2010.html Accessed Jan 2012 29
http://www.toyota.com/upcoming-vehicles/prius-family/ Accessed Jan 2012 30
Ford new Engine http://www.upi.com/Business_News/2011/06/03/Ford-has-10-liter-engine-in-development/UPI-95661307117820/

18
http://media.ford.com/article_display.cfm?article_id=34736 Accessed Jan 2012 31
New 3-cylinder, 1.0-liter Ford EcoBoost engine to debut in European Focus range by Green Car Congress September 12, 2011 http://www.greencarcongress.com/2011/09/1lecoboost-20110912.html Accessed Jan 2012 32
Energy Technology Perspectives, Scenarios and Strategies to 2050 by International Energy Agency, 2006 page 179 33
Toyota targeting thermal efficiency of more than 45% for next-generation gasoline engines for HEVs 11 April 2011 http://www.greencarcongress.com/2011/04/nakata-20110411.html Accessed Jan 2012