food mirages: geographic and economic barriers to healthful food access in portland, oregon
TRANSCRIPT

Food mirages: Geographic and economic barriers to healthful foodaccess in Portland, Oregon
Betsy Breyer n, Adriana Voss-AndreaeDepartment of Geography, PO Box 751-GEOG, Portland State University, Portland, OR 97207-0751, USA.
a r t i c l e i n f o
Article history:Received 21 December 2012Received in revised form17 July 2013Accepted 28 July 2013Available online 26 August 2013
Keywords:Food accessFood pricesSpatial analysisPortlandOregon
a b s t r a c t
This paper investigated the role of grocery store prices in structuring food access for low-incomehouseholds in Portland, Oregon. We conducted a detailed healthful foods market basket survey anddeveloped an index of store cost based on the USDA Thrifty Food Plan. Using this index, we estimatedthe difference in street-network distance between the nearest low-cost grocery store and the nearestgrocery store irrespective of cost. Spatial regression of this metric in relation to income, poverty, andgentrification at the census tract scale lead to a new theory regarding food access in the urban landscape.Food deserts are sparse in Portland, but food mirages are abundant, particularly in gentrifying areaswhere poverty remains high. In a food mirage, grocery stores are plentiful but prices are beyond themeans of low-income households, making them functionally equivalent to food deserts in that a longjourney to obtain affordable, nutritious food is required in either case. Results suggested that evaluationof food environments should, at a minimum, consider both proximity and price in assessing healthy foodaccess for low-income households.
& 2013 Elsevier Ltd. All rights reserved.
1. Introduction
Much of the recent discussion around equitable food accessin North American cities has centered on food deserts, or areaslacking physical access to full-service grocery stores. This paperargues that the food environment in Portland, Oregon is markednot only by food deserts but also by food mirages. In a food mirage,full service grocery stores appear plentiful but, because food pricesare high, healthful foods are economically inaccessible for low-income households. Food mirages are invisible using conventionalapproaches to food desert identification, but affect food access forlow-income households similarly—a long journey to obtain afford-able, nutritious food is required either way.
We borrow the term food mirage from Short et al. (2007), whocritique the assumption that food access arises from proximity to afull-service national chain grocery store. Everett (2011) also usesthe term in her account of a public health coalition that aimed toencourage healthier eating habits among low-income Hispanichouseholds in North Portland. Everett reports:
…although North Portland has several large grocery stores,Hispanic parents find them expensive and lacking in culturallyappropriate foods, and therefore travel long distances to shopin discount supermarkets. We describe this phenomenon as a
‘food mirage,’ rather than a food desert, and argue that thepotential impact on health is similar—managing the challengesof time, distance and cost means infrequent shopping trips andless fresh produce. (Everett, 2011, p. 14)
Taking Everett’s anecdotal evidence as a point of departure, thispaper identified food mirages with spatial analysis of food price datafrom a 2011 market basket survey of healthful food in the City ofPortland. We assessed store affordability for low-income householdsin relation to benchmark prices informed by the U.S. Department ofAgriculture (USDA) Thrifty Food Plan (TFP). Geographic informationsystems (GIS) and spatial regressionwere used to investigate relation-ships among store locations, affordability, and socioeconomic vari-ables at the census tract scale. Throughout this paper, we refer to“food mirages” as census tracts where food access limitations stemfrom a lack of affordable, healthful options rather than an absence ofgrocery stores. Results confirmed previous findings that convention-ally defined food deserts are rare in Portland (Sparks et al., 2010;Leete et al., 2012). Food mirages, by contrast, cover much of the city,with the most extreme cases coinciding with gentrifying areas withrelatively high rates of household poverty. We argue that the barriersto healthful food access in Portland arise primarily from demand-sideconsiderations – incomes, food budgets, and the spatial patterning offood prices – rather than solely the locations of full-service grocerystores and areas of concentrated social deprivation. The paperconcludes by connecting food mirages to inner city gentrificationand possible emergence of suburban food deserts.
Contents lists available at ScienceDirect
journal homepage: www.elsevier.com/locate/healthplace
Health & Place
1353-8292/$ - see front matter & 2013 Elsevier Ltd. All rights reserved.http://dx.doi.org/10.1016/j.healthplace.2013.07.008
n Corresponding author. Tel.: þ1 213 446 1650; fax: þ1 503 725 3166.E-mail addresses: [email protected] (B. Breyer),
[email protected] (A. Voss-Andreae).
Health & Place 24 (2013) 131–139

1.1. Food deserts
At its core, the food desert metaphor posits a linkage betweenpoverty, access to nutritious and affordable food, and poor diet-relatedhealth outcomes (Beaulac et al., 2009; Larson et al., 2009; Charreireet al., 2010; Walker et al., 2010). Formulated generally, the concept hasbroad explanatory power. Socioeconomic status has been identified asa key predictor of diet across developed countries (Darmon andDrewnowski, 2008; Monsivais and Drewnowski, 2009). Fruit andvegetable consumption tends to vary inversely with distance to agrocery store (Rose and Richards, 2004; Zenk et al., 2008), although atleast one study found this not to be the case (Boone-Heinonen et al.,2011). Statistically significant correlations between socioeconomicstatus and the local food environment have been found in numerouscase studies, particularly in Midwestern and Eastern U.S. cities (Alwittand Donley, 1997; Moore and Diez Roux, 2006; Franco et al., 2008;Gordon et al., 2011).
As the food desert concept has become relevant to politics andpolicy (Ver Ploeg et al., 2009), this general formulation has beenoperationalized for GIS analyses based on the following assump-tions. First, full-service grocery stores, usually national chainstores, have been assumed to proxy for the presence of nutritious,affordable food. Second, households have been assumed to buyfood from the nearest retailer. Third, food deserts are assumed toexist only in areas of concentrated poverty (Leete et al., 2012).Jiao et al. (2012) also note that the mode of transportation is assumedto be the same for all residents. We refer to these assumptions as theconventional approach to food desert identification.
These assumptions allow food environments to be reduced toquantities and scrutinized from afar. However, evidence to supporttheir validity is mixed. On the first point, Chung and Myers (1999) andHubley (2011) found that chain stores offer lower prices than inde-pendently owned stores, while Cummins and Macintyre, 2002a;Cassady et al., 2007 and Short et al., 2007 obtained the inverse result;this assumption may be place-specific. The second assumption mayunderestimate the importance of variability among food retailers.Store type may be an important parameter of overall food access(Block and Kouba, 2006; Drewnowski et al., 2012). Empirical evidencehas indicated that, in some U.S. cities, low-income households do notnecessarily shop at their neighborhood grocery store or even thenearest chain store because product mixes and price points vary(Drewnowski et al., 2010; Hillier et al., 2011). Nationally, SupplementalNutrition Assistance Program (SNAP) recipients live, on average,1.8 miles from a full-service grocery store but travel a mean distanceof 4.9 miles from home to shop for food (Ver Ploeg et al., 2009). On thethird point, barriers to healthful food access may not coincide withareas with concentrated poverty. Multiple researchers have failed tofind food deserts in areas of social deprivation (Apparicio et al., 2007;Sharkey and Horel, 2008; Lee, 2012). Simultaneously, areas of con-centrated poverty have become more diffuse, even suburbanized, withrecent demographic shifts (Richardson et al., 2012). These findingssuggest that other pathways to poor diet-related health outcomes,apart from spatial proximity to any full-service grocery store. One suchpathway may be food prices.
1.2. Food prices
A growing body of economics and public health research links foodprices to consumption patterns and diet-related health outcomes.On the basis of price per calorie, fresh produce is considerably morecostly than energy-dense processed foods (Drewnowski, 2004; Rehmet al., 2011).1 Moreover, since 1980, the real price of fresh produce has
risen while the price of energy-dense food (including soda) has fallen(Wendt and Todd, 2011). Basic principles of microeconomics suggestthat consumption of some commodity will be negatively correlatedwith its price. An econometric meta-analysis found that a 10% increasein the price of soft drinks would reduce consumption by 8% to 10%,while a 10% reduction in the price of vegetables would increaseconsumption 5.8% to 7% (Andreyeva et al., 2010). Price reductions, forexample through discounts, vouchers or coupons, have been shownto increase consumption of fruits and vegetables (Glanz and Yaroch,2004). The Special Supplemental Nutrition Program for Women,Infants and Children (WIC) program’s cash value vouchers, whichprovides monthly supplementary checks to low-income women forfruit and vegetable purchases, is another type of economic subsidythat has been shown to increase the quantity of fresh fruit andvegetable purchases (Gleason and Pooler, 2011; Herman et al., 2006).
Regionally, food prices co-vary with obesity rates (Todd et al., 2011).Lower fruit and vegetable prices are associated with lower bodyweight among low-income populations (Powell and Chaloupka, 2009;Powell et al., 2013) and larger food budgets are associated with highernutrient intake (Monsivais et al., 2011; Aggarwal et al., 2012). Regionswith lower prices for dark green vegetables and milk tend to haverelatively low child body-mass index (BMI); low-income householdsexhibit the highest price sensitivity for these items (Wendt and Todd,2011). Adolescents in the highest quintile for BMI tend to come fromlower-income households who, again, exhibit the highest sensitivityto food prices (Auld and Powell, 2009). These findings suggest aprominent role for food prices in understanding any shifts in foodconsumption patterns and health outcomes, particularly among low-income households facing very tight budget constraints.
1.3. Study area: Portland, Oregon
Conventional approaches have not found more than a fewcensus tracts in Portland that satisfy the criteria for food deserts(Margheim, 2007; Sparks et al., 2010). Many tracts along thesuburban periphery are more than 1 mile from a grocery store,but do not constitute food deserts because they lack sufficientconcentrations of households experiencing poverty or socialdepravation (Leete et al., 2012). Redlining and disinvestment oncemarked closer-in neighborhoods, particularly those in North andNortheast Portland–they may have been food deserts in the late20th century (Gibson, 2007). However, these areas are rapidlygentrifying and are largely well served by grocery stores. Citywide,lower-income areas tend to be associated with shorter distances tothe nearest grocery store (Armstrong et al., 2009).
Despite relatively equitable spatial access to grocery stores,over half of Multnomah County’s adult residents are consideredoverweight or obese, signaling the operation of some other path-way to poor diet-related health outcomes (Multnomah CountyHealth Department, 2008). Community food assessments haverevealed that low-income households experience food insecuritywhile living within walking distance of a full-service grocery store(Interfaith Food and Farms Partnership, 2007). Anecdotal evidenceexists for low-income households spurning their neighborhoodgrocery stores and travelling long distances to shop at discountfood retailers on the urban periphery (Casey, 2008; Everett, 2011).
The largest municipality within a rapidly growing metropolitanregion, the City of Portland is located near the confluence of theWillamette and Columbia Rivers. The city has a population of over580,000 (Population Research Center, 2012) and a notable foodculture (Asimov, 2007). The Westside (west of the WillametteRiver) contains the downtown district and the affluent West Hillsarea. The Eastside (east of the Willamette River), Interstate 205(I-205) freeway serves as an important socioeconomic boundary,with housing density and income tending to be lower directly eastof I-205. The study area outlined in Fig. 1 comprises 140 census
1 However, other measures (price-per-portion) yield more comparable results(Carlson and Frazão, 2012).
B. Breyer, A. Voss-Andreae / Health & Place 24 (2013) 131–139132
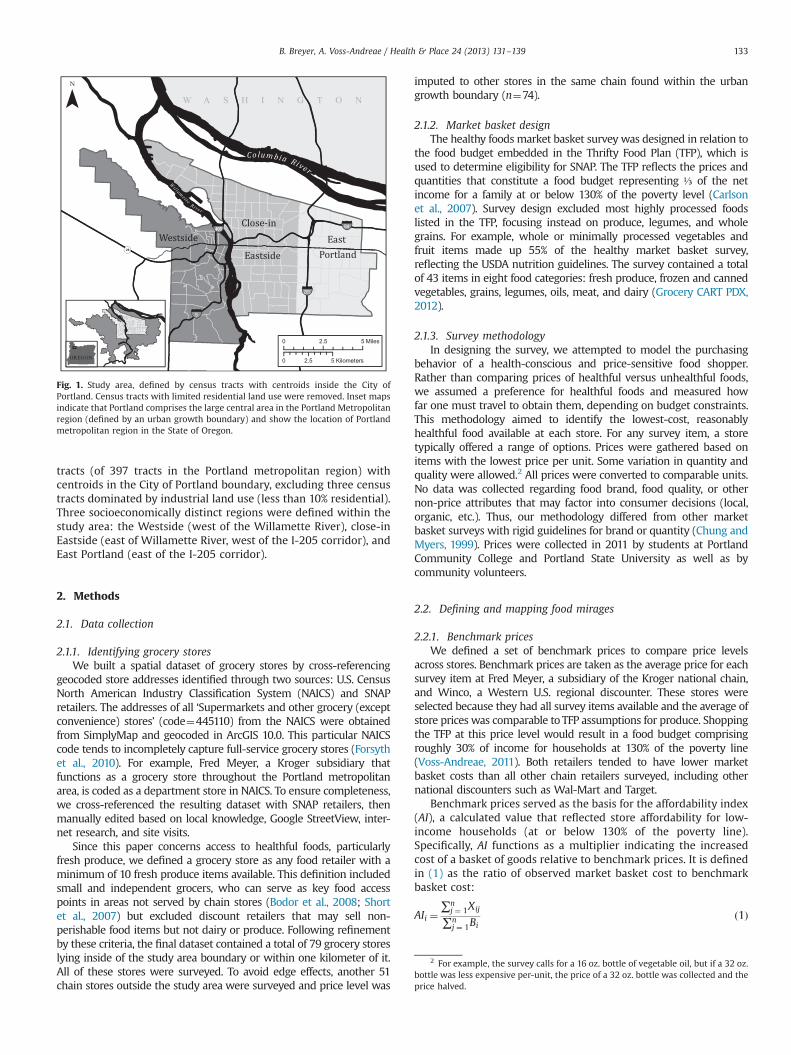
tracts (of 397 tracts in the Portland metropolitan region) withcentroids in the City of Portland boundary, excluding three censustracts dominated by industrial land use (less than 10% residential).Three socioeconomically distinct regions were defined within thestudy area: the Westside (west of the Willamette River), close-inEastside (east of Willamette River, west of the I-205 corridor), andEast Portland (east of the I-205 corridor).
2. Methods
2.1. Data collection
2.1.1. Identifying grocery storesWe built a spatial dataset of grocery stores by cross-referencing
geocoded store addresses identified through two sources: U.S. CensusNorth American Industry Classification System (NAICS) and SNAPretailers. The addresses of all ‘Supermarkets and other grocery (exceptconvenience) stores’ (code¼445110) from the NAICS were obtainedfrom SimplyMap and geocoded in ArcGIS 10.0. This particular NAICScode tends to incompletely capture full-service grocery stores (Forsythet al., 2010). For example, Fred Meyer, a Kroger subsidiary thatfunctions as a grocery store throughout the Portland metropolitanarea, is coded as a department store in NAICS. To ensure completeness,we cross-referenced the resulting dataset with SNAP retailers, thenmanually edited based on local knowledge, Google StreetView, inter-net research, and site visits.
Since this paper concerns access to healthful foods, particularlyfresh produce, we defined a grocery store as any food retailer with aminimum of 10 fresh produce items available. This definition includedsmall and independent grocers, who can serve as key food accesspoints in areas not served by chain stores (Bodor et al., 2008; Shortet al., 2007) but excluded discount retailers that may sell non-perishable food items but not dairy or produce. Following refinementby these criteria, the final dataset contained a total of 79 grocery storeslying inside of the study area boundary or within one kilometer of it.All of these stores were surveyed. To avoid edge effects, another 51chain stores outside the study area were surveyed and price level was
imputed to other stores in the same chain found within the urbangrowth boundary (n¼74).
2.1.2. Market basket designThe healthy foods market basket survey was designed in relation to
the food budget embedded in the Thrifty Food Plan (TFP), which isused to determine eligibility for SNAP. The TFP reflects the prices andquantities that constitute a food budget representing ⅓ of the netincome for a family at or below 130% of the poverty level (Carlsonet al., 2007). Survey design excluded most highly processed foodslisted in the TFP, focusing instead on produce, legumes, and wholegrains. For example, whole or minimally processed vegetables andfruit items made up 55% of the healthy market basket survey,reflecting the USDA nutrition guidelines. The survey contained a totalof 43 items in eight food categories: fresh produce, frozen and cannedvegetables, grains, legumes, oils, meat, and dairy (Grocery CART PDX,2012).
2.1.3. Survey methodologyIn designing the survey, we attempted to model the purchasing
behavior of a health-conscious and price-sensitive food shopper.Rather than comparing prices of healthful versus unhealthful foods,we assumed a preference for healthful foods and measured howfar one must travel to obtain them, depending on budget constraints.This methodology aimed to identify the lowest-cost, reasonablyhealthful food available at each store. For any survey item, a storetypically offered a range of options. Prices were gathered based onitems with the lowest price per unit. Some variation in quantity andquality were allowed.2 All prices were converted to comparable units.No data was collected regarding food brand, food quality, or othernon-price attributes that may factor into consumer decisions (local,organic, etc.). Thus, our methodology differed from other marketbasket surveys with rigid guidelines for brand or quantity (Chung andMyers, 1999). Prices were collected in 2011 by students at PortlandCommunity College and Portland State University as well as bycommunity volunteers.
2.2. Defining and mapping food mirages
2.2.1. Benchmark pricesWe defined a set of benchmark prices to compare price levels
across stores. Benchmark prices are taken as the average price for eachsurvey item at Fred Meyer, a subsidiary of the Kroger national chain,and Winco, a Western U.S. regional discounter. These stores wereselected because they had all survey items available and the average ofstore prices was comparable to TFP assumptions for produce. Shoppingthe TFP at this price level would result in a food budget comprisingroughly 30% of income for households at 130% of the poverty line(Voss-Andreae, 2011). Both retailers tended to have lower marketbasket costs than all other chain retailers surveyed, including othernational discounters such as Wal-Mart and Target.
Benchmark prices served as the basis for the affordability index(AI), a calculated value that reflected store affordability for low-income households (at or below 130% of the poverty line).Specifically, AI functions as a multiplier indicating the increasedcost of a basket of goods relative to benchmark prices. It is definedin (1) as the ratio of observed market basket cost to benchmarkbasket cost:
AIi ¼∑n
j ¼ 1Xij
∑nj ¼ 1Bi
ð1Þ
Fig. 1. Study area, defined by census tracts with centroids inside the City ofPortland. Census tracts with limited residential land use were removed. Inset mapsindicate that Portland comprises the large central area in the Portland Metropolitanregion (defined by an urban growth boundary) and show the location of Portlandmetropolitan region in the State of Oregon.
2 For example, the survey calls for a 16 oz. bottle of vegetable oil, but if a 32 oz.bottle was less expensive per-unit, the price of a 32 oz. bottle was collected and theprice halved.
B. Breyer, A. Voss-Andreae / Health & Place 24 (2013) 131–139 133

where Xij is the sum of costs for item j at store i and Bj is thebenchmark cost for item j. Any store with AI¼1 has pricescomparable to benchmark. AI¼2 indicates that the same basketof goods would cost twice as much as the same basket at bench-mark prices. We assumed that only stores with AIr1 are afford-able for low-income households, in the sense that SNAP recipientson a TFP budget would be able to keep costs of a healthful dietwithin 30% of income. Stores with AIr1 were considered low-coststores. Similar to Jiao et al. (2012), we determined that grocerystores with AI41.4 are high-cost stores.
2.2.2. Deriving ‘potential’ food miragesApparicio et al. (2007) have argued that food access cannot be
described in a single measure because distance, density, and variety allfactor into a comprehensive view of the food environment. However,Sparks et al. (2010) and Leete et al. (2012) found reasonable agreementbetween these food access measures in the case of Portland, so welooked at access only in terms of distance. We measured the street-network (rather than Euclidean) walking distance from census blockcentroids (n¼7376) to the nearest store in ArcGIS 10.0. We repeatedthe process for only those stores with AIr1. We took the differencebetween these store distances as the food mirage value for each block.Blocks were chosen because they are the finest scale available fromthe U.S. Census, with an average of 52 blocks nested within eachcensus tract. Eq. (2) was then used to obtain Di, a census tract-levelestimate of potential food mirage distance from the population-weighted mean block-level distances:
Di ¼∑bA ipbðmin jdsbÞ
∑bA ipbð2Þ
where pb is the block-level population and dsb is the distance tonearest store for block b in tract i. We considered Di to be ‘potential’food mirages because the presence of an actual economic barrierarises only where large food mirage distances coincide with lowincomes.
2.2.3. Identifying actual food miragesTo identify actual food mirages, we eliminated census tracts
with a low-cost store within 1 mile (1.6 km), since no economicbarrier was present. We also removed tracts with annual incomesabove the 75th percentile ($60,170), as these residents canpresumably afford to drive to any grocery store. 95% of householdsin poverty reside in the remaining 85 census tracts, from 140 totaltracts. Within this subset, we distinguished between three types offood access situations that differ based on the distance to thenearest store: o0.5 mile (extreme food mirage), between 0.5 and1 mile (moderate food mirage), and 41 mile (akin to a low-density food desert or, more specifically, a food ‘hinterland’ asdescribed by Leete et al. (2012)).
2.3. Spatial regression
2.3.1. Model developmentWe developed a series of regression models to explore correlations
between the food environment and socioeconomic context at thecensus tract scale. Using stepwise linear regression, we selected thefollowing socioeconomic predictor variables: median family income,poverty rate, and % change in white population from 2000 to 2010.Note that the poverty rate in Portland does not always co-vary withmedian income (correlation¼0.37) due to affordable housing require-ments. These data were derived from the 2006–2010 AmericanCommunity Survey. We take % change in white population between2000 and 2010 U.S. Census as a proxy for gentrification, which hasmarked Portland’s cultural landscape, particularly in areas of the close-in Eastside (Gibson, 2007).
2.3.2. Spatial autocorrelationSpatial regression techniques were used to identify relationships
with socioeconomic variables while accounting for spatial autocorre-lation to avoid spurious correlations that arise from spatial depen-dencies among adjacent geographic units (Rogerson, 2010). RobustLagrange Multiplier diagnostics from ordinary least squares regres-sions, conducted in OpenGeoDa v.1.0.1 (Anselin et al., 2006), indicatedthat a spatial lag model was appropriate. Spatial lag regression takesthe form of:
Yi ¼ β0þβ1XiþρWYjþεi ð3Þwhere Yi the food environment variable for tract i, Xi is the socio-economic predictor for tract i, βi is the regression coefficient, ρ is aspatial autoregressive coefficient, WYj is the spatially lagged foodenvironment variable averaged over five nearest neighbors, and εi isa random error term. Spatial regressions were conducted for twodependent variables: distance to the nearest grocery store andpotential food mirage distance. To determine whether the influenceof predictor variables differed across the study area, we conductedstratified analysis in three regions: Westside, close-in Eastside, andEast Portland (see Fig. 1 and Section 1.3) East Portland.
3. Results
3.1. Store distance and food affordability
Grocery stores were fairly evenly distributed throughout the studyarea (Fig. 2a). The average street-network distance to the nearestgrocery store was 0.7 mile (1.1 km). Without considering prices, foodaccess would appear best near the city center, where store distancesare less than 0.25 mile (0.4 km), andworst along the peripheries of thestudy area, where store distances exceed 2mile (3.2 km). Whengrocery stores are classified by price level, however, a different spatialdistribution is evident. Most low-cost stores were clustered in thevicinity of I-205. As a result, the average street-network distance to thenearest low-cost grocery store is 2.5 mile (4 km). Based on tract-levelpopulation and poverty rates, we estimated that 81% of all people inpoverty in Portland reside in census tracts that are more than 1milefrom a low-cost store, representing 13% of the total population.In contrast, 20% of the low-income population resides in census tractsthat are more than 1mile from any type of grocery store, representing3% of the population. A negative correlation between AI and proximityto the nearest affordable store was found, such that store distanceincreases nonlinearly as AI falls to 1 (Fig. 2b).
3.2. A typology of food mirages
The techniques in Section 2.2.2 were used to derive thepopulation-weighted distance to nearest grocery, nearest low-cost store, and food mirage distance by census tract (Fig. 3a–c).Although few areas of the city were more than 1 mile from agrocery store, much of the City of Portland is not served by a low-cost store. As a result, much of the city is a potential food miragefor households facing tight budget constraints.
Fig. 4 used the techniques described in Section 2.2.3 to identifyand map actual food mirages. Extreme food mirages, symbolizedby the smallest circles, tended to appear in the close-in Eastside. Foodhinterlands, symbolized by the largest circles, occured mainly incensus tracts east of I-205. Summary statistics in Table 1 indicatedthat extreme food mirages tend to have the lowest incomes andhighest rates of poverty, as well as the largest increases in whitepopulation (mean increase 5.08%). By contrast, food hinterlands wereassociated with higher mean incomes and diversifying populations(mean decrease in white population 3.3%), although poverty rateswere comparable to extreme food mirages. Of the 81% of people in
B. Breyer, A. Voss-Andreae / Health & Place 24 (2013) 131–139134

poverty residing more than 1 mile from a low-cost store, the majority(65%) live in either moderate or extreme food mirages and musttravel, on average, 1.8 miles (2.9 km) past the nearest grocery store toarrive at the nearest low-cost store. For the remainder, the nearestgrocery store is low-cost.
3.3. Results of regression analysis
Spatial regression results for store distance indicated that, afteraccounting for the effect of spatial autocorrelation, higher incometracts were associated with longer store distances, although the samewas true for higher-poverty census tracts (Table 2). This result arosefrom the fact that some downtown census tracts were characterizedby both relatively high poverty rates and highmedian family incomes.Gentrifying census tracts were associated with shorter store distances.Note that coefficients are higher for East Portland, since grocery storesare generally more dispersed in this region (Table 1). These relation-ships were inverted with respect to potential food mirage distance
Fig. 3. Population-weighted street-network distance by census tract (n¼140).(a) Distance to nearest grocery store. 27 tracts were found to be located morethan 1 mile from any grocery store. These census tracts are either conventionally-defined food deserts (areas of concentrated poverty) or food hinterlands (see Leeteet al., 2012). (b) Distance to nearest low-cost store. 116 census tracts are more than1 mile away from a low-cost store. (c) Food mirage distance, calculated bysubtracting (b) from (a). 96 census tracts are associated with a food mirage distanceof more than 1 mile.
Fig. 2. (a) Spatial distribution of grocery stores by cost. The majority of low-coststores, defined by affordability index (AIr1), are spatially clustered in or near EastPortland. (b) Relationship between AI value and block-level distance to the nearestgrocery store. Although Portland residents live an average of 0.7 mile (1.1 km) fromthe nearest grocery store, they must travel an average of 1.9 mile (3.1 km) farther toreach the nearest low-cost grocery store.
B. Breyer, A. Voss-Andreae / Health & Place 24 (2013) 131–139 135

(Table 3). Potential food mirage distance was negatively associatedwith median family income and the household poverty rate, whilepositively associated with gentrification. Stratified regression revealedthat coefficients were statistically significant in the close-in Eastsidearea of the city, indicating that the link between socioeconomiccontext and food mirages was strongest in this region.
4. Discussion
4.1. Gentrification in food mirages
The conventional food desert approach presumes that grocerystore prices are reasonably equivalent, such that any full-servicegrocery store proxies for access to affordable food. Our surveydemonstrated that grocery stores in the same city offered drasti-cally different price points, such that many stores are not afford-able for low-income households. Food access depends on storeaffordability, which must be understood as a function of income.As income increases, so do the number of affordable storesand thus spatial proximity to affordable food. By foregroundinginteractions among income, price, and proximity, a food mirageapproach captures otherwise-invisible barriers to healthful diets.
These barriers are particularly relevant for low-income householdsin gentrifying areas of Portland, where stores are plentiful butprices are uniformly high.
It is no coincidence that food mirages are at their most extreme ingentrifying census tracts of North and Northeast Portland. In theseareas, a wide variety of urban amenities, including higher-costgrocery stores, have recently clustered to service increasingly affluent(and mostly white) populations—similar shifts are underway innumerous American cities (Quastel, 2009; Hyra, 2012). In the caseof Portland, this shift is associated with increasing costs of living, interms of both housing and food, which has lead to displacement oflow-income households into suburban areas of the East Portland,where the cost of living is lower (Gibson, 2007). In effect, low-incomehouseholds are migrating out of extreme food mirages and into foodhinterlands. To the extent that this process is concentrating povertyin certain East Portland census tracts, the same processes thathave produced food mirages could be producing the beginnings ofsuburban food deserts.
4.2. Food justice
Although food mirages can be measured quantitatively andmapped in a GIS, identifying potential remedies requires a morecritical, discursive approach. Issues of class and food justice aresensitive to their framing (Cummins and Macintyre, 2002b). If poordiet-related health outcomes are framed as problems of proximityto a grocery store – any grocery store – then simply by adding grocerystores to under-served areas would seem to resolve the problem.Guthman (2011) contends that the discourse around food justice hasplaced too much emphasis on supply-side, geographic measures ofaccess at the expense of demand-side, economic barriers related tohousehold income and budget constraints. In doing so, the discourse
Householdsin poverty
Distance to nearest store
< 1/2 mile
1/2 - 1 mile
> 1 mile
0 - 50th
51st - 75th
76th - 100th
No accessbarrier
Fig. 4. Map of ‘actual’ food mirages, with household poverty overlay. Tracts where noaccess barrier is present, either because low-cost stores are within 1mile or becausetract-level median family income was in the top quartile, were removed. In the urbancore, grocery stores tend to be plentiful (small circles) but prices are high. Along theperiphery, stores are in general more dispersed (larger circles) but low-cost stores areavailable. Households in poverty reside in both the urban core and suburban periphery.
Table 1Mean values for tract-level variables for study area partitioned into food accesssituations: extreme food mirage (nearest store o0.5 mile), moderate food mirage(0.5 mileonearest storeo1 mile), food hinterland (nearest store41 mile), no foodmirage (low cost storeo1 mile), and high incomes (median income475th per-centile for study area). Extreme food mirages are associated with the lowestincomes, highest rates of gentrification, and highest poverty rates.
Income Householdsin poverty(%)
Gentrification(% changewhite)
Neareststore(miles)
Foodmiragedistance(miles)
Extremefood
mirage$38,690 22.40 5.08% 0.37 2.55
Moderatefood
mirage$44,821 17.91 1.18% 0.70 2.01
Foodhinterland
$46,363 20.17 �3.30 1.30 1.53
No foodmirage
$54,178 13.17 �2.18% 0.53 0.17
Highincomes
$86,029 7.67 �0.63% 0.91 2.41
Study area $54,067 16.36 0.62% 0.72 1.92
Table 2Spatial regression results for store distance by census tract (n¼140). Coefficientsare smaller than one would obtain using ordinary least square regression becausevariation in the response variable has been partitioned between the socio-economic variables and the spatial lag. Units for coefficients are feet per unit ofthe predictor variable.
Spatialextent
Median family income(US$1000)
Householdpoverty rate
Gentrification SpatialLag
Study area 44.48849nnn 60.57993nn �54.33194nn 0.5246nnn
Close-ineastside
25.49712n 54.8377nn �13.1580 0.3658nn
Far-outeastside
174.4405nnn 181.5422nn 80.9157 0.4540nn
Westside 49.99646nn 43.2656 �231.5638nn 0.2868
n p¼0.05.nn p¼0.01, 0.001.nnn po0.0001.
Table 3Spatial regression results for mirage distance by census tract (n¼140). Signs of allrelationships are the inverse of results for store distance. Units for coefficients arefeet per unit of the predictor variable.
Spatialextent
Median family income(US$1000)
Householdpoverty rate
Gentrification Lag
Study area �16.2482 �9.9357 32.3834 0.9529nnn
Close-ineastside
�39.9766nn �50.6037n 48.74478n 0.9630nnn
Far-outeastside
�66.2258 �29.5479 �99.8234 0.9230nnn
Westside �12.6220 �42.3495 142.7623 0.7620nnn
n p¼0.05.nn p¼0.01, 0.001.nnn po0.0001.
B. Breyer, A. Voss-Andreae / Health & Place 24 (2013) 131–139136

neatly sidesteps complex issues of affordability, need, and class.Supporting this assertion, Short et al. (2007) argue that efforts toincrease food availability in low-income neighborhoods “should notdistract from ensuring that residents can pay for it” (Short et al., 2007,p. 362). These critiques are particularly relevant in Portland, wherefood access depends on not only grocery store locations but also foodprices and the patterning of affluence and poverty.
By the same token, framing food access as merely a problem ofprice neglects its systemic context. For example, a proliferation ofWal-marts throughout low-income neighborhoods has been proposedas a solution to inequitable food access (TheWhite House, Office of theFirst Lady, 2011). However, our price survey found that Walmart priceswere slightly above our benchmark for affordability, mainly because ofabove-benchmark prices for fresh produce, which comprised a largeshare of our market basket. Apart from price, the nutritional valueof Wal-mart produce has been called into question (Clifford, 2013).Furthermore, in considering an intervention in the food environment,one must balance any improvements in food access against possiblenegative externalities imposed on households, communities, and tothe food system at large (Goetz and Swaminathan, 2006; Neumarket al., 2007; Dube et al., 2007; Courtemanche and Carden, 2011; Daviset al., 2012; Hauter, 2012). Another possible remedy to food mirageswould be intervention in agricultural sector to slow the growth infresh produce prices, but this would require consideration of broaderfood production priorities. At the minimum, food access depends onboth price and proximity; however, any intervention must be eval-uated in its broader context.
4.3. Study limitations
We have focused solely on food price variation over urban space inrelation to socioeconomic context at the census tract scale. We believethis focus is justified, given that economic barriers to accessingaffordable, nutritious food within cities largely remain unexamined.Our assessment of the food environment was, however, limited inthat it ignored other attributes that may influence food consumptiondecisions, including quality, convenience, cultural appropriateness,and brand loyalty. Our assessment implicitly assumed households doall their shopping at one store, whichmay not be the case. Further, weonly considered street-network walking distance, so our results donot pertain to other modes of transportation, which can significantlyimpact effective access for households (Jiao et al., 2012). SeeArmstrong et al. (2009) for a careful analysis of the dimensions ofcultural appropriateness and modes of transportation in the case ofPortland’s food environment.
4.4. Conclusion
This study has investigated how store locations and prices interactwith socioeconomic variation to structure the food environment inPortland, Oregon. It has provided evidence that conventionally definedfood deserts do not sufficiently describe the barriers to healthful foodaccess faced by Portland’s low-income households. Price-based bar-riers were shown to exist in areas that would not appear problematicfrom a conventional food desert standpoint. On average, the nearestgrocery store is 0.7 mile (about a 30-min round-trip walk for theaverage person), but the nearest low-cost grocery store is 1.9 milesfarther away (nearly a 2-h round-trip walk).
This study has posited a typology of food mirages. The mostextreme food mirages occur where grocery stores are abundant butcostly, as is the case in denser, often gentrifying, neighborhoods.By contrast, food hinterlands occur in lower-density neighborhoods,where grocery stores tend to be more affordable for low-incomehouseholds but distance to nearest store exceeds 1 mile. We sug-gested that the processes of gentrification have lead to the displace-ment of low-income households from extreme food mirages to food
hinterlands. The logical outcome of this process is the production ofareas with both lower population density and lower income—in short,suburban food deserts. Although food mirages may arise fromdifferent processes than food deserts, they result in the same problemfor low-income households—limited access to healthful foods andlong travel times to get to an affordable grocery store or supermarket.
Food affordability is undoubtedly a difficult concept. No single pricelevel captures the term’s meaning for all demographics since afford-ability must be tied to incomes, budget constraints, and, to someextent, preferences. Characterizing food price variation requires carefulmeasurement and considerable effort. Our measure of food mirageshinges on a set of assumptions, embedded in the affordability index(AI), that are specific to low-households: incomes at or below 130%of the poverty line, where 30% of income is spent on food. Althoughcapturing food price variation and defining food affordability areempirically challenging, these issues must be at least considered inany complete evaluation of food access, particularly access for low-income households.
Food access is primarily an issue of income and class. As such,food prices matter. They cannot be overlooked in a food environmentassessment because members of low-income households are likelyprice-sensitive shoppers. Spatial patterning of store prices is a critical,yet under-articulated, dimension of the food environment. By draw-ing attention to food mirages in Portland, this analysis invokedbroader questions related to gentrification, income distribution, andfood production priorities. The survey results presented here suggestthat research efforts aiming to describe and interpret the foodenvironment should consider implementing healthy market basketsurveys to complement data obtained remotely. Results also suggestthat policy-makers seeking to improve health outcomes by interven-ing in the food environment on behalf of low-income householdswithin a rubric of food justice should consider the possible effects oftheir actions on price variation over urban space.
Acknowledgements
We are grateful to Christina Friedle, Hunter Shobe, AllisonJones, Alexa Todd, Daron McCaulley, Carly Vendegna, and FionaGladstone for their project support, assistance with food price datacollection, contributions to the initial analysis, and review of theinitial manuscript. We also thank Suzanne Briggs and David Banisfor contributing their insights, and the Northwest Health Founda-tion for funding the community-based project that served as theinspiration for this study.
References
Aggarwal, A., Monsivais, P., Drewnowski, A., 2012. Nutrient intakes linked to betterhealth outcomes are associated with higher diet costs in the US. Public Libraryof Science 7 (5), 237533.
Alwitt, L.F., Donley, T.D., 1997. Retail stores in poor urban neighborhoods. Journal ofConsumer Affairs 31 (1), 139–164.
Andreyeva, T., Long, M.W., Brownell, K.D., 2010. The impact of food prices onconsumption: a systematic review of research on the price elasticity of demandfor food. American Journal of Public Health 100 (2), 216–222.
Anselin, L., Syabri, I., Kho, Y., 2006. GeoDa: an introduction to spatial data analysis.Geographical Analysis 38 (1), 5–22.
Apparicio, P., Cloutier, M.S., Shearmur, R., 2007. The case of Montréal’s missing fooddeserts: evaluation of accessibility to food supermarkets. International Journalof Health Geographics 6 (4), 1–13.
Armstrong, K., Chapin, E., Chastain, A., Person, J., VanRheen, S., White, S., 2009.Foodability: Visioning for Healthful Food Access in Portland. (Last accessed 11August 2012 from).
Asimov, E., 2007. In Portland, a Golden Age of Dining and Drinking. 26. New YorkTimes. (September 2007. Last accessed 11 August 2012 from).
Auld, M.C., Powell, L.M., 2009. Economics of food energy density and adolescentbody weight. Economica 76 (304), 719–740.
Beaulac, J., Kristjansson, E., Cummins, S., 2009. A systematic review of food deserts.Preventing Chronic Disease 6 (3), A105.
B. Breyer, A. Voss-Andreae / Health & Place 24 (2013) 131–139 137

Block, D., Kouba, J., 2006. A comparison of the availability and affordability of amarket basket in two communities in the Chicago area. Public Health Nutrition9 (7), 837–845.
Bodor, J.N., Rose, D., Farley, T.A., Swalm, C., Scott, S.K., 2008. Neighbourhood fruitand vegetable availability and consumption: the role of small food stores in anurban environment. Public Health Nutrition 11 (4), 413–420.
Boone-Heinonen, J., Gordon-Larsen, P., Kiefe, C.I., Shikany, J.M., Lewis, C.E., Popkin,B.M., 2011. Fast food restaurants and food stores: longitudinal associations withdiet in young to middle-aged adults: the CARDIA study. Archives of InternalMedicine 171 (13), 1162–1170.
Carlson, A., Lino, M., Juan, W.Y., Hanson, K., Basiotis, P.P., 2007. Thrifty Food Plan,2006. (CNPP-19). U.S. Department of Agriculture, Center for Nutrition Policyand Promotion.
Carlson, A., Frazão, E., 2012. Are Healthy Foods Really more Expensive ? It Dependson How you Measure the Price. Economic Information Bulletin No. (EIB-96) 50,Economic Research Service, U.S. Department of Agriculture. Last accessed11 August 2012 from ⟨http://www.ers.usda.gov/publications/eib-economic-information-bulletin/eib96.aspx⟩.
Casey, J., 2008. Portland’s low-income neighborhoods are city’s ‘food deserts.’. TheOregonian 15 November 2008. Last accessed 11 August 2012 from /http://www.oregonlive.com/health/index.ssf/2008/11/living_in_a_food_desert.htmlS.
Cassady, D., Jetter, K.M., Culp, J., 2007. Is price a barrier to eating more fruits andvegetables for low-income families? Journal of the American Dietetic Associa-tion 107 (11), 1909–1915.
Charreire, H., Casey, R., Salze, P., Simon, C., Chaix, B., Banos, A., Badariotti, D., Weber, C.,Oppert, J., 2010. Measuring the food environment using geographical informationsystems: a methodological review. Public Health Nutrition 13 (11), 1773–1785.
Chung, C., Myers, S.L., 1999. Do the poor pay more for food? An analysis of grocery storeavailability and food price disparities. The Journal of Consumer Affairs 33 (2),276–296.
Clifford, S. 2013. Walmart Strains to Keep Aisles Stocked Fresh. The New YorkTimes, 3 April 2013. Last accessed 1 July 2013 from ⟨http://www.nytimes.com/2013/04/04/business/walmart-strains-to-keep-grocery-aisles-stocked.html?pagewanted¼all&_r¼0⟩.
Courtemanche, C., Carden, A., 2011. Supersizing supercenters? The impact ofWalmart supercenters on body mass index and obesity. Journal of UrbanEconomics 69 (2), 165–181.
Cummins, S., Macintyre, S., 2002a. A systematic study of an urban foodscape : theprice and availability of food in greater Glasgow. Urban Studies 39 (11),2115–2130.
Cummins, S., Macintyre, S., 2002b. “Food deserts”—evidence and assumption inhealth policy making. British Medical Journal 325 (7361), 436–438.
Darmon, N., Drewnowski, A., 2008. Does social class predict diet quality? AmericanJournal of Clinical Nutrition 87 (5), 1107–1117.
Davis, J., Merriman, D., Samayoa, L., Flanagan, B., Baiman, R., Persky, J., 2012. TheImpact of an Urban Wal-Mart Store on Area Businesses: An Evaluation of OneChicago Neighborhood’s Experience. Center for Urban Research and Learning,Loyola University Chicago. Last accessed 11 August 2012 from ⟨http://ecommons.luc.edu/curl_pubs/3⟩.
Drewnowski, A., 2004. Obesity and the food environment: dietary energy densityand diet costs. American Journal of Preventive Medicine 27 (Suppl. 3), 154–162.
Drewnowski, A., Aggarwal, A., Vernez Moudon, A., 2010. The Supermarket Gap:How to Ensure Equitable Access to Affordable, Healthy Foods. Center for PublicHealth and Nutrition Research Brief (May), University of Washington, p. 1–4.Last accessed 11 August 2012 from /http://depts.washington.edu/uwcphn/reports/cphnbrf051910.pdfS.
Drewnowski, A., Aggarwal, A., Hurvitz, P.M., Monsivais, P., Moudon, A.V., 2012. Obesityand supermarket access: proximity or price? American Journal of Public Health 102(8), e74–e80.
Dube, A., Lester, T.W., Eidlin, B., 2007. Firm Entry and Wages: Impact of Wal-MartGrowth on Earnings Throughout the Retail Sector. UC Berkeley: Institute forResearch on Labor and Employment. Last accessed 20 November 2012 from⟨http://escholarship.org/uc/item/22s5k4pv⟩.
Everett, M., 2011. Practicing anthropology on a community-based public healthcoalition: lessons from HEAL. Annals of Anthropological Practice 35 (2), 10–26.
Forsyth, A., Lytle, L., Van Riper, D., 2010. Finding food: issues and challenges inusing geographic information systems to measure food access. Journal ofTransport and Land Use 3 (1), 43–65.
Franco, M., Diez Roux, A.V., Glass, T.A., Caballero, B., Brancati, F.L., 2008. Neighbor-hood characteristics and availability of healthy foods in Baltimore. AmericanJournal of Preventive Medicine 35 (6), 561–567.
Gibson, K.J., 2007. Bleeding Albina: a history of community disinvestment.Transforming Anthropology 15 (1), 3–25.
Glanz, K., Yaroch, A.L., 2004. Strategies for increasing fruit and vegetable intake ingrocery stores and communities: policy, pricing, and environmental change.Preventative Medicine 39 (Suppl. 2), S75–S80.
Gleason S., Pooler J., 2011. The Effects of Changes in WIC Food Packages onRedemptions. Altarum Institute. Last accessed January 21, 2013 from ⟨http://www.altarum.org/files/pub_resources/Effects%20of%20Changes%20to%20the%20WIC%20Food%20Package_December%202011final.pdf⟩.
Goetz, S., Swaminathan, H., 2006. Wal-Mart and county-wide poverty. SocialScience Quarterly 87 (2), 211–226.
Gordon, C., Purciel-Hill, M., Ghai, N.R., Kaufman, L., Graham, R., Van Wye, G., 2011.Measuring food deserts in New York City’s low-income neighborhoods. Health& Place 17 (2), 696–700.
Grocery CART PDX, 2012. Healthful Food Market Basket Survey. Last accessed 11 August2012 from /http://grocerycartpdx/the-food-basketS.
Guthman, J., 2011. Weighing In. University of California Press, Berkeley.Hauter, W., 2012. Why Walmart can’t Fix the Food System. Food & Water Watch
Report. Last accessed 20 November from ⟨http://documents.foodandwaterwatch.org/doc/FoodandWaterWatchReportWalmart022112.pdf⟩.
Herman, D.R., Harrison, G.G., Jenks, E., 2006. Choices made by low-income womenprovided with an economic supplement for fresh fruit and vegetable purchase.Journal of the American Diet Association 106 (5), 740–744.
Hillier, A., Cannuscio, C.C., Karpyn, A., McLaughlin, J., Chilton, M., Glanz, K., 2011.How far do low-income parents travel to shop for food? Empirical evidencefrom two urban neighborhoods. Urban Geography 32 (5), 712–729.
Hubley, T.A., 2011. Assessing the proximity of healthy food options and food desertsin a rural area in Maine. Applied Geography 31 (4), 1224–1231.
Hyra, D., 2012. Conceptualizing the new urban renewal: comparing the past to thepresent. Urban Affairs Review 48 (4), 498–527.
Interfaith Food and Farms Partnership, 2007. Everyone Eats! A Community FoodAssessment Report for areas of North and Northeast Portland. EcumenicalMinistries of Oregon’s Interfaith Network for Earth Concerns. Last accessed 11August 2012 from ⟨http://www.emoregon.org/pdfs/IFFP/IFFP_NNE_Portland_Food_Assessment_full_report.pdf⟩.
Jiao, J., Moudon, A.V., Ulmer, J., Hurvitz, P.M., Drewnowski, A., 2012. How to identifyfood deserts: measuring physical and economic access to supermarkets in KingCounty, Washington. American Journal of Public Health 102 (10), e32–e39.
Larson, N.I., Story, M.T., Nelson, M.C., 2009. Neighborhood environments: dispa-rities in access to healthy foods in the U.S. American Journal of PreventiveMedicine 36 (1), 74–81.
Lee, H., 2012. The role of local food availability in explaining obesity risk amongyoung school-aged children. Social Science & Medicine 74 (8), 1193–1203.
Leete, L., Bania, N., Sparks-Ibanga, A., 2012. Congruence and coverage: alternativeapproaches to identifying urban food deserts and food hinterlands. Journal ofPlanning Education and Research 32 (2), 204–218.
Margheim, J., 2007. The Geography of Eating Well: Food Access in the Metroscape.Periodic Atlas of the Metroscape (2007), 13-19. Last accessed 11 August 2012from ⟨http://pdx.edu/sites/www.pdx.edu.ims/files/ims_mscape07atlas.pdf⟩.
Monsivais, P., Aggarwal, A., Drewnowski, A., 2011. Following federal guidelines toincrease nutrient consumption may lead to higher food costs for consumers.Health Affairs (Millwood) 30 (8), 1471–1477.
Monsivais, P., Drewnowski, A., 2009. Lower-energy-density diets are associatedwith higher monetary costs per kilocalorie and are consumed by women ofhigher socioeconomic status. Journal of the American Dietetic Association 109(5), 814–822.
Moore, L.V., Diez Roux, A.V., 2006. Associations of neighborhood characteristicswith the location and type of food stores. American Journal of Public Health96 (2), 325–331.
Multnomah County Health Department, 2008. Community Health AssessmentQuarterly 3 (3), 1–4.
Neumark, D., Zhang, J., Ciccarella, S., 2007. The Effects of Wal-Mart on Local LaborMarkets. Institute for the Study of Labor IZA DP No.2545. Last accessed 20November 2012 from ⟨http://papers.ssrn.com/sol3/papers.cfm?abstract_id=958704⟩.
Population Research Center, 2012. Oregon Annual Population Report. Portland StateUniversity. Last accessed 11 October 2012 from ⟨http://www.pdx.edu/prc/annual-oregon-population-report⟩.
Powell, L.M., Chaloupka, F.J., 2009. Food prices and obesity: evidence and policyimplications for taxes and subsidies. Milbank Quarterly 87 (1), 229–257.
Powell, L.M., Chirqui, J.F., Kahn, T., Wada, R., Chaloupka, F.J., 2013. Assessing thepotential effectiveness of food and beverage taxes and subsidies for improvingpublic health: a systematic review of prices, demand and body weight out-comes. Obesity Review 14 (2), 110–128.
Quastel, N., 2009. Political ecologies of gentrification. Urban Geography 30 (7), 694–725.Rehm, C.D., Monsivais, P., Drewnowski, A., 2011. The quality and monetary value of
diets consumed by adults in the United States. American Journal of ClinicalNutrition 94 (5), 1333–1339.
Richardson, A.S., Boone-Heinonen, J., Popkin, B.M., Gordon-Larsen, P., 2012. Areneighbourhood food resources distributed inequitably by income and race inthe USA? Epidemiological findings across the urban spectrum.. BMJ Open 2 (2),e000698.
Rogerson, P., 2010. Statistical Methods for Geography. Sage Publications Ltd., Londonp. 283.
Rose, D., Richards, R., 2004. Food store access and household fruit and vegetable useamong participants in the U.S. Food Stamp Program. Public Health Nutrition 7 (8),1081–1088.
Sharkey, J.R., Horel, S., 2008. Neighborhood socioeconomic deprivation and minor-ity composition are associated with better potential spatial access to theground-truthed food environment in a large rural area. The Journal of Nutrition138 (3), 620–627.
Short, A., Guthman, J., Raskin, S., 2007. Food deserts, oases, or mirages? Smallmarkets and community food security in the San Francisco Bay area. Journal ofPlanning Education and Research 26 (3), 352–364.
Sparks, A.L., Bania, N., Leete, L., 2010. Comparative approaches to measuring foodaccess in urban areas: the case of Portland, Oregon. Urban Studies 48 (8),1715–1737.
Todd, J.E., Leibtag, E.S., Penberthy, C., 2011. Geographic Differences in the RelativePrice of Healthy Foods. Economic Information Bulletin No. (EIB-78) 40,Economic Research Service, U.S. Department of Agriculture. Last accessed9 April 2013 from ⟨http://www.ers.usda.gov/media/128007/eib78.pdf⟩.
B. Breyer, A. Voss-Andreae / Health & Place 24 (2013) 131–139138

Ver Ploeg, M., Breneman, V., Farrigan, T., Hamrick, K., Hopkins, D., Kaufman, P., et al.,2009. Access to Affordable and Nutritious Food—Measuring and UnderstandingFood Deserts and Their Consequences: Report to Congress; U.S. Department ofAgriculture Economic Research Service. Last accessed 11 August 11, 2012 from⟨http://www.ers.usda.gov/Publications/AP/AP036/⟩.
Voss-Andreae, A., 2011. The Food Landscape for Affordable Housing Residents inPortland: A Healthy Foods Access Initiative of the Housing Organizations ofColor Coalition (unpublished report).
Walker, R.E., Keane, C.R., Burke, J.G., 2010. Disparities and access to healthy food in theUnited States: a review of food deserts literature. Health & Place 16 (5), 876–884.
Wendt, M., Todd, J.E., 2011. The Effect of Food and Beverage Prices on Children’sWeights. Economic Information Bulletin No. (EIB-118) 29, Economic Research
Service, U.S. Department of Agriculture. Last accessed 11 August 2012 from⟨http://ers.usda.gov/publications/err-economic-research-report/err118.aspx⟩.
The White House, Office of the First Lady, 2011. First Lady Michelle Obama AnnouncesNationwide Commitments to Provide Millions of People Access to Healthy, Afford-able Food in Underserved Communities. Last accessed 11 August 2012 from ⟨http://www.whitehouse.gov/the-press-office/2011/07/20/first-lady-michelle-obama-announces-nationwide-commitments-provide-milli⟩.
Zenk, S.N., Lachance, L.L., Schulz, A.J., Mentz, G., Kannan, S., Ridella, W., 2008.Neighborhood retail food environment and fruit and vegetable intake in amultiethnic urban population. American Journal of Health Promotion 23 (4),255–264.
B. Breyer, A. Voss-Andreae / Health & Place 24 (2013) 131–139 139