reaching the poor with effective microcreditciat-library.ciat.cgiar.org/paper_pobreza/024.pdf ·...
TRANSCRIPT
REACHING THE POOR WITH EFFECTIVE MICROCREDIT:EVALUATION OF A GRAMEEN BANK REPLICATION
IN THE PHILIPPINES1
Mahabub Hossain and Catalina P. Diaz
Social Sciences Division International Rice Research Institute (IRRI)
Los Baños, Laguna, Philippines
Abstract
The Grameen Bank in Bangladesh has developed a succesful model of reaching
credit to resource poor households that are generally bypassed by Government
financial institutions. This paper evaluates the experience of the replication of the
model in the Philippines by the Center for Agriculture and Rural Development
(CARD), an NGO which has disbursed P82 million to 8000 borrowers since 1990, and
has succeeded in recovering the entire amount. Analysis of the data collected from
133 sample household borrowers suggests that for the enterprises financed with
credit, the productivity of labor was higher than the wage rate and the rate of return
was higher than the interest charged on the loan. The credit contributed to 25 percent
increase in household incomes. The institution however is not yet financially viable,
as the cost of operation is about 54 percent of the amount of outstanding loan.
Without high rates of interest, the microcredit operations will not be able to expand
1Paper presented during the International workshop on Assessing the Impact of Agricultural
Research on Poverty Alleviation, September 14-16, 1999, International Center for Tropical Agriculture,CIAT, Cali, Columbia.
2
their operations on a large enough scale to have a significant impact on poverty
alleviation.
The authors acknowledged the support received from Maritess Tiongco, Joel Reaño,
Nancy Palma, and Josephine Narciso of the Social Sciences Division.
I. Introduction
Background
Providing credit and organizational support to the poor who do not have assets
to use as collateral to formal financial institutions have been the key elements of the
non-government organization’s (NGO) approach to alleviation of poverty and
improving livelihood in many developing countries. Although governments realize that
resource-poor rural households need affordable credit to enhance household
incomes, the formal financial institutions failed to reach the poor because they adhere
to stringent collateral requirements, and the credit disbursement and recovery
procedures are not suitable for their economic environment (Baker 1968; Adams and
Vogel 1986).
The Grameen Bank in Bangladesh has developed a successful model of
reaching credit to the resource poor households that are generally bypassed by
government financial institutions (Hossain 1988; Khandaker 1996). The model is now
being replicated in a large number of countries. The fundamental features of the
Grameen Bank model are (Fuglesang and Chandler 1988,1993):
• An organizational structure that ensures that clients belong to the bottom half
of the socioeconomic hierarchy.
• A credit system that is designed to be simple and adaptable to cater to the
needs of the clients.
3
• A built-in savings mobilization component that enhances self-reliance and
provides cover against business risks and natural calamities.
• A self-empowerment mechanism that provides women an opportunity to
assert themselves in the households and the society.
The Center for Agriculture and Rural Development (CARD), a non-government
organization has been implementing a replication of the Grameen Bank model in the
Philippines, known as the Landless People’s Development Fund (LPDF). CARD was
organized in December 1986, with its headquarters located in San Pablo City, Laguna
in Southern Luzon.
The scope of the study
The main objective of the LPDF is to extend credit facilities to resource poor
households for creating opportunities for productive self-employment for the vast
underutilized human resource. The credit program is thus targeted to the poor for
improvement of their living conditions. So, any evaluation study must investigate the
extent to which the credit has reached the target group, and analyze the impact of
credit on employment generation and improvement in the level of living of the
borrower household.
The economic viability of the credit program from the borrowers’ side depends
on the rate of return of the activities that CARD members are financing with the loan.
If the rate of return of capital is not high enough to cover the cost of the loan plus a
premium for the risk borne in undertaking the activities, the client may not continue
association with CARD and take a repeat loan, even if credit is offered to them. So it
would be useful to estimate the labor productivity and profitability of the major
enterprises that are financed with the loan. The rate of return on investment may also
be used as a criterion for selecting enterprises that have potential for growth and or
judging the absorptive capacity of the member-borrowers.
4
From the lender’s side, the economic viability of the credit program depends on
the capacity to recover the cost of operation from the interest earnings. As the
clientele come from a very poor economic background, the size of the loan is
typically small, and the repayments are collected in weekly installments. In addition,
the Grameen Bank model follows a program of intensive training for staff and the
clientele for ensuring credit discipline and promoting a social development program.
All this means that the paper work and the personnel needed for servicing a given
amount of loan would be substantially higher for this model of credit than under
normal credit programs. So the study should analyze the cost of operation of the
bank branches and relate to the size of business and the age of the bank, and
estimate the start-up cost and the time required to be self-sufficient. This information
may be useful to study the financial viability and the scope of expansion of the credit
program.
This evaluation will mainly address the issues raised above.
Sources of data
The study utilizes secondary data on financial operations provided by CARD as
well as primary data collected by the authors through a survey of randomly selected
borrower households.
In the absence of benchmark information on economic conditions of the
borrowers, we decided to assess the economic impact by comparing situations of the
old and new borrowers. Thus, the study required that the sample have
representations of different age of membership with the CARD and the number of
loans taken. For geographical representation we considered the intensity of poverty
for selecting the branches from which to draw the sample respondents, since the
objective of the credit program is to improve the livelihood of the low-income
households. Considering these two factors, we selected Masbate and Laguna area
for generating primary information for the borrowers. Laguna represents the old
5
branches and the economically better-off area, and Masbate represents the new
branches and the economically depressed area. In Laguna, four centers from San
Pablo and Bay branches were selected to represent different ages of the centers. In
the Masbate area an old center was selected from the Masbate branch and a new
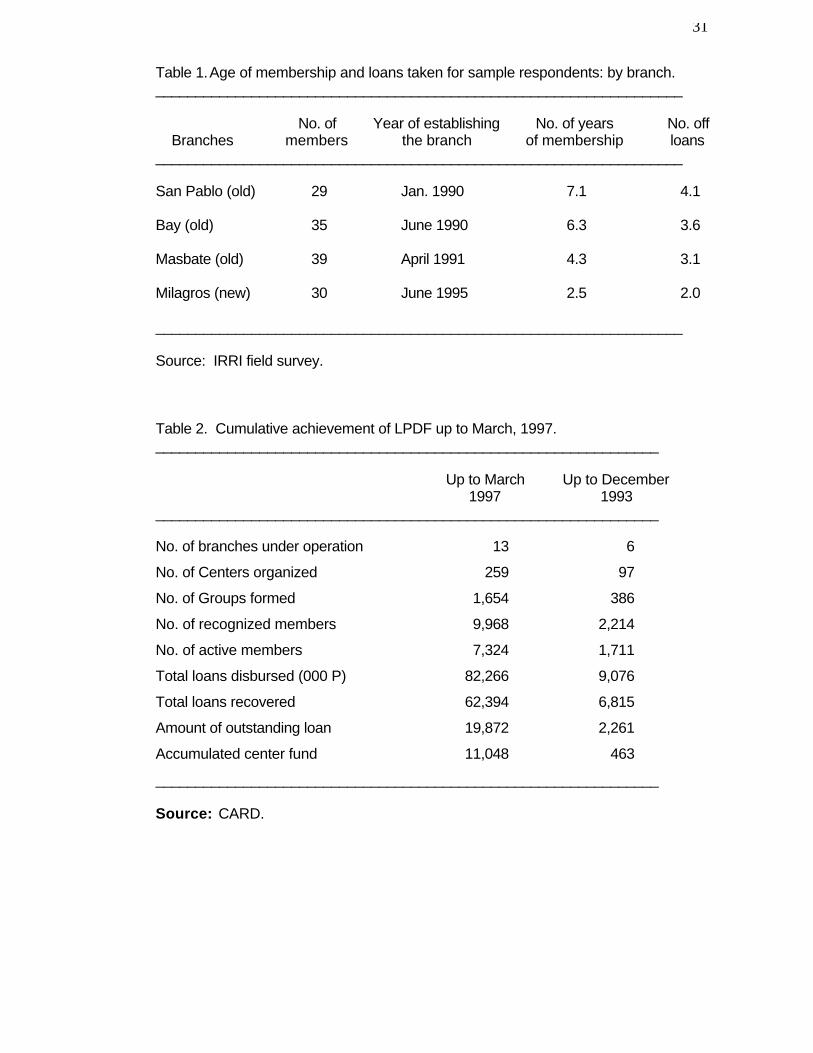
center, from the Milagros branch. Thus, the primary data were generated from 133
member households belonging to six centers and four branch offices of CARD. Table
1 shows that the sample households do represent different ages of membership with
CARD and the cross-section of borrowers classified by the number of loans taken.
The survey was conducted during February to April 1997. The data were
collected by interviewing respondents with a structured questionnaire finalized after a
pre-testing in the Bay area. It contains information on credit history of the borrowers,
their socioeconomic background and asset holding, costs and returns on enterprises
financed with the loan, employment and incomes generated from CARD-financed and
other economic activities of the household.
II. Organization and Progress of the LPDF project
Background to the Project
The CARD started its operation in April 1988 with a training-focused community
and livelihood assistance program for landless coconut workers (CARD 1995). It
organized them into associations of more than 15 members each, assisted them in
formulating systems and procedures for savings and capital build-up schemes and
provided loans based on the outcome of project management training. It undertook
other development activities in coordination with various agencies. These included
installing deep tubewell pumps, organizing credit and multi-purpose cooperatives, and
experimenting with demonstration farms for extending improved agricultural
technologies to small farmers, marginal fishermen and landless workers.
The initial results on credit operation was not encouraging. Members were not
able to repay the loan in time and mobilization of savings was marginal to have any
6
meaningful impact on the life of the members. Recognizing the weakness of the
traditional scheme, CARD decided to test on a pilot basis a modified Grameen Bank
model in four villages in San Pablo. Management staff and technical officers were
sent for training to Grameen Bank in Bangladesh to familiarize themselves with the
essential features of the Grameen. Encouraged by the successful outcome of the
pilot scheme, CARD launched in January 1990 the LPDF project, adopting the
essential features of Grameen, modifying some to suit the unique lifestyle and
economic conditions of the Filipino landless poor. Within April 1993 it set up five
branches in Laguna, Quezon, Marinduque and Masbate provinces.
Organization
The following elements of the Grameen Bank model has been taken up by
CARD:
• Targeting women from the low-income households as the clientele.
• Taking the bank services to the village in place of the normal practice of asking
people to come to the bank to avail of the credit facilities.
• Organizing the prospective borrowers into groups of 5 like minded persons with a
number of Groups (5 to 8) being federated into a Center. The Center holds a
meeting on a fixed day of the week which is attended by the Field Staff of the Bank
to conduct the credit business.
• Group solidarity and peer pressure are used to oversee proper utilization of the
credit, which are used as the substitute for the collateral taken in normal credit
programs. Group members take responsibility for repaying the loan of a defaulting
member. Members are given training to ensure strict credit discipline.
• Credit is given in small sizes with progressively higher amounts for repeat loans
as members gain confidence in utilizing the previous loan. The loan is repaid
within a year, in weekly installments of two percent of the loan amount, so that the
7
repayment does not constitute a burden on the economic condition of the
borrowing household.
• Developing collective funds with compulsory weekly savings of the members and
five percent of the loan amount deducted upfront, for mutual benefits of the
members.
• Using credit as an entry point for social development promoted by the institution
among members with active involvement of the field staff.
The major differences with the Grameen model are in selecting the target
group, organization of the training program, and in operation of the collective funds.
CARD provides more intensive training on project management and credit disciplines
to the prospective borrowers than the Grameen Bank does. In Bangladesh Grameen
Bank uses the ownership of land (up to 0.2 ha) as the main criterion for selecting the
target group. CARD identifies its target group on the basis of housing and marketable
assets (up to P25,000) determined on the basis of means tests on prospective
members. In Grameen the collective funds is managed by the Group while in CARD
it is managed by the Center. A mutual fund is developed to provide insurance against
accidents, limited old age pensions and supporting burial expenses.
Progress of operations
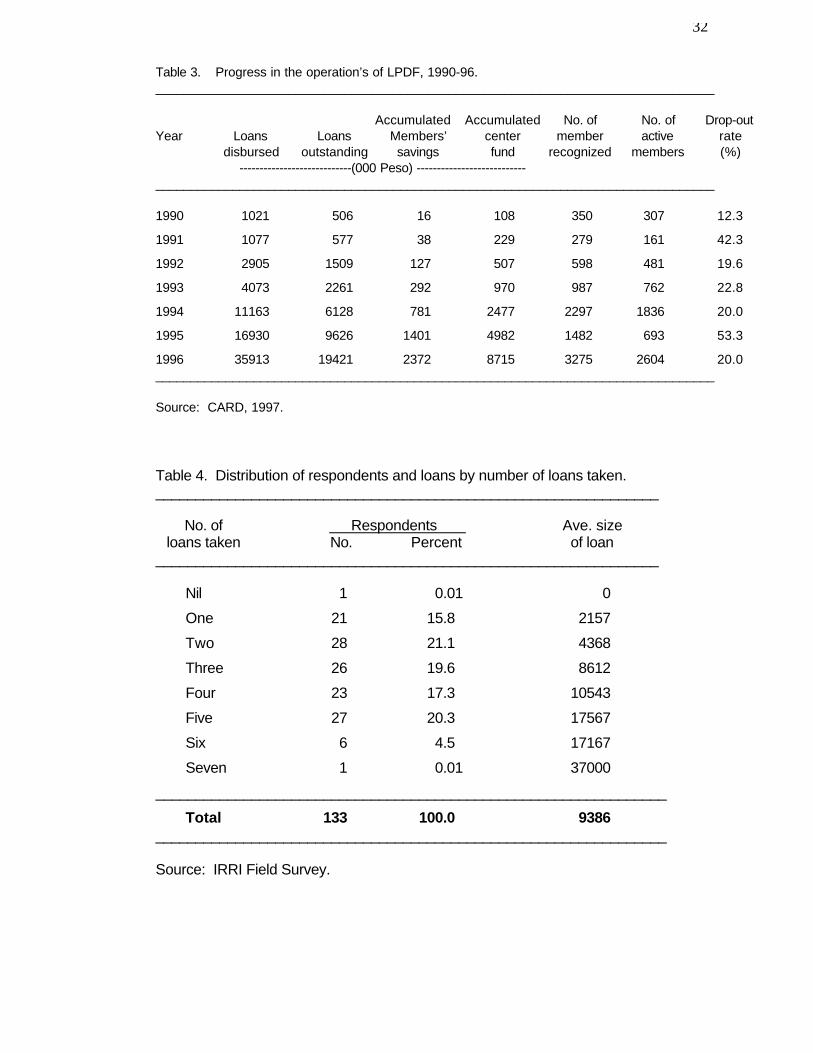
The cumulative achievement of LPDF is shown in Tables 2 & 3. By end of
March 1997, CARD has organized 9968 members into 259 Centers under 13
branches. It now serves 7324 active members, as 22% of the members initially
recognized have dropped out over time (Table 3). The loans disbursed have reached
P82.3 million of which 62.4 million have already been recovered. The loan
outstanding with the borrowers have reached P1.94 million. The savings
accumulated in the Center Fund have grown to 11.05 million which is about 55% of
the loans outstanding with the borrowers.
8
Although CARD started the Grameen replication in 1990 most of the expansion
took place over the last three years after it was able to receive a sizeable soft loan
from the Grameen Trust in August 1993. By the end of 1993 it mobilized only about
1711 active members into 97 Centers through six branches. The number of
outstanding loans with the members increased from P2.3 million in 1993 to 19.9
million by the end of March 1997. Four of the old branches now disburse over six
million pesos in a year to over 800 active members, with five field staff per branch.
Size and type of loan
Table 4 shows the distribution of borrowers by the number of loans taken and
the expansion of the average size of loan with successive repeat loans, as estimated
from the survey. Nearly 25% of the borrowers have already taken five or more loans
with an average size of loan of more than P15,000. The first two loans are typically
small, because the institution does not want to take risks with new and inexperienced
borrowers. The small size of loan also allow new members to gather confidence in
handling credit and explore markets. The size of loan grows fast after two years, as
the members could also access loans for housing improvement.
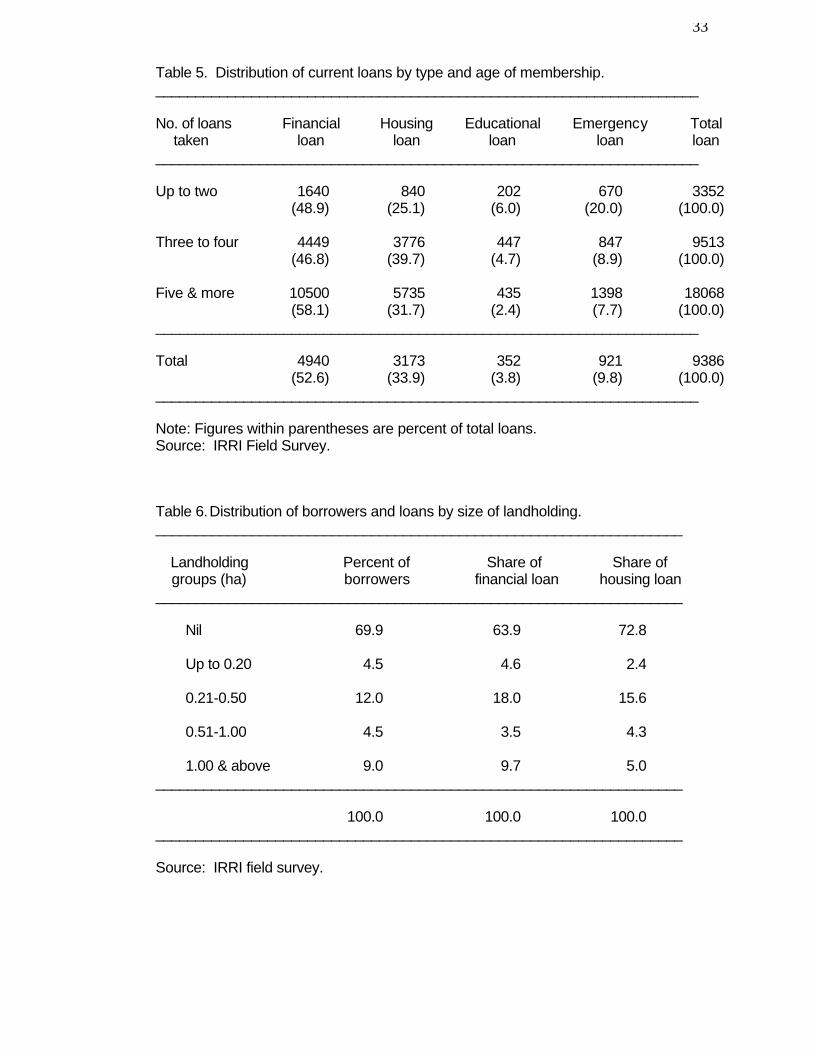
Table 5 provides information on the distribution of current loans by the type of
loans. The financial loan is the credit line that is used for undertaking economic
enterprises and earns income. But members also take loans for housing
improvement, financing educational cost for the children, tiding over financial crisis
due to natural disasters and health-related emergencies, improving sanitary
conditions, etc. These loans also have to be paid in weekly installments and bear the
same rate of interest as the financial loan. The financial loan accounts for only 53%
of the total loan, and hence the rate of return from investment on the credit-financed
enterprises has to be substantially higher than the rate of interest in order to have the
capacity to repay the other loans. Otherwise, the borrower would have to draw on the
income of the other members. The emergency loans are taken mainly by the new
9
borrowers as they find it difficult to cope with financial crises at the low level of
income. As the income generated from successive loans improves the economic
capacity of the households, the need for emergency loans is reduced substantially.
The older borrowers however, draw on the housing loan which is available in large
sizes.
III. Success in Reaching the Poor with Credit
The Grameen regards credit as a key development input and access to credit
as the basic human right (Yunus 1986, 1995). It attempts to empower the poor by
providing them collateral-free loans so they could generate productive self-
employment by organizing economic enterprises. The success of the Grameen was
in developing an appropriate credit delivery mechanism to reach the bottom 50% of
the household in the socioeconomic ladder. Any evaluation of the micro-credit
program should therefore first assess the extent to which the target group has been
reached.
The Grameen Bank defines the target group as households owning less than
0.20 ha of land, who constitute the bottom 50% of the rural households in Bangladesh
(Hossain 1988). Table 6 provides information obtained from the survey of the
borrowers regarding their distribution with respect to landholding and the share of
credit received by various group. It will be seen that 70% of the CARD members are
completely landless and they received 63% of the financial loans and 73% of the
housing loan provided by CARD. Only 24% of the CARD members have landholdings
of over 0.2 ha, and 9% above one hectare. In many target group-oriented programs,
the economically well-off out-of-target members influence the management of the
program to have a proportionately much larger share of the resources available under
the program. In CARD, the off-target group households according to the Grameen
standard, however, could not monopolize the credit; their share of loans was
proportional to their numbers.
10
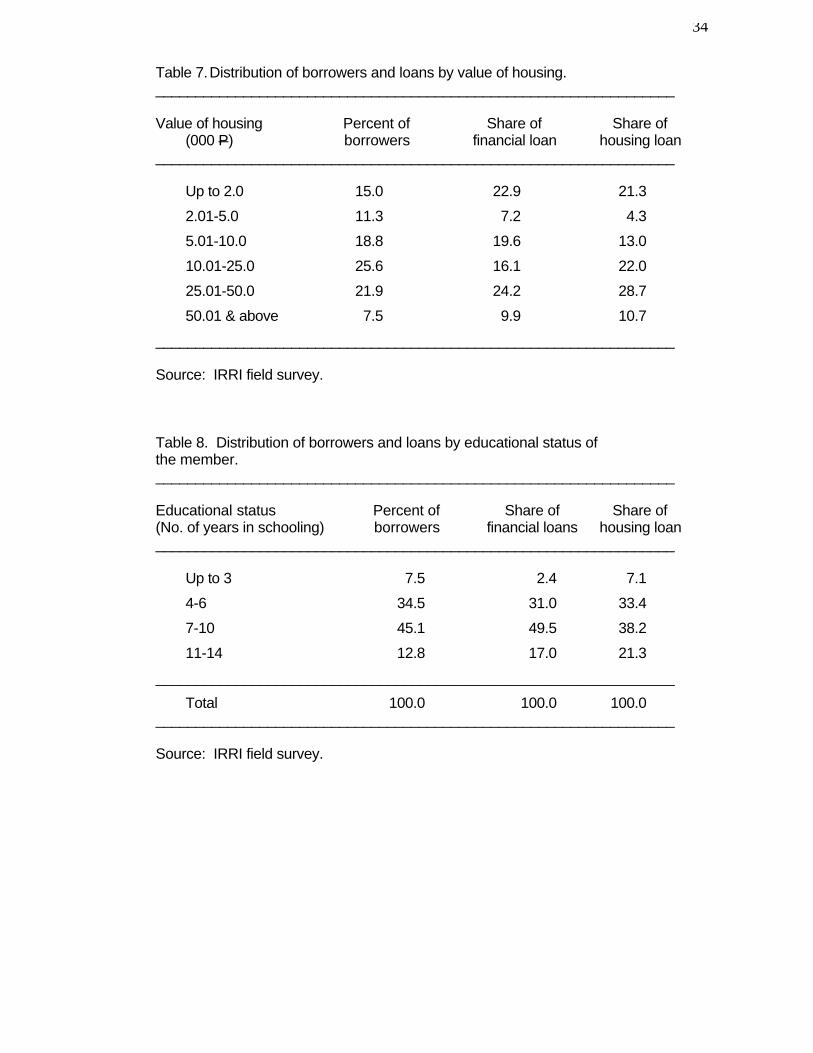
CARD defines its target group with respect to the value of the house and
marketable assets. Only households who have assets not exceeding P25,000 are
eligible to become members of CARD.
Table 7 provides information on the distribution of CARD members with
respect to the value of housing and their financial and housing loans. Only 29% of the
households reported a value of housing over P25,000 and they had a share of 34% of
financial loans and 39% of housing loans. It thus appears that a sizeable proportion
of CARD loans go to households who are not eligible to be the members of the
institution. It is not clear however whether member-households have invested in
housing after becoming members of CARD which contributed to the accumulation of
value above the eligibility limit. This possibility cannot be ruled out since CARD also
provide loans for housing improvement.
An important factor that would affect the income earning capacity of the
individual is the level of education. Table 8 provides information obtained from the
survey on the distribution of the CARD members with respect to the completed year
of schooling. About 42% of the members have only primary level education, and
these ‘human resource’ poor households had a share of 33% of financial loans, and
40% of the housing loan. At the other end, 13% of members had college level
education. These members should have better opportunities of finding a job in the
market and higher opportunity cost of using labor in CARD financed activities. They
tapped 17% of the financial loans, and 21% of housing loans, which is proportionately
much higher than their numbers.
It appears from the above evidence that CARD has not been 100% successful
in limiting the credit services to the extreme poor. This might have resulted from the
difficulty of assessing the economic situation of the household through the means
test.
11
IV. Financial Viability at the Borrower Level
Cost of credit
The cost of loan is fairly high in Grameen type microcredit program because of
the high cost of operation (see later) arising from the highly intensive supervision
required for its success. CARD charges 20% rate of interest per annum on the
amount of loans disbursed and deducts upfront 4% of the loan amount as a service
fee. Since the principal is repaid in 50 weekly installments starting immediately after
the disbursement of the loan, the amount of outstanding loan with the borrower is less
than half of the amount disbursed. Thus, the effective rate of interest comes to about
44% of the amount available for investment by the borrower (outstanding loan). The
credit will contribute to increasing income of the borrowing household only if the rate
of return on capital in the enterprise financed with CARD credit is higher than this
effective rate of interest (Baker 1968). To assess the financial viability of the credit
program at the member level, it is therefore necessary to estimate the rate of return
on investment in enterprises financed with the loan.
Repayment of loan
The rate of recovery of credit and the demand for repeat loans are indirect
indicators of the financial viability at the borrower level. If the member incurs loss in
the business enterprise, she would not have capacity to repay the loan. If she had
been forced to repay the loan from incomes of other household enterprises, she
would not demand a repeat loan and would drop out from the organization, unless, of
course, she finds other benefits from the association with the organization. The
CARD reports an average drop-out rate of 23% (Table 3) but this occurs mostly in the
first year after the members are recognized. The drop-out rate was unusually high in
Marinduque branch, moderate in Masbate, Mindoro and Palanas branch and fairly low
in San Pablo, Bay, Dolores and Milagros branch. The drop-out rates drop
substantially after the members have taken the second loan.
12
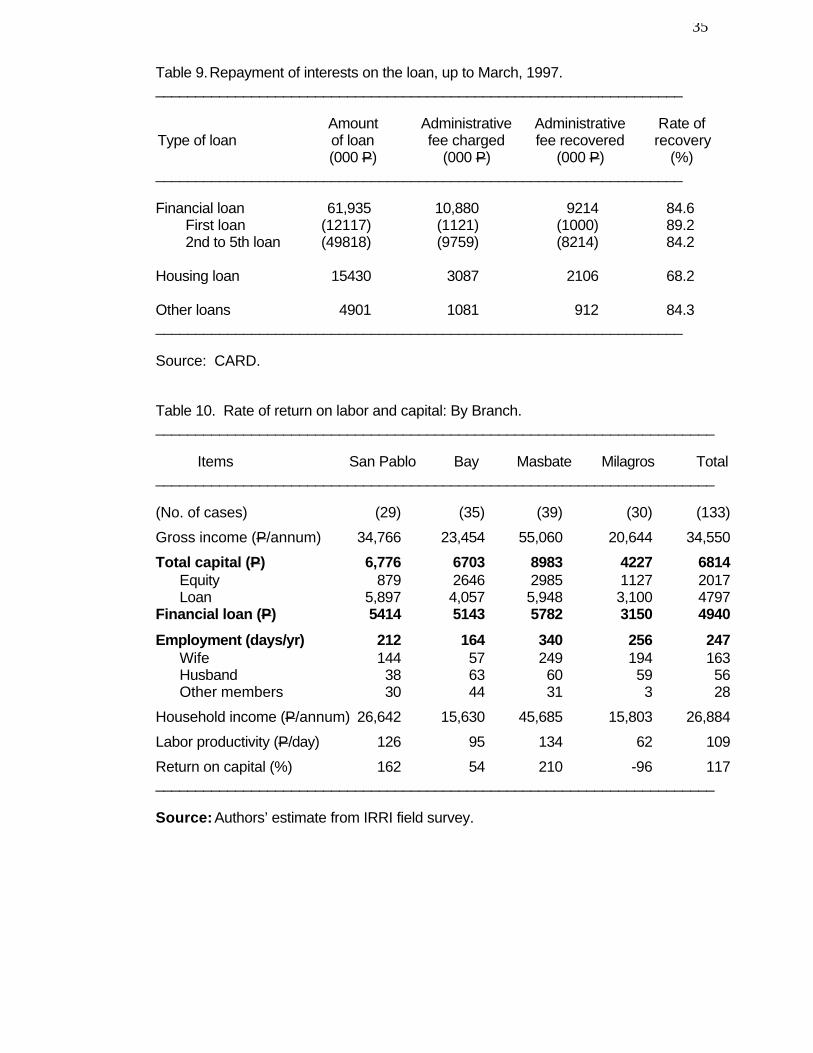
CARD reports a recovery of credit within due time at over 98%. During the
course of the survey the investigators were asked to check the passbook of the
borrower and record the number of overdue installments not repaid at the time of the
survey. No overdue installment on the financial loan was found in any of the cases.
Our field investigation thus supports the CARD report on the recovery of loans.
The rate of recovery of interest charged on the loan is another indirect
indicator of the financial viability of the enterprise. This information can be seen from
Table 9. It will be seen that 89% of the interest due on the first loan and 84% for the
repeat loans have already been recovered for housing loan, however, the repayment
rate was 68%.
Conceptual issues in estimating rate of return for informal enterprises
A direct indicator of the financial viability is obviously the rate of return on
investment. It is difficult however to estimate the rate of return on investment fairly
accurately for the informal activities financed with micro-credit for a number of
reasons (Hossain 1984). First is the problem of identification of labor associated with
the activity. It is usual to find a person in rural area to be engaged in more than one
activity, often on the same day. To get an accurate estimate of employment, it is
necessary to generate data on the allocation of labor time to these various activities.
Collection of information on time allocation needs weekly surveys throughout the year,
which is costly and time consuming. The problem is compounded by the fact that a
household would often have more than one working members who are engaged in
different activities and may be helping each other in their works. The second problem
is to identify actual investment on the activity when the household is engaged in multi-
enterprises. Money is fungible. The full amount of loan may not be used for the
activity for which the loan is taken. It is very likely that household members would
pool the available resources (from whatever source they are obtained) for operating
them on the household basis.
13
The activities financed by micro-credit are run mostly with family labor. We
need to deduct the cost of family labor from household income to estimate ‘profits’
and the rate of return on capital. An important conceptual problem here is how to
impute the cost of family labor. Since labor market hardly exists for most of these
activities, it is difficult to get information on the wage rate that could be used to impute
the opportunity cost of family labor. Even if it is available, it may not approximate the
opportunity cost, as the family labor utilized in these activities might not get equal
employment at that wage in alternative occupations. The wage rate would have been
depressed if the labor market had to absorb all the surplus labor available in the
locality.
In view of the above problems the findings on rates of return reported below
have to be interpreted carefully.
Methodology
We collected information from respondents on the number of months different
household members worked for CARD financed and other economic activities, the
number of days employed in a month, and the average number of hours employed in
a day, which was the basis for estimating standard eight-hour days of labor used in
the enterprises. The respondents also reported average weekly income accruing to
the household from CARD financed and other economic activities, which was blown
up (multiplied by 52) to get yearly income. The income from land and livestock
holding was estimated from input data collected on a seasonal basis.
Three alternative measures of the return from investment has been estimated,
(a) net household income, I, (b) net income per unit of labor, ie, labor productivity, RL,
and (c) rate of return on capital, Rk. These have been estimated as follows:
I = Y - rk - L (1)
RL = I/N (2)
Rk = (Y - wN)/K (3)
14
where, Y = annual gross household income from the activity.
N = number of standard eight-hour days of employment in the activity for
all household members.
L = the amount of financial loan obtained from CARD.
K = own and borrowed capital used in the enterprise.
r = the rate of interest on the loan (40% per year).
w = wage rate or the opportunity cost of labor (P80 per day).
The net income of the household would be the most appropriate measure of
the return on micro-credit if the labor employed in the activity would have remained
idle in the absence of the access to credit. At the other end, (I-WN) is the most
appropriate measure of net income, if all the labor employed in the micro-credit
financed enterprises could be alternative employed in agriculture or other economic
activities at the market wage rate. The actual position regarding the operation of
informal enterprise is somewhere in the range depending on the economic situation in
the locality. For this reason, we have estimated the net return per labor so one can
compare it with one’s notion of the opportunity cost of labor to make a judgment about
the desirability of the investment.
The rate of return on capital would have been the most appropriate indicator for
the viability of investment with micro-credit when the entrepreneur runs the activity
with hired labor (a capitalist enterprise). If the rate of return were higher than the cost
of investment (the rate of interest plus a risk premium), it would be profitable to make
that investment. But the target group for micro-credit run the activities mostly with
family labor that face inadequate and uncertain employment opportunities in the
market. Hence, the rate of return on capital should not be used an appropriate guide
for the borrowers’ investment decision and the latent demand for credit. Also, since
the amount of investment is very small, Rk would be highly sensitive to the
15
assumption of the wage rate and the error of measurement on employment of labor,
for which accurate information is difficult to collect.
Results and discussions
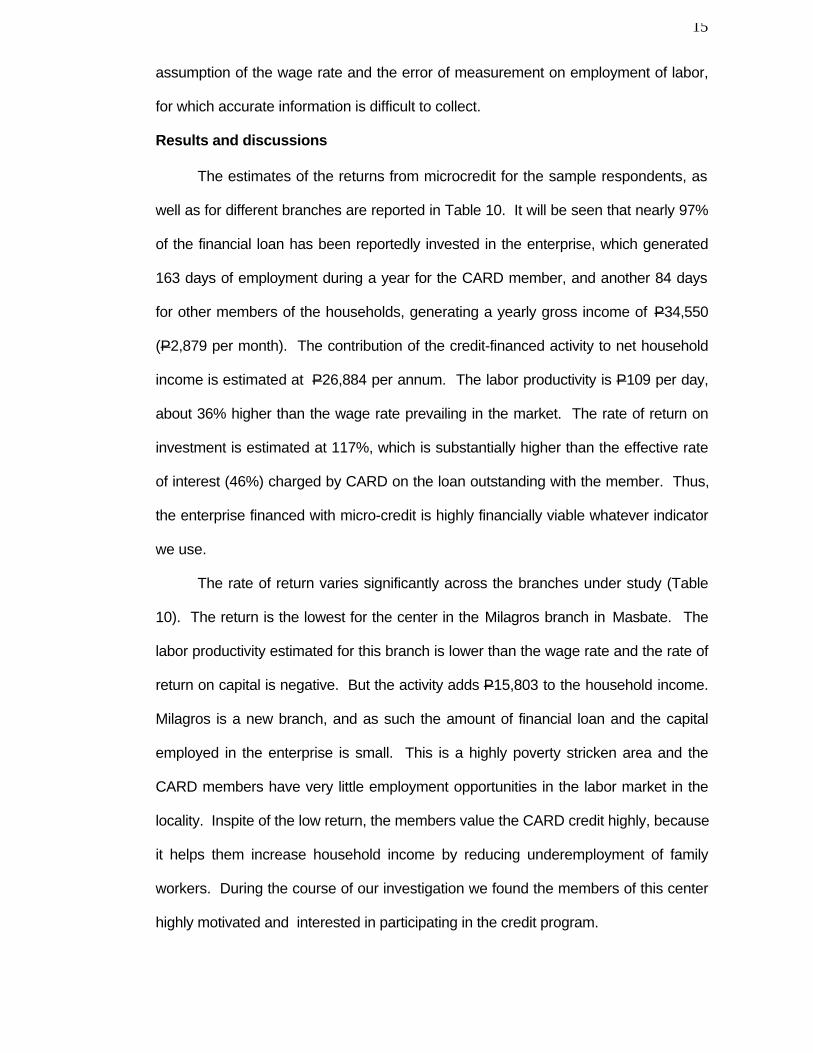
The estimates of the returns from microcredit for the sample respondents, as
well as for different branches are reported in Table 10. It will be seen that nearly 97%
of the financial loan has been reportedly invested in the enterprise, which generated
163 days of employment during a year for the CARD member, and another 84 days
for other members of the households, generating a yearly gross income of P34,550
(P2,879 per month). The contribution of the credit-financed activity to net household
income is estimated at P26,884 per annum. The labor productivity is P109 per day,
about 36% higher than the wage rate prevailing in the market. The rate of return on
investment is estimated at 117%, which is substantially higher than the effective rate
of interest (46%) charged by CARD on the loan outstanding with the member. Thus,
the enterprise financed with micro-credit is highly financially viable whatever indicator
we use.
The rate of return varies significantly across the branches under study (Table
10). The return is the lowest for the center in the Milagros branch in Masbate. The
labor productivity estimated for this branch is lower than the wage rate and the rate of
return on capital is negative. But the activity adds P15,803 to the household income.
Milagros is a new branch, and as such the amount of financial loan and the capital
employed in the enterprise is small. This is a highly poverty stricken area and the
CARD members have very little employment opportunities in the labor market in the
locality. Inspite of the low return, the members value the CARD credit highly, because
it helps them increase household income by reducing underemployment of family
workers. During the course of our investigation we found the members of this center
highly motivated and interested in participating in the credit program.
16
The rate of return is found to be the highest for the center studied for the
Masbate branch (Table 10). The size of financial loan is the highest for the center,
and the borrowers have put up large amount of their own fund in the enterprises
financed with CARD credit. An average enterprise generated 249 days of
employment for the borrower, and another 91 days of employment for the husband
and/or other family members, and contributed P46,000 additional income for the
household. The labor productivity is almost 68% higher than the wage rate and the
rate of return of capital is 210%. Obviously the borrowers in this Center should have
no difficulty in repaying the loan. The economic performance of the members in the
Masbate Center is better compared to the respondents under San Pablo and Bay
branches, although the latter are older members of CARD and have taken more loans
(Table 1). This is presumably because of the higher incidence of poverty and the lack
of alternative employment and income earning opportunities in Masbate compared to
San Pablo and Bay which have well-developed infrastructure facilities and are near to
Metro Manila. It will be noted from Table 10 that for San Pablo, the share of equity in
total capital employed in the enterprise is very low. The number of days labor used in
the enterprise is substantially lower for both San Pablo and Bay compared to the
centers in Masbate and Milagros.
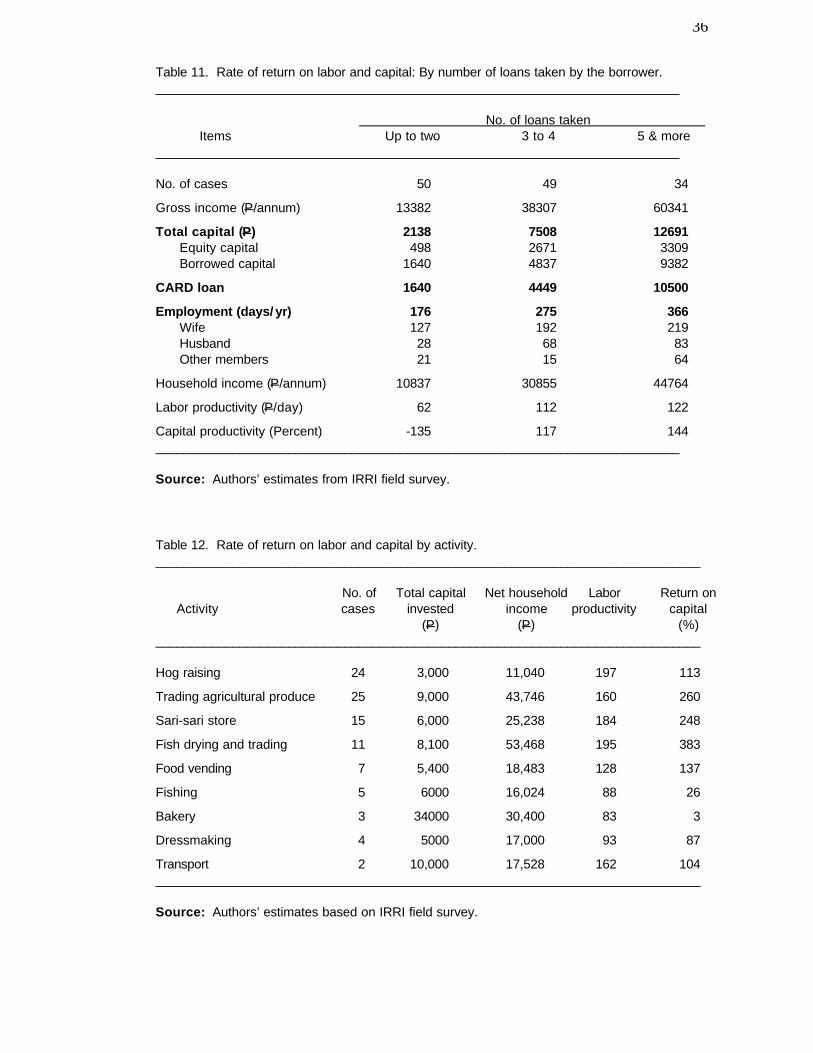
Table 11 reports the estimates of the rate of return for borrowers classified on
the basis of the number of loans taken. The findings show that in general the financial
viability of the enterprises gets stronger with longer association of the members with
the credit program. The labor productivity in enterprises run by the new borrowers
(P62 per day) is, in fact, lower than the wage rate, and the rate of return on capital is
negative when the cost of family labor is imputed by the market wage rate. The
members who have received more than two loans have had substantially higher
levels of income and employment from the CARD-financed activity. The rate of return
17
on capital is 117% for members who have already taken 3 to 4 loans, and 144% for
those with more than 4 loans.
Table 12 reports estimates of the return from investment in specific activities
undertaken with the loan. The most common activities financed with the credit are
trading agricultural produce, hog raising, retail (sari-sari) store, fish drying and trading,
food vending and fishing. Although hog raising is the most popular activity undertaken
with the credit, the capital used was typically small and hence the contribution to
household income was low, although labor productivity is substantially high. It is often
undertaken as a secondary activity using only a part of the loan. The low absorptive
capacity of capital in this activity may be due to the problem of marketing of the
produce. The trading activities generate very high returns to both labor and capital
and contributes substantially to raising household incomes. Fish drying, sari-sari
store and trading agricultural produce generate a net return to capital at more than
250%.
The justification of the Grameen model
The findings presented above amply demonstrates that if the micro-credit is
properly utilized, the financial viability of the enterprise poses no problem. The
challenge is how to ensure proper utilization of the loan and recovering the credit from
the additional income accruing to the borrowers. The Grameen model of intensive
interactions of the bank workers with the borrowers and developing group solidarity
and exerting peer pressure through informal organization of the members are
appropriate institutional innovations in this context. The Group and the Center
function as an institution to ensure mutual accountability. The credibility of the Group
and Center as a whole and future benefits in terms of new loans of a larger size are in
jeopardy if one member breaks the credit discipline, does not properly utilize the loan
and defaults on loan repayments. So, the individual is kept in line by a considerable
18
amount of pressure from other members of the organization. The existence of a well
functioning organization thus acts as the collateral for the bank loan.
The recovery of the loan is facilitated by another institutional innovation of the
Grameen, the procedure of collecting the repayments in large numbers of small
regular installments. In a poor household there is always a compulsion of utilizing
whatever additional income is generated to satisfy the unmet basic needs. It is
difficult for such households to accumulate savings for repaying the loan at large-size
installments. The key to ensuring almost 100% recovery of loans lies in collecting
repayments in weekly installments.
Finally, we should not undermine the importance the Grameen model attaches
to appropriate training and orientation to both prospective borrowers and the bank
worker for the successful implementation of the micro-credit program. The key to the
success of the Grameen model is the orientation, approach and human qualities
inculcated in the bank workers through a training program based largely on ‘learning
by doing’, that is, through the observation of and participation in the on-going activities.
This helps them understand the philosophy and approach of the Grameen model of
empowering the poor women through access to credit, to develop qualities required
for inspiring trust and confidence in the target group, and to derive satisfaction in
serving the cause of the distressed humanity. The bank worker in turn motivates the
target group, earns their confidence through the hard work devoted to their service,
and convinces them of the need to follow credit discipline. The intensive training
before conducting bank business with the borrowers contributes to achieving this
objective.
V. Economic Impact
In the absence of comparable bench-mark data, the effect of the micro-credit
provided by CARD on the economy of the borrower household has been estimated by
classifying the respondents according to the number of loans taken and comparing
19
the means of the criterion variables for the old and the new borrowers. The null
hypothesis of ‘no difference’ in the values of the variables for different groups has
been tested by ‘t’-statistics of the equality of the arithmetic mean of the criterion
variable, using the SPSS statistical package. The hypothesis will be rejected if the
micro-credit leads to improvement in economic conditions of the borrowing
households.
Capital accumulation
The most direct effect of the micro-credit is on accumulation of capital, both
working and fixed. As the loan is repaid in small installments every week, it is easy for
a borrower to pay the installment from the income leaving the capital intact. A
member is expected to have a larger amount of capital when taking a repeat loan than
at the time of becoming a member. Table 4 shows that CARD provides a repeat loan
in substantially larger amounts. Thus, it is possible for the borrower to divert some
credit or incremental income for making medium and long-term investments, such as
purchase of cattle or acquisition of machinery, tools and equipment. The
accumulation of these assets will contribute to increasing productivity of enterprises
other than those financed with the CARD loan.
The findings of the borrower survey on investment in CARD financed activity
and accumulation capital in other household enterprises can be seen from Table 13.
Since the borrower gets larger amount with every repeat loan, the borrowed capital
was higher for longtime borrowers compared to the newer ones. But more
significantly, the contribution from own sources was also substantially higher for the
older borrowers. The value of livestock holding and the accumulation of capital in
machinery, tools equipment went up substantially as the number of loans taken from
CARD increased. The difference is found highly statistically significant, except for the
value of livestock holding. The investment for improvement in housing did not
increase much with larger loans for borrowers who contracted up to four loans.
20
However, longtime borrowers are inclined to invest substantially higher amount for
housing improvements.
Employment generation
The main objective of the micro-credit program is to create employment
opportunities for a vast under utilized labor resource by undertaking economic
activities on a self- employed basis. Any evaluation of the micro-credit program
should thus quantify its impact on employment generation. However, as mentioned
earlier, the effect of CARD loans on generating new employment is difficult to quantify
accurately without conducting a costly and time-consuming regular employment
survey throughout the year for the CARD members and a comparable control group.
Instead, we asked respondents in the borrower survey to report for each family
worker the number of months employed during the year, the number of days
employed in a month and the number of hours employed in a day, for both credit
financed and other economic activities. From this somewhat imprecise information it
is possible to estimate standard eight-hour days of employment for different members
of the household. Table 14 compares this information for respondents classified by
the number of loans taken for the CARD member (the wife) and the spouse (the
husband). The figures show large increase in employment for both wife and the
husband in the credit financed activity and the difference is found statistically
significant. The increase in employment for the wife in other economic activities was
only marginal, and statistically insignificant. For the husband the employment effect
was in fact negative. It seems that in poor households the husband is forced to
overwork in low-productive activities under the pressure to earn a subsistence
income. With additional income earned by the wife from the credit financed activity,
he can afford to enjoy some leisure. This is the classic example of the backward
bending supply curve of labor mentioned in economics literature.
21
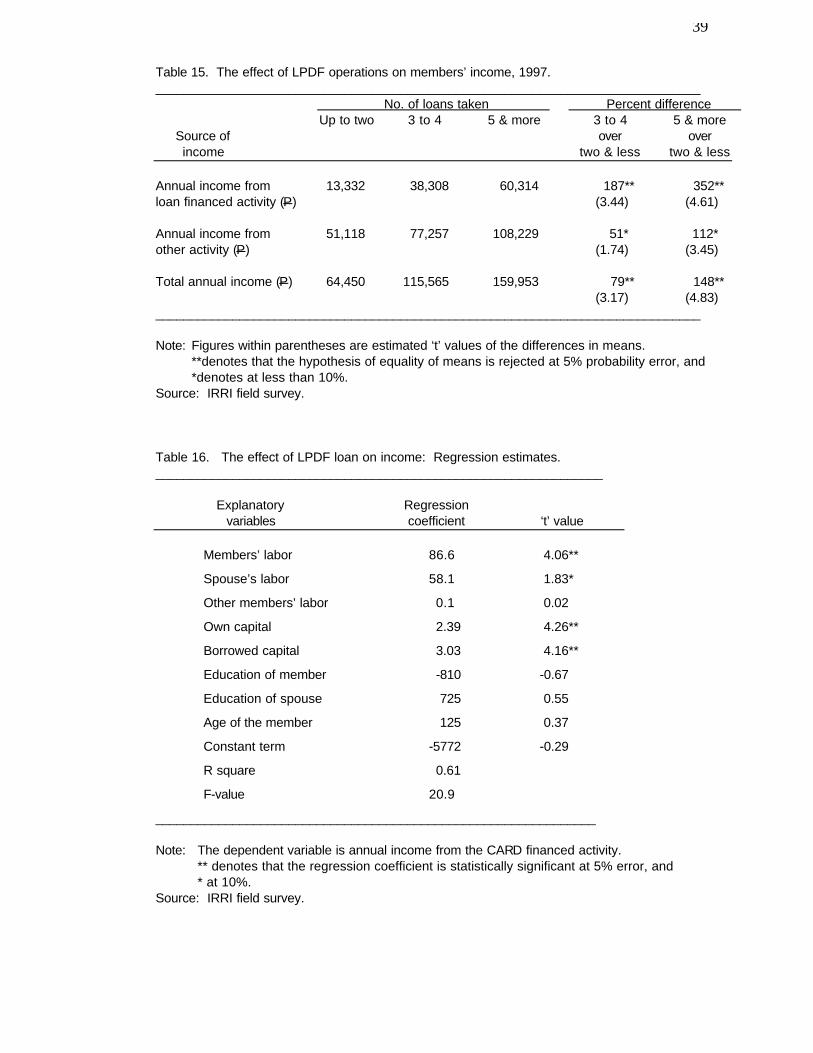
The positive effect of higher employment and capital accumulated would
obviously be reflected in higher incomes. The annual income from loan financed
activity was 1.9 times higher for households who already contracted three to four
loans, and 3.5 times higher for older borrowers compared to new borrowers (Table
15). There was also a significant increase in income from other economic activities
with the increase in the number of loans.
To analyze the impact of micro-credit on income, we also fitted a multiple
regression model on determinants of income and included loan taken from CARD as
one of the explanatory variables. The findings are presented in Table 16. Nearly 61%
of the variation in income from the credit financed activity among the respondents is
explained by the investment of owned and borrowed capital, and labor provided by
the CARD member and the spouse. The value of the regression coefficients indicate
that the marginal productivity of labor in the credit financed activity was P87 per day
for the CARD member and P87 for the spouse. The level of education had a positive
effect on income only for the spouse, but the impact is not statistically significant.
The older members earned higher incomes (the effect of experience) but the
association is not statistically significant.
The positive impact of credit on income is shown by the statistically significant
regression coefficient of borrowed capital. The value of the coefficient suggest that
one peso of CARD loan generates a gross income of 3.03 pesos, that is, a rate of
return of more than 200%. The results of the econometric analysis confirms the
conclusion that the micro-credit provided by CARD has had a positive impact on
income of the borrowing households.
VI. Sustainability of the Institution
The distinguishing characteristics of the Grameen model of credit delivery is
that it takes banking services to the doorsteps of the clientele for both disbursement
22
of loans and collection of repayments. The paper work and the staff time needed for
servicing a given amount of loan are higher for Grameen compared to a normal rural
credit program. The sustainability of the credit institution therefore depends on
recovering the cost of administration and services from the borrowers. This section
will evaluate how CARD has been coping with this problem.
Sources and utilization of fund
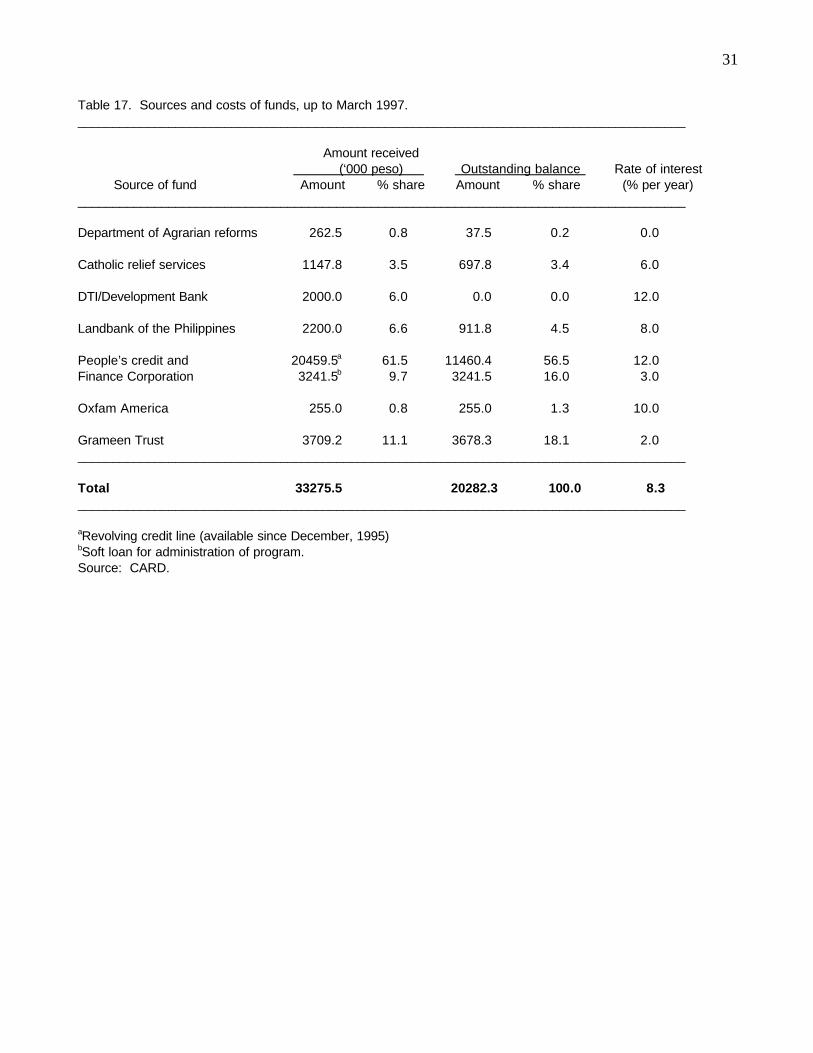
CARD has been looking for relatively low-cost loan funds which has remained
a major constraint to the expansion of the credit program (Table 17). In October 1990
it received from the Department of Agrarian Reforms a soft loan amounting to
P262,500 to be repaid in quarterly installments over a period of seven years. The loan
was free of interest. The amount was meagre in relation to the needs. CARD also
mobilized a number of low-cost credit facility with a rate of interest varying from 6 to
8%, using the window of the micro-credit for the bottom poor under the Land Bank of
the Philippines and the Livelihood Program Fund of the Catholic Relief Services.
Again, the amount was a meagre P3.37 million. In 1993, the Grameen Trust of
Bangladesh provided another soft loan of P3.81 million which carries a rate of interest
of 2% and a repayment period of 10 years. These funds were inadequate in relation
to CARD’s capacity to lend. CARD experienced a high drop-out rate (53%) in 1995
because of its failure to serve the prospective borrowers, due to lack of loanable
funds. The constraint was eased in December 1995 when CARD decided to tap a
high-cost revolving loan fund from the People’s Credit and Finance Corporation. An
amount of P20.5 million was available from this window but it carries a rate of interest
of 12% to be repaid in quarterly installments. The experience suggests that the
supply of fund will remain rationed if Grameen replicators want to depend on low-cost
sources, which would constrain their capacity for expansion.
23
Table 17 provided information on the sources of funds mobilized by CARD so
far and their costs. Nearly 62% of the funds are from the high cost source. The
average cost of the loanable fund was 8.3%.
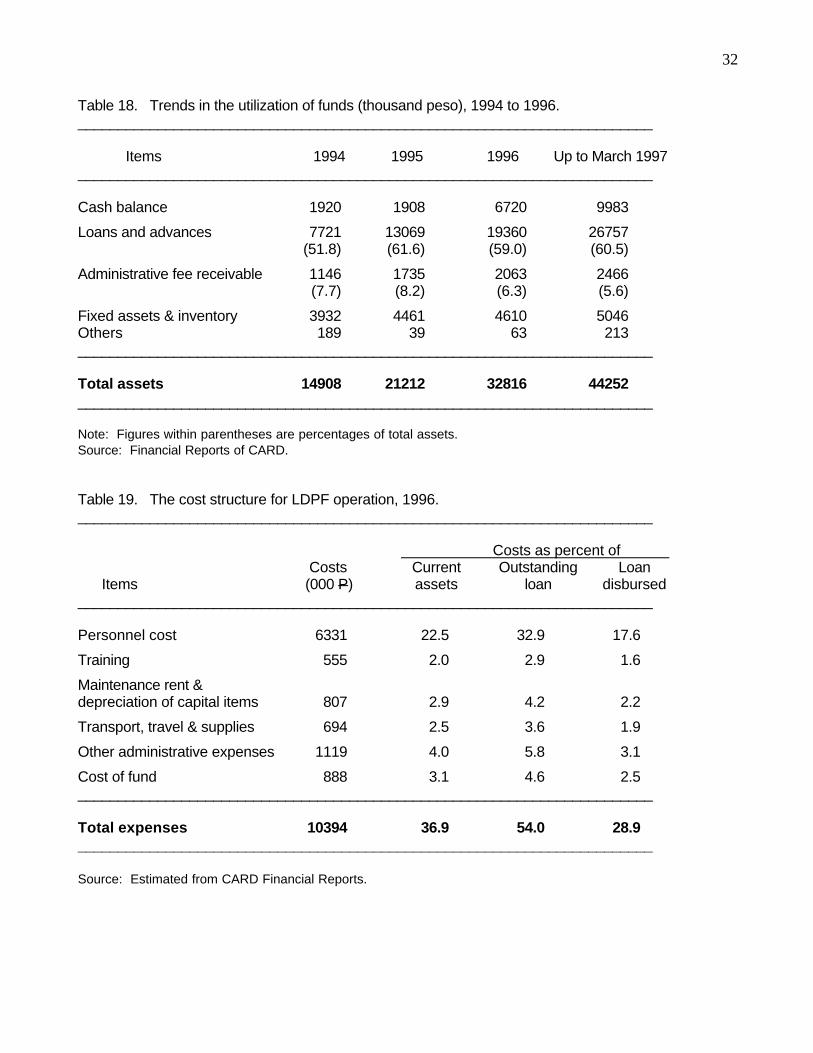
Table 18 shows the trend in the utilization of fund. Total assets reached P44.3
million by March 1997. It has grown at a rate of 62% per year since 1994. The
amount of income earning assets is indicated by loans and advances, which amounts
to about 60% of the total assets. Interests receivable from the borrowers remained at
a low level of about 6% of total assets and has declined over time because of the
success of CARD in recovering in due time not only the principal but also the interest
charged on the loans. As noted earlier CARD was able to recover 86% of the interest
due on the loan.
Cost of administration
Total operating expenses of CARD increased from P5.8 million in 1994 to
P10.4 million in 1996. As a ratio of total assets, the expenses declined from 39% in
1994 to 32% in 1996. The decline in cost is the result of improvement in operation
efficiency over time. The number of active borrower per bank worker increased from
148 in 1994 to 179 by March 1997, and the amount of loans and savings per bank
worker increased from P327,000 to P800,000 during this period.
For 1996, the detailed structure of the cost of administering the loan operation
in 1996 can be seen from Table 19. The personnel cost account for 61% of the total
cost and the cost of loan fund, 8.5%. The Grameen model emphasizes heavily on the
training of the prospective borrowers and the bank workers. CARD was able to keep
the cost of this human resource development activity at a relatively low level of about
5.3% of the total cost. The cost on this account is however expected to go up with
the expansion of the program.
Because CARD’s activity centers around the mobilization of the poor and the
administration of loans to them, the cost of its operation should be related to the
24
amount of loans and advances rather than to total funds (assets) handled by CARD.
This information is also shown in Table 19. In 1996, the personnel cost accounted for
17.6% of the amount of loans disbursed, and the total cost 28.9%. Since CARD
charges 24% administrative fee (20% interest on loans and 4% service fee) at a flat
rate on the amount of loans disbursed it incurs a financial loss of 17% on the loan
operation.
The effective rate of interest to the borrower is the interest charged per unit of
outstanding loans, as this is the amount available to supplement the capital employed
in the enterprise. The personnel cost accounted for 33% of the amount of
outstanding loan, and total cost 54% against the 46% rate of interest earned on this
performing asset. It should be noted here that the cost of funds amounts to only 4.6%
of the outstanding loan. For judging economic viability we need to estimate the
opportunity cost of the loan fund rather than actual cost which includes grants and
concessionary funds (Yaron 1992). If CARD has borrowed the entire loanable fund
from the high cost source, this cost would rise to 12%. At this cost of loan fund, the
operating expenses would increase to 61.4% of the amount of outstanding loan, and
the loss on account of loan operation would increase to 25% of total expenses.
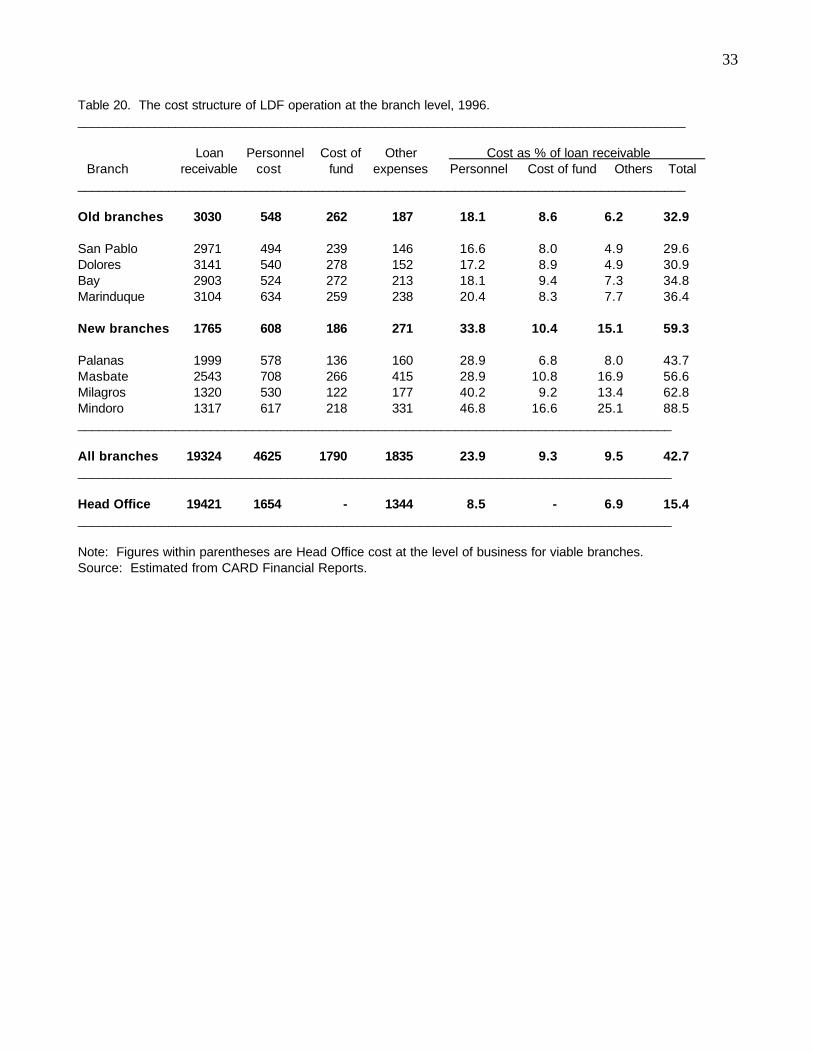
Financial viability of the branches
It should however be recognized that during the expansion phase of the credit
program new branches would be opened every year. These branches will take time to
reach full operation but have a fixed start up cost. For older branches, the cost of
operation may be lower, as these branches should be able to expand their business
without adding much to the total cost. Branch level cost function estimated for
Grameen Bank branches in Bangladesh suggested existence of economies of scale
in the operation of the credit program (Khandaker, Khalilli and Khan 1995).
In order to see the extent to which CARD branches reap economies of scale
with age, detailed information on the amount of business and the structure of cost for
25
the eight branches under operation till the end of 1996 is provided in Table 20. Four
old branches - San Pablo, Bay, Dolores and Marinduque has reached an average
business size of about P3.03 million of outstanding loans. At this size of business,
the personnel cost comes to 18.1% of the amount of outstanding loan, cost of fund
8.6%, and other expenses 6.2%. If all branches operated at this level, the overhead
cost on account of the head office would come down to 12.3%. The total cost of loan
operation thus would be about 45.2%, almost equal to 46% rate of interest earned on
the amount of outstanding loan. The loss that CARD incurs is thus on account of
branches which are yet to mature.
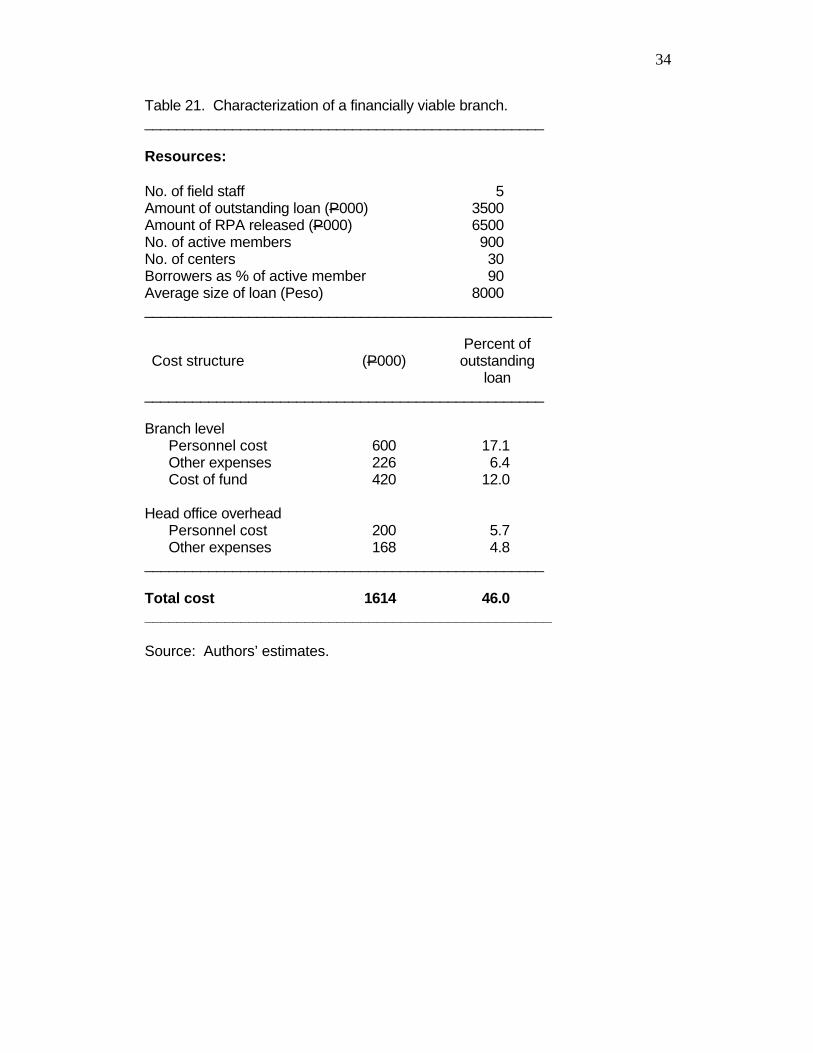
As mentioned earlier the cost of operation would increase further if CARD had
borrowed all of the loan funds from the People’s Credit and Finance Corporation at
12% rate of interest. To cover this cost, a branch needs to expand its business
(outstanding loan) to P3.5 million, and will have to lend P6.5 million to reach that level.
Our perceived characteristics of such a viable branch is shown in Table 21. A viable
branch should have at least 30 centers and 900 active members with an average loan
size of P8000 per borrower to become financially viable. It takes four to five years for
a branch to reach that level. The loss incurred by branches before they reach the
break-even level must be covered from some source, in order for the institution to be
sustainable.
26
VII. Summary and Conclusions
The Center for Agriculture and Rural Development has been implementing
since 1990 a slightly modified Grameen approach to delivery of micro-credit for
alleviation of poverty. It adopts the essential features of Grameen such as targeting
poor women as the clientele; organizing borrowers in small homogeneous groups to
develop group solidarity and peer pressure to ensure effective utilization and recovery
of loans; collecting the principal in small regular weekly installments so that the
repayment does not put pressure on low-income households; developing collective
funds with compulsory savings from borrowers for their mutual benefit to cope with
financial crisis and saving them from the clutches of usurious moneylenders at times
of emergency; and promoting social development of members using credit as an
entry point. The modification has been in the area of training of borrowers and bank
workers, and in the management and utilization of the collective fund that suit the
unique lifestyle and economic conditions in the low-income Filipino.
By March 1997, CARD has mobilized through 13 branches over 7000
members and disbursed P82.3 million of which 76% has already been recovered.
The amount of outstanding loans with borrowers has reached P20 million, and
savings in the members’ collective funds at P11 million. A survey of 133 borrowers
selected from four branches, conducted for this evaluation, shows that CARD has
largely succeeded in reaching low-income households with credit. Nearly 70% of its
borrowers have no access to land and have very poor housing worth less than
P25,000, and they received a share of loans proportional to their numbers. Only 13%
of the CARD borrowers have college level education, and 9% had landholding of over
one hectare. The average size of a loan taken by a borrower was P9,500 of which
P4,940 was financial loan used for running enterprises on a self-employed basis. The
most common enterprises are trading agricultural produce, hog-raising, retail stores,
fishing, fish drying and trading, and food vending.
27
The average labor productivity in enterprises financed with the loan was P107
per day, 34% higher than the market wage rate of P80 per day. The rate of return on
capital was 117% compared to 46% rate interest charged by CARD on the amount of
outstanding loan. These enterprises add P2240 per month to household income,
which comprise 25% of the total income of the borrowing households. Employment,
income and labor productivity increases with the number of repeat loans taken from
CARD.
Inspite of the high rate of interest charged on the loan CARD has not yet been
able to cover its operating expenses, because of the high cost of operation of this
intensively supervised credit program. In 1996, the cost of administration was 29% of
the amount of loans disbursed, and 54% of the amount of outstanding loans with the
borrowers, which led the institution to incur a financial loss of 17% of total expenses.
It is however found that a branch that reaches a business size of P3.0 million of
outstanding loan can recover its cost from the interest earned. It takes four to five
years for a branch to achieve financial viability.
It is natural for any Grameen replication to incur losses during the period of
expansion and consolidation, due to the high start-up cost of opening new branches
and four to five years taken to reach the break even level. CARD has so far covered
the loss by mobilizing small amount of grants from sympathetic donors and drawing
on available low-cost sources of fund. But it is a key constraint to the expansion of
its operation.
Since the microcredit has been effective in improving the livelihood of the low-
income households, the government should mobilize adequate donor support on
behalf of the replicators to reduce the cost of loan funds, so they could minimize the
financial losses. The micro credit institutions should encourage borrowers to
undertake small scale production activities through subcontracting arrangements with
large-scale business enterprises who could benefit from the low opportunity cost of
28
labor for the borrower households. This would help increase absorptive capacity of
capital and reduce the time needed by branches to achieve financial viability. The
government should not control the rate of interest charged by replicators in
microcredit operations. Without high rate of interest the microcredit operators would
not be able to expand the operation on a large enough scale to have a significant
impact on poverty alleviation.
References
Adams D. and Robert V C. 1986. Rural financial markets in low-income countries:
recent controversies and lessons. World Development 14. Washington
D.C.: World Bank.
Baker C B. 1968. Credit in the production organization of the firm. The American
Journal of Agricultural Economics 50:507-520.
CARD (Center for Agriculture and Rural Development). 1995. CARD at six: a
milestone report. San Pablo City, Laguna.
CARD (Center for Agriculture and Rural Development). 1997. 1986-1996: A decade
of creating opportunities. San Pablo City, Laguna.
Fuglesang A. and Chandler D. 1988. Participation as process: what we can learn
fromGrameen Bank, Bangladesh. NORAD, Oslo.
29
Fuglesang A. and Chandler D. 1993. Participation as process: what we can learn
from Grameen Bank, Bangladesh. Dhaka (Bangladesh): Grameen Trust.
Hossain M. 1988. Credit for alleviation of rural poverty: the Grameen Bank in
Bangladesh. IFPRI Research Report 65. Washington, DC: International
Food Policy Research Institute.
Hossain M. 1984. Credit for the rural poor: the Grameen Bank in Bangladesh.
Research Monograph 4. Dhaka (Bangladesh): BIDS.
Hossain, M. 1996. Grassroot organization for promoting sustainable agriculture and
food security: the experience of Grameen Bank in Bangladesh. Paper
presented at the International Workshop on Natural Resource Management in
Rice Systems: Technology Adaptation for Efficient Nutrient Use. Bogor,
Indonesia; 2-5 December 1996.
Khandaker S. 1996. Grameen Bank: impact, costs and program sustainability.
Asian Development Review 14(1):97-130.
Khandaker, S R, Khalily B, Kahn Z. 1995. Grameen Bank: Performance and
sustainability. World Bank Discussion Papers No. 306. Washington, D.C.
30
Yaron J. 1992. Successful rural finance institution. World Bank Discussion Paper
150. Washington, D.C.
Yunus, M. 1986. The Grameen Bank, as I see it. International Labor Organization,
Geneva (mimeo).
Yunus, M. 1995. Towards creating a poverty-free world. Paper presented at the
Annual Meeting of the U.S. Committee for World Food Day. Washington,
D.C.
31
Table 1.Age of membership and loans taken for sample respondents: by branch.__________________________________________________________________
No. of Year of establishing No. of years No. offBranches members the branch of membership loans
__________________________________________________________________
San Pablo (old) 29 Jan. 1990 7.1 4.1
Bay (old) 35 June 1990 6.3 3.6
Masbate (old) 39 April 1991 4.3 3.1
Milagros (new) 30 June 1995 2.5 2.0
__________________________________________________________________
Source: IRRI field survey.
Table 2. Cumulative achievement of LPDF up to March, 1997._______________________________________________________________
Up to March Up to December1997 1993
_______________________________________________________________
No. of branches under operation 13 6
No. of Centers organized 259 97
No. of Groups formed 1,654 386
No. of recognized members 9,968 2,214
No. of active members 7,324 1,711
Total loans disbursed (000 P) 82,266 9,076
Total loans recovered 62,394 6,815
Amount of outstanding loan 19,872 2,261
Accumulated center fund 11,048 463
_______________________________________________________________
Source: CARD.
32
Table 3. Progress in the operation’s of LPDF, 1990-96.________________________________________________________________________________
Accumulated Accumulated No. of No. of Drop-outYear Loans Loans Members’ center member active rate
disbursed outstanding savings fund recognized members (%)----------------------------(000 Peso) ---------------------------
________________________________________________________________________________
1990 1021 506 16 108 350 307 12.3
1991 1077 577 38 229 279 161 42.3
1992 2905 1509 127 507 598 481 19.6
1993 4073 2261 292 970 987 762 22.8
1994 11163 6128 781 2477 2297 1836 20.0
1995 16930 9626 1401 4982 1482 693 53.3
1996 35913 19421 2372 8715 3275 2604 20.0________________________________________________________________________________
Source: CARD, 1997.
Table 4. Distribution of respondents and loans by number of loans taken._______________________________________________________________
No. of Respondents Ave. sizeloans taken No. Percent of loan
_______________________________________________________________
Nil 1 0.01 0
One 21 15.8 2157
Two 28 21.1 4368
Three 26 19.6 8612
Four 23 17.3 10543
Five 27 20.3 17567
Six 6 4.5 17167
Seven 1 0.01 37000
________________________________________________________________
Total 133 100.0 9386________________________________________________________________
Source: IRRI Field Survey.
33
Table 5. Distribution of current loans by type and age of membership.____________________________________________________________________
No. of loans Financial Housing Educational Emergency Totaltaken loan loan loan loan loan
____________________________________________________________________
Up to two 1640 840 202 670 3352(48.9) (25.1) (6.0) (20.0) (100.0)
Three to four 4449 3776 447 847 9513(46.8) (39.7) (4.7) (8.9) (100.0)
Five & more 10500 5735 435 1398 18068(58.1) (31.7) (2.4) (7.7) (100.0)
____________________________________________________________________
Total 4940 3173 352 921 9386(52.6) (33.9) (3.8) (9.8) (100.0)
____________________________________________________________________
Note: Figures within parentheses are percent of total loans.Source: IRRI Field Survey.
Table 6.Distribution of borrowers and loans by size of landholding.__________________________________________________________________
Landholding Percent of Share of Share ofgroups (ha) borrowers financial loan housing loan
__________________________________________________________________
Nil 69.9 63.9 72.8
Up to 0.20 4.5 4.6 2.4
0.21-0.50 12.0 18.0 15.6
0.51-1.00 4.5 3.5 4.3
1.00 & above 9.0 9.7 5.0__________________________________________________________________
100.0 100.0 100.0__________________________________________________________________
Source: IRRI field survey.
34
Table 7.Distribution of borrowers and loans by value of housing._________________________________________________________________
Value of housing Percent of Share of Share of(000 P) borrowers financial loan housing loan
_________________________________________________________________
Up to 2.0 15.0 22.9 21.3
2.01-5.0 11.3 7.2 4.3
5.01-10.0 18.8 19.6 13.0
10.01-25.0 25.6 16.1 22.0
25.01-50.0 21.9 24.2 28.7
50.01 & above 7.5 9.9 10.7
_________________________________________________________________
Source: IRRI field survey.
Table 8. Distribution of borrowers and loans by educational status ofthe member._________________________________________________________________
Educational status Percent of Share of Share of(No. of years in schooling) borrowers financial loans housing loan_________________________________________________________________
Up to 3 7.5 2.4 7.1
4-6 34.5 31.0 33.4
7-10 45.1 49.5 38.2
11-14 12.8 17.0 21.3
_________________________________________________________________
Total 100.0 100.0 100.0_________________________________________________________________
Source: IRRI field survey.
35
Table 9.Repayment of interests on the loan, up to March, 1997.__________________________________________________________________
Amount Administrative Administrative Rate ofType of loan of loan fee charged fee recovered recovery
(000 P) (000 P) (000 P) (%)__________________________________________________________________
Financial loan 61,935 10,880 9214 84.6First loan (12117) (1121) (1000) 89.22nd to 5th loan (49818) (9759) (8214) 84.2
Housing loan 15430 3087 2106 68.2
Other loans 4901 1081 912 84.3__________________________________________________________________
Source: CARD.
Table 10. Rate of return on labor and capital: By Branch.______________________________________________________________________
Items San Pablo Bay Masbate Milagros Total______________________________________________________________________
(No. of cases) (29) (35) (39) (30) (133)
Gross income (P/annum) 34,766 23,454 55,060 20,644 34,550
Total capital (P) 6,776 6703 8983 4227 6814Equity 879 2646 2985 1127 2017Loan 5,897 4,057 5,948 3,100 4797
Financial loan (P) 5414 5143 5782 3150 4940
Employment (days/yr) 212 164 340 256 247Wife 144 57 249 194 163Husband 38 63 60 59 56Other members 30 44 31 3 28
Household income (P/annum) 26,642 15,630 45,685 15,803 26,884
Labor productivity (P/day) 126 95 134 62 109
Return on capital (%) 162 54 210 -96 117______________________________________________________________________
Source: Authors’ estimate from IRRI field survey.
36
Table 11. Rate of return on labor and capital: By number of loans taken by the borrower.___________________________________________________________________________
No. of loans taken Items Up to two 3 to 4 5 & more
___________________________________________________________________________
No. of cases 50 49 34
Gross income (P/annum) 13382 38307 60341
Total capital (P) 2138 7508 12691Equity capital 498 2671 3309Borrowed capital 1640 4837 9382
CARD loan 1640 4449 10500
Employment (days/ yr) 176 275 366Wife 127 192 219Husband 28 68 83Other members 21 15 64
Household income (P/annum) 10837 30855 44764
Labor productivity (P/day) 62 112 122
Capital productivity (Percent) -135 117 144___________________________________________________________________________
Source: Authors’ estimates from IRRI field survey.
Table 12. Rate of return on labor and capital by activity.______________________________________________________________________________
No. of Total capital Net household Labor Return onActivity cases invested income productivity capital
(P) (P) (%)______________________________________________________________________________
Hog raising 24 3,000 11,040 197 113
Trading agricultural produce 25 9,000 43,746 160 260
Sari-sari store 15 6,000 25,238 184 248
Fish drying and trading 11 8,100 53,468 195 383
Food vending 7 5,400 18,483 128 137
Fishing 5 6000 16,024 88 26
Bakery 3 34000 30,400 83 3
Dressmaking 4 5000 17,000 93 87
Transport 2 10,000 17,528 162 104______________________________________________________________________________
Source: Authors’ estimates based on IRRI field survey.
37
Table 13. Effect of LPDF operations on investment and fixed assets.______________________________________________________________________________
No. of loans taken Difference (Peso) Items Up to two 3 to 4 5 & more 3 to 4 5 & more
over overtwo & less two & less
Investment in CARDfinanced activity:
Own capital 498 2671 3309 2173* 2811**(1.81) (3.27)
Borrowed capital 1640 4837 9382 3197** 7742**(6.14) (6.31)
Value of livestock 7945 9526 10409 1581 2464holding (0.65) (0.70)
Value of machinery, 943 7796 14682 6853** 13793**tools and equipment (2.10) (3.03)
Value of housing 30,250 32,562 57,863 2,312 27,613**(0.22) (2.09)
______________________________________________________________________________
Note: Figures within parentheses are estimated ‘t’ values of the difference in means.** denotes that the hypotheses of equality of means is rejected at 5% error and *, at
10%.Source: IRRI field survey.
38
Table 14. The effect of LDPF operations on employment of the member and the spouse, 1997.______________________________________________________________________________
Working member No.of loans taken Difference (No. of day) of the household Up to two 3 to 4 5 & more 3 to 4 5 & more
overtwo & less
LDPF activity (days/yr)
Wife 117 184 201 67** 84**(2.01) (2.20)
Husband 28 67 81 39* 53**(1.77) (2.16)
Other activities (days/yr)
Wife 98 135 138 37 40(1.25) (1.23)
Husband 308 316 245 8 -63*(0.28) (1.89)
______________________________________________________________________________
Note: Employment is measured in standard eight-hour working days.Many respondents reported working more than eight hours per day.Figures within parentheses are estimated ‘t’ values. ** denotes that the hypotheses of equality of means rejected at 5% probability error, and *, at 10%.
Source: IRRI field survey.
39
Table 15. The effect of LPDF operations on members’ income, 1997.______________________________________________________________________________
No. of loans taken Percent difference Up to two 3 to 4 5 & more 3 to 4 5 & more
Source of over overincome two & less two & less
Annual income from 13,332 38,308 60,314 187** 352**loan financed activity (P) (3.44) (4.61)
Annual income from 51,118 77,257 108,229 51* 112*other activity (P) (1.74) (3.45)
Total annual income (P) 64,450 115,565 159,953 79** 148**(3.17) (4.83)
______________________________________________________________________________
Note: Figures within parentheses are estimated ‘t’ values of the differences in means.**denotes that the hypothesis of equality of means is rejected at 5% probability error, and*denotes at less than 10%.
Source: IRRI field survey.
Table 16. The effect of LPDF loan on income: Regression estimates.________________________________________________________________
Explanatory Regressionvariables coefficient ‘t’ value
Members’ labor 86.6 4.06**
Spouse’s labor 58.1 1.83*
Other members’ labor 0.1 0.02
Own capital 2.39 4.26**
Borrowed capital 3.03 4.16**
Education of member -810 -0.67
Education of spouse 725 0.55
Age of the member 125 0.37
Constant term -5772 -0.29
R square 0.61
F-value 20.9
_______________________________________________________________
Note: The dependent variable is annual income from the CARD financed activity.** denotes that the regression coefficient is statistically significant at 5% error, and* at 10%.
Source: IRRI field survey.
31
Table 17. Sources and costs of funds, up to March 1997._______________________________________________________________________________________
Amount received (‘000 peso) Outstanding balance Rate of interest
Source of fund Amount % share Amount % share (% per year)_______________________________________________________________________________________
Department of Agrarian reforms 262.5 0.8 37.5 0.2 0.0
Catholic relief services 1147.8 3.5 697.8 3.4 6.0
DTI/Development Bank 2000.0 6.0 0.0 0.0 12.0
Landbank of the Philippines 2200.0 6.6 911.8 4.5 8.0
People’s credit and 20459.5a 61.5 11460.4 56.5 12.0Finance Corporation 3241.5b 9.7 3241.5 16.0 3.0
Oxfam America 255.0 0.8 255.0 1.3 10.0
Grameen Trust 3709.2 11.1 3678.3 18.1 2.0_______________________________________________________________________________________
Total 33275.5 20282.3 100.0 8.3_______________________________________________________________________________________
aRevolving credit line (available since December, 1995)bSoft loan for administration of program.Source: CARD.
32
Table 18. Trends in the utilization of funds (thousand peso), 1994 to 1996.________________________________________________________________________
Items 1994 1995 1996 Up to March 1997________________________________________________________________________
Cash balance 1920 1908 6720 9983
Loans and advances 7721 13069 19360 26757(51.8) (61.6) (59.0) (60.5)
Administrative fee receivable 1146 1735 2063 2466(7.7) (8.2) (6.3) (5.6)
Fixed assets & inventory 3932 4461 4610 5046Others 189 39 63 213________________________________________________________________________
Total assets 14908 21212 32816 44252________________________________________________________________________
Note: Figures within parentheses are percentages of total assets.Source: Financial Reports of CARD.
Table 19. The cost structure for LDPF operation, 1996.________________________________________________________________________
Costs as percent of Costs Current Outstanding Loan
Items (000 P) assets loan disbursed________________________________________________________________________
Personnel cost 6331 22.5 32.9 17.6
Training 555 2.0 2.9 1.6
Maintenance rent &depreciation of capital items 807 2.9 4.2 2.2
Transport, travel & supplies 694 2.5 3.6 1.9
Other administrative expenses 1119 4.0 5.8 3.1
Cost of fund 888 3.1 4.6 2.5________________________________________________________________________
Total expenses 10394 36.9 54.0 28.9________________________________________________________________________
Source: Estimated from CARD Financial Reports.
33
Table 20. The cost structure of LDF operation at the branch level, 1996._______________________________________________________________________________________
Loan Personnel Cost of Other Cost as % of loan receivable Branch receivable cost fund expenses Personnel Cost of fund Others Total
_______________________________________________________________________________________
Old branches 3030 548 262 187 18.1 8.6 6.2 32.9
San Pablo 2971 494 239 146 16.6 8.0 4.9 29.6Dolores 3141 540 278 152 17.2 8.9 4.9 30.9Bay 2903 524 272 213 18.1 9.4 7.3 34.8Marinduque 3104 634 259 238 20.4 8.3 7.7 36.4
New branches 1765 608 186 271 33.8 10.4 15.1 59.3
Palanas 1999 578 136 160 28.9 6.8 8.0 43.7Masbate 2543 708 266 415 28.9 10.8 16.9 56.6Milagros 1320 530 122 177 40.2 9.2 13.4 62.8Mindoro 1317 617 218 331 46.8 16.6 25.1 88.5_____________________________________________________________________________________
All branches 19324 4625 1790 1835 23.9 9.3 9.5 42.7_____________________________________________________________________________________
Head Office 19421 1654 - 1344 8.5 - 6.9 15.4_____________________________________________________________________________________
Note: Figures within parentheses are Head Office cost at the level of business for viable branches.Source: Estimated from CARD Financial Reports.
34
Table 21. Characterization of a financially viable branch.__________________________________________________
Resources:
No. of field staff 5Amount of outstanding loan (P000) 3500Amount of RPA released (P000) 6500No. of active members 900No. of centers 30Borrowers as % of active member 90Average size of loan (Peso) 8000___________________________________________________
Percent ofCost structure (P000) outstanding
loan__________________________________________________
Branch levelPersonnel cost 600 17.1Other expenses 226 6.4Cost of fund 420 12.0
Head office overheadPersonnel cost 200 5.7Other expenses 168 4.8
__________________________________________________
Total cost 1614 46.0___________________________________________________
Source: Authors’ estimates.