re-evaluating estimates of impervious cover and riparian...
TRANSCRIPT

Re-evaluating estimates of impervious
cover and riparian zone condition in
New England watersheds: Green
infrastructure effectiveness at the
watershed scale
Jessica Morgan1, Alisa Morrison2, N. Detenbeck3,
S. Rego3, Y.Q. Wang4, Ralph Abele5
1 ORISE Fellow U.S. EPA, ORD, NHEERL Atlantic Ecology Division, Narragansett, RI
Ph.D. Student, Department of Natural Resources Science, University of Rhode Island, Kingston, RI 2Student Services Contractor, U.S. EPA, ORD, NHEERL Atlantic Ecology Division, Narragansett, RI
3 U.S. EPA, ORD, NHEERL Atlantic Ecology Division, Narragansett, RI 4Laboratory for Terrestrial Remote Sensing, University of Rhode Island, Kingston RI
5U.S. EPA, Region 1, Boston, MA

Contributors
• EPA ORD/Region 1 RARE project (Ralph Abele, R1) – EPA NHEERL: Naomi Detenbeck , Nathan Smucker , Anne Kuhn, Darin Kopp*
• EPA ORD/Region 1 Image Analysis in Support of Green Infrastructure
Project – EPA NHEERL: Naomi Detenbeck, Steve Rego, Nathan Smucker
– Laboratory for Terrestrial Remote Sensing, University of Rhode Island: Y.Q. Wang

Background

• Develop urbanization-response relationships for habitat and
biotic communities across New England
• Compare condition of watersheds with green infrastructure (GI)
BMPs/LID with expected condition based on watershed
development (90% CI)
– Historical data
– New survey of watersheds with GI BMP/LID
• Diagnose cause of development-related impairments and
recovery trajectories for BMP/LID remediations
EPA Green Infrastructure Initiative - Region 1
RARE Project

Test watershed selection:
• Collect historical monitoring data
• Inventory green infrastructure BMPs/LID
• Evaluate expected effectiveness
– % impervious area treated/reduced vs. total %
impervious area
– BMPDSS: % load reductions for TSS, TP by BMP
– Retention capacity index (Walsh et al. 2009)
• Predict watershed condition w 90% C.I. in absence of
BMPs/LID and compare with measured condition

Site selection process for new surveys
0
10
20
30
40
50
60
70
80
90
100
0 50 100
% i
mp
erv
iou
s a
rea t
reate
d
% total impervious area
% impervious areatreated
Random selection of 1 site
from top 90th percentile in
each bin

State Stream Name Area (km2)
NH Norton Brook 2.55
NH Trib to Cockermouth River 3.27
RI Dry Brook 7.90
VT Malletts Creek 1.44
VT Dothan Brook 3.52
VT Trib to Winooski River 4.06
VT Coleman Brook 4.71
VT East Creek 6.04
VT Kilburn Brook 6.11
VT Falls Brook 7.94
VT Clay Brook 15.11
VT Potash Brook 20.07
Sampling Watersheds


1st Challenge…….
Where are the BMPs???

Impervious Area
• Not all IA created equal
Images from www.nzdl.org

Impervious Area
• Not all IA created equal
– Total IA
Images from www.nzdl.org

Impervious Area
• Not all IA created equal
– Total IA
– Effective IA
• Disconnected IA is not
counted
Images from www.nzdl.org, www.pubs.ext.vt.edu, www.chesapeakestormwater.net

Methods
• Queried sources
• Mapped BMPs
• Determined IA treated
• Aggregated BMPs

• National/Regional
• State
• Local
BMP Inventory

• National NEMO
Network developed
The National Low
Impact Development
(LID) Atlas
• The University of New
Hampshire Stormwater
Center interactive
database.
National/Regional Sources

National/Regional Sources
• The Green Project -CWSRF program allocates 20% of ARRA funding to
projects that address green infrastructure.
– Cohassett, Massachusetts -construction of more than 40 rain gardens and vegetated
swales .
– The Long Creek Restoration Project-South Portland, Maine-implementing stormwater
management components to reduce pollutant loadings in Casco Bay.

• EPA Grant Reporting and Tracking System (GRTS) – GRTS gathers grant
information from EPA’s centralized grants and financial databases.
– Filtered database by Primary Functional/BMP Design and Implementation.
– Information on each project varied, but generally included location of LID installation and type of treatment practice.
www.iaspub.epa.gov/pls/grts/
National/Regional Sources

• Green Roof/Green Wall
Database – Derived from published public
accounts and individual project
stakeholders.
– Open source, community based
document.
– The database includes location
and size of roof, installer,
designer and manufacturer.
http://www.greenroofs.com/projects/
National/Regional Sources

State Sources
• New Hampshire Department of Environmental Services (NHDES) - New
Hampshire Alteration of Terrain permits are issued by the NHDES
Alteration of Terrain (AoT) Bureau.
• Connecticut Department of Energy and Environmental Protection
Bureau of Water Protection and Land Reuse Planning and Standards
Division tracks Low Impact Development Implementation projects in
Connecticut.
• Vermont Department of Environmental Conservation Watershed
Management Division has both an on-line map showing locations of
Stormwater permits as well as an associated Microsoft Access
database.
• Massachusetts, Rhode Island and Maine do not track LID installations.
• In New England, the NPDES Stormwater Permit Program is
administered by state government in Connecticut, Maine, Rhode Island,
and Vermont or by USEPA in Massachusetts and New Hampshire.

State Sources
• Underground Injection
Control (UIC) Class V
permits
• Used to inject non-
hazardous fluids into or
above an underground
source of drinking water
such as where
stormwater flows to
drywells.
• Permitting varies by state
• Massachusetts
• Maine
• Rhode Island
• New Hampshire

• The Boston Sewer and Water Commission (BSWC) maintains records
of dry wells, grit chambers and infiltration devices installed within City of
Boston (www.bwsc.org).
• The Town of Coventry, Connecticut tracks infiltration basins or
trenches, rain gardens, or in-ground perforated chambers by property
owner and street address (Town of Coventry, 2006).
• The International Stormwater Database and the US Green Building
Council LEED project directory did not yield any additional information.
• We also contacted private companies via email regarding location and
type of any LID/BMP projects they have designed. We sent over 100
emails and received two responses.
Local Sources

BMP Inventory
• Total number of BMP
installations - 5,348
Source Number of LID Installations
319 Grants 96
ARRA 3
BWSC 1160
Town of Coventry, CT 22
Connecticut DEEP 18
Green Roof Database 36
International BMP Database 10
MA UIC 159
MA MS4 5
ME UIC 27
ME MS4 1
NEMO 123
NH UIC 94
New Hampshire Alteration of
Natural Terrain Permits 124
RI UIC 452
RI MS4 2
UNH Stormwater Database 133
Vermont Water Quality
Database 2883

Methods
• Queried sources
• Mapped BMPs
• Determined IA treated
• Aggregated BMPs


BMP Locations

Methods
• Queried sources
• Mapped BMPs
• Determined IA treated
• Aggregated BMPs

• Information
collected by each
organization
varied widely in
attributes, details
and scale
IA Treated
Source Type of data provided Locational Data 319 Grants Description of project Maps, description of
location ARRA Description of project Maps, description of
location BWSC Type of installation (oil
separator, dry well, or grit
chamber
Street address
Town of Coventry, CT None Street address Connecticut DEEP Site Name, Type of
Installation, None
Green Roof Database Area of green roof Street address International BMP Database Type of Installation Latitude/longitude of
installation MA UIC Facility Name Street Address MA MS4 Description of project Maps, description of
location ME UIC Description of project Street address ME MS4 Description of project Maps, description of
location NEMO Type of Installation Street Address NH UIC Facility Name Latitude/longitude of
installation and Street
Address New Hampshire Alteration of
Natural Terrain Permits Area disturbed, Impervious
Area, Undisturbed Area,
Length of roadway, Name of
Receiving Water, Type of
treatment
Polygon Shapefile
RI UIC Facility Name Street Address RI MS4 Description of project Maps, description of
location UNH Stormwater Database Type of Installation Street Address Vermont Water Quality
Database Impervious Area, Impervious
Area Treated, Name of
Receiving Water, Type of
treatment
Latitude/longitude of
installation

• If IA treated was not documented:
– All IA on the site was treated.
– Entire building footprint drains to rain garden.
– Area of the green roof was equivalent to the area
of treated IA.
– The type, degree and efficacy of treatment as well
as amount of infiltration provided were not
accounted for.
IA Treated

Methods
• Queried sources
• Mapped BMPs
• Determined IA treated
• Aggregated BMPs

Aggregate BMPs
% IA by Catchment

Aggregate BMPs
% IA by Catchment % IA Treated by
Catchment

Aggregate BMPs
% IA by watershed

Aggregate BMPs
% IA by watershed with
BMPs

Aggregate BMPs
% Treated IA by
watershed with BMPs

Aggregate BMPs
% Treated IA by
watershed
% IA by watershed

• Lack of reporting requirements.
• Confidentiality concerns.
• Absence of centralized databases where
source information can be found.
• Treatment information.
• IA accuracy.
Challenges

• Standardize reporting of IA treatment
• Potential reporting criteria
– Walsh’s retention capacity index (Walsh et al,
2009)
• RC =0 when an IA is directly piped to the stream
• RC =1 when runoff from IA would reach the stream no
more frequently than in the predevelopment state.
• Need frequency curve for rainfall events
Treatment
Information

– Load reductions
• New England BMP-DSS tool
• Requires detailed design information
Treatment
Information

IA Accuracy
VT Impervious Area

RI Impervious Area
IA Accuracy

Next Challenge…….
How accurate are our IA
estimates?

Predicting Expected Condition for:
• Macroinvertebrates
• Periphyton
• Temperature
• Fish
• Habitat

Preliminary Results –
Macroinvertebrates and Periphyton
• Lower thresholds for impacts than the typical 10-12%
impervious cover reported in the literature (Smucker et al. 2013,
Detenbeck et al. 2013)
• Riparian buffers are moderating 1/3-1/2 of urbanization impacts,
even when bypassed by stormwater infrastructure (Smucker et
al. 2013, Detenbeck et al. 2013)
• 30m National Land Cover Dataset (NLCD) may be
underestimating impervious cover and riparian zone condition

Potential for improvement…
Macroinvertebrate/Periphyton/Temperature Models
• Could benefit from improved impervious cover
and riparian zone cover estimates using 1m
National Agriculture Imagery Program (NAIP) data
1m NAIP imagery Classified 1m NAIP data 30m NLCD data

Landuse/Landcover Classifications – 1m NAIP data
• Produced at 3 year intervals
• Available as DOQQ
• Near infrared band
• “Leaf-on” data
– GeniePro 2.4 • Supervised classification using genetic algorithms
• Analyzes spectral properties, texture, shape, and proximity
– Ancillary data sets to improve classifications • Goal = within 1% for impervious cover
• NDVI
• LIDAR
• Road Networks
• National Wetlands Inventory
Methods
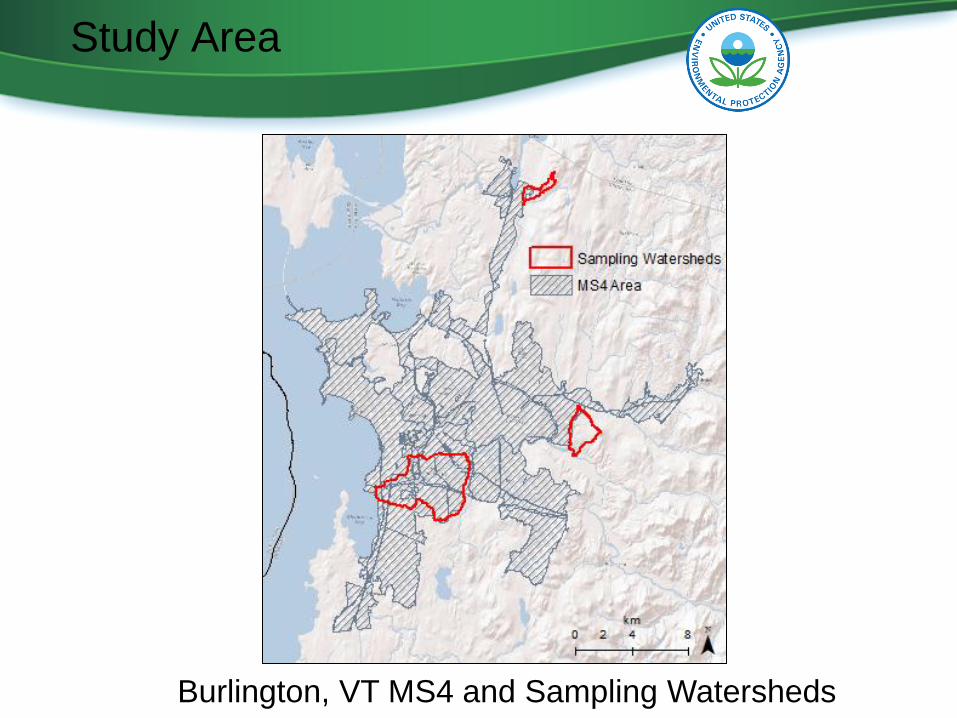
Burlington, VT MS4 and Sampling Watersheds
Study Area

1m NAIP DOQQ
Mallets Creek, VT

Normalized Difference
Vegetation Index (NDVI)
• Create NDVI band to extract water class
NDVI = (NIR — VIS)/(NIR + VIS) *NIR = Near infrared, VIS= Visible red

– Low values (<0.1) = barren rock, sand, or snow
– Medium values (0.2 - 0.3) = shrub and grassland
– High values (0.6 - 0.8) = temperate and tropical rainforests
Source: NASA

NDVI Band for
Mallets Creek

Water
Classification for
Mallets Creek

Adding in LIDAR Data
Credit: RIGIS

Ancillary Data - LIDAR
Create nDSM and Intensity Bands:
nDSM = Normalized Digital Surface Model
• Difference in elevation between bare earth and 1st return
Intensity
• Return strength of LIDAR pulse
• Dependent on reflectivity of the object

nDSM for
Mallets
Creek

Intensity Band
RI Lidar Tile
19_02864632

Working
with
LIDAR =
Not for
Sissies
300 QQuads x
30Tiles/QQuad=
9000 LIDAR
Tiles!!!

Forest/Agriculture/Grass
Classification for
Mallets Creek

Ancillary Data – Road Networks
• Identifies IA masked by leaf-on imagery
– VT E911 road data
– Buffered by road-type
• Based on VT DOT specifications
• Reduced based on visual inspection
– Combined with IA classification in ArcGIS

Impervious
Classification for
Mallets Creek

Impervious
Classification for
Mallets Creek –
Before Road Data

Impervious
Classification for
Mallets Creek –
After Road Data

Putting it all
together…
(with a conditional)

Accuracy Assessment
• ERDAS IMAGINE
• Stratified Random Sampling – 50 points/strata
• Original data set and Google Earth historical
imagery as reference data

Accuracy Assessment
• Overall = 90.23%
• Kappa = 0.88

Accuracy Assessment – Conditional Kappas
• Water = 0.95
• Impervious = 0.93
• Forest/Tree = 0.95
• Agriculture = 0.81
• Grass/Other = 0.76

Accuracy Assessment – Producer’s and User’s
Class Reference
Number
Number
Correct
Producer’s
Accuracy (%)
User’s
Accuracy (%)
Water 48 48 100.00 96.00
Impervious 50 47 94.00 94.00
Forest/Tree 62 53 85.48 96.36
Agriculture 49 43 87.76 84.31
Grass/Other 47 40 85.11 80.00
Totals 256 231
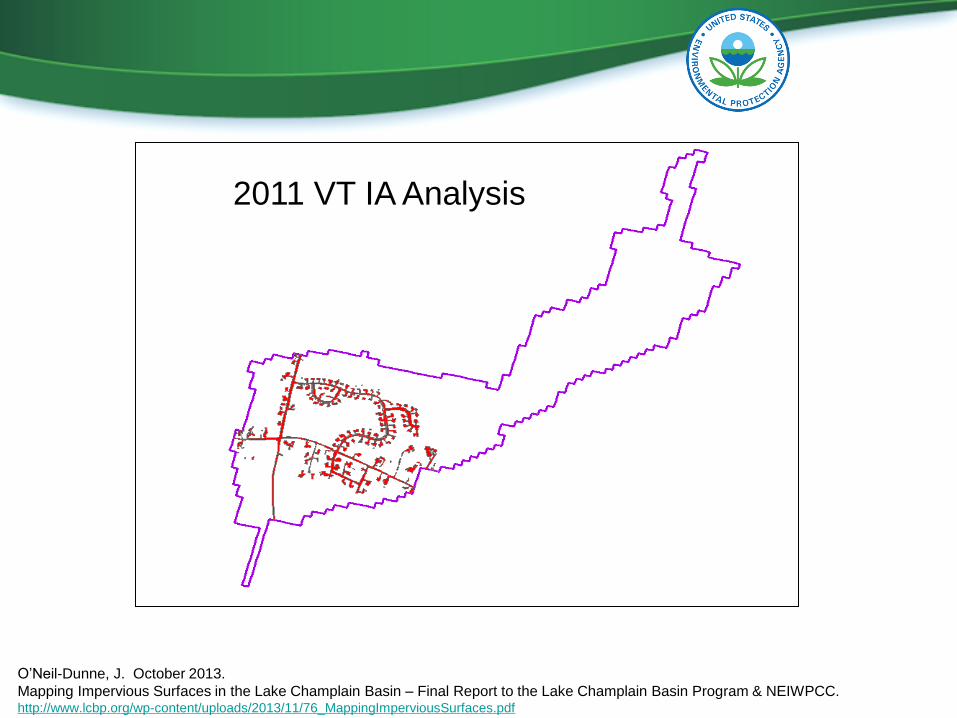
2011 VT IA Analysis
O’Neil-Dunne, J. October 2013.
Mapping Impervious Surfaces in the Lake Champlain Basin – Final Report to the Lake Champlain Basin Program & NEIWPCC. http://www.lcbp.org/wp-content/uploads/2013/11/76_MappingImperviousSurfaces.pdf

IA Comparison
Class Current
Study
2011
Lake
Champlain
NLCD
2006
NLCD
2011
Impervious .09 km2/
1.70km2
.08 km2/
1.49km2
.05 km2
1.07km2
.06 km2/
1.23km2
Watershed/Whole Tile

Summary
• Use of 1m resolution data and addition of
ancillary data improves accuracy
• Developed a low-cost, relatively quick and
straightforward method for classifying LULC
• Next steps: Finish classifications and plug
into models!

Acknowledgements
• Fish, macroinvertebrate, periphyton, habitat, and thermal datasets
– CT DEEP, MA DFW, ME DEP and DMR, NH DES and F&G,RI DEM, VT
DEC and F&W
– Charles R, Wood-Pawcatuck Association
– NAWQA, STORET, NWIS,EPA NARS/NEWS
• Stormwater Best Management Practices (BMPs)/Low Impact Development
(LID) information
– EPA Region 1 MS4 stormwater permit and 319 (NPS grant) coordinators
– State MS4 stormwater permit, alteration of terrain permit (NH), and 319
coordinators, DOTs
– NEMO, ISBMPdbase, UNH Stormwater Center, Green Roofs.com,
NGBC (LEEDS),
– Numerous developers
