rational approach for geometric design of speed-control road
TRANSCRIPT

66 TRANSPORTATION RESEARCH RECORD 1356
Rational Approach for Geometric Design of Speed-Control Road Humps
T. F. FwA AND C. Y. LIAW
Dimensions of most speed-control humps are determined from the engineering judgment of design engineers or past experience of the highway agency concerned. Guidelines for analytical design of hump geometry for speed control are not commonly available. A rational approach is presented in which the geometric dimensions of a hu~p selected are dependent on the choice of a design 85th-percent1le hump-crossmg speed and a peak vertical acceleration that governs drivers' choice of hump-crossing speeds. A m.athematical ?alf-car model is used to examine the suitability of tnal hump des~gns with respect to the design hump-crossing speed and peak vertical acceleration. To facilitate design analysis, it is proposed that a representative car be selected from the traffic stream as the calibration reference for the half-car model. An example application is presented in which the hump-crossing speeds predicted using the proposed design procedure are found to be in good agreement with hump-crossing traffic speeds measured in Singapore and the United Kingdom .
The use of road humps for controlling vehicle speeds on residential and other local roads has been practiced in many countries (1-4) . To achieve effective control, two aspects of hump design must be addressed: geometric design and layout design. Hump geometric design deals with the shape and size of individual road humps; hump layout design refers to the determination of hump spacing and number of humps to be installed in the road section.
Under normal circumstances, drivers will decelerate as they approach a hump and accelerate after crossing a hump. Figure 1 shows a typical speed profile of vehicles traversing a section of road installed with speed-control humps. Lowest speeds are found at hump locations. In general, it may be said that lower hump-crossing speeds lead to lower speeds between humps. Geometric design of humps is therefore a key element in overall hump design. Unfortunately, the design of hump geometry to achieve a desired hump-crossing speed limit is not a straightforward matter. Despite the widespread use of such humps, guidelines for their geometric design are not readily available. Humps with different cross-sectional surface profile, base width, and crown height combinations have been used in different parts of the world (1,5 ,6). Some designs were adopted on the basis of field test evidence, others were chosen on the basis of past experience or subjective judgment of the engineers involved. These designs are likely to be regionspecific, because besides hump geometry, the choice of speed is also affected by vehicle operational characteristics, driver behavior, and perceptions of discomfort.
Center for Transportation Research and Department of Civil Engin~ering , National University of Singapore, 10 Kent Ridge Crescent, Smgapore 0511.
JO 28 26 2• 22
- 20 ~ 18 ,,S 16
li 1• - 12 -.,, 10
>-- SJ.6m--; 1---7J.Om ------< r--1.6 6m ---i
Hu~5 tti~• ~3 ~2
8 Direction of truvel 6
• 2 o~"'-'::"~.'::--::':-.......___,___.~_.___._u__._~.._..u...__J
o m ~ ~ ~ ~ ~ ~ ~ ~ ~
DISTANCE FROM JUNCTION (ml
FIGURE 1 Example of speed profile of passenger cars along road section (2).
This paper describes a study conducted in Singapore to examine the feasibility of using a simple computer model of vehicle in the analysis and design of speed-control road humps. Data required for the analysis were obtained from field measurements of hump-crossing speeds and associated peak accelerations of passenger cars. A hump geometric design procedure is proposed that allows the design engineer to vary the design according to the selected hump-crossing speed control. The procedure uses a mathematical half-car model to estimate the peak vertical acceleration of a selected make of vehicle. This acceleration is then used as the criterion for assessing the suitability of different hump designs.
BASIS OF APPROACH
Peak Vertical Acceleration Criterion
It has been commonly assumed in speed-control hump studies that drivers slow down when approaching a hump in order to reduce the discomfort caused by vertical accelerations (2 ,6, 7). Researchers have also shown that the peak vertical accelerations of vehicles passing over humps are highly correlated with subjective assessment of discomfort. For instance Watts (7) has reported a coefficient of correlation (r) of th; order of .85. The peak vertical acceleration is therefore an appropriate indicator of driver discomfort in hump analysis. One would thus expect the hump-crossing speeds of vehicles to be related to the peak vertical accelerations. This peak vertical

Fwa and Liaw
acceleration criterion is the underlying assumption of the approach proposed in this paper.
Hump-Crossing Speed Statistics
For a given hump shape and dimension , the peak vertical acceleration varies with vehicle and hump-crossing speed. At the same hump-crossing speed, different peak vertical accelerations will be experienced by vehicles having different wheelbase dimensions , tire properties, and suspension systems. Some spread of hump-crossing speeds is therefore expected, even if the tolerable peak vertical accelerations of all drivers are identical. The 85th-percentile speed is the speed statistic most widely used in hump studies (5-7) . In general, an 85th-percentile hump-crossing speed may be specified in hump design. The design is considered satisfactory if 85 percent or more of the traffic crosses the hump at a lower speed.
Design Concept
A logical procedure of geometric design would consist of (a) the selection of a design peak vertical acceleration that most drivers would not want to experience in crossing a hump, and (b) the determination of the hump-crossing speeds of different vehicles at which their respective peak vertical accelerations are equal to the design value. In this study, the peak vertical acceleration in the first step is selected on the basis of an analysis of field measured accelerations . In the second step, it would be ideal to perform the analysis for all vehicle types present in the traffic stream . This is not practical, however , because the interpretation and determination of dynamic characteristics of vehicle parameters is a time-consuming process that requires special equipment and skill. Not only would dynamic responses differ among sizes and makes of car, substantial differences would also be found among cars of the same size and make as they age. Further complications arise when other variables such as passenger loads and tire properties are included. On the basis of these considerations, a different procedure is adopted .
Consider the entire traffic stream as an entity and let the 85th-percentile hump-crossing speed represent the aggregate response of the entity. This speed is dependent on several factors, including road geometry and hump dimensions, and would therefore vary from hump to hump in general. The 85th-percentile hump-crossing speed of a hump can be determined from speed measurements in a field survey. If a car of a representative make and size is selected, an estimate of the appropriate design peak vertical acceleration [denoted as
67
(ap)esrl can be made from measurements of the peak vertical accelerations of the selected car traversing humps at the respective 85th-percentile speeds. This car , with the selected (ap)esr value, may then be used to predict the 85th-percentile hump-crossing speed of a new hump design.
An ideal design aid would be a complete full-car computer model that could be used to determine the hump-crossing speed of the representative car that produces the peak vertical acceleration (ap)csi· For easy practical application, this study illustrates that a much simpler half-car model can be used instead. In summary, the major elements of the proposed procedure are (a) selecting a representative car and estimating the design peak vertical acceleration by means of (ap)est on the basis of field measurements; (b) developing a mathematical half-car model to simulate the dynamic response of the representative car; and (c) determining hump-crossing speeds using the half-car model on the basis of the design peak vertical acceleration criterion.
SELECTION OF DESIGN PEAK VERTICAL ACCELERATION
Determination of 8Sth-Percentile Hump-Crossing Speed
Twenty-eight sites of road humps were selected for analysis. They were all on residential streets or secondary roads having speed limits of 40 km/hr. To ensure that the regular users of each hump were familiar with the hump layout and able to traverse the hump at their selected speeds, only road sections that had speed-control humps installed for more than 1 year were included. As indicated in Table 1, the dimensions of the humps cover a broad range. The geometric parameters of the humps are defined in Figure 2. Different cross-sectional surface profiles were also found in the 28 humps . Some surface profiles could be represented approximately by circular arcs, some had reversed curves toward the two sides, and some appeared triangular with straight side slopes. The surface profiles of all the humps were approximately symmetrical about their crown. These surface profiles were defined by surface elevation measurements made at 50-mm intervals over the hump width.
Hump-crossing speeds of vehicles were computed from measurements of vehicle traveling times over a distance of 10 m. Detectors were placed such that _the centerline of the hump studied was located at the midpoint of the measured distance. Speed surveys were conducted during off-peak periods to avoid platooned traffic conditions so that individual drivers were free to choose their own hump-crossing speeds. At each hump
TABLE I Ranges of Geometric Parameters of Humps Studied
Parameters Hump Height Hump Width ( ~ ) Ratio Cross-sectional H(mm) W(mm) Area (m2)
Minimum 69 1736 0.025 0.044 Range
Maximum 445 4120 0. 136 0.314

68
1- Hump Width W .I FIGURE 2 Geometric parameters of speed-control road hump.
location, speed measurements of at least 35 passenger cars were recorded. The 85th-percentile hump-crossing speed for the hump was then obtained from a cumulative plot of the speed data. Figure 3 shows the cumulative hump-crossing speed graphs plotted from data of six of the humps studied.
Figure 4 plots the 85th-percentile hump-crossing speeds against the width-to-height ratios of humps. No significant relationship could be derived from this plot. This is not surprising, because width-to-height ratio alone does not fully characterize the shape of a hump. Furthermore, as mentioned earlier, the choice of hump-crossing speed by a driver is the result of interaction among hump shape, vehicle characteristics, and driver behavior.
Selection of Representative Car
It is desirable to select as the representative car a model that has characteristics similar to those of the cars driven by most drivers in the traffic stream considered. This helps to ensure that the analysis based on the representative car will correctly reflect the aggregate trend of response by the traffic stream as a whole. Of all the passenger cars included in the humpcrossing speed survey, about 60 percent had engine capacity of between 1300 and 1600 cm3 and about 95 percent were smaller than 2000 cm3 . More than 90 percent of the cars were Japanese-made. A Japanese-made car with a 1500-cm3 (92-in.3) engine capacity was chosen as the representative car. This car had an overall dimension of 1450 mm (4.75 ft) by 4100 mm (13.5 ft)and a wheelbase length of 2450 mm (8 ft).
= =
osL--1.~~:1<:::::......~~~~~~~~~~~~~ .. ~___J,5· 10 15 l1l 2S 30 .. •
HUMP CROSSING SPEED. V I KM/HI
FIGURE 3 Examples of cumulative plots for hump-crossing speeds.
TRANSPORTATION RESEARCH RECORD 1356
0.1' ;;i::
0.12 ;;;: s;;;i."
~ n10 • • ::z: ~ 0.01 • ;;i:: • . • ~
Olli • • ...... ::c Si! • • • • ..... D.01. ::z: ... • • .... • % • = 0.02 ::z:
0 15 20 25 JO
851H PERCENTILE HUMP-CROSSING SPEED. V15 I KM/HI
FIGURE 4 Plotting width-to-height ratio of hump against 85th-percentile hump-crossing speed.
JS
It was front-wheel driven, fitted with radial tires of size 175/70 R13 having tire pressure equal to 200 kPa (29 psi). The unladen vehicle weight was 0.98 tonne (0.96 ton).
Measurement of Peak Vertical Acceleration
Field measurements of peak vertical acceleration during hump crossing were carried out using the representative car. At each of the 28 hump sites, the representative car was driven at the 85th-percentile hump-crossing speed of the hump. Vertical acceleration was measured with an accelerometer secured at the floor of the car beneath driver's seat. Signals of the accelerometer were recorded in a recorder and retrieved subsequently for peak vertical acceleration determination .
Figure 5 shows the frequency distribution of the peak vertical accelerations measured using the representative car at the 28 hump sites. The values of measured acceleration range from 0.43 to 1.08 g, where g is the acceleration of gravity equal to 9.806 m/sec2 (32.2 ft/sec2
). The spread of the measured accelerations is not too much of a surprise if one con-
Mean= 0.74g
0.4g 0.5g 0 fioJ 0.7g O.lg 0.9g 1.0g llg
PEAK VERllCAL ACCELERAllON RECORllO
f Nol• • g is the omterotion of grovity equal to 9 Ml6 m/s2 l
FIGURE 5 Distribution of peak vertical accelerations measured with representative car driving at 85th-percentile speeds of humps.
Fwa and Liaw
siders that (a) discomfort perception varies among drivers; (b) the governing vertical acceleration level is dependent on traffic composition because the dynamic response of vehicles varies with the make and size of cars; and (c) the traveling speeds of vehicles in a road are affected by road geometry (such as roadway width and alignment or presence or absence of vehicles parking along roadside) and types of traffic (e.g., trip purpose and relative proportion of local traffic and bypassing traffic) .
It is interesting to compare the measured results in Figure 5 with the findings of a study conducted by Watts (7) in the United Kingdom. On the basis of measurements using a Mini Clubman Estate car, the following regression model between peak vertical acceleration and discomfort assessment was obtained by Watts:
x = 0.20 + 4.28 aP for 0 ::s x ::s 6, r2 = .69 (1)
where aP is the peak vertical acceleration in units of g and x is the discomfort score rated by test subjects the basis of the following scale: 0 = comfortable, 2 = slightly uncomfortable, 4 = uncomfortable, and 6 = very uncomfortable.
The data in Figure 5 imply that most drivers would not cross a hump faster than a speed that causes a peak vertical acceleration in the region of 0.7 to 0.9 g. According to Equation 1, this acceleration range corresponds to discomfort scores between 3.2 and 4.1, which is in the "uncomfortable" range. The minimum recorded acceleration of 0.43 g corresponds to x = 1.9 or "slightly uncomfortable," whereas the maximum value, 1.08 g, corresponds to x = 4.8, which is between "uncomfortable" and "very uncomfortable. " The distribution of acceleration data in Figure 5 therefore appears to be in good agreement with the findings of the U.K. study.
Peak Vertical Acceleration for Hump Design
Figure 5 offers a basis upon which a peak vertical acceleration can be chosen for hump design. One could fit a theoretical distribution function to the data and recommend a design peak vertical acceleration for a given reliability level. This is not attempted in this study because it is believed further test evidence is required before an appropriate distribution function could be proposed. However, on the basis of the distribution in Figure 5 and the comparison with findings of Watts' work discussed in the preceding section, it appears that the mean value of (ap)esi = 0.74 g would be an acceptable choice. Alternatively, one may opt for (aP) •• , = 0.9 g, which would be conservative about 86 percent of the time. However, this may lead to too low a hump-crossing speed in some circumstances.
Figure 5 indicates that (ap)esi is within 0.6 to 0.9 g in the majority (slightly more than two-thirds) of the cases. The corresponding discomfort scores on Watts' scale are 2.8 and 4.1. An appropriate procedure to ensure that the final design is acceptable in most of the cases would be to design a hump for an (ap). ,, value between 0.6 and 0.9 g and to perform additional checks to determine if the hump-crossing speeds at (ap) •• , equal to 0.6 and 0.9 g, respectively, would still be satisfactory.
ESTIMATING ACCELERATION USING HALF-CAR MODEL
69
Two forms of half-car model have been used in pavement studies to calculate the vertical acceleration and displacement of a vehicle moving on a known road surface profile. One form considers an axle and the left and right wheels of a vehicle, thereby enabling roll motions to be simulated (8; ASTM E1170-87). Another form models the front and real wheels and is able to examine the pitch motions of a vehicle (9-11). Because pitching is the dominant motion mode of a vehicle traversing a hump, the latter form of half-car model is appropriate for this application.
Half-Car Model
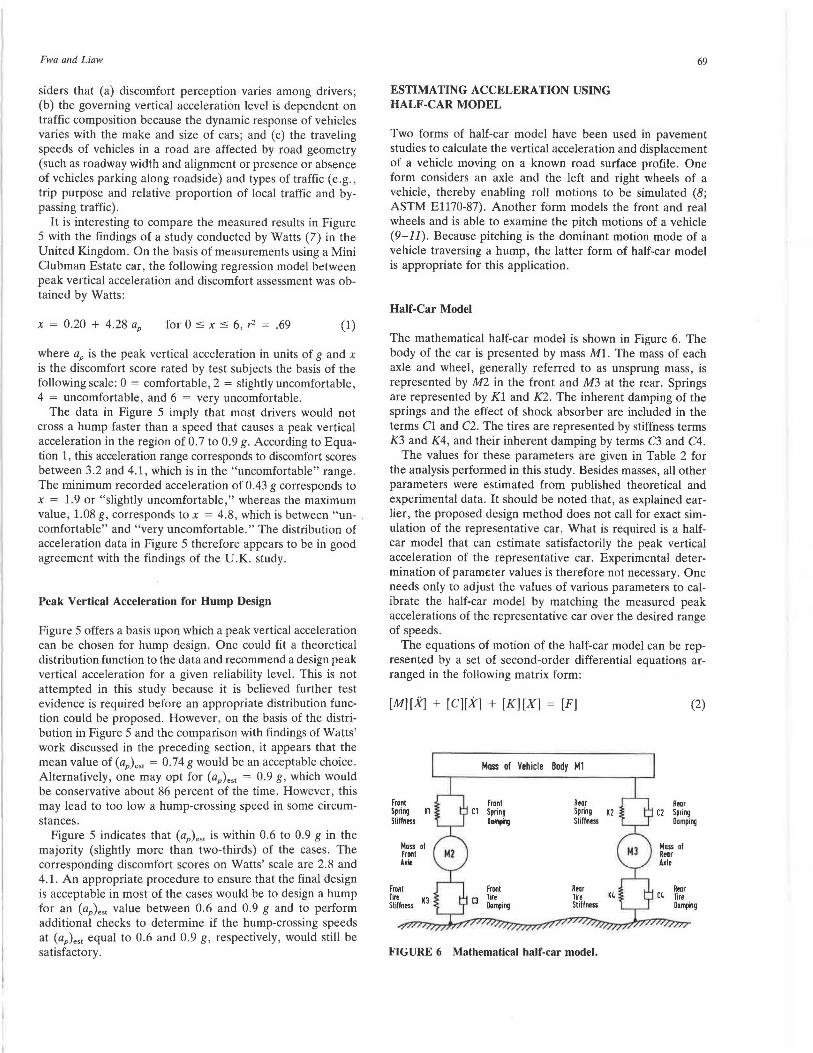
The mathematical half-car model is shown in Figure 6. The body of the car is presented by mass Ml. The mass of each axle and wheel, generally referred to as unsprung mass, is represented by M2 in the front and M3 at the rear. Springs are represented by Kl and K2. The inherent damping of the springs and the effect of shock absorber are included in the terms Cl and C2. The tires are represented by stiffness terms K3 and K4 , and their inherent damping by terms C3 and C4.
The values for these parameters are given in Table 2 for the analysis performed in this study. Besides masses, all other parameters were estimated from published theoretical and experimental data. It should be noted that, as explained earlier, the proposed design method does not call for exact simulation of the representative car. What is required is a halfcar model that can estimate satisfactorily the peak vertical acceleration of the representative car. Experimental determination of parameter values is therefore not necessary. One needs only to adjust the values of various parameters to calibrate the half-car model by matching the measured peak accelerations of the representative car over the desired range of speeds.
The equations of motion of the half-car model can be represented by a set of second-order differential equations arranged in the following matrix form:
[M][XJ + [C][X] + [K][X] = [F]
Front Spring Stiffness
Mass of Front bit
Front lin Stiffness
Mass of Vehicle Body M1
Front Cl Spring
Dampilg
Rear Spring Stiffness
Reor lire Stiffness
FIGURE 6 Mathematical half-car model.
(2)
Reor Spring Dumping
70 TRANSPORTATION RESEARCH RECORD 1356
TABLE 2 Parameter Values for Half-Car Model
Parameter Value
Mass of vehicle body (Ml) 898 kg Mass of front axle (M2l 32 kg Mass of rear axle (M3) 50 kg Front spring stiffness (Kl) 35,000 Nim Front damper viscous damping (Cl) 10,000 Nlmls Rear spring stiffness (K2) 21,000 Nim Rear damper viscous damping (C2) 6,000 Nlmls Front tire stiffness (K3) 214,000 Nim Front tire viscous damping (C3) 0 Rear tire viscous stiffness (K4l 214,000 Nim Rear tire viscous damping (C4) 0
where
[M] diagonal mass matrix, [CJ = damping matrix, [K] = stiffness matrix, [X] = velocity vector, and [X] = acceleration vector.
The wheeltrack profile input is assembled in matrix [F]. Equation 2 is solved by Newmark's method (12) in the time
domain. A detailed description of the formulation and solution of the model has been described by Tan et al. (13). Descriptions of and solutions to other similar half-car models are available in published literature (9-11). Any of these models can be used in the proposed design method.
Estimating (aP).,.
To investigate whether the selected half-car model can be used to provide a satisfactory estimate of (ap)est for hump design, a correlation study was carried out for field measurements of aP of the representatiave car, and aP was computed using the mathematical half-car model. Basically, the study involved measuring the peak vertical acceleration of the representative car in traversing a hump at a preselected speed and comparing it with the peak vertical acceleration obtained from computer analysis of the half-car model. The 28 test humps selected earlier were again used for this study. The field measurement of aP was initially conducted for three speeds: 20, 30, and 40 km/hr. Another speed, 15 km/hr, was subsequently added so that the measurements would cover the entire range of 85th-percentile speeds shown in Figure 4.
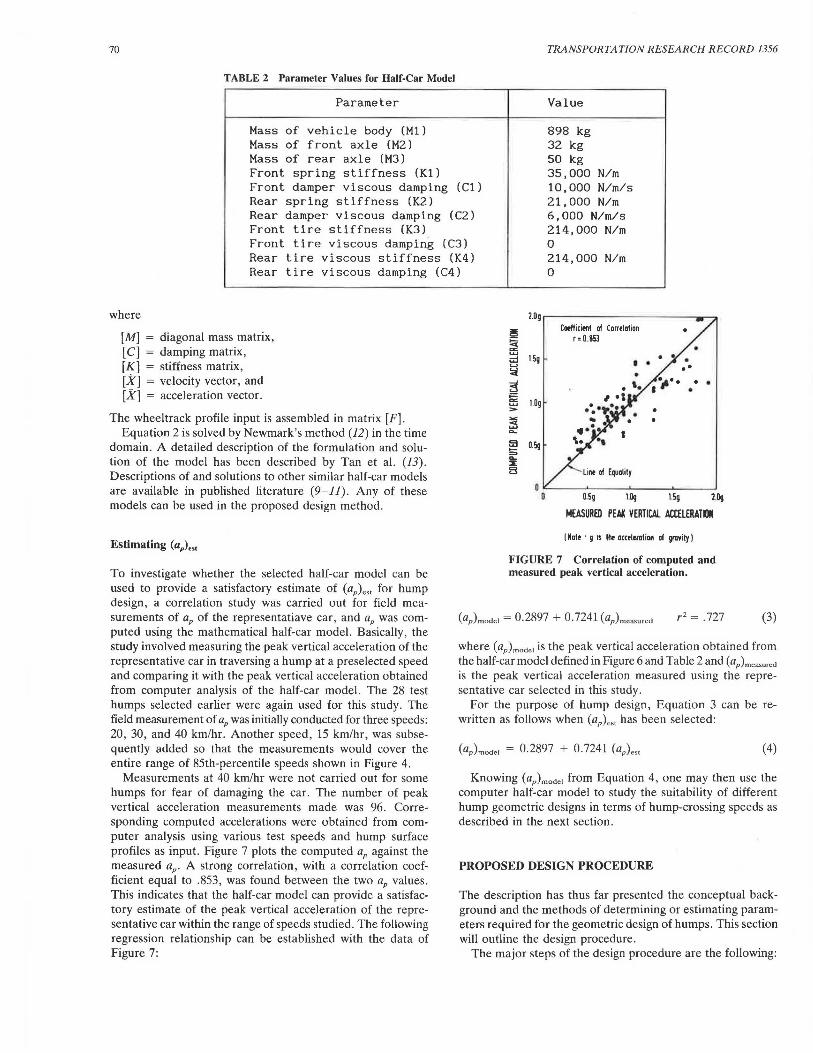
Measurements at 40 km/hr were not carried out for some humps for fear of damaging the car. The number of peak vertical acceleration measurements made was 96. Corresponding computed accelerations were obtained from computer analysis using various test speeds and hump surface profiles as input. Figure 7 plots the computed aP against the measured aP. A strong correlation, with a correlation coefficient equal to .853, was found between the two aP values. This indicates that the half-car model can provide a satisfactory estimate of the peak vertical acceleration of the representative car within the range of speeds studied. The following regression relationship can be established with the data of Figure 7:
2.0g
~ Cotflicient of Correlation
< r = 0.653 a: .....,
1.Sg ;:d
~ ~
. • ;:::: a: 1.0g ...... >
:3 .... fil 0.Sg s .... :x 8
O.Sg 1 Og 15g 2.0g
MEASURED PEA« VERTICAL ACllLERATDI
I Note • g is the acceleration of gravity}
FIGURE 7 Correlation of computed and measured peak vertical acceleration.
r2 = .727 (3)
where (ap)model is the peak vertical acceleration obtained from the half-car model defined in Figure 6 and Table 2 and (ap)measuced is the peak vertical acceleration measured using the representative car selected in this study.
For the purpose of hump design, Equation 3 can be rewritten as follows when (ap)est has been selected:
(4)
Knowing (ap)model from Equation 4, one may then use the computer half-car model to study the suitability of different hump geometric designs in terms of hump-crossing speeds as described in the next section.
PROPOSED DESIGN PROCEDURE
The description has thus far presented the conceptual background and the methods of determining or estimating parameters required for the geometric design of humps. This section will outline the design procedure.
The major steps of the design procedure are the following:

Fwa and Liaw
1. Determine the desired design 85th-percentile humpcrossing speed. This design speed reflects the speed-control requirement for the road section considered. It is determined on the basis of safety considerations for drivers and pedestrians. The overall speed control for a road section is achieved by a coordinated design of hump geometry and hump spacing layout that controls hump-crossing as well as between-hump speeds. As can be seen from Figure 4, the 85th-percentile hump-crossing speeds for common hump dimensions usually fall between 15 and 30 km/hr .
2. Choose a representative car for the traffic stream expected to use the road section concerned. The primary selection criterion is that the hump-crossing response of the selected car, in terms of vertical acceleration, should be similar to the aggregate trend of response of the entire traffic stream.
3. Identify a range of peak vertical acceleration-say, bounded by (ap)esc1 and (ap)es<2-that has a reasonably high probability of including the peak vertical acceleration that governs drivers' choices of hump-crossing speeds. Next, select a design peak vertical acceleration, (ap)em from this range. For this study, the range has been identified as being between 0.6 and 0. 9 g, and the mean peak vertical acceleration of 0. 74 g is considered to be a good choice for design (aP)•"· The relationship between peak vertical acceleration and discomfort assessment derived by Watts (7) can be used as a guide for selecting (ap) .,., (ap)estJ , and (aP).,.2 for design.
4. Calibrate a mathematical half-car model by adjusting model parameters so that the computed peak vertical acceleration will provide a satisfactory estimate of (ap) .,, over a range of speed between, say, 15 and 35 km/hr. A relationship model such as that of Equation 4 may then be established.
5. Convert design values of (ap)em (ap)es11 , and (ap)esiz into corresponding values of (ap)modcl, (ap)modei1, and (ap)modelz using the relation hip established in Step 4.
6. Propose a tri al design of hump geometry. Hump widths between 2 m (6.6 ft) and 4 m (13.1 ft) and hump heights between 70 mm (2.75 in.) and 150 mm (6 in.) are common. Hump cross-sectional surface profiles that are circular or parabolic in shape, with or without reversing curves at the ends, have been used with satisfactory results (1 ,6,14) .
7. Determine, using the computer half-car model, the humpcrossing speeds (say, V, V1 , and V2 ) that produce peak vertical accelerations equal to (ap)m'l<l•I' (a,,)mode lJ, and (ap)mo.i~12 , respectively. Check whether Vis sufficiently close to the de ired design 85th-percentile speed and whether variations in design speed as predicted by V1 and V2 are acceptable. If not, repeat Steps 6 and 7 for a new hump geometry.
EXAMPLE APPLICATION
The proposed design method can be verified against a hump design adopted in the United Kingdom. The hump has a circular cross-sectional surface profile, a width of 3.7 m (12 ft),and a height of 102 mm (4 in .) . This hump design has been road-tested in a number of sites in the United Kingdom ( 4,5 ,14,15). The measured 85th-percentile hump-crossing speeds ranged from 20.1 to 26.3 km/hr. Averaged over nine British sites , the mean 85th-percentile hump-crossing speed was 22.9 km/hr (J).
71
Using the proposed design procedure and the half-car model developed, predictions of 85th-percentile hump-crossing speeds for this hump design can be made on the basis of design data gathered in this study . Let the design ( ap)em ( ap)est1, ( ap)cstz be 0.74 g, 0.6 g, and 0.9 g, respectively. Applying Equation 4, the corresponding (ap)model, (ap)modell, and (ap)model2 are computed to be 0.8255 g, 0.7242 g, and 0.9414 g. Computer analyses using the half-car model show that the expected 85thpercentile hump-crossing speed corresponding to (ap)•" is 23.8 km/hr, and the range of variations corresponding to (ap)esit and (ap) 0512 is from 21.8 to 27.4 km/hr.
The agreement with the reported British data is remarkable, even though the predicted values are generally higher by about 1 km/hr. Although additional verifications and more evidence are needed before the Singapore-based data for speedcontrol hump design are applied in other regions, this example suggests that the design data presented in this paper can be used to provide a useful guide for preliminary designs.
CONCLUSIONS
A rational approach based on the peak vertical accelerations of vehicles has been proposed for the geometric design of speed-control road humps. The 85th-percentile hump-crossing speed of traffic is chosen as the speed-control statistic. The design concept involves the use of a representative car for the purpose of studying the aggregate response of an entire traffic stream. Methods of determining the design 85th-percentile hump-crossing speed and peak vertical accelerations are described. On the basis of the field data collected in this study, it has been suggested that a design peak vertical acceleration of 0. 74 g be used and that the hump design be checked for accelerations equal to 0.6 and 0 .9 g, respectively . The suitability of a geometric design of hump is checked by means of computer analyses using a mathematical half-car model.
Design data have been derived from field measurements made on Singapore roads. The findings on peak vertical acceleration appear to agree well with an earlier work conducted in the United Kingdom on vertical accelerations and human discomfort assessments. An application of the proposed design procedure , using Singapore design data, to a hump design in the United Kingdom has shown good agreement between predicted hump-crossing speeds and the reported measured values from the United Kingdom . The proposed approach provides a rational basis for geometric design of humps, and the limited evidence presented suggests that the design data derived in this study could be used to offer a reasonable first design for general application.
REFERENCES
1. J. P. Clement. Speed Humps and the Thousand Oaks Experience. Traffic Engineering Division, City of Thousand Oaks, California, 1982.
2. J. R. Jarvis. Legal Aspects of Road Humps on Public Roads. Research Report APRB 109. Australian Road Research Board, Victoria, 1980.
3. P. Laitakari and K. Alppivuori. The Effect of a Hump and an Elevated Pedestrian Crossing on Vehicle Comfort and Control. Report 69. Road and Traffic Laboratory, Technical Research Center of Finland, Espoo, 1981.
72
4. R. Summer and C. Baguley. Speed Control Humps in Norwich and Horingey . TRRL Report SR423. U.K. Transport and Road Research Laboratory, Crowthorne, Berkshire, England, 1978.
5. C. BaguJey. Speed Comrol Humps- Further Public Road Trittls . TRRL Report LR 1017. U.K. Transport and Road Research Laboratory, Crow1horne, Berkshire, England, .1981.
6. B. W. Stephens. Road Humps for the 'ontrol of Vehicular Speeds and Traffic Flows. Public Roads, Vol. 50, No. 3, 1986, pp. 82-90.
7. G . R. Watts. Road Humps for the Control of Vehicle Speeds. TRRL Report LR 597. U .K. Transport and Road Research Laboratory, Crowthorne, Berkshire, England, 1973.
8. J. C. Wambold . Road Roughness Effects on Vehicle Dynamics (T. D. Gillespie and M. Sayers, eds). ASTM Special Technical Publication 884 , 1985, pp. 179-196.
9. J. Page. Dynamic Behaviour of a Two Axle Vehicle Suspension System-A Theoretical and Experimental Study . Supplementary Report 119UC. U.K. Transport and Road Research Laboratory, Crowthorne, Berkshire, England, 1974.
10. A. A. A. Molenaar and G. T. Sweere. Road Roughness: Its Evaluation and Effect on Riding Comfort and Pavement Life. In Transportation Research Record 836, 1981. pp. 41-49.
TRANSPORTATION RESEARCH RECORD 1356
11. K. B. Todd and B. T. Kulakowski. Simple Computer Models for Predicting Ride Quality and Pavement Loading for Heavy Trucks. In Transportation Research Record 1215, TRB, National Research Council, Washington, D .C., 1989, pp. 137-150.
12. T. Hughes , Jr. The Finite Element Method: Linear Static and Dynamic Finite Analysis. Prentice-Hall, Inc., New York, N.Y., 1987.
13. L. S. Tan, T. F. Fwa, and C. Y. Liaw. Modelling of Vehicle Response on Highways. Journal of the Institution of Engineers, Vol. 28, No . 1, Singapore, 1990, pp . 49-58.
14. R. Sumner, J . Burton, and C. Baguley. Speed Control Humps in Cuddesdon Way, Cowley, Oxford. TRRL Report SR 350. U .K. Transport and Road Research Laboratory, Crowthorne, Berkshire, England, 1978.
15. R. Sumner and C. Baguley. Speed Control Humps in Kensington and Glasgow. TRRL Report SR 546. U.K. Transport and Road Research Laboratory, Crowthorne, Berkshire, England, 1979.
Publication of this paper sponsored by Committee on Geometric Design.