geometric design guide for canadian roads figure 2.1.4.12 ... · geometric design guide for...
TRANSCRIPT

Geometric Design Guide for Canadian Roads
Page 2.1.vDecember 2009
Figure 2.1.4.12 Examples of Good and Poor Alignment Coordinationand Aesthetics ............................................................................. 2.1.4.15
Figure 2.1.5.1 False Grading and Cross-Slopes .................................................. 2.1.5.3Figure 2.1.5.2 Application of Cross-Slope on Various Types of Roads ................ 2.1.5.4Figure 2.1.5.3 Maximum Algebraic Difference in Pavement
Cross-Slope of Adjacent Traffic Lanes .......................................... 2.1.5.7Figure 2.1.6.1 Schematic of Basic Number of Lanes ........................................... 2.1.6.1Figure 2.1.6.2 Typical Examples of Lane Balance................................................ 2.1.6.3Figure 2.1.6.3 Coordination of Lane Balance and Basic Lanes ........................... 2.1.6.4Figure 2.1.6.4 Typical Express Collector System ................................................. 2.1.6.6Figure 2.1.7.1 Illustration of Route Continuity ....................................................... 2.1.7.2Figure 2.1.7.2 Examples of Lane Continuity ......................................................... 2.1.7.3Figure 2.1.7.3 Types of Weaving Sections ........................................................... 2.1.7.5Figure 2.1.7.4 Solutions for Undesirable Weaving ................................................ 2.1.7.6Figure 2.1.7.5 Method of Measuring Weaving Lengths ......................................... 2.1.7.7Figure 2.1.8.1 Collision Involvement Rate for Trucks ............................................ 2.1.8.2Figure 2.1.8.2 Performance Curves For Heavy Trucks, 120 g/W,
Decelerations & Accelerations ....................................................... 2.1.8.4Figure 2.1.8.3 Performance Curves for Heavy Trucks, 180 g/W,
Decelerations & Accelerations ....................................................... 2.1.8.5Figure 2.1.8.4 Performance Curves for Heavy Trucks, 200 g/W,
Decelerations & Accelerations ....................................................... 2.1.8.6Figure 2.1.8.5 Climbing Lanes Overlapping on Crest Curve .............................. 2.1.8.10Figure 2.1.8.6 Climbing Lane Design Example .................................................. 2.1.8.11Figure 2.1.9.1 Typical Passing Lane Layout ......................................................... 2.1.9.2Figure 2.1.9.2 Typical Traffic Simulation Output of Percent
Following and Correlation with Level of Service ............................ 2.1.9.4Figure 2.1.9.3 Alternative Configurations for Passing Lanes ............................... 2.1.9.5Figure 2.1.10.1 Forces Acting on Vehicle in Motion.............................................. 2.1.10.2Figure 2.1.10.2 Basic Types of Designs of Truck Escape Ramps ........................ 2.1.10.4Figure 2.1.10.3 Typical Layout of Truck Escape Ramp ........................................ 2.1.10.8Figure 2.1.10.4 Typical Cross Section of Truck Escape Ramp ............................ 2.1.10.8

Alignment and Lane Configuration
Page 2.1.iv September 1999

Geometric Design Guide for Canadian Roads
Page 2.1.2.11September 1999
utilized beyond which the lateral friction is keptconstant and superelevation is increased rapidlyto maximum. This form of distribution is referredto as “Method 2” in AASHTO and is used insome urban areas. This method is particularlyadvantageous on low speed urban streetswhere, because of various constraints,superelevation frequently cannot be provided.
Rural & High Speed Urban Applications:Design Domain Quantitative Aids
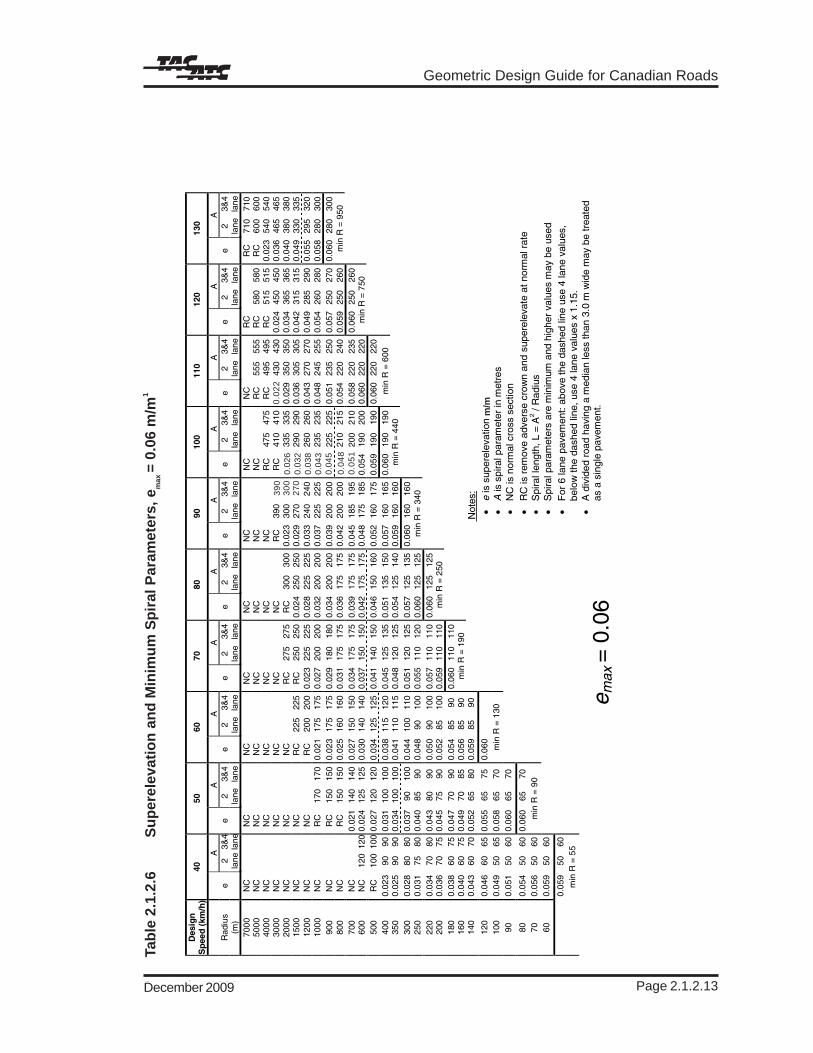
Based on the described distribution method(Method 5), the recommended superelevationrate for various radii from 7000 m to theminimum radius, for each design speed and forsuperelevation rates of 0.04 m/m, 0.06 m/m,and 0.08 m/m have been developed. Alsoincluded are the spiral parameters applicableto rural and high speed urban roadways (spiralparameters will be addressed later in thisSection). These values are illustrated inTables 2.1.2.5 to 2.1.2.7 and are based onrelationships presented in a 1974 publication31.
Urban Roadways: Design DomainTechnical Foundation
Tables 2.1.2.5 to 2.1.2.7 indicating the amountof superelevation for various radii are based onrelatively low lateral friction values whichgive high superelevation rates. Thesesuperelevation rates and spiral parameters areappropriate for rural roadways and higher speedurban roadways where intersections are widelyspaced and access is restricted. For other urbansituations higher rates of superelevation areoften not attainable due to constraints such asaccess requirements, elevations of the adjacentproperties, drainage considerations, the profilesof intersecting streets and limiting slopes onboulevards and sidewalks.
An alternative method for selectingsuperelevation rates under low speed urbandesign conditions is to use higher lateral frictionvalues, thereby reducing the superelevationrequirements. These superelevation rates areillustrated in Figure 2.1.2.4 and generally applyto roadways through intersection areas wheredesign constraints are numerous and limitingsuperelevation offers operational advantagesfor turning or crossing traffic. Drivers are
generally accustomed to using more lateralfriction when manoeuvring throughintersections.
Urban Roadways: Design DomainQuantitative Aids
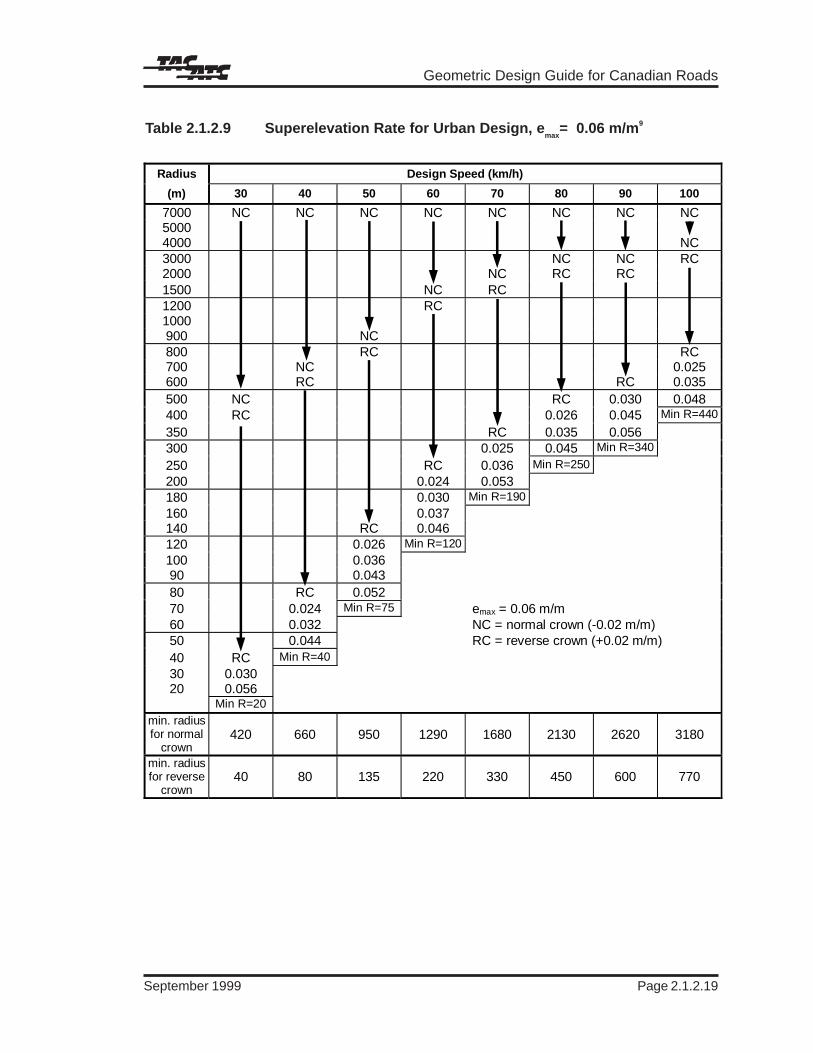
Figure 2.1.2.5 illustrates an alternative methodfor urban use for applying superelevation overa range of radii. This method, for urbanconditions, is based on retaining normal crownuntil a lateral friction factor of 0.05 is required,at which point reverse crown is introduced. Thisfriction factor is approximately equivalent toroadway icing conditions. An assumedoperating speed of 10 km/h above design speedis used in the derivations to introduce the safetyfactor for overdriving or adverse pavementconditions. Figure 2.1.2.5 illustrates thederivation of these values for a design speedof 50 km/h, and maximum superelevationvalues of 0.04 m/m and 0.06 m/m.
For this alternative design method the minimumradius in reverse crown is determined bydistributing the lateral friction coefficients in arate proportional to the inverse of the radius.The linear distribution occurs between thelateral friction coefficient at the inverse of theminimum radius for normal crown, calculatedas noted above, and the maximum lateralfriction coefficient of the inverse of the minimumradius corresponding to full superelevation.Because a unique minimum radius correspondsto each of the two full superelevation rates,+0.04 m/m and +0.06 m/m, the proportionaldistribution produces different values forminimum radius at reverse crown.
This alternative method provides superelevationrates between the rural and urban high speedvalues, and the low speed urban valuesdescribed earlier. Table 2.1.2.4, Table 2.1.2.8and Table 2.1.2.9 reflect this alternative designmethod for selecting superelevations over arange of radii from 20 m to 7000 m. Thisprovides the designer with a consistent meansof selecting superelevation applicable to mosturban conditions. Table 2.1.2.4 was discussedearlier under minimum radius, and Tables2.1.2.8 and 2.1.2.9 provide superelevation ratesfor varying speeds and radii using the urbanmethod described above. Table 2.1.2.8 is for

Alignment and Lane Configuration
Page 2.1.2.12 December 2009
Tab
le 2
.1.2
.5S
up
erel
evat
ion
an
d M
inim
um
Sp
iral
Par
amet
ers,
em
ax=
0.04
m/m
1
Des
ign
Sp
eed
(km
/h)
4050
6070
8090
100
AA
AA
AA
A
Rad
ius
e2
4e
24
e2
4e
24
e2
4e
24
e2
4(m
)la
nela
nela
nela
nela
nela
nela
nela
nela
nela
nela
nela
nela
nela
ne70
00N
CN
CN
CN
CN
CN
CN
C50
00N
CN
CN
CN
CN
CN
CN
C40
00N
CN
CN
CN
CN
CN
CN
C30
00N
CN
CN
CN
CN
CN
CR
C41
041
020
00N
CN
CN
CN
CR
C30
030
0R
C31
531
5R
C33
533
515
00N
CN
CN
CR
C24
024
0R
C26
026
0R
C27
527
50.
022
290
290
1200
NC
NC
NC
RC
215
215
RC
230
230
0.02
124
524
50.
026
260
260
1000
NC
NC
RC
180
180
RC
200
200
0.02
021
021
00.
025
225
225
0.03
023
523
590
0N
CN
CR
C17
517
5R
C19
019
00.
021
200
200
0.02
721
021
00.
032
225
225
800
NC
NC
RC
165
165
RC
180
180
0.02
319
019
00.
029
200
200
0.03
421
021
070
0N
CR
C14
014
0R
C15
015
00.
020
165
165
0.02
617
517
50.
032
185
185
0.03
620
020
060
0N
CR
C13
013
0R
C14
014
00.
023
155
155
0.02
916
516
50.
035
175
175
0.03
919
019
050
0N
CR
C12
012
00.
021
130
130
0.02
614
014
00.
033
150
150
0.03
816
016
00.
040
190
190
400
RC
9595
RC
105
105
0.02
511
511
50.
031
125
125
0.03
713
513
50.
040
160
160
0.04
019
019
035
0R
C90
900.
020
100
100
0.02
711
011
00.
033
120
120
0.03
913
513
50.
040
160
160
min
R=
490
300
RC
8080
0.02
390
900.
031
100
100
0.03
611
011
00.
040
135
135
min
R=
380
250
RC
7575
0.02
685
850.
034
9090
0.03
811
011
00.
040
135
135
220
RC
7070
0.02
980
800.
036
9090
0.03
911
011
0m
inR
=28
020
00.
021
6565
0.03
175
750.
038
9090
0.04
011
011
018
00.
023
6565
0.03
370
700.
039
9090
0.04
011
011
016
00.
025
6060
0.03
570
700.
040
9090
min
R=
200
140
0.02
855
550.
037
7070
0.04
090
90N
otes
:12
00.
031
5055
0.03
970
70m
inR
=15
0•
eis
supe
rele
vatio
n10
00.
034
5050
0.04
070
70•
Ais
spira
lpar
amet
erin
met
res
900.
036
5050
0.04
070
70•
NC
isno
rmal
cros
sse
ctio
n80
0.03
850
50m
inR
=10
0•
RC
isre
mov
ead
vers
ecr
own
and
supe
rele
vate
atno
rmal
rate
700.
040
5050
•S
pira
llen
gth,
L=
A2
/Rad
ius
600.
040
5050
•S
pira
lpar
amet
ers
are
min
imum
and
high
erva
lues
may
beus
ed0.
040
5050
•F
or6
lane
pave
men
t:ab
ove
the
dash
edlin
eus
e4
lane
valu
es,
min
R=
60•
belo
wth
eda
shed
line,
use
4la
neva
lues
x1.
15.
e max
=0.
04•
Adi
vide
dro
adha
ving
am
edia
nle
ssth
an3
mw
ide
may
betr
eate
das
asi
ngle
pave
men
t.
Not
es:
• e
is
supe
rele
vatio
n, m
/m•
A is
spi
ral p
aram
eter
in m
etre
s•
NC
is n
orm
al c
ross
sec
tion
• R
C is
rem
ove
adve
rse
crow
n an
d su
pere
leva
te a
t no
rmal
rat
e•
Spi
ral l
engt
h, L
= A
2 / R
adiu
s•
Spi
ral p
aram
eter
s ar
e m
inim
um a
nd h
ighe
r va
lues
by
be u
sed
• F
or 6
lane
pav
emen
t: ab
ove
the
dash
ed li
ne u
se 4
lane
val
ues,
belo
w t
he d
ashe
d lin
e, u
se 4
lane
val
ues
x 1.
15.
• A
div
ided
roa
d ha
ving
a m
edia
n le
ss t
han
3.0
m w
ide
may
be
trea
ted
as a
sin
gle
pave
men
t.
Geometric Design Guide for Canadian Roads
Page 2.1.2.13September 1999
Des
ign
Sp
eed
(km
/h)
4050
6070
8090
100
110
120
130
AA
AA
AA
AA
AA
Rad
ius
e2
3&4
e2
3&4
e2
3&4
e2
3&4
e2
3&4
e2
3&4
e2
3&4
e2
3&4
e2
3&4
e2
3&4
(m)
lane
lane
lane
lane
lane
lane
lane
lane
lane
lane
lane
lane
lane
lane
lane
lane
lane
lane
lane
lane
7000
NC
NC
NC
NC
NC
NC
NC
NC
RC
RC
710
710
5000
NC
NC
NC
NC
NC
NC
NC
RC
555
555
RC
580
580
RC
600
600
4000
NC
NC
NC
NC
NC
NC
RC
475
475
RC
495
495
RC
515
515
0.02
354
054
030
00N
CN
CN
CN
CN
CR
C39
040
0R
C41
041
00.
020
430
430
0.02
445
045
00.
036
465
465
2000
NC
NC
NC
RC
275
275
RC
300
300
0.02
330
035
00.
022
335
335
0.02
935
035
00.
034
365
365
0.04
038
038
015
00N
CN
CR
C22
522
5R
C25
025
00.
024
250
250
0.02
927
027
50.
029
290
290
0.03
630
530
50.
042
315
315
0.04
933
033
512
00N
CN
CR
C20
020
00.
023
225
225
0.02
822
522
50.
033
240
240
0.03
426
026
00.
043
270
270
0.04
928
529
00.
055
295
320
1000
NC
RC
170
170
0.02
117
517
50.
027
200
200
0.03
220
020
00.
037
225
225
0.04
023
523
50.
048
245
255
0.05
426
028
00.
058
280
300
900
NC
RC
150
150
0.02
317
517
50.
029
180
180
0.03
420
020
00.
039
200
200
0.04
322
522
50.
051
235
250
0.05
725
027
00.
060
280
300
800
NC
RC
150
150
0.02
516
016
00.
031
175
175
0.03
617
517
50.
042
200
200
0.04
621
021
50.
054
220
240
0.05
925
026
0m
inR
=95
070
0N
C0.
021
140
140
0.02
715
015
00.
034
175
175
0.03
917
517
50.
045
185
195
0.05
020
021
00.
058
220
235
0.06
025
026
060
0N
C12
012
00.
024
125
125
0.03
014
014
00.
037
150
150
0.04
217
517
50.
048
175
185
0.05
419
020
00.
060
220
220
min
R=
750
500
RC
100
100
0.02
712
012
00.
034
125
125
0.04
114
015
00.
046
150
160
0.05
216
017
50.
059
190
190
0.06
022
022
040
00.
023
9090
0.03
110
010
00.
038
115
120
0.04
512
513
50.
051
135
150
0.05
716
016
50.
060
190
190
min
R=
600
350
0.02
590
900.
034
100
100
0.04
111
011
50.
048
120
125
0.05
412
514
00.
059
160
160
min
R=
440
300
0.02
880
800.
037
9010
00.
044
100
110
0.05
112
012
50.
057
125
135
0.06
016
016
025
00.
031
7580
0.04
085
900.
048
9010
00.
055
110
120
0.06
012
512
5m
inR
=34
022
00.
034
7080
0.04
380
900.
050
9010
00.
057
110
110
0.06
012
512
520
00.
036
7075
0.04
575
900.
052
8510
00.
059
110
110
min
R=
250
180
0.03
860
750.
047
7090
0.05
485
900.
060
110
110
160
0.04
060
750.
049
7085
0.05
685
90m
inR
=19
014
00.
043
6070
0.05
265
800.
059
8590
Not
es:
120
0.04
660
650.
055
6575
0.06
0•
eis
supe
rele
vatio
n10
00.
049
5065
0.05
865
70m
inR
=13
0•
Ais
spira
lpar
amet
erin
met
res
900.
051
5060
0.06
065
70•
NC
isno
rmal
cros
sse
ctio
n80
0.05
450
600.
060
6570
•R
Cis
rem
ove
adve
rse
crow
nan
dsu
pere
leva
teat
norm
alra
te70
0.05
650
60m
inR
=90
•S
pira
llen
gth,
L=
A2
/Rad
ius
600.
059
5060
•S
pira
lpar
amet
ers
are
min
imum
and
high
erva
lues
may
beus
ed0.
059
5060
•F
or6
lane
pave
men
t:ab
ove
the
dash
edlin
eus
e4
lane
valu
es,
min
R=
55•
belo
wth
eda
shed
line,
use
4la
neva
lues
x1.
15.
e max
=0.
06•
Adi
vide
dro
adha
ving
am
edia
nle
ssth
an3.
0m
wid
em
aybe
trea
ted
asa
sing
lepa
vem
ent.
39
03
00
27
00
.02
60
.03
20
.03
80
.04
30
.04
5
0.0
48
0.0
51
December 2009
m/m0
.02
2
Tab
le 2
.1.2
.6S
up
erel
evat
ion
an
d M
inim
um
Sp
iral
Par
amet
ers,
em
ax =
0.0
6 m
/m1

Alignment and Lane Configuration
Page 2.1.2.14 December 2009
Des
ign
(Sp
eed
km/h
)40
5060
7080
9010
011
012
013
0
AA
AA
AA
AA
AA
Rad
ius
e2
3&4
e2
3&4
e2
3&4
e2
3&4
e2
3&4
e2
3&4
e2
3&4
e2
3&4
e2
3&4
e2
3&4
(m)
lane
lane
lane
lane
lane
lane
lane
lane
lane
lane
lane
lane
lane
lane
lane
lane
lane
lane
lane
lane
7000
NC
NC
NC
NC
NC
NC
NC
RC
RC
RC
710
710
5000
NC
NC
NC
NC
NC
NC
RC
RC
555
555
RC
580
580
0.02
160
060
040
00N
CN
CN
CN
CN
CN
CR
C48
048
0R
C49
549
50.
021
515
515
0.02
654
054
030
00N
CN
CN
CN
CN
CR
C39
040
0R
C41
041
00.
023
430
430
0.02
845
045
00.
033
465
465
2000
NC
NC
NC
RC
270
275
0.02
130
030
00.
026
300
300
0.02
633
533
50.
033
350
350
0.04
036
536
50.
047
380
380
1500
NC
NC
RC
225
225
0.02
125
526
00.
027
250
250
0.03
227
027
50.
033
290
290
0.04
230
530
50.
050
315
330
0.05
833
036
512
00N
CN
CR
C20
020
00.
026
220
225
0.03
222
522
50.
038
240
240
0.04
026
026
00.
050
270
285
0.05
928
532
00.
067
295
350
1000
NC
RC
170
170
0.02
317
517
50.
029
200
200
0.03
620
020
00.
043
225
225
0.04
724
024
00.
057
250
280
0.06
626
031
00.
074
280
340
900
NC
RC
150
150
0.02
517
517
50.
032
180
180
0.03
920
020
00.
046
200
220
0.05
122
524
00.
062
235
275
0.07
125
030
00.
078
280
330
800
NC
0.02
015
015
00.
027
160
160
0.03
517
517
50.
042
175
195
0.04
920
022
00.
055
210
235
0.06
622
027
00.
075
250
295
0.08
028
033
070
0N
C0.
023
140
140
0.03
015
015
00.
038
165
165
0.04
617
519
00.
053
185
200
0.06
120
023
00.
072
220
260
0.07
925
028
50.
080
280
300
600
RC
120
120
0.02
612
512
50.
034
140
140
0.04
215
016
00.
050
165
185
0.05
817
520
00.
067
190
225
0.77
220
250
0.08
025
028
5m
inR
=83
050
00.
021
100
100
0.03
012
012
00.
039
125
135
0.04
814
015
00.
056
150
175
0.06
416
020
00.
073
190
215
0.80
220
250
min
R=
670
400
0.02
590
900.
035
100
110
0.04
511
512
50.
054
125
150
0.06
313
516
50.
071
160
185
0.08
019
020
0m
inR
=53
035
00.
028
9090
0.03
810
010
50.
049
110
125
0.05
812
015
00.
067
125
160
0.07
516
017
50.
080
190
200
300
0.03
180
900.
042
9010
00.
053
100
120
0.06
312
014
00.
072
125
150
0.08
016
017
5m
inR
=39
025
00.
035
7585
0.04
785
100
0.05
910
012
00.
069
110
135
0.07
812
515
00.
080
160
175
220
0.03
970
800.
051
8010
00.
062
9511
00.
073
110
125
0.08
012
515
0m
inR
=30
020
00.
041
7080
0.05
480
100
0.06
590
110
0.07
511
012
5m
inR
=23
018
00.
044
6580
0.05
775
950.
068
9010
50.
078
110
120
160
0.04
765
800.
060
7590
0.07
285
100
0.08
011
012
014
00.
051
6575
0.06
470
900.
076
8510
0m
inR
=17
0N
otes
:12
00.
055
6075
0.06
970
850.
080
8595
•e
issu
pere
leva
tion
100
0.06
155
700.
074
6580
0.08
085
95•
Ais
spira
lpar
amet
erin
met
res
900.
064
5570
0.07
765
80m
inR
=12
0•
NC
isno
rmal
cros
sse
ctio
n80
0.06
755
650.
080
6575
•R
Cis
rem
ove
adve
rse
crow
nan
dsu
pere
leva
teat
norm
alra
te70
0.07
150
600.
080
6575
•S
pira
llen
gth,
L=
A2
/Rad
ius
600.
075
5060
min
R=
80•
Spi
ralp
aram
eter
sar
em
inim
uman
dhi
gher
valu
esm
aybe
used
500.
080
5060
•F
or6
lane
pave
men
t:ab
ove
the
dash
edlin
eus
e4
lane
valu
es,
0.08
050
60•
belo
wth
eda
shed
line,
use
4la
neva
lues
x1.
15.
min
R=
50
max
•A
divi
ded
road
havi
nga
med
ian
less
than
3.0
mw
ide
may
betr
eate
das
asi
ngle
pave
men
t.
No
tes:
• e
is
supe
rele
vatio
n, m
/m•
A is
spi
ral p
aram
eter
in m
etre
s•
NC
is
norm
al c
ross
sec
tion
• R
C is
rem
ove
adve
rse
crow
n an
d su
pere
leva
te a
t no
rmal
rat
e•
Spi
ral l
engt
h, L
= A
2 / R
adiu
s•
Spi
ral p
aram
eter
s ar
e m
inim
um a
nd h
ighe
r va
lues
by
be u
sed
• F
or 6
lane
pav
emen
t: a
bove
the
das
hed
line
use
4 la
ne v
alue
s,
be
low
the
das
hed
line,
use
4 la
ne v
alue
s x
1.15
.•
A d
ivid
ed r
oad
havi
ng a
med
ian
less
tha
n 3.
0 m
wid
e m
ay b
e
tr
eate
d as
a s
ingl
e pa
vem
ent.
27
02
70
27
02
70
27
02
55
25
52
55
25
52
55
22
02
20
22
02
20
22
0
Tab
le 2
.1.2
.7S
up
erel
evat
ion
an
d M
inim
um
Sp
iral
Par
amet
ers,
em
ax=
0.0
8 m
/m1
Geometric Design Guide for Canadian Roads
Page 2.1.2.19September 1999
Table 2.1.2.9 Superelevation Rate for Urban Design, emax
= 0.06 m/m9
Radius Design Speed (km/h)
(m) 30 40 50 60 70 80 90 100
7000 NC NC NC NC NC NC NC NC50004000 NC3000 NC NC RC2000 NC RC RC1500 NC RC1200 RC1000900 NC800 RC RC700 NC 0.025600 RC RC 0.035500 NC RC 0.030 0.048400 RC 0.026 0.045 Min R=440
350 RC 0.035 0.056300 0.025 0.045 Min R=340
250 RC 0.036 Min R=250
200 0.024 0.053180 0.030 Min R=190
160 0.037140 RC 0.046120 0.026 Min R=120
100 0.03690 0.04380 RC 0.05270 0.024 Min R=75 emax = 0.06 m/m60 0.032 NC = normal crown (-0.02 m/m)50 0.044 RC = reverse crown (+0.02 m/m)40 RC Min R=40
30 0.03020 0.056
Min R=20
min. radiusfor normal
crown420 660 950 1290 1680 2130 2620 3180
min. radiusfor reverse
crown40 80 135 220 330 450 600 770

Alignment and Lane Configuration
Page 2.1.2.20 December 2009
On tight horizontal curves, stopping sightdistances may need to be increased tocompensate for increased braking distancescaused by lateral friction effects.
Design Domain Quantitative Aids:Stopping Sight Distance on HorizontalCurves
Table 2.1.2.10 shows the stopping sightdistance while braking on a minimum radiuscurve. Values are provided for the higher andlower limits for each of the three values ofmaximum superelevation. Also included forcomparison purposes are the normal stoppingsight distances from Table 1.2.5.3.
The results of the calculations for stopping sightdistance on minimum radius curves indicatesthat there is a large variance in the amount ofincrease for the various conditions.
1. The increase in stopping sight distancebased on the lower range of assumedoperating speeds (left columns in Table2.1.2.10) vary from 0.3% to 4.2%.
2. The increase in stopping sight distancebased on the upper range of assumedoperating speeds (right columns in Table2.1.2.10) vary from 3.2% to 8.8%.
Because of the variance, providing specificadjustments for radii other than minimum isdifficult. Suggested approximate adjustmentsare:
• for the lower range of assumed operatingspeeds from 40 km/h to 80 km/h and forhorizontal curves not exceeding 110% ofthe minimum radius curve, the stoppingsight distance in Table 1.2.5.3 should beincreased by 3.0%
• for the higher range of assumed operatingspeeds from 40 km/h to 120 km/h and forhorizontal curves not exceeding 110% ofthe minimum radius curve, the stoppingsight distance in Table 1.2.5.3 should beincreased by 5.5%
If adjustments that are more precise thanoutlined above are required, the designer shoulduse the formulae provided in this Section.
2.1.2.3 Spiral Curves
Introduction
A spiral curve is a curve with a constantly varyingradius. The purpose of a spiral curve is toprovide smooth transition and a natural drivingpath between a tangent and a circular curve.
Table 2.1.2.10 Calculated Stopping Sight Distance on Minimum Radius Curves
Design Assumed Normal Stopping Calculated Stopping Sign Distance onSpeed Operating Sight Distance Minimum Radius Curves (m)(km/h) Speed (km/h) Table 1.2.5.3 (m) e = 0.04 e = 0.06 e = 0.08
40 40 45 46 46 4650 47-50 60-65 60-66 60-66 60-6660 55-60 75-85 77-90 77-90 77-9070 63-70 95-110 98-120 97-120 97-12080 70-80 115-140 117-152 116-152 116-15190 77-90 130-170 135-180 134-180 134-181
100 85-100 160-210 161-219 160-218 160-219110 91-110 180-250 181-259 181-259120 98-120 200-290 205-302 204-301130 105-130 230-330 229-338 229-338

Geometric Design Guide for Canadian Roads
Page 2.1.2.21September 1999
Because spiral curves provide a natural path forthe motorist to follow, centrifugal forces increaseand decrease gradually as the vehicle entersand leaves the circular portion of the curve. Thisminimizes encroachment upon adjoining trafficlanes, promotes speed uniformity, and increasessafety.
A spiral curve provides a convenient and desirablearrangement for developing superelevation runoff.A change from normal crown to a fullysuperelevated cross section is applied along thespiral curve length. Where the pavement sectionis widened around a circular curve, the spiralfacilitates the transition width. Spiral curves alsoenhance the roadway appearance because thereare no noticeable breaks in the alignment.
On rural roads, spiral curves should be utilizedon new construction if the circular curves aresuperelevated. Some exceptions can be madewith curves substantially flatter than theminimum required for the design speed. Also,when appropriate, simple curves may be usedon existing paved roads to avoid the need tomake minor realignments.
On urban roads, the incorporation of spiralcurves into horizontal main line alignmentdesign is normally limited to major arterials,expressways and freeways, where higherdesign speeds are used. Spiral curves aretypically only applied to roadways with designspeeds of 70 km/h and higher, and wheresuperelevation of the circular curves isdesirable. Spiral curves are also used in thedesign of interchange ramps. Where theseroadway facilities have curbs, the use of spiralcurves allows vehicles to negotiate thealignment at a constant offset from the curb,thus increasing driver comfort. For low speedurban design and retrofit situations, spiralcurves are not typically used.
Overview: Technical Foundation
The spiral form most commonly used for roaddesign is the clothoid, which, expressedmathematically, has the relationship where Rvaries with the reciprocal of L, where R is the
radius of curve at a distance L from the beginningof spiral ( Rα 1/L ).
A2 = RL (2.1.8)
Where A is a constant called the spiralparameter and has units of length.
All clothoid spirals are the same shape and varyonly in their size. The spiral parameter is ameasure of the flatness of the spiral, the largerthe parameter the flatter the spiral.
A spiral curve in which one end of the spiralhas a radius of infinity is referred to as a simplespiral and one in which the radii at both endsare less than infinity is referred to as asegmental spiral. An example of a segmentalspiral is a spiral between two circular curves ofdifferent radii but in the same direction. A simplespiral is designated by its parameter and its endradius. A segmental spiral is designated by itsparameter and its two end radii.
The Spiral Parameter: Technical Foundation
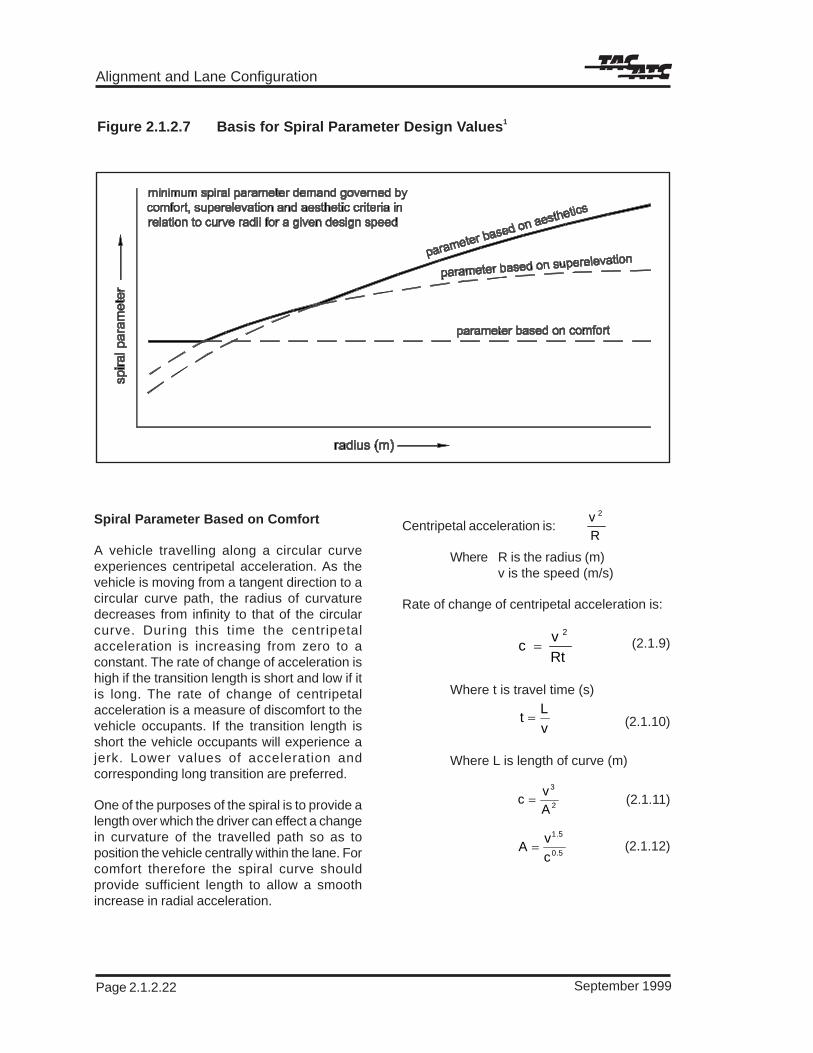
Spiral parameters can be developed based onthree criteria:
• the maximum permissible rate of changeof centripetal acceleration (whichexpresses comfort)
• superelevation runoff
• aesthetics
Figure 2.1.2.7 illustrates the conceptual resultsof these means of deriving the spiral parameter,and the basis for each of these methodologiesis discussed in depth following this Figure.
The minimum spiral requirement for design isthe highest of the three values and for thesmaller radii the comfort criterion controls, forthe next larger set of radii the relative slopecriterion controls, and for the larger radii theaesthetic criterion controls.
Alignment and Lane Configuration
Page 2.1.2.22 September 1999
Spiral Parameter Based on Comfort
A vehicle travelling along a circular curveexperiences centripetal acceleration. As thevehicle is moving from a tangent direction to acircular curve path, the radius of curvaturedecreases from infinity to that of the circularcurve. During this time the centripetalacceleration is increasing from zero to aconstant. The rate of change of acceleration ishigh if the transition length is short and low if itis long. The rate of change of centripetalacceleration is a measure of discomfort to thevehicle occupants. If the transition length isshort the vehicle occupants will experience ajerk. Lower values of acceleration andcorresponding long transition are preferred.
One of the purposes of the spiral is to provide alength over which the driver can effect a changein curvature of the travelled path so as toposition the vehicle centrally within the lane. Forcomfort therefore the spiral curve shouldprovide sufficient length to allow a smoothincrease in radial acceleration.
Centripetal acceleration is:
Where R is the radius (m)v is the speed (m/s)
Rate of change of centripetal acceleration is:
(2.1.9)
Where t is travel time (s)
(2.1.10)
Where L is length of curve (m)
(2.1.11)
(2.1.12)
Figure 2.1.2.7 Basis for Spiral Parameter Design Values1
Rt
vc
2
=
v
Lt =
2
3
A
vc =
5.0
5.1
c
vA =
R
v 2

Geometric Design Guide for Canadian Roads
Page 2.1.2.23September 1999
If A is stated in metres, speed v in kilometresper hour and c in metres per second cubed, theexpression becomes:
(2.1.13)
Tolerable rate of change of centripetalacceleration varies between drivers. As a basisof design, the value used to provide minimumacceptable comfort is 0.6 m/s3. The expressionthen becomes:
(2.1.14)
(2.1.15)
Using the above expression, the minimum spiralparameter based on comfort can be calculatedfor each design speed. It may be noted that thespiral parameter is independent of the radius.This is illustrated in Figure 2.1.2.7 by the comfortline parallel to the abscissa.
Spiral Parameter Based onRelative Slope
For superelevation runoff, the relative slope isdefined as the slope of the outer edge of apavement in relation to the profile control line.The maximum permissible value varies withdesign speed, and is shown in Table 2.1.2.11.
The minimum length of transition, l , is given bythe equation
(2.1.16)
Where w = the width of pavement inmetres
e = the superelevation beingdeveloped in metres per metre
s = the superelevation runoff,percentage
l = measured in metres
Table 2.1.2.11 Maximum RelativeSlope BetweenOuter Edge ofPavement andCentreline ofTwo-Lane Roadways
Design Speed Relative Slope(km/h) (%)
40 0.7050 0.6560 0.6070 0.5580 0.5190 0.47100 0.44110 0.41120 0.38130 0.36
For a given speed and radius, superelevation andrelative slope are known and minimum lengthscan be calculated. From minimum length andradius, the minimum spiral parameter can becalculated, using the expression:
5.0
5.1
c
V1464.0A =
5.1V189.0A =
s2
we100=l
A2 = RL (2.1.17)
Spiral Parameter Based on Aesthetics
Short spiral transition curves are visuallyunpleasant. It is generally accepted that thelength of a transition curve should be such thatthe driving time is at least 2 s. For a given radiusand speed, therefore, the minimum length andminimum spiral parameter can be calculatedusing the expression:
A2 = 0.56RV (2.1.18)
Spiral Parameter: Design Domain QuantitativeAids
Quantitative expressions of the design domainfor the spiral parameter are given inTables 2.1.2.5, 2.1.2.6 and 2.1.2.7 inSubsection 2.1.2.2 for a range of design speeds.Designers should note the following applicationheuristics in using these tables.
0.1464V1.5
0.60.5A =

Alignment and Lane Configuration
Page 2.1.2.24 June 2009
1. For any particular design speed and radius,the highest value of spiral parameter asdetermined by the methodologiesdiscussed in the previous section are usedfor these calculations.
2. The design values in the tables areminimum and higher values should be usedwherever possible in the interests of safety,comfort and aesthetics.
3. In design it is convenient to select valuesso that the radius is a standard value andA/R is a rational number as this permitsspiral properties to be read directly fromtables33.
Spiral Parameter: Design Domain ApplicationHeuristics
The application of spiral curves in horizontalalignment is a complex design problem that hasmany variations. A number of design domainapplication heuristics dealing with some of themore common instances are provided below.
1. A circular curve with simple spirals at bothends each having the same parametervalue is referred to as a symmetrical curve.This condition represents the mostcommon practice for spiraled curves.
2. Unsymmetrical curves are common atinterchange ramps and loops and representthe case noted in #1 above, but withdifferent parameter values for the spiralsat each end.
3. Successive circular curves with different radiibut in the same direction are best joined bya spiral curve. Where this occurs, the “joiningspiral” is referred to as a segmental spiral.The minimum spiral parameter to be usedis found by referring to Tables 2.1.2.5, 2.1.2.6and 2.1.2.7 and using the smaller of the tworadii.
4. In some instances, successive circularcurves with different radii may connectdirectly to one another if the difference in
radii is not too large. See Subsection 2.1.2.6for additional guidance in this regard.
5. Circular, non-successive curves in the samedirection joined by a short length of tangentshould normally be joined instead by a spiral.The use of tangents to achieve suchconnections results in what is commonlyreferred to as a “broken back” curve. It isonly justified when some otherconsideration, for example, propertyconstraints or construction cost, outweighsthe visual disadvantages. The term “shorttangent” is very subjective and there areseveral definitions for this term. Onesuggests that a short tangent length maybe regarded as one which allows a driveron the first curve to see at least some partof the following curve. Another definitionsuggests a broken back curve occurs whenthe tangent length (m) is less than fourtimes the design speed. If possible a moredesirable solution to a broken back curveis to eliminate the short tangent and insertan appropriate circular curve or better yeta segmental spiral curve.
6. A change of direction from one tangent toanother may be accomplished bysuccessive spiral curves without a length ofcircular curve between them. Such atransition curve is referred to as symmetricalwhere the two spiral parameters are thesame, and unsymmetrical where they aredifferent. The minimum permissible spiralparameter to be used in such a situation isthe minimum for the design as shown inTables 2.1.2.5, 2.1.2.6 and 2.1.2.7.
7. A reversal in curvature direction may beaccomplished through successive simplespiral curves without a length of tangentbetween them. The spiral parameters shouldbe at least the minimum for the designspeed. However, the alignment will have animproved appearance if the minimum spiralparameter values are exceeded or if alength of tangent is inserted between thetwo spirals. Superelevation is applied as

Geometric Design Guide for Canadian Roads
Page 2.1.2.45December 2009
To illustrate the use of equations 2.1.20 and2.1.21, consider a curve with R = 0.35 km thatis between tangents that are 0.9 km long andwhich intersect at a deflection angle of 120o
(2.09 radians). The roadway is 11.2 m wide andhas spiral transition curves. What would be thesafety consequences of increasing the radiusto 0.437 km2.
In equation 2.1.20, the parameter 0.96 appliesto collisions/million vehicle km on a straightsection. Therefore, on the two tangents weexpect 2 x 0.9 x 0.96 = 1.73 collisions/millionvehicles. The length of the curve is 0.35 x 2.09= 0.732 km. On the curve one may expect (0.96x 0.732 + 0.0245/0.35 - 0.012) x 0.97837-30 = 0.65collisions/million vehicles. The correction factorfor tangent length is e-(0.62 - 1.2x0.35) x (1.2 - 0.9) = 0.94.Thus, with a 0.35 km radius curve one shouldexpect 1.73 + 0.65 x 0.94 = 2.34 collisions/million vehicles.
Suppose now that a curve with R = 0.437 km isconsidered for the same conditions. The largerradius implies a longer curve and shortertangents. Each tangent length is reduced by(0.437-0.35) x tan (2.09/2) = 0.15 km. Thus, onthe two tangents one expects 2 x (0.9 - 0.15) x0.96 = 1.44 collisions/million vehicles. Thelength of the curve is now 0.437 x 2.09 =0.913 km and with long tangents one mayexpect on it (0.96 x 0.913 + 0.0245/0.437 -0.012) x 0.97837-30 = 0.8 collisions/millionvehicles. The correction factor now ise-(0.62 – 1.2 x 0.437) x (1.2 - 0.75) = 0.96. Thus, with aR=0.437 km curve one should expect 1.44 +0.8 x 0.96 = 2.21 collisions/million vehicles. IfAADT = 5000, the collision reduction is(2.34 - 2.21) x 5000 x 365 x 10-6 = 0.24 collisions/
year. Additional safety benefits may accrue tothe curves connected to the other ends of thetangents.
There is a simple approximate way of determiningthe collision reduction which is due to increasingthe radius. Disregarding the safety benefit dueto shorter tangents, when R
1 < R
2:
expected collision reduction per unit of time =(collisions on 1 km of straight road per unit oftime) x (reduction in path length in km) + 0.0245x million vehicles per unit of time x (1/R
2-1/R
1)
The “reduction in path length in km” is given by
(R1-R
2) x [2tan(D/2)-D] (2.1.22)
in which D is the deflection angle in radians.
Numerical Example:
As in the previous numerical example, let R1 =
0.437 km, R2 = 0.35 km, D = 120o (2.09 radians)
and Volume = 5000 x 365 x 10-6 = 1.825 millionvehicles/year. The reduction in path length is(0.437-0.35) x [2tan (2.09/2) - 2.09] = 0.12 km.If there are 0.96 collisions/million vehicle km ona straight road, then, with 1.825 million vehiclesper year, one expects 0.96 x 1.825 = 1.75collisions/year for a kilometre of road. Thus, theexpected collision reduction is 1.75 x 0.12 +0.0245 x 1.825 x (1/0.35-1/0.437) = 0.21 + 0.03= 0.24 collisions/year.
In summary, when a horizontal curve is to befitted between tangents with a given deflectionangle, the greater the radius of the curve thefewer collisions will occur on the roadway.
Alignment and Lane Configuration
Page 2.1.2.46 September 1999

Geometric Design Guide for Canadian Roads
Page 2.1.3.3September 1999
3. Where possible, gradients lower than themaximum values shown should be used.
4. Maximum values should only be exceededafter a careful assessment of safety, cost,property and environmental implications.
5. The choice of maximum gradient may havea bearing on related design features; forexample, whether or not a truck climbinglane or escape lane is required.
6. While Table 2.1.3.1 provides generalguidance, the designer should be awarethat the factors that should be consideredin establishing the maximum grade for asection of roadway include:
• road classification
• traffic operation
• terrain
• climatic conditions
• length of grade
• costs
• property
• environmental considerations
• in urban areas, adjacent land use
7. Maximum grades of 3 to 5% are consideredappropriate for design speeds of 100 km/hand higher. This may have to be modifiedin regions with severe topography such asmountainous terrain, deep river valleys, andlarge rock outcrops.
8. Maximum grades of 7 to 12% areappropriate for design speeds of 50 km/hand lower. If only the more importantroadways are considered, 7% or 8% wouldbe a representative maximum grade for adesign speed of 50 km/h.
9. Control grades for other speeds between50 km/h and 100 km/h are intermediatebetween the above extremes.
Minimum Grades: Design Domain ApplicationHeuristics
Rural Roadways
1. On uncurbed roadways, level grades aregenerally acceptable provided the roadwayis adequately crowned, snow does notinterfere with surface drainage, and ditcheshave positive drainage. Roadway crown isdiscussed in Section 2.1.5. Refer toChapter 2.2 for guidelines for the design ofroadside open ditches and to relevantdrainage publications.
Curbed Roadways(generally in urban areas)
1. To ensure adequate drainage, curbedroadways typically have a minimumlongitudinal grade of 0.50% or 0.60%,depending on local policy.
2. In certain rare design cases, when no otheralternative is feasible, a grade of 0.30%may be used as an absolute minimumpreferably in combination with highly stablesoils and rigid pavements.
3. For retrofit projects, longitudinal gradesbelow the normal minimum of 0.50% or0.60% may be considered where flattergrades allow the retention, rather than theremoval, of existing pavements.
4. The minimum gradients outlined aresuitable for normal conditions of rainfall anddrainage outlet spacing. Where less thanthe normal minimum gradient is utilized, thelengths of such grades should be limited toshort distances, and their location andfrequency become importantconsiderations. In special cases, hydraulicanalysis is required to determine the extentof water spread on the adjacent travel lane.False grading, (where the pavement gradeis not parallel to the top of curb), to ensureadequate drainage is an effective meansof maintaining minimum grades in flat,highly constrained areas. False grading isaddressed in Section 2.1.5, Cross-Slope.
Alignment and Lane Configuration
Page 2.1.3.4 December 2009
5. At intersections, minimum gradients areparticularly important to avoid operationalsafety concerns related to ponding or icingconditions.
6. Ensuring positive drainage is a key elementin the grading designs of curb returns andthe large paved surfaces of intersectionareas. Suggested guidelines include aminimum gradient of 0.6% along curbreturns, and a minimum of 1.0% combinedcrossfall and longitudinal gradient within thelimits of an intersection. Further informationon intersection drainage considerations iscontained in Chapter 2.3, Intersections.
7. For gravelled roadways or public lanes, alongitudinal grade of 0.8% or more isdesirable to ensure adequate surfacedrainage, unless parallel ditches areprovided. A grade of 0.5% may be usedas an absolute minimum.
Drainage around Curves
1. Avoid areas of level grades around curvesif there is possibility of raised medians beinginstalled in the future. The installation ofsuch a median as part of a roadrehabilitation or widening project maypreclude the possibility of providingdrainage in the median. Superelevatedsections of pavement that drain towards adepressed median, and utilize longitudinalgrade in the median, may requirelongitudinal grade on the pavement fordrainage, if the median is subsequentlyraised.
2.1.3.3 Vertical Curves
Introduction
The function of a vertical curve is to provide asmooth transition between adjacent grades.
The form of curve used for vertical curves is askewed parabola, positioned so that basicmeasurements can be made horizontally andvertically. Curves are described as crest or sagdepending on their orientation.
One of the properties of the parabola is that therate of change of grade with respect to lengthis constant. For this reason sight distanceavailable to a driver travelling on a crest curveis constant throughout the length of the curve.This is one of the reasons for the use of theparabola for vertical curves. A secondadvantage of the parabolic curve is that itscalculation is much simpler than a circular orother curve that might be considered.
Since the rate of change of grade is constantwith respect to length, this property is used todesignate the size of the curve. The length of asection of curve measured horizontally overwhich there is a change of grade of 1% is aconstant for the curve and is referred to as theK value. For example, a K value of 90 means ahorizontal distance of 90 m is required for everyone percent gradient change. K is a measureof the flatness of a curve, the larger the K valuethe flatter the curve, in the same way that radiusis a measure of the flatness of a circular curve.For crest curves K is negative, and for sagcurves K is positive.
K = L / A (2.1.23)
Where:
L = Horizontal length of verticalcurve (m)
A = Algebraic difference of gradelines (%)
K = Parameter which has aconstant value in a givenvertical curve.
In certain situations, because of criticalclearance or other controls, the use ofunsymmetrical vertical curves may be required.Because their use is infrequent, the derivationand use of the appropriate formulae have notbeen included in the following section. For usein such limited instances, refer to unsymmetricalcurve data found in a number of highwayengineering texts.

Geometric Design Guide for Canadian Roads
Page 2.1.3.9September 1999
Values for sag curvature based on the comfortcriterion are shown in Table 2.1.3.4.
These K values for sag curves are useful inurban situations such as underpasses where itis often necessary for property and accessreasons to depart from original groundelevations for as short a distance as possible.Minimum values are normally exceeded wherefeasible, in consideration of possible powerfailures and other malfunctions to the streetlighting systems. Designing sag vertical curvesalong curved roadways for decision sightdistance is normally not feasible due to theinherent flat grades and resultant surfacedrainage problems.
2.1.3.4 Vertical Alignment:Design DomainAdditional ApplicationHeuristics
Vertical Alignment Principles: ApplicationHeuristics
The following principles generally apply to bothrural and urban roads. A differentiation betweenrural and urban is made in several instanceswhere necessary for clarity.
1. On rural and high speed urban roads asmooth grade line with gradual changes,consistent with the class of road and the
character of the terrain, is preferable to analignment with numerous breaks and shortlengths of grade. On lower speed curbedurban roadways drainage design oftencontrols the grade design.
2. Vertical curves applied to small changes ofgradient require K values significantlygreater than the minimum as shown inTables 2.1.3.2 and 2.1.3.4. The minimumlength in metres should desirably not beless than the design speed in kilometresper hour. For example, if the design speedis 100 km/h, the vertical curve length is atleast 100 m.
3. Vertical alignment, having a series ofsuccessive relatively sharp crest and sagcurves creating a “roller coaster” or “hiddendip” type of profile is not recommended.Hidden dips can be a safety concern,particularly at night. Such profiles generallyoccur on relatively straight horizontalalignment where the roadway profile closelyfollows a rolling natural ground line. Suchroadways are unpleasant aesthetically andmore difficult to drive. This type of profile isavoided by the use of horizontal curves orby more gradual grades.
4. A broken back grade line (two verticalcurves in the same direction separated bya short section of tangent grade) is not
Table 2.1.3.4 K Factors to Provide Minimum Stopping Sight Distanceon Sag Vertical Curves1
Rate of Sag Vertical Curvature (K)Headlight Control Comfort Control
DesignSpeed
(km/h)
AssumedOperating
Speed(km/h)
StoppingSight
Distance(m)
Calculated Rounded Calculated Rounded
30 30 29.6 3.9 4 2.3 240 40 44.4 7.1 7 4.1 450 47-50 57.4-62.8 10.2-11.5 11-12 5.6-6.3 5-660 55-60 74.3-84.6 14.5-17.1 15-18 7.7-9.1 8-970 63-70 99.1-110.8 19.6-24.1 20-25 10.0-12.4 10-1280 70-80 112.8-139.4 24.6-31.9 25-32 12.4-16.2 12-1690 77-90 131.2-168.7 29.6-40.1 30-40 15.0-20.5 15-20
100 85-100 157.0-205.0 36.7-50.1 37-50 18.3-25.3 18-25110 91-110 179.5-246.4 43.0-61.7 43-62 21.0-30.6 21-30120 98-120 202.9-285.6 49.5-72.7 50-73 24.3-36.4 24-36130 105-130 227.9-327.9 56.7-85.0 57-85 27.9-42.8 28-43

Alignment and Lane Configuration
Page 2.1.3.10 December 2009
desirable, particularly in sags where a fullview of the profile is possible. This effect isvery noticeable on divided roadways withopen median sections.
5. Curves of different K values adjacent toeach other (either in the same direction oropposite directions) with no tangentbetween them are acceptable provided therequired sight distances are met.
6. An at-grade intersection occurring on aroadway with moderate to steep grades,should desirably have reduced gradientthrough the intersection, desirably less than3%. Such a profile change is beneficial forvehicles making turns and stops, andserves to reduce potential hazards.
7. In sections with curbs the minimumlongitudinal grade is 0.5%. Withinsuperelevated transition areas, it mightsometimes be virtually impossible toprovide this minimum grade. In such cases,the longitudinal grade length below 0.5%should be kept as short as possible.Additional information on minimum gradesand drainage is provided in Subsection2.1.3.2.
8. A superelevation transition occurring on avertical curve requires special attention inorder to ensure that the required minimumcurvature is maintained across the entirewidth of pavement. The lane edge profileon the opposite side of the roadway fromthe control line may have sharper curvaturedue to the change in superelevation raterequired by the superelevation transition. Itis, therefore, necessary to check both edgeprofiles and to adjust the desired minimumvertical curvature.
9. Undulating grade lines, with substantiallengths of down grade, require carefulreview of operations. Such profiles permitheavy trucks to operate at higher overallspeeds than is possible when an upgradeis not preceded by a down grade. However,this could encourage excessive speed oftrucks with attendant conflicts with othertraffic.
10. On long grades it may be preferable toplace steepest grade at the bottom anddecrease the grades near the top of theascent or to break the sustained grade byshort intervals of flatter grade instead of auniform sustained grade that might be onlyslightly below the allowable maximum. Thisis particularly applicable to low designspeed roads and streets2.
11. To ensure a smooth grade line on highspeed routes a minimum spacing of 300 mbetween vertical points of intersection isdesirable.
12. The design of vertical alignment should notbe carried out in isolation but should havea proper relationship with the horizontalalignment. This is discussed inSection 2.1.4.
Drainage: Application Heuristics
1. Where uncurbed sections are used anddrainage is effected by side ditches, thereis no limiting minimum value for gradientor limiting upper value for vertical curves.
2. On curbed sections where storm waterdrains longitudinally in gutters and iscollected by catch basins, vertical alignmentis affected by drainage requirements.Minimum gradients are discussed inSubsection 2.1.3.2.
3. The profile of existing or plannedstormwater piping is an importantconsideration in setting urban roadwaygrades. Storm sewer pipes typically haveminimum depths to prevent freezing. Theserequirements are considered in settingcatchbasin elevations.
4. Where the storm sewer system is notsufficiently deep to drain the streets bygravity flow, lift stations are an alternative.However, lift stations are generallyconsidered undesirable due to the highcosts associated with installation, operationand maintenance. Malfunctions at the liftstation during a rain storm can also have amajor detrimental impact on the streetsystem and the adjacent developments.

Geometric Design Guide for Canadian Roads
Page 2.1.3.13December 2009
Railways
1. Minimum vertical clearance over railwaysis 6.858 m (22.5 feet) measured from baseof rail.
2. The minimum vertical clearance whereballast lifts are contemplated is 7.163 m(23.5 feet) measured from base of railelevation to the underside of the overpassstructure.
3. In all cases, it is good practice to confirmthe specific clearance requirements withthe pertinent railway company, as well aswith the appropriate Federal and Provincialagencies, before designs are finalized.
Overhead Utilities
1. The vertical clearance requirements forroadways crossing beneath overheadutilities vary with the different agencies. Inthe case of overhead power lines, theclearance varies with the voltage of theconductors. The clearance requirements ineach case should be confirmed with thecontrolling agency.
Pedestrian Overpasses
1. Normally, the minimum vertical clearancefor a pedestrian overpass structure is setat 5.3 m or 0.3 m greater than theclearance of any existing vehicularoverpass structure along that same route.This lessens the chances of it being struckby a high load - an important consideration- since a pedestrian overpass, being arelatively light structure, is generally unableto absorb severe impact and is more likelyto collapse in such an event. The increasedvertical clearance reduces the probabilityof damage to the structure and improvesthe level of safety for pedestrians using thestructure.
Bikeways and Sidewalks
1. For bikeways, the minimum verticalclearance provided is 2.5 m.
2. It is desirable to allow up to 3.6 m of verticalclearance in order to provide an enhanceddesign and permit access for typical servicevehicles.
3. Similar vertical clearances are normallyprovided for sidewalks since cyclists mayoccasionally use the sidewalk, even wherenot legally permitted.
4. If it can be clearly determined that cyclistswill not use the pedestrian sidewalk,minimum clearances in accordance withthe National or Provincial Building Codescould be employed.
5. Further information on sidewalks andbikeways is provided in Chapters 2.2, 3.3and 3.4.
Waterways
1. Over non-navigable waterways, bridgesand open footing culverts, the verticalclearance between the lowest point of thesoffit and the design high water level shallbe sufficient to prevent damage to thestructure by the action of flow water, iceflows, ice jams or debris.
2. For navigable waterways, navigationalclearance is dependent on the type ofvessel using the waterway and should bedetermined individually.
3. Clearances should also conform to therequirements of the Navigable WatersProtection Act of Canada.
Airways
1. Vertical clearance to airways is as indicatedin Figure 2.1.3.3.
2. Lighting poles should be contained withinthe clearance envelope.
3. The dimensions are for preliminary design.Specific dimensions should be approved bythe designated Transport Canadarepresentative.

Alignment and Lane Configuration
Page 2.1.3.14 December 2009
2.1.3.5 Explicit Evaluation ofSafety
General
Vertical alignment design has a significantimpact on safety in areas where vehicles arerequired to frequently stop and start. Excessivegrades in intersection areas and at drivewayscan contribute significantly to collisionfrequencies during wet or icy conditions. Effortsare normally made to provide as flat a grade aspracticable in these critical areas, while meetingthe minimum slopes needed for adequatesurface drainage.
Collision Frequency on Vertical Alignment
The following information on collision frequencyis derived from a 1998 research paper29.
The vertical profile of a road is likely to affectsafety by various mechanisms. First, vehiclestend to slow down going up the grade and speedup going down the grade. Speed is known toaffect collision severity. Thus on the up gradecollisions tend to be less severe than on thedown grade. Since down grade collisions tendto be more severe, a larger proportion of
collisions tend to get reported. Thus, the severityand frequency of reporting collisions areaffected by the grade. Second, road gradesaffect the diversity of speeds. This is thoughtby some to affect collision frequency. Third, roadprofile affects the available sight distance andgradient affects braking distance. All of thesefactors may affect collision frequency andseverity. Finally, grade determines the rate atwhich water drains from the pavement surfaceand this too may affect safety. The traditionalbelief was that safety-related design attentionshould focus on crest curves and sag curves.It turns out that while the vertical profile is animportant determinant of the future safety of aroad, sight distance at crest or sag curves isnot as important as it seemed.
At present the quantitative understanding of howgrade affects safety is imprecise. All studiesusing data from divided roads concluded thatcollision frequency increases with gradient ondown grades. Some studies concluded that thesame is true for up grades, while othersconcluded to the contrary. Estimates of the jointeffect of grade on both directions of travel vary.It is suggested that the conservative CollisionModification Factor of 1.08 be used for all roads.That is, if the gradient of a road section is
Figure 2.1.3.3 Airway Clearance1

Geometric Design Guide for Canadian Roads
Page 2.1.4.1December 2009
2.1.4 COORDINATIONAND AESTHETICS
2.1.4.1 Introduction
The visual aspect of the road as viewed by thedriver and passenger is considered to be animportant feature of geometric design. Theprovision of visual comfort helps make driving amore relaxing experience resulting in better andsafer traffic operation. Features which areaesthetically disturbing to the motorist are to beavoided. An unsightly road is a blight on thelandscape whereas an aesthetically pleasingfacility can become an asset, enhancing the areathrough which it passes.
To produce an aesthetically pleasing facility thedesigner requires an appreciation of therelationship between the road and itssurroundings. Some specific principles to beconsidered include:
• blending of the road with the surroundingtopography
• developing independent alignments for eachroadway of a divided facility when right ofway permits
• continuous curvilinear design rather thanlong-tangent, short-curve design
• integration of horizontal and verticalalignment
• implementation of designs with visuallypleasing structures, retaining walls andlandscaping
In many cases the above principles can beachieved at an acceptable extra cost. In caseswhere additional cost is a factor, the benefits areassessed against expenditure. In considering thecosts and benefits of design trade-offs of thissort, the designer should ensure that safety-related factors are considered explicitly. Inaddition, many of the basic elements of designcoordination contribute to the design consistencyaspects of road design, and should thus beconsidered in that context as well. The issue ofdesign consistency is discussed in Chapter 1.4of this Guide.
Examples of good and poor application of theabove principles are illustrated inFigures 2.1.4.1 to 2.1.4.12. Each photographor perspective sketch has a brief commentdescribing the significant visual qualities.
2.1.4.2 Alignment Coordination:Technical Foundation
The principal guides for horizontal and verticalalignment are set out in Sections 2.1.2 and2.1.3. A section of road might be designed tomeet these guides, yet the end result could bea facility exhibiting numerous unsatisfactory ordispleasing characteristics. Horizontal andvertical alignments are permanent designelements for which thorough study is warranted.It is extremely difficult and costly to correctalignment deficiencies after the road isconstructed. On freeways there are numerouscontrols such as multilevel structures and costlyright of way. On most arterial streets heavydevelopment takes place along the propertylines, which makes it impractical to change thealignment in the future. Thus, compromises inalignment designs must be weighed carefully.Any initial savings may be more than offset bythe economic loss to the public in the form ofcollisions and delays.
It is difficult to discuss the combination ofhorizontal alignment and profile withoutreference to the broader subject of location. Thesubjects are mutually interrelated and what maybe said about one generally is applicable to theother. It is assumed here that the generallocation has been fixed and that the problemremaining is the specific design andharmonizing of the vertical and horizontal lines,such that the finished road or street will be aneconomical, pleasant, and collision-free facilityon which to travel. The physical controls orinfluences that act singularly or in combinationto determine the type of alignment are thecharacter of road justified by the traffic,topography, and subsurface conditions, existingcultural development, likely futuredevelopments, and location of the terminals. Aninitial design speed is established whendetermining the general location, but as designproceeds to more detailed alignment and profileit assumes greater importance, and the speedchosen for design acts to keep all elements of
Alignment and Lane Configuration
Page 2.1.4.2 September 1999
design in balance. The final design speed chosenmay be different from the initial design speed.Design speed determines limiting values formany elements such as curvature and sightdistance and influences many other elementssuch as width, clearance, and maximumgradient; all are discussed in the preceding partsof this chapter.
Horizontal and vertical alignments should not bedesigned independently. They complement eachother, and poorly designed combinations canspoil the good points and aggravate thedeficiencies of each. Horizontal and verticalalignments are among the more important ofthe permanent design elements of the road.Excellence in their design and in the design oftheir combination increase usefulness andsafety, encourage uniform speed, and improveappearance.
During the location stage and the design phaseof a facility, the finished roadway is viewed inthree dimensions and the consequences ofvarious combinations of horizontal and verticalalignment on the utility, safety and appearanceof the completed project are considered.
2.1.4.3 Alignment Coordination:Design Domain ApplicationHeuristics
A number of application heuristics which canassist the designer in preparing well-coordinated and aesthetic plans are offeredbelow.
1. Curvature and grades should be in properbalance. Tangent alignment or flat curvatureat the expense of steep or long grades andexcessive curvature with flat grades areboth poor design. A logical design that offersthe most in safety, capacity, ease anduniformity of operation, and pleasingappearance within the practical limits ofterrain and area traversed is a compromisebetween the two extremes.
2. Vertical curvature superimposed onhorizontal curvature, or vice versa,generally results in a more pleasing facility,but it should be analyzed for effect on traffic.Successive changes in a profile not in
combination with horizontal curvature mayresult in a series of humps visible to thedriver for some distance, an undesirablecondition as previously discussed. The useof horizontal and vertical alignments incombination, however, may also result incertain undesirable arrangements, asdiscussed later in this section.
3. Sharp horizontal curvature should not beintroduced at or near the top of apronounced crest vertical curve. Thiscondition is undesirable in that the drivercannot perceive the horizontal change inalignment, especially at night when theheadlight beams go straight ahead intospace. The difficulty of this arrangement isavoided if the horizontal curvature leads thevertical curvature, i.e., the horizontal curveis made longer than the vertical curve.Suitable design can also be made by usingdesign values well above the minimums forthe design speed.
4. Somewhat allied to the above, sharphorizontal curvature should not beintroduced at or near the low point of apronounced sag vertical curve. Because theroad ahead is foreshortened, any significanthorizontal curvature assumes anundesirable distorted appearance. Further,vehicular speeds, particularly of trucks,often are high at the bottom of grades, anderratic operation may result, especially atnight.
5. On two-lane roads and streets the need forsafe passing sections at frequent intervalsand for an appreciable percentage of thelength of the road often supersedes thegeneral desirability for combination ofhorizontal and vertical alignment. In thesecases it is necessary to work toward longtangent sections to secure sufficientpassing sight distance in design.
6. Horizontal and vertical alignments shouldbe made as flat as feasible at intersectionswhere sight distance along both roads orstreets is important and vehicles may haveto slow or stop.

Geometric Design Guide for Canadian Roads
Page 2.1.5.3September 1999
2.1.5.4 Cross-Slope Arrangements:Application Heuristics
The direction of the cross-slopes, or the cross-slope arrangements for various classes ofroads, are described below and illustrated inFigure 2.1.5.2. The rate of cross-slope in eachcase depends on the type of surface as notedearlier, as well as, if relevant, on the width ofroadways and drainage considerations.
On tangent sections of roadway, cross-slope isnormally applied to drain storm water to the sideof the roadway. On two-lane roads thepavement is normally crowned at the centrelineand the pavement slopes down to each edge.
On four-lane undivided roads and four-lanedivided roads with a flush median, the crown isnormally placed in the centre of the pavementor median, and cross-slope to each pavementedge is 0.02 m/m.
On a four-lane divided road with a depressedmedian, a crown may be placed at the centreof each roadway with a cross-slope of0.02 m/m to each edge, or both lanes may drain
away from the median. These alternates areillustrated in Figure 2.1.5.2 (four lane divided,alternates A and B). The advantages of thecrown are storm water drains to both sides ofthe roadway and it facilitates the treatment ofthe roadway with de-icing chemicals which arespread in a narrow strip about the crown line,allowing the action of traffic and cross-slope tofurther spread the chemicals across the entirepavement. If the road eventually requiresexpansion to six lanes by adding two lanes inthe median, the additional lanes will slopetoward the median. The advantages of bothlanes draining away from the median is thereduction in median drainage provision.
If a four-lane divided road is to be expanded tosix lanes within a short period of time of initialconstruction, it is normally designed for six lanesand built without the median lanes initially. Inthis case both lanes of each roadway slopetoward the outer edge.
For six-lane divided roads, the crown for eachroadway is applied to either edge of the centrelane, in which case one or two lanes draintoward the median. With two lanes draining
Figure 2.1.5.1 False Grading and Cross-Slopes

Alignment and Lane Configuration
Page 2.1.5.4 December 2009
Figure 2.1.5.2 Application of Cross-slope on Various Types of Roads7
two-lane undivided
four-lane undivided
four-lane divided with narrowraised median
four-lane divided with wide depressed median (A)
four-lane divided with wide depressed median (B)
eight-lane divided
six-lane divided (B)
six-lane divided (A)

Geometric Design Guide for Canadian Roads
Page 2.1.5.5September 1999
toward the median, at locations where anauxiliary lane is added, two lanes are drainingin each direction. This location of the crown isalso convenient for an initial stage of four-lanedivided. If the six-lane cross section is to be astage of an eight-lane cross section, a crownlocated at the common edge of the median andcentre lane is preferred to avoid three lanesdraining toward the median. The above isillustrated in Figure 2.1.5.2 (six-lane divided,alternates A and B).
Cross-slope on auxiliary lanes is the same asthat of the adjacent through lane.
At intersections where two roads on tangentintersect, normal cross-slope is maintained onthe major road, and cross-slope on the minorroad is run out on the approaches to theintersection to match the profile of the majorroad. This treatment is typical of intersectionscontrolled by a stop sign on the minor road. Inthe case of an intersection where the two roadsare of equal importance, or where theintersection is signalized, the normal cross-slope is run out on all four approaches so thatthe cross-slope on each road matches theprofile of the crossing road. Simply put, thepavements are warped to maintain smoothprofiles for traffic on both roads. This topic isdealt with in more detail in Chapter 2.3.
For roadways on structures, the cross-slope isa minimum of 0.02 m/m.
For resurfacing, design guidelines andacceptable limits are provided in Table 2.1.5.1for pavement cross-slope related to designspeed.
The cross-slope for the other types of lanesaddressed later in the chapter, includingclimbing lanes, passing lanes and service roadsgenerally adhere to the following criteria.
For truck climbing lanes the cross-slope isusually handled the same as the addition of alane to a multilane road. Two common practicesare:
1. The continuation of the cross-slope of thethrough lanes.
2. A small increase in cross-slope comparedto the through lanes. On superelevatedsections the cross-slope is usually acontinuation of the through lanes unlesstruck speeds are extremely slow and icyconditions prevail in which case anadjustment in the truck climbing lane cross-slope may be desirable.
For passing lanes the practice is similar to thatfor truck climbing lanes except that slow speedsare not an issue.
The cross-slope for service roads, expresscollector systems, and weaving lanes basicallyfollow the same principles as would be appliedto a similar class of through lane.
Table 2.1.5.1 Pavement Cross-Slope for Resurfacing1
Cross-Slope (m/m)Maximum
Design Acceptable Algebraic DifferenceDesign Speed Guidelines Limits (driving lanes) (m/m)
60 km/h 0.02 0.015-0.04 0.0880 km/h 0.02 0.015-0.035 0.07100 km/h 0.02 0.015-0.03 0.06120 km/h 0.02 0.015-0.025 0.05
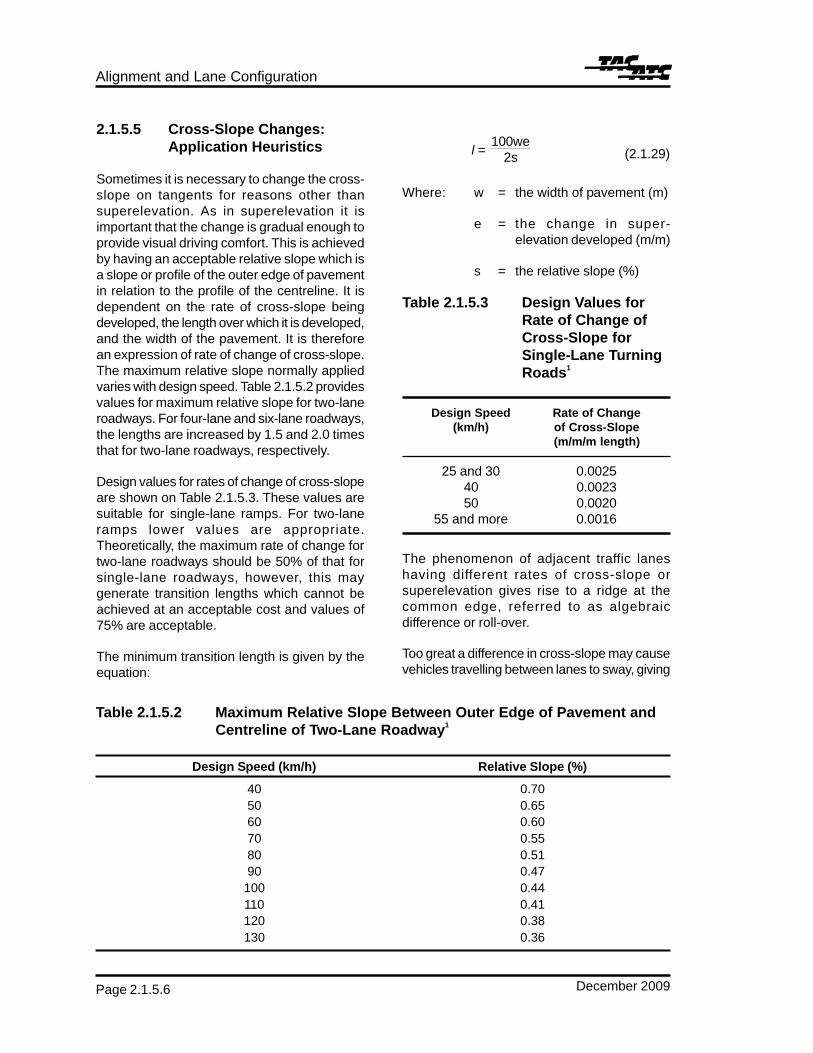
Alignment and Lane Configuration
Page 2.1.5.6 December 2009
2.1.5.5 Cross-Slope Changes:Application Heuristics
Sometimes it is necessary to change the cross-slope on tangents for reasons other thansuperelevation. As in superelevation it isimportant that the change is gradual enough toprovide visual driving comfort. This is achievedby having an acceptable relative slope which isa slope or profile of the outer edge of pavementin relation to the profile of the centreline. It isdependent on the rate of cross-slope beingdeveloped, the length over which it is developed,and the width of the pavement. It is thereforean expression of rate of change of cross-slope.The maximum relative slope normally appliedvaries with design speed. Table 2.1.5.2 providesvalues for maximum relative slope for two-laneroadways. For four-lane and six-lane roadways,the lengths are increased by 1.5 and 2.0 timesthat for two-lane roadways, respectively.
Design values for rates of change of cross-slopeare shown on Table 2.1.5.3. These values aresuitable for single-lane ramps. For two-laneramps lower values are appropriate.Theoretically, the maximum rate of change fortwo-lane roadways should be 50% of that forsingle-lane roadways, however, this maygenerate transition lengths which cannot beachieved at an acceptable cost and values of75% are acceptable.
The minimum transition length is given by theequation:
(2.1.29)
Where: w = the width of pavement (m)
e = the change in super-elevation developed (m/m)
s = the relative slope (%)
Table 2.1.5.3 Design Values forRate of Change ofCross-Slope forSingle-Lane TurningRoads1
Design Speed Rate of Change(km/h) of Cross-Slope
(m/m/m length)
25 and 30 0.002540 0.002350 0.0020
55 and more 0.0016
The phenomenon of adjacent traffic laneshaving different rates of cross-slope orsuperelevation gives rise to a ridge at thecommon edge, referred to as algebraicdifference or roll-over.
Too great a difference in cross-slope may causevehicles travelling between lanes to sway, giving
Table 2.1.5.2 Maximum Relative Slope Between Outer Edge of Pavement andCentreline of Two-Lane Roadway1
l = 100we2s
Design Speed (km/h) Relative Slope (%)
40 0.7050 0.6560 0.6070 0.5580 0.5190 0.47100 0.44110 0.41120 0.38130 0.36

Geometric Design Guide for Canadian Roads
Page 2.1.7.1September 1999
2.1.7 LANE AND ROUTECONTINUITY ANDWEAVING
2.1.7.1 Lane Continuity
Technical Foundation
In designing the lane arrangement of a freeway,design volume, maintenance of basic lanes andlane balance are all taken into account. A furtherconsideration is that of lane continuity.
A driver needs to recognize which lanes arebasic or through, to avoid being inadvertentlyled by the lane markings to an undesired ramplane. If good lane balance is applied and basiclanes are maintained, together with all exits andentrances having a single lane on the right, lanecontinuity will naturally follow. Where enteringand exiting ramps have two or more lanes, andat transfer lanes on collector roadways onexpress-collector systems, lane continuity canbe lost.
Best Practices
Figure 2.1.7.1 illustrates examples of lanecontinuity. Included is an example of non-compliance of lane continuity followed by anillustration of a rearrangement of lanes andramps in order to achieve lane continuity. Inillustration (i) three basic lanes are maintained,all ramps are single lane on the right and theprinciples of lane balance are observed. Lanecontinuity is maintained. In illustration (ii) thereare three basic lanes, all ramps are on the rightand have two lanes, lane balance is preservedand lane continuity is maintained.
In illustration (iii) there are two single-laneentrances on the right, a two-lane exit on theright, a two-lane (transfer) entrance on the leftand a two-lane (transfer) exit on the left.Although three basic lanes are maintainedthrough the section and the principles of lanebalance are observed, only one of the basiclanes is continuous. This confuses the driver,causes turbulence and unnecessary lanechanging in the traffic operation, and ispotentially hazardous.
Illustration (iv) shows how the deficiencies ofillustration (iii) can be resolved. The number oflanes on each ramp and transfer roadway arethe same, proper lane balance is observed andall three basic lanes are continuous. This isaccomplished by use of auxiliary lanes on boththe left and right-hand sides of the roadway.
2.1.7.2 Route Continuity1
Technical Foundation
Route continuity refers to the provision of adirectional path along and throughout the lengthof a designated route. Continuity of routedesignation, either by name or number, isimportant to ensure operational uniformity andto reassure the driver that he is on the intendedcourse. The principle of route continuitysimplifies the driving task in that it reduces lanechanges, simplifies signing, delineates thethrough route, and reduces the driver’s searchfor directional signing.
Desirably, the through driver, especially theunfamiliar driver, should be provided acontinuous through route on which it is notnecessary to change lanes and through trafficvehicular operation occurs on the left of all othertraffic. In maintaining route continuity throughcities and bypasses, interchange configurationsneed not always favour the heavy movementbut rather the through route. To accomplish this,heavy movements can be designed on flatcurves with reasonably direct connections andauxiliary lanes, equivalent operationally tothrough movements.
Best Practices
Adherence to the above route continuityprinciples influences the configuration ofinterchanges. In Figure 2.1.7.2, two continuityarrangements are illustrated.
In illustration (i) Highway 1 is a north-south routeand Highway 2 is an east-west route, in whichcase a conventional four level fully-directionalinterchange is appropriate and the designatedthrough routes are consistent with the routenumbers. In illustration (ii), Highway A is aneast-south route and Highway B is a north-west

Alignment and Lane Configuration
Page 2.1.7.2 December 2009
Figure 2.1.7.1 Examples of Lane Continuity1

Geometric Design Guide for Canadian Roads
Page 2.1.7.3December 2009
Figure 2.1.7.2 Illustration of Route Continuity1

Alignment and Lane Configuration
Page 2.1.7.4 September 1999
route. The through routes, and the route namesand numbers, are maintained and the rampscarry traffic between route numbers.
If the conventional configuration of illustration(i) were applied to the Highway A/B interchange,the through route numbers would be carried onramps. This would confuse a driver who expectsto exit on a ramp (on the right) only whendeparting from the through route number ofanother route. The designated through routename or number, therefore, influences theselection of the configuration of the interchange.
2.1.7.3 Weaving
Technical Foundation
Weaving sections are roadway segments wherethe pattern of traffic entering and leaving atcontiguous points of access result in vehiclepaths crossing each other. Weaving sectionsmay occur within an interchange, betweenentrance ramps followed by exit ramps ofsuccessive interchanges, and on segments ofoverlapping roadways. The weave sectionoperations are an important consideration in thelocation of ramp terminals.
If the frequency of lane changes in a weavingsection is similar to that on an open road, thesection is said to be “out of the realm ofweaving”, but where they exceed the normalfrequency the condition is described as“weaving”.
There are three primary types of weavingsections which are determined by theoperational features such as number of entrylanes, number of exit lanes, and their impacton how lane changing must take place. Thethree types of weaving sections are: Type A,Type B, and Type C. These three types ofweaving sections are illustrated inFigure 2.1.7.3.
Type A weaving section requires that eachweaving vehicle make one lane change in orderto execute the desirable movement. Type Aweaving section is also broken into two distinctweaving types. The first is a one sided weave,
and the second is called a major weave withcrown line.
Type B weave section is classified as a majorweaving section because it involves multilaneentry and/or exit lanes. Two criticalcharacteristics that distinguish Type B weavingareas are: 1) one weaving movement may beaccomplished without making any lanechanges, and 2) the other weaving movementrequires at most one lane change. Type Bweaving sections are extremely efficient incarrying large weaving volumes, primarilybecause of provisions of a through lane for oneof the weaving movements.
Type C weaving sections are similar to Type Bweaving sections in that one or more throughlanes are provided for one of the weavingmovements. The distinguishing differencesbetween Type B and Type C weave sections isthe number of lane changes required for theother weaving movement.
Best Practices
The conflict between entering and exiting traffictends to interrupt the operation of normalthrough traffic, precipitates turbulence in trafficflow and has the effect of reducing servicevolumes and capacity. Undesirable weavingconditions may be alleviated by increasing thenumber of lanes in the weaving section orincreasing the length between successiveentrance and exit gores. Weaving sections maybe eliminated from the main facility by theselection of interchange forms that do not haveweaving, or by incorporation of collectordistributor roadways. Although interchangesthat do not involve weaving operate better thanthose that do, interchanges with weaving areasnearly always are less costly than those without.
If the above measures are not effective or notfeasible for resolving weaving concerns, it maybe necessary to eliminate certain turningmovements or relocate them elsewhere, in theinterest of maintaining the operational integrityof the freeway. Alternatively, a weaving conditionmay be eliminated by separating the conflictingtraffic movements vertically by introducing a

Geometric Design Guide for Canadian Roads
Page 2.1.7.5September 1999
Figure 2.1.7.3 Types of Weaving Sections8
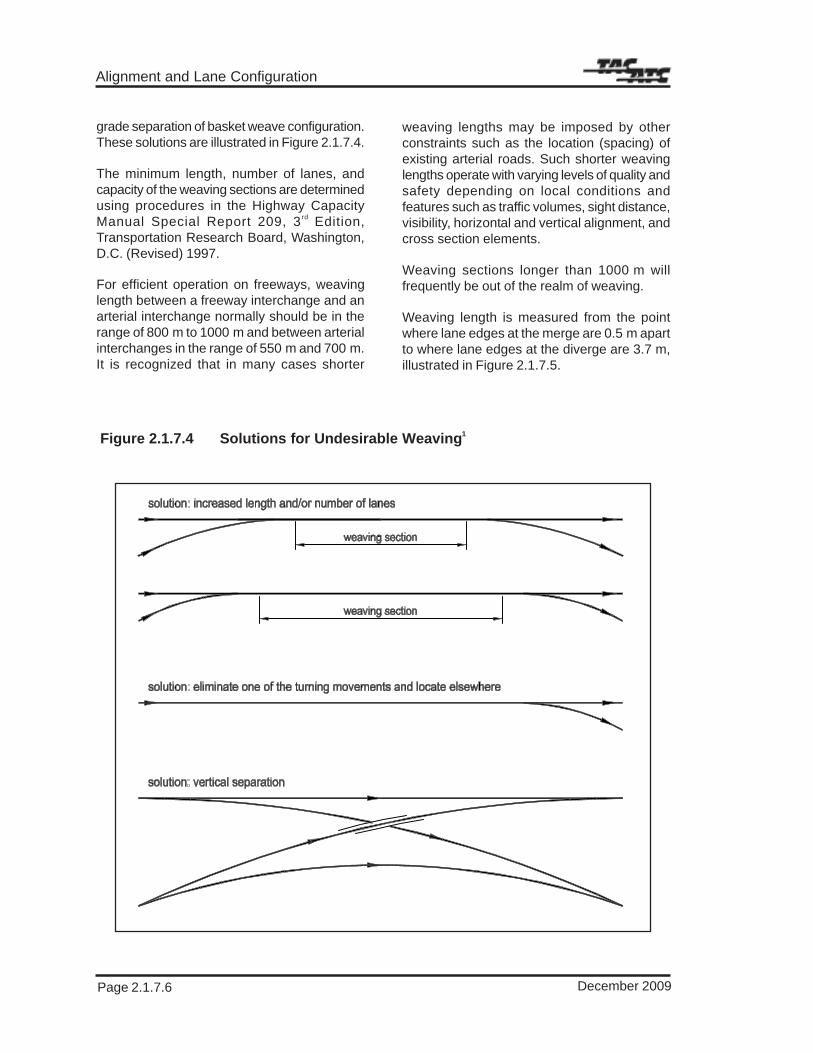
Alignment and Lane Configuration
Page 2.1.7.6 December 2009
grade separation of basket weave configuration.These solutions are illustrated in Figure 2.1.7.4.
The minimum length, number of lanes, andcapacity of the weaving sections are determinedusing procedures in the Highway CapacityManual Special Report 209, 3rd Edition,Transportation Research Board, Washington,D.C. (Revised) 1997.
For efficient operation on freeways, weavinglength between a freeway interchange and anarterial interchange normally should be in therange of 800 m to 1000 m and between arterialinterchanges in the range of 550 m and 700 m.It is recognized that in many cases shorter
weaving lengths may be imposed by otherconstraints such as the location (spacing) ofexisting arterial roads. Such shorter weavinglengths operate with varying levels of quality andsafety depending on local conditions andfeatures such as traffic volumes, sight distance,visibility, horizontal and vertical alignment, andcross section elements.
Weaving sections longer than 1000 m willfrequently be out of the realm of weaving.
Weaving length is measured from the pointwhere lane edges at the merge are 0.5 m apartto where lane edges at the diverge are 3.7 m,illustrated in Figure 2.1.7.5.
Figure 2.1.7.4 Solutions for Undesirable Weaving1
Geometric Design Guide for Canadian Roads
Page 2.2.4.9December 2009
In spite of these factors, the following generalconclusions can provide design assistance:
1. A number of studies indicate that increasedshoulder width is more beneficial to safetyat higher traffic volumes than lowervolumes.
2. There are some indications in the researchthat roads with wider shoulders may tendto have collisions of greater severity. Thisphenomenon may be due to the higherrunning speeds that such wider shouldersmay encourage in some instances.
3. Shoulders wider than about 2.0 m to 2.5 mincrease the number of injury collisions insome circumstances. Once again, thisphenomenon may be due to the higherrunning speeds that wider shoulders mayencourage. It is thus logical that, insituations where wider shoulders are to beused, particular attention should be paid toproviding an appropriate forgiving roadsidedesign.
4. The safety effect of wide shoulders on leveland straight roads is less than on sharphorizontal curves and on roads with steepgrades.
5. Wider shoulders tend to have fewer run-off-road and opposite direction collisions.However, they may in some instances beassociated with greater levels of ‘other’types of collisions.
6. Shoulders fulfil an important function as arefuge area for broken-down vehicles.Making adequate provision for the refugeof such vehicles is particularly important onhigh-volume facilities such as rural andurban freeways. In consideration of thisfact, and of the consequent need to allowdrivers and passengers room to movearound the vehicle for maintenance and/orrepair purposes, the design domain forshoulder width allows for widths up to 3.0 m.In instances where the lower limits of thedesign domain are used, particular attentionshould be paid to providing a forgivingroadside.
7. The Collision Modification Factor (CMF)related to shoulder width and annualaverage daily traffic (AADT) is shown onFigure 2.2.4.6. This Figure is based on run-off-road and opposite direction collisions.If the information shown in Figure 2.2.4.6is to be applied to total collisions, anappropriate correction needs to be applied.For example, if half of the collisions on agiven road are of the run-off-road andopposite direction type, the CMF needs tobe applied only to half of the total numberof collisions. If the “other” collision typesare affected by shoulder width, the CMFneeds to be reduced further.
8. Provision of full shoulders instead of onlycurb and gutter on multilane suburbanhighways is associated with a 10% lowercollision rate.18
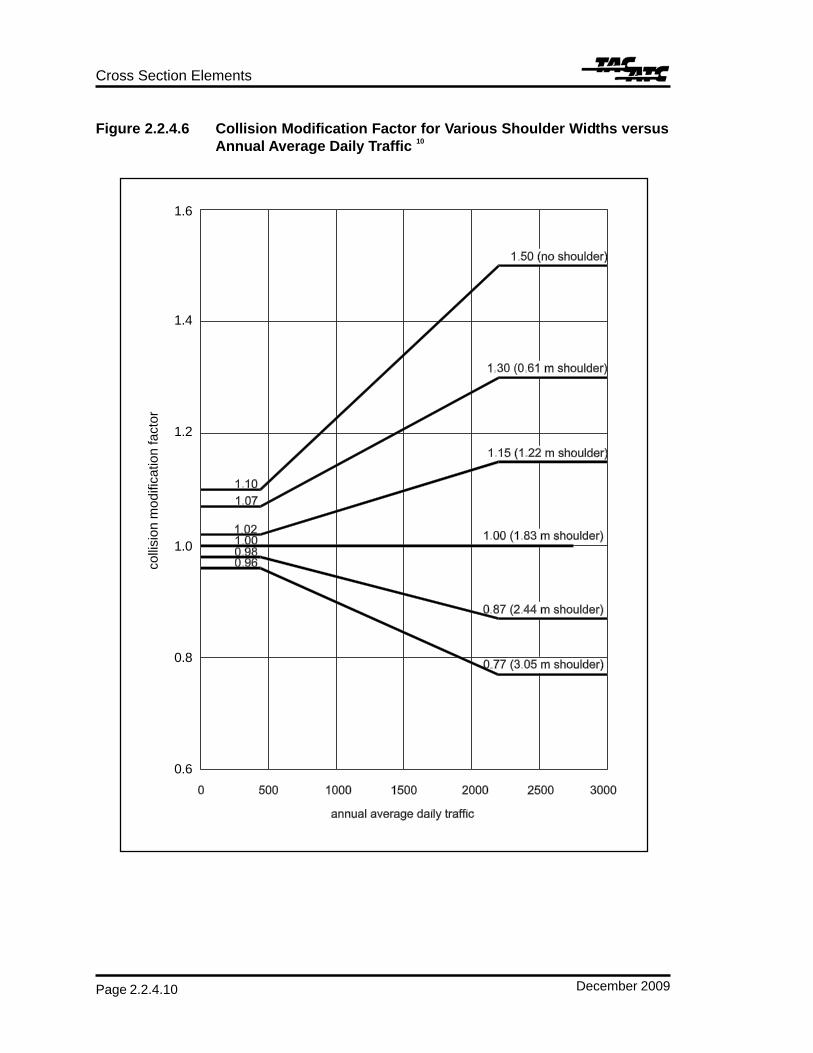
Cross Section Elements
Page 2.2.4.10 December 2009
Figure 2.2.4.6 Collision Modification Factor for Various Shoulder Widths versusAnnual Average Daily Traffic 10
0.6
0.8
1.0
1.2
1.4
1.6
colli
sion
mod
ifica
tion
fact
or
Geometric Design Guide for Canadian Roads
Page 2.2.5.1December 2009
2.2.5 MEDIANS ANDOUTERSEPARATIONS
2.2.5.1 Technical Foundation
A median may be defined as that portion of aroad which physically separates the travel lanesof traffic in opposing directions. Median widthis the lateral dimension measured between theinner (left) edges of the travel lanes and includesthe left shoulder, the gutter or offset widths, asshown in Figures 2.2.1.1 and 2.2.1.2.
A median is a safety device which providessome measure of freedom from interferenceof opposing traffic. Medians provide a recoveryarea for errant vehicles, storage area foremergencies, speed-change lanes for left-turnand U-turn traffic, and reduce headlight glare.Medians add to a sense of open space andfreedom, particularly in urban areas.
Medians should be visible day and night andshould be in definite contrast to adjacent travellanes. Medians may be flush with, raised above,or depressed below adjacent travel lanes.
Median widths may be as narrow as 1.0 m andas wide as 30 m. Widths above 3.0 m areusually associated with independentalignments, in which case the roadways aredesigned separately, and the area between islargely left in its natural state. Median widthsfor rural typical sections are normally multiplesof 1.0 m and for urban typical sections multiplesof 0.2 m.
Medians may serve as escape routes andprovide a clear zone for vehicles that areavoiding possible collisions with vehicles in theirown lanes.11 The major uses of a medianseparation are to eliminate the risk of head-oncollisions and to control access. Increasingmedian width reduces the frequency of cross-median collisions. Collision frequenciesgenerally decrease with increasing medianwidths; however, current research is insufficientto allow quantification of the collision ratesversus median width.11 For that reason,medians should be as wide as economically
possible. In any case, the median width shouldbe in balance with the other elements of thecross section and the character of the area.
An outer separation is that portion of an arterialstreet, road, expressway or freeway whichphysically separates the outside travel lanes ofa roadway from an adjacent frontage/serviceroad or collector road. The width of an outerseparation is measured from the outer (right)edge of the travel lanes to the closest edge ofthe parallel frontage/service road or collectorroad, and includes the shoulder and gutter oroffset widths, as shown in Figure 2.2.1.1.
A discussion regarding median barriers ispresented in Chapter 3.1.
2.2.5.2 Freeway and ExpresswayMedians: ApplicationHeuristics
1. Rural freeways usually have depressedmedians of sufficient width to allow the roadbed to drain into the median and toeliminate the need for median barriers.
2. Median side slopes are kept flat so that avehicle leaving the travelled lanes has anopportunity to recover control minimizingoccupant injury and vehicle damage.Overturning crashes are more frequent fordeeply depressed medians with slopes of4:1 or steeper for median widths of 6.0 to12.0 m.12 Slopes steeper than 4:1 shouldbe avoided and flatter slopes are desirablewhere feasible in terms of cost, drainageand property. See Chapter 3.1 for additionaldiscussion of slopes.
3. Wide medians promote safety by reducingthe possibility of collision by vehiclestravelling in opposite directions; and theypromote a sense of well-being for thetravelling public. Rural freeway mediansin the order of 20 m are common and maybe as much as 30 m. Wider mediansconstitute separate alignment andindependent design.
4. In metropolitan fringe areas it may beappropriate to build a rural freeway with a

Cross Section Elements
Page 2.2.5.2 September 1999
depressed median, recognizing that thecharacter of the area will become urban andthat future lanes will be required togetherwith a flush or raised median. The ultimatecross section is designed and thenelements removed to determine thedepressed median width for the first stage.
5. In developing the ultimate cross section, thedesigner should be aware that theinstallation of median barriers increases thecollision rate but reduces crash severitybecause of the reduction or elimination ofhead-on collisions.12
6. Consideration should be given to providingsufficient median width to preclude medianbarriers in the ultimate stage when thefuture lanes are added.
7. Medians for urban freeways normally areeither flush or raised with a median barrier.Median dimensions depend on shoulderwidths, barrier type, and the need forprovision of structure piers. SeeChapter 3.1 for a discussion of medianbarriers.
8. The normal width of a left shoulder for anurban freeway ranges between 1.5 m and2.5 m. Therefore the median width shouldbe at least 3.0 m plus the width of theselected barrier plus allowances for suchfactors as barrier deflection on impact ifmedian barrier systems are used,illumination poles, overhead sign footingsand bridge piers. Further discussion onbarriers is contained in Chapter 3.1.
9. Typical freeway medians are shown inFigure 2.2.5.1.
2.2.5.3 Arterial Road Medians:Application Heuristics
1. A flush median without barrier may beappropriate for rural highways with low tomedium volumes and operating speeds.This median is normally slightly crownedto effect drainage, and is normally paved,often in the same surface material as theadjacent lanes. It is advantageous,
however, to surface the median in acontrasting texture and/or colour to alert theerrant driver travelling in the median.Widths of flush highway medians withoutmedian barriers can vary between 1.0 mand 4.0 m.
2. Wider flush medians with barriers normallyapply to high speed rural arterial roads.
3. Medians in urban areas may be either flushor raised.
4. A median in an urban area normally doesnot have a barrier because it has to beterminated at intersections and someentrances, in which case the safety benefitsof the median are offset by the hazard ofthe barrier ends. Where a barrier is applied,it is usually a concrete barrier in a flushmedian. Shoulders are not normallyjustified in urban areas, in which case theconcrete barrier is offset 0.5 m from theedge of travelled lane. Additional medianwidth might be required to accommodateillumination plant, bridge piers or trafficcontrol devices.
5. Where provision for a left-turn lane isrequired, the median may require wideningto provide the appropriate lane width,rounded up to a multiple of 0.2 m.
6. Additional width may be required for bridgepiers regardless of whether barrierprotection is provided. Figure 2.2.5.2 givessuitable dimensions for raised mediantreatment at bridge piers for arterial roads.
7. Additional median width may be required ifheavy volumes of multi-trailer trucks areanticipated at unsignalized intersections.
8. Medians on a divided urban street serve avariety of important purposes related tosafety, traffic operations, access control,and aesthetics including:
• physical separation of opposing trafficflows
• storage area for left-turning vehicles outof the path of the through traffic stream

Geometric Design Guide for Canadian Roads
Page 2.2.7.1December 2009
2.2.7 CURBS ANDGUTTERS
2.2.7.1 Technical Foundation
Curbs are raised or vertical elements, locatedadjacent to a travelled lane, parking lane orshoulder. They may be employed with all typesof urban streets for any or all of the followingreasons:
• drainage control
• delineation of the pavement edge orpedestrian walkways to improve safety
• right-of-way reduction with the eliminationof open ditch drainage
• reduction in maintenance operations
• access control or provision
• aesthetics
Curbs are used only to a limited extent on ruralroadways where drainage is usually controlledby means of drainage channels. Concretegutters are typically used to facilitate longitudinaldrainage along urban roadways. They are oftencast integrally with curbs, but may also have a“vee” shape when used adjacent to a concretetraffic barrier.
2.2.7.2 Curbs: Best Practices
There are three general types of curb: barrier,semi-mountable and mountable (seeFigure 2.2.7.1). Each type may be designedas a separate unit or integrated with a gutter toform a combination curb and gutter section.
1. Barrier type curb is vertical or near vertical,with a typical height of 150 mm, and isintended primarily to control drainage andaccess, as well as to inhibit low speedvehicles from leaving the roadway.
2. When struck at high speeds, barrier curbscan result in loss of vehicle control and - inspite of its name - is inadequate to preventa vehicle from leaving the roadway.
3. In addition, the barrier type curb cancontribute to a high speed errant vehiclevaulting over a semi-rigid traffic barrierunder certain conditions. For this reason,barrier curb is generally not used on urbanfreeways and is considered undesirable onexpressways and arterials with designspeeds in excess of 70 km/h. Barrier curbis never used in combination with rigidconcrete barrier systems.
4. Semi-mountable curb is considered to bemountable under emergency conditions. Itsface slope ranges from 0.250 m/m to0.625 m/m with a maximum vertical heightof 125 mm. Semi-mountable curbs areused on urban freeways, expressways, andon high speed arterials (design speed over70 km/h) as a trade-off between drainagerequirements and, when required, thefunctional needs of semi-rigid traffic barriersystems.
5. Mountable curb contains a relatively flatsloping face (0.10 m/m to 0.25 m/m) topermit vehicles to cross over it easily. Whilemountable curb may be used in conjunctionwith either semi-rigid or rigid traffic barriersystems, it is preferable not to use a curbin combination with either of these trafficbarrier systems.
6. The cross section dimensions of concretecurbs and curbs with gutters vary betweenmunicipal jurisdictions. Standardization ofcurb and gutter dimensions within a givenjurisdiction is desirable for economy anduniformity in construction and maintenancepractice.
7. When introducing a curb at the transitionbetween typical rural and urban road crosssections, the curb on the urban section isnormally flared out to match the edge ofshoulder on the rural section. Flare ratesof 24:1 for a design speed of 80 km/h and15:1 for 50 km/h are consideredappropriate. The end of the curb is normallytapered down to be flush with the shouldersurface to prevent blunt impacts betweenthe curb and vehicle tires or snow clearingequipment.

Cross Section Elements
Page 2.2.7.2 September 1999
Figure 2.2.7.1 Curb and Gutter Types
Geometric Design Guide for Canadian Roads
Page 2.2.10.5September 1999
preferably by using a quantitative benefitcost analysis technique and documentedby the road designer in the process ofreaching such a decision.
3. Guidelines for minimum horizontalclearances on bridges on urban local andcollector roads are provided inTable 2.2.10.1.
4. Guidelines for minimum horizontalclearance at bridges on rural roads areshown in Table 2.2.10.2.
5. Guidelines for minimum horizontalclearances at bridges on urban arterialroads and urban freeways are shown onFigures 2.2.10.1 and 2.2.10.2.
6. Horizontal clearances to a rigid barrier onoverpass bridges on arterial roads areshown on Figure 2.2.10.3 while horizontalclearances to a rigid barrier on overpassbridges on freeways are provided on Figure2.2.10.4. The rigid barrier assists in keepingerrant vehicles on the bridge structure andis preferred where pedestrians areaccommodated on the overpass.
7. Appropriate barrier transitions should beused on the approaches to the structure.1
Refer to Chapter 3.1 for additionalinformation.
2.2.10.4 Vertical Clearances: DesignDomain and ApplicationHeuristics
Refer to Chapter 2.1.
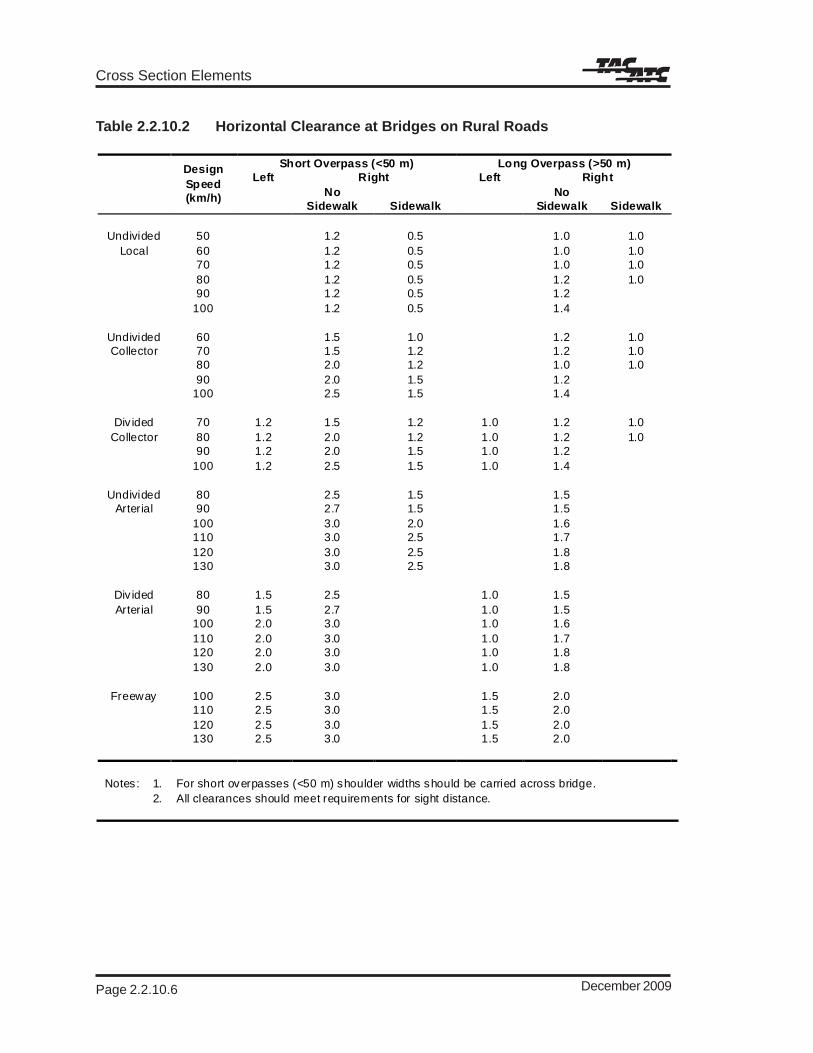
Cross Section Elements
Page 2.2.10.6 December 2009
Table 2.2.10.2 Horizontal Clearance at Bridges on Rural Roads
Short Overpass (<50 m) Long Overpass (>50 m) Left Right Left Right
Design Speed (km/h) No
Sidewalk
Sidewalk No
Sidewalk
Sidewalk
Undivided
50
1.2
0.5
1.0
1.0
Local 60 1.2 0.5 1.0 1.0 70 1.2 0.5 1.0 1.0 80 1.2 0.5 1.2 1.0 90 1.2 0.5 1.2 100 1.2 0.5 1.4
Undivided 60 1.5 1.0 1.2 1.0 Collector 70 1.5 1.2 1.2 1.0
80 2.0 1.2 1.0 1.0 90 2.0 1.5 1.2 100 2.5 1.5 1.4
Div ided 70 1.2 1.5 1.2 1.0 1.2 1.0 Collector 80 1.2 2.0 1.2 1.0 1.2 1.0
90 1.2 2.0 1.5 1.0 1.2 100 1.2 2.5 1.5 1.0 1.4
Undivided 80 2.5 1.5 1.5 Arterial 90 2.7 1.5 1.5
100 3.0 2.0 1.6 110 3.0 2.5 1.7 120 3.0 2.5 1.8 130 3.0 2.5 1.8
Div ided 80 1.5 2.5 1.0 1.5 Arterial 90 1.5 2.7 1.0 1.5
100 2.0 3.0 1.0 1.6 110 2.0 3.0 1.0 1.7 120 2.0 3.0 1.0 1.8 130 2.0 3.0 1.0 1.8
Freeway 100 2.5 3.0 1.5 2.0 110 2.5 3.0 1.5 2.0 120 2.5 3.0 1.5 2.0 130 2.5 3.0 1.5 2.0
Notes: 1. For short overpasses (<50 m) shoulder widths should be carried across bridge. 2. All clearances should meet requirements for sight distance.

Geometric Design Guide for Canadian Roads
Page 2.2.11.3December 2009
Figure 2.2.11.2 Nomograph for Predicting Utility Pole Collision Rate14
average annual daily traffic (vehicles/day) utility pole collision frequency (collisions/km/year)

Cross Section Elements
Page 2.2.11.4 September 1999
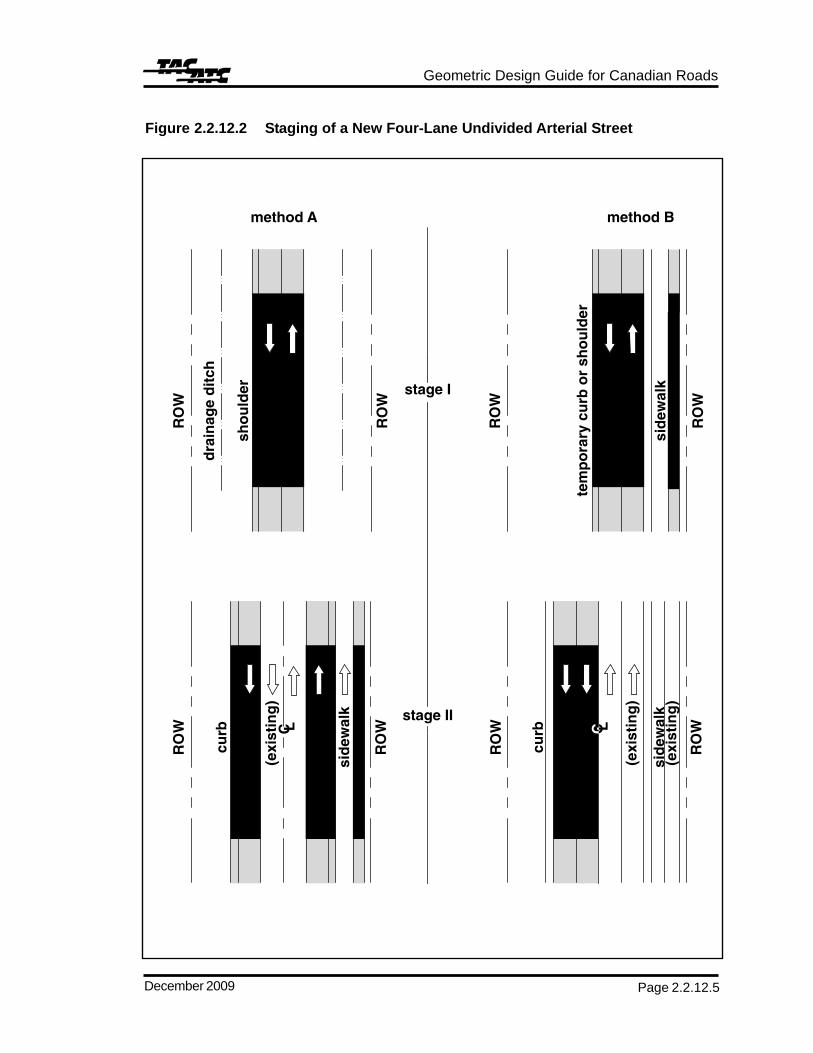
Geometric Design Guide for Canadian Roads
Page 2.2.12.5December 2009
Figure 2.2.12.2 Staging of a New Four-Lane Undivided Arterial Street
method Bmethod A
RO
WR
OW
RO
W
RO
W
RO
W
curb
curb
sid
ewal
k
sid
ewal
k
(exi
stin
g)
(exi
stin
g)
(exi
stin
g)
RO
W
RO
W
RO
W
sid
ewal
kstage I
stage II
dra
inag
e d
itch
sho
uld
er
tem
po
rary
cu
rb o
r sh
ou
lder
C L

Page 2.2.12.6 September 1999
Cross Section Elements

Geometric Design Guide for Canadian Roads
Page 2.3.iiiDecember 2009
2.3.11 MEDIAN OPENINGS ................................................................................ 2.3.11.1
2.3.11.1 Use and Function ......................................................................... 2.3.11.12.3.11.2 Elements of Design ..................................................................... 2.3.11.12.3.11.3 U-Turns ........................................................................................ 2.3.11.22.3.11.4 Emergency and Maintenance Vehicle Crossings ........................ 2.3.11.2
2.3.12 ROUNDABOUTS ...................................................................................... 2.3.12.1
2.3.12.1 Introduction .................................................................................. 2.3.12.12.3.12.2 Roundabout Characteristics ........................................................ 2.3.12.12.3.12.3 Location/Application of Roundabouts ........................................... 2.3.12.12.3.12.4 Geometry/Road Capacity ............................................................ 2.3.12.32.3.12.5 Safety Analysis............................................................................. 2.3.12.4
2.3.13 RAILWAY GRADE CROSSINGS ............................................................... 2.3.13.1
2.3.13.1 Introduction .................................................................................. 2.3.13.12.3.13.2 Location of New Crossings .......................................................... 2.3.13.12.3.13.3 Vertical Alignment ......................................................................... 2.3.13.32.3.13.4 Horizontal Alignment .................................................................... 2.3.13.32.3.13.5 Width of Crossing ........................................................................ 2.3.13.32.3.13.6 Sight Distance at Railway Crossings .......................................... 2.3.13.4
2.3.14 PEDESTRIAN CROSSINGS AT-GRADE ................................................. 2.3.14.1
2.3.14.1 Intersection Crosswalks .............................................................. 2.3.14.12.3.14.2 Accommodation of Persons with Disabilities............................... 2.3.14.1
REFERENCES ...................................................................................................... 2.3.R.1
Tables
Table 2.3.1.1 Desirable Spacing Between Signalized Intersections (m) ........... 2.3.1.17Table 2.3.2.1 Design Values for Rate of Change of Cross-Slope
for Intersection Areas .................................................................. 2.3.2.16Table 2.3.2.2 Opportunities for Retrofit ............................................................. 2.3.2.18Table 2.3.3.1 Distance Travelled in 3.0 s ............................................................ 2.3.3.4Table 2.3.3.2 Ratios of Acceleration Times on Grades ....................................... 2.3.3.6Table 2.3.3.3 Minimum Property Requirements at 900 Intersections
for Stop Control ........................................................................... 2.3.3.10Table 2.3.3.4 Summary Table for Design of Sight Distance
at Intersections ............................................................................ 2.3.3.15Table 2.3.3.5 Sight Distance for Left Turns at Unsignalized
Interchange Ramp Terminals ...................................................... 2.3.3.15

Intersections
Page 2.3.iv September 1999
Table 2.3.4.1 Guidelines for Shoulder Treatment atSimple Rural Intersections........................................................... 2.3.4.12
Table 2.3.5.1 Right-Turn Tapers Without Auxiliary Lanes .................................... 2.3.5.4Table 2.3.5.2 Right-Turn Taper with Parallel Deceleration Lane Design.............. 2.3.5.5Table 2.3.5.3 Grade Factors for Deceleration Length ......................................... 2.3.5.6Table 2.3.7.1 Design Widths for Turning Roadways at Intersections .................. 2.3.7.4Table 2.3.8.1 Approach and Departure Taper Ratios and Lengths for
Left Turns at Intersections ............................................................. 2.3.8.2Table 2.3.8.2 Bay Tapers - Straight Line ............................................................. 2.3.8.5Table 2.3.8.3 Bay Tapers - Symmetrical Reverse Curves ................................... 2.3.8.5Table 2.3.9.1 Parallel Lane and Taper Lengths for Transition between
Undivided Four-Lane Roadway and Two-Lane Roadway ............. 2.3.9.1Table 2.3.11.1 Minimum Median Widths for U-Turns .......................................... 2.3.11.3Table 2.3.12.1 Geometry/Capacity Relationships ............................................... 2.3.12.3Table 2.3.13.1 Allowable Difference Between Roadway
Gradient and Railway Cross-Slope ............................................. 2.3.13.3
Figures
Figure 2.3.1.1 Intersection Configurations ............................................................ 2.3.1.2Figure 2.3.1.2 Typical Traffic Movements Within an Intersection
and its Approach ........................................................................... 2.3.1.5Figure 2.3.1.3 Conflict Points and Collision Rates of Three-
and Four-Legged Intersections ..................................................... 2.3.1.7Figure 2.3.1.4 Conflict Areas at Intersections ....................................................... 2.3.1.8Figure 2.3.1.5 Prohibiting or Discouraging Turns at Intersections ...................... 2.3.1.10Figure 2.3.1.6 Cross Road Intersection Spacing Adjacent to Interchanges ....... 2.3.1.13Figure 2.3.1.7 Intersection Spacing / Channelization Treatment
at Diamond Interchanges ............................................................ 2.3.1.14Figure 2.3.1.8 Desirable Signal Spacing for Combinations
of Cycle Length ........................................................................... 2.3.1.16Figure 2.3.1.9 Intersection Analysis Procedure .................................................. 2.3.1.19Figure 2.3.2.1 Examples of Realignment of Intersections .................................... 2.3.2.3Figure 2.3.2.2 Fitting Minor Roadway Profiles to the Major Roadway
Cross Section ................................................................................ 2.3.2.5Figure 2.3.2.3 Pavement Cross Sections, Typical Minor Roadway
Profile Adjustment ......................................................................... 2.3.2.6Figure 2.3.2.4 Pavement Cross Sections, Adjustment of Cross-Slope ................ 2.3.2.7Figure 2.3.2.5 Cross-Slope Modification at Intersection of Two Roadways
of Equal Classification ................................................................... 2.3.2.9Figure 2.3.2.6 Pavement Cross Sections, Typical Adjustment of Profile and
Cross-Slope at Two Roadways of Equal Classification ............... 2.3.2.10Figure 2.3.2.7 Combined Vertical and Horizontal Alignments of Intersections ... 2.3.2.12Figure 2.3.2.8 Effect of Geometry on Intersection Collision Rates ..................... 2.3.2.14Figure 2.3.2.9 Relationship of Speed, Radius and Superelevation of
Intersections ................................................................................ 2.3.2.15

Geometric Design Guide for Canadian Roads
Page 2.3.1.5December 2009
Figure 2.3.1.2 Typical Traffic Movements Within an Intersectionand its Approach
123456789123456789123456789
12345678901234123456789012341234567890123412345678901234123456
123456

December 2009
Intersections
Page 2.3.1.6
Diverging and merging may be to the right, tothe left, mutual or multiple.
Crossings are termed “direct” if the angle ofintersection is between 70° and 110° (right-angled intersection) or “oblique” if the intersectionangle is less than 70° or greater than 110° (obliqueintersection).
Weaving consists of the crossing of trafficstreams moving in the same direction. It isaccomplished by a merging manoeuvrefollowed by a diverging manoeuvre. Weavingsections may be considered to be simple ormultiple with a further subdivision into one-sidedor two-sided weaving.
Conflicts
Every rural and urban at-grade intersection hasconflict areas. One of the main objectives ofintersection design is to minimize the severityof potential conflicts between all intersectionmanoeuvres.
A traffic conflict occurs whenever the pathsfollowed by vehicles diverge, merge or cross.
The number of traffic conflicts at intersectionsdepends on:
• the number of one-way or two-wayapproaches to the intersection
• the number of lanes at each approach
• signal control
• traffic volumes
• the percentage of right or left turns
As an example, Figure 2.3.1.31,6 shows conflictpoints for a T-intersection (three-legged) and across-intersection (four-legged). With theaddition of a single intersection leg, the numberof conflict points increases from 9 to 32. Thedifference in collision rates at three- and four-legged intersections is also illustrated onFigure 2.3.1.3. It is shown that as traffic volumeincreases, the role the increased number ofconflict points at a four-legged intersection playsin collision rate, becomes more significant.6 The
designer should be cautioned, however, that thenumber of conflict points for offset, or split T-intersection arrangements, as shown in Figures2.3.1.1 and 2.3.2.1, would not be 18 (2 x 9);instead the number of conflict points for this typeof intersection configuration (two T-intersections) would likely be larger than at asingle cross-intersection with 32 conflict points.
The conflict areas are divided into twocategories:
• major conflict areas where head-on, right-angle or rear-end collisions may occur
• minor conflict areas where sideswipecollisions may take place
Illustrations of traffic conflict areas are shownin Figure 2.3.1.4.1 It should be noted that the90o T- and cross-intersections have thesmallest conflict areas in comparison to theskewed cross-intersection and the multi-leggedintersection which have the largest.
Channelized intersections with auxiliary lanesfurther reduce the conflict area size and thenumber of vehicles passing through the sameintersection point by separating trafficmovements into definite paths of travel usingpavement markings and islands. For furtherinformation on channelized intersections, seeSection 2.3.6.
In urban environments especially, conflicts canalso occur between vehicles and pedestrians,and vehicles and bicyclists. Vehicles typicallyconflict with pedestrian crossing manoeuvres.Vehicles can conflict with any bicyclemanoeuvre. The 90° T- and cross-intersectionsare the most straightforward intersections forpedestrian and bicycle manoeuvres,channelization may increase vehicle/pedestrianconflicts as pedestrians attempt to cross theturning roadway.
Prohibited Turns
Prohibited turns can be discouraged by designingtight or extended curb returns which make itdifficult to achieve these turns. Channelizationis also used to restrict or prevent prohibited,undesirable or wrong-way movements. In

Geometric Design Guide for Canadian Roads
Page 2.3.1.7December 2009
Figure 2.3.1.3 Conflict Points and Collision Rates of Three- and Four-LeggedIntersections 1,6
123456789012345678123456789012345678123456789012345678123456789012345678123456789012345678123456789012345678123456789012345678123456789012345678123456789012345678123456789012345678123456789012345678123456789012345678123456789012345678123456789012345678123456789012345678123456789012345678123456789012345678123456789012345678123456789012345678123456789012345678123456789012345678123456789012345678123456789012345678123456789012345678123456789012345678123456789012345678123456789012345678123456789012345678123456789012345678123456789012345678123456789012345678123456789012345678123456789012345678123456789012345678123456789012345678123456789012345678123456789012345678
123456781234567812345678123456781234567812345678
9 conflict points 3 diverge 3 merge 3 cross
12121212

Intersections
Page 2.3.1.8 September 1999
Figure 2.3.1.4 Conflict Areas at Intersections 1
roundabout
������������
������������
������������
���������

Geometric Design Guide for Canadian Roads
Page 2.3.2.1September 1999
2.3.2 ALIGNMENT
2.3.2.1 Design Speed
The following is a discussion of design speedas it pertains to intersections. Chapter 1.2presents discussion on roadway design speed.
Rural
In a rural environment, the design speed of themajor roadway is used for the main intersectionapproaches to determine taper lengths,deceleration and acceleration lengths, and othergeometric features specific to traffic on themajor roadway.
Design speed is typically not reduced at ruralintersections where drivers are accustomed tolong periods of uninterrupted travel. Inattentivedrivers should be alerted to the fact that anintersection is ahead and should have enoughtime to react accordingly by providing adequatedeceleration and acceleration lengths, etc. forthe design speed.
Urban
In general, it is desirable to maintain the designspeed of a roadway as it passes through anintersection, particularly for a roadway wherethe traffic has or may have the right of waythrough the intersection. Examples of thissituation are:
• an intersection controlled by traffic signalsor which may be controlled by signals inthe future
• a major road crossing a minor road wherethe minor roadway has a stop or yieldcontrol, and the major roadway is notcontrolled
• an uncontrolled intersection
For an urban roadway controlled by a yield signat an intersection, approach speeds in the orderof 25 km/h are common. A suitable designspeed for such an approach roadway within thezone of the intersection would be 35 km/h.
Where traffic on a minor roadway is, and willlikely always be, controlled by a stop sign at anintersection, the design speed of the minorroadway can be reduced through theintersection area. As a basic requirement, it isimportant to provide sufficient sight distance forthe design vehicle to safely depart from thestopped position and make the desiredmanoeuvre through the intersection.
If a design speed equal to or greater than theexisting posted speed cannot be achievedthrough an intersection, changes to the postedspeed, the implementation of speed advisorysigning or similar treatment should beconsidered. Sound judgement is called for inselecting the design elements that meet theexpectations of the driver.
2.3.2.2 Horizontal Alignment
Intersections are ideally located on tangentsections. Location of intersections on curves isnot desirable due to decreased visibility,increased conflict potential for vehicles crossingthe major roadway, and complications withroadway superelevation and pavementwidening on curves. Intersections on curves arediscussed further in Subsection 2.3.2.5.
It is desirable that intersecting roads meet at,or nearly at, right angles.
The benefits of a 90° angle of an intersectionare:
• reduced size of conflict area (seeFigure 2.3.1.4)
• improved driver visibility
• more favourable condition for drivers tojudge the relative position and relativespeed of an approaching vehicle and todecide when to enter or cross the majorroad
• reduced length of time of a crossingmanoeuvre
• general decrease in severity of collisions(collisions occurring at an impact angle of

Intersections
Page 2.3.2.2 December 2009
90° are generally less severe than thoseoccurring at angles of greater than 90°)1
While crossing at 90° is preferable in mostcases, it is occasionally necessary and evenadvantageous to skew the crossing (forexample, to favour a heavier turningmovement). However, angles less than 70°andgreater than 110° are typically not desirable. Forexample, at a skewed T-intersection with anangle less than 70° certain undesirableconditions exist because of the flat angle ofentry. Vehicles which do stop are standing in aposition that affords poor visibility for the driverto judge the speed and the distance ofapproaching vehicles on the major roadway.Also, for a skew right, vehicles leaving the majorroadway to enter the minor roadway with a rightturn are encouraged to do so at high speedsand for a skew left, drivers tend to cut the cornerat higher speeds, thereby travelling in theopposing lane for a considerable distance andcreating a safety concern.1
Particular consideration should be given tomaintaining an angle of skew within 10° of rightangle (i.e. between 80° and 100°), when any ofthe following conditions exist:
• two minor roadways with design hourvolume (DHV) greater than 200 v/h (on bothroadways) intersect
• minor roadway with DHV greaterthan 200 v/h intersecting with a major road
• two major roads intersect
• either of the intersecting roadways hasmore than two basic lanes
• sight distance is at a minimum
• design speed on either intersectingroadway for through traffic is greater than80 km/h1
In the case of existing roads that intersectbetween 70° and 80° (or 110° and 100°) withno collision or performance concerns, arealignment to 80° (or 100°) may not be costeffective.
The practice of realigning roads intersecting atacute angles in the manner shown inFigure 2.3.2.1 (A and B) is beneficial. Ideally,the curves used to realign the roads would avoida decrease in operating speed along therealigned roadway. The practice of constructingshort radii horizontal curves on minor roadwayapproaches to achieve right-angle intersectionsmay be acceptable but not necessarily desirablein the urban and rural settings. These curvesresult in increased lane infringements becausemotorists tend to drive flatter curves byencroaching on a portion of the opposite lane.Also, the traffic control devices at theintersection may be obscured resulting in theneed for the installation of advanced warningsigning.11
It should be noted that although examples Cand D on Figure 2.3.2.1 provide poor networkcontinuity, both examples may be acceptablealternatives. If implemented, suitable physicalbarriers or other obstructions should be placedacross the former right of way of the minor road.These visual obstructions are desirable to alertthe driver on the minor road that the road isrealigned and is no longer on continuous tangentthrough the intersection. Assuming a four-laneundivided arterial road, the splitT-intersection arrangement, example C (offset-right), introduces back-to-back left turns on themajor roadway, which are generally undesirableunless left-turn auxiliary lanes can be provided.This layout, however, has the advantage ofrequiring the driver, wishing to cross the majorroad, to select a gap in only the trafficapproaching from the left, and then make aconventional right turn followed by a left-handmerge manoeuvre to reach the left-turn auxiliarylane. However, if no left-turn lane is provided,vehicles travelling along the minor roadway mayhold up traffic while waiting for a gap to turn left.With example D (offset-left), the turns introducedon the major roadway by the minor roadwaycrossing manoeuvres are right turns only, whichminimize the impact on through traffic on themajor roadway. However, the driver attemptingto cross on the minor roadway is required toselect coincidental gaps in the traffic streamsfrom both directions on the major roadway.Moreover, the driver is required to makeright-hand merge manoeuvres on the major

Geometric Design Guide for Canadian Roads
Page 2.3.2.13December 2009
operating conditions. If such combinations areencountered, the intersection is normallyrelocated or improved through realignment ofone or both of the intersecting roads, to improvesafety. If the combined horizontal and verticalalignment of the intersection creates poorvisibility of the intersection, advance warning ofupcoming intersections should be providedthrough appropriate signing.
The bar charts shown on Figure 2.3.2.86 illustratethe differences in the relative collision ratesbetween tangent roads both with and withoutintersections and curved roads with intersectionsand with intersections on grade.
In all cases, the provision of appropriate sightdistances is important to promote collision freeoperation. The combination of horizontal andvertical geometry at an intersection shouldproduce traffic lanes that are visible to the driverat all times and provide a clear definition of thedesired path of any permitted turn or directionof travel.
2.3.2.5 Reduced SuperelevationThrough Intersections
The general controls and considerations thatdetermine the maximum rates of superelevationfor through roadways discussed in Chapter 2.1also apply to roadway sections withintersections. However, within an intersection,drivers anticipate and accept operation withhigher lateral friction than they do midblock,especially in an urban environment. As such,lower rates of superelevation can be used oncurves through intersections.
Typical maximum superelevation rates (emax
)used at intersections are:
• rural areas: emax
= 0.04 m/m to 0.06 m/m
• urban areas: emax
= 0.02 m/m to 0.08 m/m
The application of emax
is discussed in detail inChapter 2.1.
Figure 2.3.2.9 illustrates a suggestedinterrelationship between speed, lateral frictionand superelevation for roadways through
intersections. The superelevation values arebased on the lateral friction factors fromChapter 2.1. Each speed has a constant frictionfactor; the variables are radius andsuperelevation.
The following illustrates the use ofFigure 2.3.2.9:
1. An intersection is located on a curvedroadway with a 200 m radius curve and adesign speed of 70 km/h. A superelevationrate is required to allow proper operationof the major through roadway.
2. Chapter 2.1 shows 0.059 m/msuperelevation required for e
max = 0.06 m/m.
This would be inappropriate for anintersection. Figure 2.3.2.9 shows that thenormal rate of superelevation through theintersection can be safely reduced to aminimum 0.023 m/m. Given this situation,the occupants of the vehicles will feel somedecrease in comfort due to increasedcentrifugal force.
The principles of superelevation runoffdiscussed in Chapter 2.1 for open roadwayconditions apply generally to intersections oncurves. The controls for the rate of change ofcross-slope are primarily those of comfort andappearance, and vary with the design speed.As the design speed is reduced the length overwhich a change in superelevation can be madeis also reduced. Design values for rates ofchange of cross-slope are shown inTable 2.3.2.1.
Superelevation commensurate with curvatureand speed is seldom practical throughintersections and at the terminals of turningroadways. In some cases, the followingsolutions can be used:
• the through curving roadway cross sectionis widened at the intersection (seeChapter 2.1)
• the normal cross-slope of the throughpavement is retained through theintersection

Intersections
Page 2.3.2.14 September 1999
Figure 2.3.2.8 Effect of Geometry on Intersection Collision Rates6

Geometric Design Guide for Canadian Roads
Page 2.3.4.7December 2009
Two-Centred Compound Circular Curve
The two-centred compound curve is thepreferred design for all types of large trucks andusually fits the minimum inside sweep of adesign tractor trailer combination adequately.Although a three-centred curve better fits theinside sweep of a tractor trailer combination, anumber of benefits to using a two-centred curveover a three-centred curve have been identified:
• less pavement area for two-centred curvesthan for three-centred curves
• intersecting road vehicles are forced toproceed slowly with two-centred curves
• stop sign can be placed closer to theintersecting road centreline (more visible)with two-centred curves
• two-centred curve design tends to be moreeconomical
In addition, a two-centred curve may be usedto lay out the right edge of pavement for vehiclesmaking a right turn from the minor roadway anda three-centred curve could be used for the rightshoulder for vehicles making a right turn fromthe major roadway.
Figure 2.3.4.51 illustrates the application, symboland nomenclature of the two-centredcompound circular curve elements.
For large tractor trailer combinations therecommended radii combination should bechecked with the appropriate template andadjusted if necessary. The clearance betweenthe inner rear wheel and the edge of pavementshould be 0.5 m preferably and not less than0.25 m. When applying the template the vehicleshould be properly positioned within the trafficlane at the beginning and end of the turn andthe inner rear wheel path should clear the curvewith the indicated minimum clearance. Theapplication of the design vehicle template isdescribed in Chapter 1.2.
When facilitating large trucks in non-industrialareas, consideration should be given tochannelization to avoid large paved areas thatmay be confusing to a driver and difficult to
control in terms of orderly movement ofvehicles.
When pedestrians are a consideration at asignalized wide open-throat intersection the“walk” and clearance times may be affected,hence provision of adequate service andprotection for pedestrians may be required.1
Three-Centred Compound Circular Curve
To fit the edge of pavement closely to theminimum inside sweep of a tractor trailercombination, the application of a symmetricalarrangement of three-centred curves hasproven advantageous. This design is thepractical equivalent to a curve transition for mostor all of its length. A three-centred curve istypically used at a major intersection withexclusive left- or right-turn lanes. In anoperational sense, it is superior to the minimumcircular arc design because it better fits the innerrear wheel turning path of a tractor trailer, whileproviding some margin for driver error andrequiring less pavement.
Three-centred curve design for angles of turnmore than 90o may result in unnecessarily largepaved intersections, portions of which are oftenunused. This situation may lead to confusionamong drivers and present a hazard topedestrians. These conditions may be alleviatedto a considerable extent by the use ofasymmetrical three-centred compound curves,or by using large radii, coupled with cornerislands. In Figure 2.3.4.610 the elements ofthree-centred symmetric/asymmetriccompound curves are illustrated.
The two-centred curve provides for tractor traileroff-tracking, however, there is not as much roomfor driver error as there is on the three-centredcurve.
The use of a two-centred curve is permitted insituations where a three-centred curve wouldnormally be used, but cost to purchase extraright of way is extreme or where surroundingroadway geometrics do not allow for theapplication of a three-centred compoundcurve.10

Intersections
Page 2.3.4.8 September 1999
Figure 2.3.4.5 Edge of Pavement Design – Two-Centred Compound Curve1

Geometric Design Guide for Canadian Roads
Page 2.3.4.9September 1999
Figure 2.3.4.6 Edge of Pavement Design - Three-Centred Compound Curve10

Intersections
Page 2.3.4.10 December 2009
2.3.4.4 Shoulders at SimpleIntersections
An urban cross section with barrier curb doesnot typically include shoulders. However, whereshoulders are provided, they are paved andmountable curb and gutter is used.
The rural roadway at intersections includesshoulders or equivalent lateral clearanceoutside the edges of pavement. A shoulder atintersections is provided for the same reasonsas that for the open roadways. It is an areaadjacent to the driving lane where a driver canmake a stop in case of an emergency. It canalso provide width for the occasional oversizedvehicle and may be used as a bypass lane foremergency vehicles.
Due to improper vehicle operations, shouldersat intersections are subject to deterioration at afaster rate than along open roadways. Edge ofpavement drop-off and gravel strewn onto thepavement are main concerns which requirefrequent inspection and maintenance. Thissection deals with shoulder treatment atintersections designed to minimize theseconcerns.
At intersections the required shoulder widthvaries from a minimum of 0.5 m to that equalto the open roadway shoulder width. Where tworoads of different operational characteristics andfunctions intersect, the shoulder width at theintersection normally varies and serves as atransition from a wide shoulder on the mainroadway to a narrow shoulder on the minorroadways.
Where the major roadway is designed withauxiliary lanes, the shoulder width from themajor roadway to the minor roadway istransitioned along the arc length of the edge ofpavement curve.
For the far side of the major roadwayintersection, the shoulder width of the minorroadway is extended along the arc length of theedge of pavement and transitioned to theshoulder width of the main roadway within the30 m recovery taper length, as shown inFigure 2.3.4.7.1
A uniform intersection shoulder width isdesigned where the intersecting roadways areof similar importance.
There are three types of shoulder treatmentsat simple rural intersections:
• gravel shoulders (rural)
• paved shoulders (rural)
• concrete curb and gutter (rural and urban)
Each type of shoulder treatment is applied atintersections with or without tapers ordeceleration lanes.
Edge of pavement delineators may be used inconjunction with either gravel or paved shouldertreatment at intersections. Generally, theapplication of delineators is discouraged as theyare often damaged or destroyed by turningvehicles and their effectiveness is greatlyreduced. They also cause maintenanceproblems during snow removal operations.However, delineators may provide a guidanceto the drivers exiting and entering the roadwayat locations with restricted visibility and duringpoor weather conditions.
Shoulder treatment at intersections should beevaluated and designed for each location basedon existing and anticipated future traffic volumesand operational considerations.
Gravel Shoulders
Shoulder treatment at intersections is usuallyachieved by surfacing the shoulder with gravel,see Figure 2.3.4.81. However, unstabilizedshoulders generally undergo consolidation withtime and the elevation of the shoulder at thepavement edge tends to become somewhatlower resulting in pavement drop-off. Alsoturning manoeuvres contribute to graveltracking onto the pavement area. As such,gravel shoulders in intersection areas requireregular maintenance.
Paved Shoulders
At intersections, drivers of large truckssometimes cut across the shoulder when

Geometric Design Guide for Canadian Roads
Page 2.3.5.3September 1999
Figure 2.3.5.2 Typical Right-Turn Taper Lane Design at Cross-Intersections1
Figure 2.3.5.1 Typical Right-Turn Taper Lane Design at T-Intersections1

Intersections
Page 2.3.5.4 December 2009
2.3.5.4 Design Elements forRight-Turn Tapers withAuxiliary Lanes
The length of an auxiliary lane is based ondeceleration and storage requirements.
Deceleration should occur exclusively within theauxiliary lane, although in an urban environmentdeceleration (up to 15 km/h) over the bay taperis normally tolerable (especially in a peak-hourcondition).
Suggested taper and parallel lengths are shownon Table 2.3.5.2 and illustrated onFigure 2.3.5.3. Adjustments for intersections oncurves are discussed in Subsection 2.3.8.8.
Auxiliary lanes can be developed using reversecurves or straight line tapers; reverse curvesare typically used in an urban environment withcurb and gutter.
On high-speed roads the taper length to theauxiliary lane should generally conform to thatdiscussed in Section 2.4.6 - Interchange Ramps.
Where auxiliary lanes are used for the storageof turning vehicles at unsignalized intersections,the length of the lane in addition to decelerationlength and exclusive of taper, is usually basedon the number of vehicles that are likely toaccumulate in two minutes (2 min). The storagelength required is calculated by the followingformula and can be used for right- or left-turningvehicles:
(2.3.3)
Where: S = storage length (m)
N = design volume of turningvehicles (v/h)
L = length (m) occupied by eachvehicle (see Chapter 1.2)
At signalized intersections, the storage lanelength should accommodate about 1.5 timesthe average number of vehicles to be storedper cycle for roadways with design speeds of60 km/h or less, and about twice the averagenumber of vehicles for design speeds greaterthan 60 km/h.
The storage length calculated above shouldbe checked against capacity analysis to ensurean acceptable level of service.22
The required storage for two-lane operation isone half that for a single-lane operation.
Where there is a possibility that an auxiliarylane may be used for either storage ordeceleration, the length is determined for bothconditions and the total is used in design. Forurban and suburban roads, the left-turn lanelength tends to be used mainly for storageduring peak hours (typically slower peak hourspeeds require less length for deceleration)and mainly for speed change at off-peak hours(the queue length tends to be smaller but thespeed in off-peak tends to be greater). Forauxiliary lane widths, refer to Chapter 2.2.
Table 2.3.5.1 Right-Turn Tapers Without Auxiliary Lanes
Design Speed (km/h)(through roadway)
Taper Ratio Taper Length forw = 3.5 m (m)
Horizontal Curve(a), (R)(m)
50607080
15:118:121:124:1
53637484
500750
10001200
Note: a) Flat radii as indicated can be used rather than tangent alignments, for right-turn tapers.
30
NLS =

Geometric Design Guide for Canadian Roads
Page 2.3.6.3December 2009
2.3.6.3 Guidelines for theApplication ofChannelization
Channelization may also be implemented forany of the functions described inSubsection 2.3.6.1.
Guidance in determining the need forchannelization is also provided in otherpublications.22
2.3.6.4 Right-Turn Designs
The right-turn channelization volume warrantpresently in use is approximately 60 v/h. Mostof the research in this area has been limitedand consequently difficulties in developingapplicable criteria exist.1
Figure 2.3.6.1 illustrates the typical layout anddimensions for four types of right-turn designs:stop, yield, merge and added lane. The form oftraffic control should be selected to suit thedesign and to minimize conflicts between right-turning vehicles, and left-turning and throughvehicles.
Stop Design
The right-turn design for a stop condition at anintersection normally consists of a simple radiusand does not require channelization.
Information on right-turn designs with simpleradii is provided in Section 2.3.4 and 2.3.5 ofthis Guide.
Yield Design
At major intersections, such as arterial/arterialor collector/arterial intersections, or withinindustrial areas, the right-turn design for a yieldcondition is typically a three-centred curve withsufficient radii to provide a small island. Inindustrial areas with minimal pedestrian activity,the raised island is normally omitted to providemore manoeuvring area for large turning trucks.The three-centred curve may be preceded onthe approach leg by either a right-turn auxiliarylane or a taper. Turning roadways areaddressed in Section 2.3.7. The auxiliary lane
design is more common in urban areas and istypically applied in consideration of capacity andstorage requirements.
At the intersection of two local roads or a localand a collector road, particularly in residentialareas, the right-turn design for a yield conditioncould be a simple radius without an island.
Merge Design
Merge right-turn designs are applicable forconditions where a turning speed of greater than40 km/h is desired at the intersection forcapacity or operational reasons. Designs of thistype are normally used at freeway andexpressway ramp terminals, and forconnections onto high-speed arterials. Theapplication of the merge design is also afunction of volume. If the merging volumes aretoo high, the result can be congestion, in whichcase an added lane design is preferred.
The turning roadway (see Section 2.3.7) isintroduced by a right-turn auxiliary lane and/ora tapered approach, which provides thenecessary deceleration characteristics.
Added Lane (Lane Away) Design
The added lane (lane away) right-turn designis normally for high volume right-turningmovements. This design is also appropriate atan intersection where an auxiliary lane isintroduced for access purposes, as discussedin Chapter 3.2.
If the added lane is an auxiliary lane used foraccess purposes, radii providing lower turningspeeds, 40 km/h or less, are suitable. Wherethe added lane is an additional through lane ona high-speed road, the right-turn design canvary substantially. Where no right of way,physical constraints or intersection spacinglimitations are present and there are nopedestrian crossing considerations, the rightturn is often designed to minimize the speeddifferential between the vehicles on the adjacentthrough lane and the turning vehicles on theadded lane at the convergence point.

Intersections
Page 2.3.6.4 September 1999
Figure 2.3.6.1 Typical Right-Turn Designs

Geometric Design Guide for Canadian Roads
Page 2.3.6.5December 2009
2.3.6.5 Traffic Islands
General
An island is a defined area between traffic lanesfor control of vehicle movements in intersectionareas or for pedestrian refuge. Islands may beraised areas or may be painted. In rural areasthe two most desirable and commonly usedtreatments are the raised island with mountablecurbs and the painted island. In urban areasbarrier curbs are used to protect pedestriansand to reduce the risk of vehicles striking poles,etc.
Delineation and approach end treatment iscritical to good channelization design. Islanddelineation can be divided into the followingtypes:
Curbed Islands
This type can be applied universally andprovides the most positive traffic delineation.Mountable curbs should be used in most cases.In rural areas where curbs are not common,this treatment is often limited to islands of smallto intermediate size. Pedestrian refuge islandsare usually protected with barrier curb.
Painted Islands
This type of island is generally designed inurban or suburban areas where speeds are lowand space is limited. Application of this type ofisland may be considered in rural areas inadvance of raised median island, wheremaintenance and snow removal make curbsundesirable, and where high approach speeds(urban or rural) make a curb a potential hazard.However, snow accumulation can obliteratepavement markings.
Non-Paved Areas Formed by PavementEdges
This type of island is usually used for largerislands at rural intersections where there issufficient space and/or where added expenseof curbs may not be warranted or may pose atraffic hazard. This island type may besupplemented by delineators on posts, other
guide posts, a mounded earth treatment orappropriate landscaping.
Temporary Island Installations
This type is usually constructed of asphaltcurbing, precast bumper curbing or sand bags1.Such islands would typically be used inconstruction work zones.
Islands are grouped into three functionalclasses which are illustrated on Figures 2.3.6.21,2.3.6.31 and 2.3.6.41 and are described below:
Directional
Directional islands control and direct trafficmovements. They guide the driver into theproper channel for the intended route.Directional islands are of many shapes andsizes, depending upon conditions anddimensions. A common form is one of triangularshape to separate right-turning traffic fromthrough traffic.
Divisional
Divisional islands, also called raised medianislands, are introduced at intersections, usuallyon approach legs, to separate streams of traffictravelling in the same or opposite direction.These islands are particularly advantageous incontrolling left turns at skewed intersections andat locations where separate channels areprovided for right-turning traffic.
Two types of divisional islands are commonlyused:
• opposing divisional islands (for T-intersections)
• offset divisional islands (for cross-intersections)
These islands are shown on Figures 2.3.6.51
and 2.3.6.6.1
Where the roadway is on a tangent, reverse curvealignment is necessary to introduce dividingislands. In rural areas where speeds are high,reversals in alignment should have radii of atleast 2000 m. A median on an approach leg may

Intersections
Page 2.3.6.6 September 1999
Figure 2.3.6.2 Directional Islands1

Geometric Design Guide for Canadian Roads
Page 2.3.8.11December 2009
lane. The lane, median and gutter widths shownare typical and vary in accordance with crosssection requirements.
The raised median, protecting the left-turn area,is effective in clearly defining the through vehiclepaths and the left-turn storage area in allweather conditions. Also, if accesses exist inclose proximity to the intersection, the raisedmedian reduces the type and number of turning-vehicle conflicts within the zone of theintersection. However, in instances where thelength available for the left-turn auxiliary lanemay not be sufficient to store all the left-turnvehicles during peak periods, it is advantageousto use a painted rather than a raised medianarea in advance of the left-turn lane. In this case,the painted median area can be used to provideadditional storage during occasional peak trafficperiods, reducing the problem of left-turningvehicles blocking the through lanes.
The approach and departure taper designs area function of the design speed of the roadway.For high-speed roads (design speeds>70 km/h), the importance of using a gradualtaper cannot be over emphasized. Refer toTable 2.3.8.1 for approach and departure tapergeometry with design speed.
The characteristics of each of the three methodsof introducing a median, as shown onFigure 2.3.8.7, are described in the followingparagraphs.
Method “A” illustrates the geometry for a medianintroduced totally to the left of the roadwaycentreline. A lateral shift is not required for thetraffic approaching the intersection. For thiscondition to occur on both approaches to asingle intersection, the centrelines of theapproach roadways must be offset from eachother. Although this is a desirable means ofintroducing a median, it is a rare case, occurringonly where excess right of way is available,where the roadways are not centred within theright of way, or where the rights of way are offsetappropriately across the intersection. In thismethod, only the lanes leaving the intersectionare required to taper back to the normalundivided roadway cross section. The departuretaper typically commences at the beginning of
the parallel lane portion of the left-turn lane, tominimize the median length.
Method “B” shows the centreline continuousthrough the intersection and the roadwaywidened symmetrically. In this method, thedeparture taper is continued beyond theapproach taper, enabling the nose of theintroduced median to be on the left side of theroadway centreline on the approach. Thegeometry results in a longer median length thanthat created by Methods “A” or “C”.
Method “C” is similar to Method “B” in that theroadway is widened symmetrically about thecentreline. The departure taper commencesnear the beginning of the parallel lane portionof the left-turn lane to reduce the median length.The approach nose to the median is centredon the roadway centreline.
Divided Roadway
Figure 2.3.8.8 illustrates a typical layout of a left-turn lane and a right-turn lane along a dividedroadway. The right-turn lane layout is alsoapplicable to undivided roadways.
Left-Turn Slip-Around Treatment atT-Intersections
A left-turn slip-around can be introduced on atwo-lane roadway at T-intersections under thefollowing conditions:
• where the left-turning volumes do notwarrant a full left-turn lane but are sufficientto potentially affect through traffic
• where through vehicles bypassingoccasional left-turning vehicles throw gravelfrom the shoulder onto the roadway
The slip-around design is comprised of anauxiliary lane and tapers at each end, as shownin Figure 2.3.8.91. See Subsection 2.3.8.3 fortaper lengths.
Usually the slip-around design is not appliedon four-lane undivided roadways; however,where the left-turn lane is not warranted andturning vehicles impede the through traffic, theslip-around has its merit.

Intersections
Page 2.3.8.12 September 1999
Figure 2.3.8.8 Turning Lane Design, Raised Median

Geometric Design Guide for Canadian Roads
Page 2.3.8.21September 1999
Figure 2.3.8.15 Triple Left-Turns19

Intersections
Page 2.3.8.22 December 2009
e) Approach and Departure Lane Widths
Left-turn approach lane widths used at a tripleleft-turn have been at least 3.3 m. Similarly,downstream departure lane widths have beendesigned to an absolute minimum of 3.5 m witha desirable width of 3.7 m. A key factorcontrolling the geometry of the downstreamreceiving throat width is the tracking path of thedesign vehicle as it transitions from a circularto a tangential motion. The tracking pathapproximates a spiral as the design vehiclecompletes the left-turn movement. Therefore,the width of the clear portion of the intersectionmay need to be widened based on the designvehicle turning characteristics. The turninggeometry may be accommodated by setting themedian island nose on the receiving crossingroadway a significant distance back from theintersection. A 0.6 m offset from the vehicleturning path in Lane 1 has been used in locatingthe median island nose. The receiving roadwaywidth at the intersection may also be widenedby increasing the curb return radius of theopposite intersection quadrant. Thesegeometric adjustments have to be carefullyevaluated for the intersection angle androadway widths. Due to the high volumes ofvehicle traffic, raised median islands of at least0.6 m width (1.5 m desirable) should be usedon the approach and departure legs of anintersection with two-way traffic. Wider roadwaymedian islands provide the intersection withlarger radius curves thus improving theintersection’s left-turning geometry. A raisedmedian island has been found to provide adriver in Lane 1 with a visual point of referenceto guide a vehicle through the left-turnmanoeuvre. A raised median island alsoprovides delineation for the stop bar locationon the receiving roadway. This is especiallyimportant when the left-turn lane stop bar isoffset from the through movement toaccommodate triple left-turn lane geometry.
f) Auxiliary Lane and Taper Length
These are determined as per single and doubleleft-turn lanes. The total storage capacity of alllanes should be considered as well asdeceleration lengths.
g) Roadway Delineation and SignageConsiderations
Even though intersection geometry may beadequate to accommodate three-abreast left-turn movements, roadway delineation andsignage are equally important to the safeoperation of the facility. Advance overheadsignage of the triple left-turn lane configurationis a critical element to inform motorists of theintersection and lane options. Turn lanes andpaths should also be clearly delineated to avoiddriver confusion.
h) Summary
As with all geometric designs, site-specificconditions must be reviewed and goodengineering judgement applied to each designof triple left-turn lanes. As more facilities areconstructed and used by the motoring public,additional research should be conducted toinclude topics such as:
• collision rate comparisons between dualand triple left-turn lane installations
• lane utilization
• determination of saturation flow rates fortriple left-turn lanes
• a comparison of left-turn capacity amongsingle, double and triple turn lanes
• the effects of downstream weaving on theuniform loading of triple left-turn storagebays and intersection left-turn capacity
19
2.3.8.7 Slot Left-Turn Lanes
General
Slot left-turn lanes may be provided atintersections along major arterial roads orexpressways wherever a median of about10.8 m or more in width is available. This widthis needed to accommodate a divisional islandbetween the left-turn lane and the adjacentthrough lane. Typical designs are shown onFigure 2.3.8.16. The major advantages are:
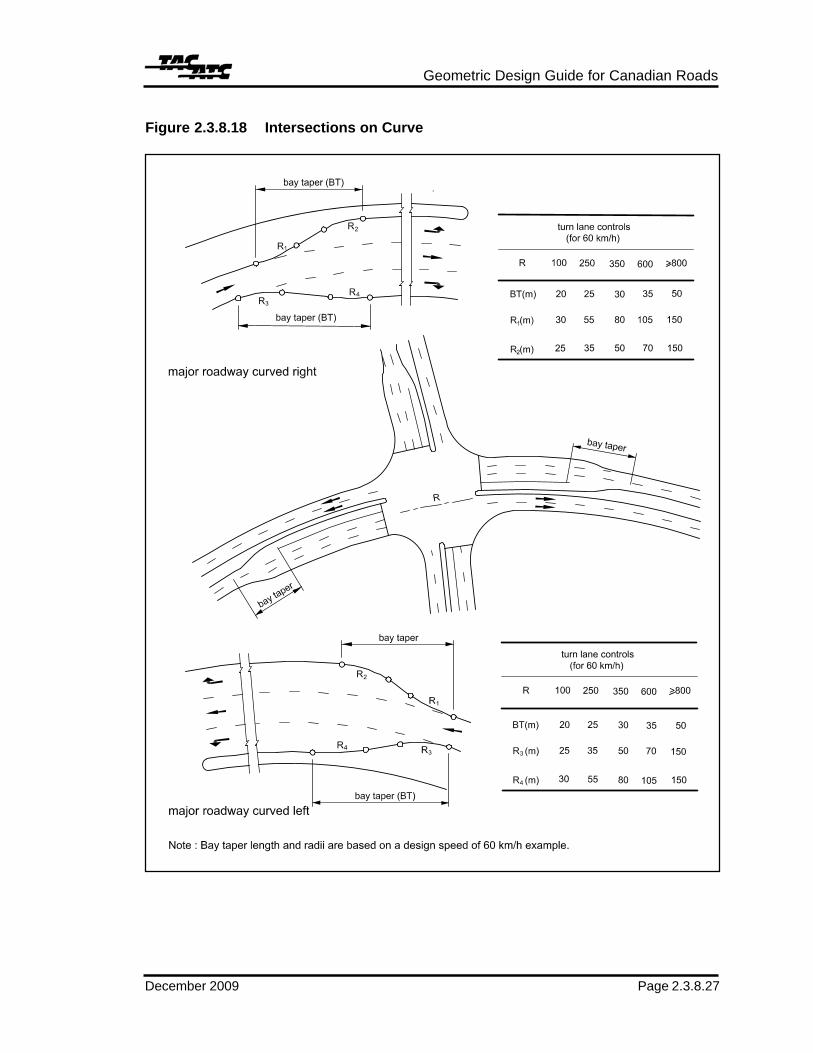
Geometric Design Guide for Canadian Roads
Page 2.3.8.27December 2009
Figure 2.3.8.18 Intersections on Curve
12341234

Intersections
Page 2.3.8.28 September 1999
Figure 2.3.8.18 depicts shorter tapers withasymmetrical smoothing curves. The samecriteria for adjusting taper lengths for curvilineartapers can be applied to straight-line taperdesigns for turn lanes on the outside of mainline curves. With the straight-line taper design,however, shortening the taper on the inside ofthe main line curve is not necessary. The startof the auxiliary lane on the inside of the curveremains distinctive due to the absence of thesmoothing curve.
Alternatively, some jurisdictions lengthenstraight-line tapers along the inside of main linecurves to provide the same rate of lateral shiftfrom the main line as that provided in a normaltangent section.
Superelevation
The maximum superelevation suggestedthrough an urban intersection area is 0.04 m/m.This allows reasonably smooth operation for
turning vehicles, especially those turningagainst the superelevation. The superelevationrate on an auxiliary lane at an intersection curveis normally the same as that of the throughlanes. In restricted areas, it may beadvantageous to reduce the superelevationalong the auxiliary lane (as compared to thethrough lane) reflecting the lower runningspeeds of the turning vehicles on the auxiliarylane.
At intersections controlled with traffic signals,reduced superelevation rates may beconsidered along the curved roadway toimprove the profile for the through vehicles onthe cross roadway. For reduced superelevationrates, as related to radius of curve and designspeed, based on maximum lateral frictionfactors see Chapter 2.1. It provides an alternatemethod of selecting superelevation rates basedon lower maximum lateral friction factors, whichprovides greater protection against skiddingduring slippery pavement conditions.
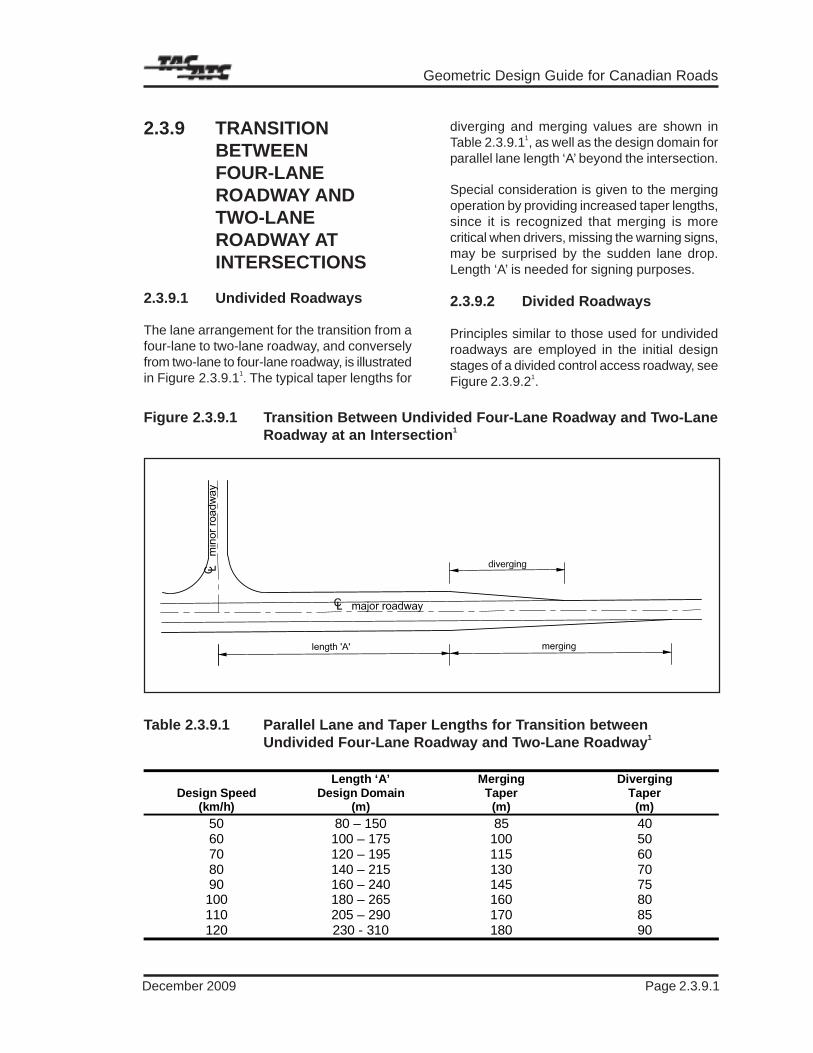
Geometric Design Guide for Canadian Roads
Page 2.3.9.1December 2009
2.3.9 TRANSITIONBETWEENFOUR-LANEROADWAY ANDTWO-LANEROADWAY ATINTERSECTIONS
2.3.9.1 Undivided Roadways
The lane arrangement for the transition from afour-lane to two-lane roadway, and converselyfrom two-lane to four-lane roadway, is illustratedin Figure 2.3.9.11. The typical taper lengths for
diverging and merging values are shown inTable 2.3.9.11, as well as the design domain forparallel lane length ‘A’ beyond the intersection.
Special consideration is given to the mergingoperation by providing increased taper lengths,since it is recognized that merging is morecritical when drivers, missing the warning signs,may be surprised by the sudden lane drop.Length ‘A’ is needed for signing purposes.
2.3.9.2 Divided Roadways
Principles similar to those used for undividedroadways are employed in the initial designstages of a divided control access roadway, seeFigure 2.3.9.21.
Length ‘A’ Merging DivergingDesign Speed
(km/h)Design Domain
(m)Taper
(m)Taper
(m)
50 80 – 150 85 4060 100 – 175 100 5070 120 – 195 115 6080 140 – 215 130 7090 160 – 240 145 75100 180 – 265 160 80110 205 – 290 170 85120 230 - 310 180 90
Table 2.3.9.1 Parallel Lane and Taper Lengths for Transition betweenUndivided Four-Lane Roadway and Two-Lane Roadway1
Figure 2.3.9.1 Transition Between Undivided Four-Lane Roadway and Two-LaneRoadway at an Intersection1

Intersections
Page 2.3.9.2 December 2009
123123123123123123123123123123123
mer
ging
‘B’
Figure 2.3.9.2 Transition between Four-Lane Divided and Two-Lane Roadway Merge1

Geometric Design Guide for Canadian Roads
Page 2.3.11.1December 2009
2.3.11 MEDIAN OPENINGS
2.3.11.1 Use and Function
Openings in medians perform one of thefollowing functions:
• accommodate cross traffic and left-turnmovements at intersections
• permit left turns for access to adjacentdevelopment at locations other thanintersections (such development normallyhas significant traffic generation or otherspecial characteristics)
• permit U-turns on divided roadways atlocations other than intersections
The use and function of median openings arerelated to road classification.
Median openings are generally not providedalong freeways except for accommodation ofU-turns for emergency and maintenancevehicles. Along major divided arterials with fullycontrolled access, median openings arenormally provided only at the intersections. Fordivided arterials where the provision of accessto adjacent developments is only partiallycontrolled, median openings may be providedat entrances to major developments, such asshopping centres, which generate significanttraffic volumes (refer to Chapter 3.2). Theprovision of median openings may also beconsidered for other developments, such asshipping terminals, which generate significantvolumes of large trucks. Such vehicles aretypically discouraged from making U-turnmovements within the road network and medianopenings may be a preferred means ofproviding access where other alternatives arenot possible. The spacing of the medianopenings normally conforms to the intersectionspacing guidelines provided in Section 2.3.1.
Where intersections along divided arterials arewidely spaced and access to adjacentdevelopment is permitted, median openings that
safely accommodate only U-turn movementsmay be desirable to improve access.
In certain circumstances, median openings orcrossings may be provided to allow emergencyvehicles to exit from adjacent fire, police andambulance facilities, or to make turns that areotherwise prohibited at intersections. On dividedarterial roads with widely spaced intersectionsand controlled access, median openings topermit only emergency vehicles to make U-turnmovements may also be desirable.
2.3.11.2 Elements of Design
The design of a median opening and medianends should be based on traffic volumes,adjacent land use and the type of turningvehicles, as discussed in Chapter 1.2. Crossingand turning traffic should operate in conjunctionwith the through traffic on the divided roadway.As such, it is necessary to know the volumeand composition of all movements occurringsimultaneously during the design hours.12 Thedesign of a median opening becomes a matterof considering what traffic is to beaccommodated, choosing the design vehicle touse for layout controls for each through andturning movement, investigating whether largervehicles can turn without undue encroachmenton adjacent lanes, checking the intersection forcapacity, and evaluating the potential foroperational problems related to undesirabledriving behaviour. If the capacity is exceededby the traffic load, the design should beexpanded, possibly by widening or otherwiseadjusting widths for certain movements.
The length of the median opening, measurednose to nose, is normally a function of themedian width, the turning paths of the designvehicles making the left turn from and to thecrossing roadway, and the location of thepedestrian crossings. If U-turns are permittedat the median opening, additional length maybe required to avoid conflicts. The bullet nosedesign is advantageous in reducing the lengthof the median opening, thereby bringing theraised median end in close proximity to thepedestrian crossing and making it available forrefuge.

Intersections
Page 2.3.11.2 December 2009
The minimum lengths of median openingsneeded to accommodate varying turning radiiand median widths should be determined basedon the design vehicle (see Chapter 1.2).
The minimum length of the median opening, inall cases, should be 12.0 m, or the width of thecrossing roadway measured between theoutside edges of pavement plus 3.0 m,whichever is greater.
See Chapter 3.1 for discussion and furtherreferences on median barriers, end treatmentsand transitions.
2.3.11.3 U-Turns
Median openings designed to accommodatevehicles making U-turns are needed on somedivided roadways in addition to openingsprovided for cross- and left-turning movements.The locations for separate U-turn medianopenings are as follows:
• beyond an intersection for accommodatingminor turning movements not otherwiseprovided for in the intersection
• ahead of an intersection where through andother turning movements would beinterfered with by U-turn movements at theintersection
• at regularly spaced openings toaccommodate maintenance andemergency vehicle operations
Unless the median is wide, U-turning vehiclesinterfere with through traffic by encroaching onpart of the through traffic lanes. U-turns aremade at low speeds and the required speedchange normally is made on the through trafficlanes. Moreover, U-turns often require weavingto and from the other lanes of the dividedroadway. Allowing U-turns across narrowmedians where through traffic flow may beimpeded is undesirable and may create safetyconcerns.
The provision of median openings specificallyfor U-turns is effective along divided roadwayswhere intersections are widely spaced andaccess to adjacent developments is permitted.
This provision may be particularly importantwhere U-turns are selectively restricted or totallyprohibited by law at the signalized intersections.Median openings for U-turns reduce circulationon the adjacent local road system and improveaccess to adjacent developments by simplifyingthe manoeuvres necessary to reverse direction.
Normally, protected left-turn lanes are providedin advance of the median opening for the U-turnmanoeuvre. In areas with low traffic speeds andlow U-turning volumes, the U-turn movementmay be permitted from the through lane. Inthese limited cases, the median is normally ofsufficient width to allow a single vehicle to stopin the median opening without encroaching intothe paths of the through traffic.
Table 2.3.11.1 provides the minimum medianwidths required for various design vehicles tomake three types of U-turn manoeuvres on adivided road: auxiliary lane to inner lane;auxiliary lane to outer lane, four-lane dividedroadway; auxiliary lane to outer lane, six-lanedivided roadway. The minimum median widthsfor the latter two cases are based on throughlane widths of 3.7 m. As demonstrated by thetable, the median widths needed toaccommodate the turning paths of trucks arebeyond the typical widths available in urbanareas. In special cases, where truck driversmust be able to reverse their direction, otheralternatives such as jug handle left turns maybe considered.
2.3.11.4 Emergency andMaintenance VehicleCrossings
There are some locations where it is desirableto allow only emergency and maintenancevehicles to cross the median, including:
• at fire, police or ambulance facilities alongdivided roadways
• along divided roadways with fully controlledaccess and widely spaced intersections,and where median openings for allvehicular traffic are not desirable
• at intersections where it is desirable, froma traffic operations perspective, to restrict

Geometric Design Guide for Canadian Roads
Page 2.3.12.3September 1999
intersection), although complete relianceshould not be placed on the roundaboutalone to act as an indicator to drivers
• emphasize the transition from a rural to anurban or suburban environment
• accommodate very sharp changes in routedirection which could not be achieved bycurves, even of undesirable radii
• provide a greater measure of safety at siteswith high rates of right-angle, head-on, left/through, and U-turn collisions
• replace existing all-way stop control
• accommodate locations with low or mediumtraffic volumes, instead of signals
Roundabouts should be sited on level groundpreferably, or in sags rather than at or near thecrests of hills because it is difficult for drivers toappreciate the layout when approaching on anup gradient. However, there is no evidence thatroundabouts on hill tops are intrinsicallydangerous if correctly signed and where thevisibility standards have been provided on theapproach to the yield line. Roundabouts shouldnot normally be sited immediately at the bottomof long descents where the down grade issignificant for large vehicles and loss of controlcould occur.
Roundabouts may not be effective when theflow of heavy vehicles is great or long delayson one approach exists.
2.3.12.4 Geometry/Road Capacity
As noted above, roundabouts can improve roadsafety and increase capacity. Table 2.3.12.1provides a summary of the relationship betweengeometric parameters and capacity.
Capacity is very sensitive to increases in theapproach width V. This is normally the half widthof the approach roadway and can only beincreased if sufficient roadway width allows thecentreline to be offset.
The entry geometry is defined by the entry widthE and the flare length ll. Capacity is extremely
sensitive to increase in either, and considerablescope exists for increasing capacity by variouscombinations.
Increasing the entry radius R above 20 m onlyimproves capacity very slightly. However, asvalues drop below 15 m capacity reduces at anincreasing rate.
The entry angle ‘∅’is fixed by the alignment ofthe approach roadways and there is, therefore,little scope for varying ‘∅’ sufficiently to have asignificant effect on capacity.
When designing a roundabout the approachwidth is a known fixed value. The capacity isthereafter almost totally determined by the entrywidth and the flare length, as typical values ofthe other geometric parameters have only aminor influence.
Reducing the inscribed circle diameter reducescapacity. If, however, by reducing the inscribedcircle radius an increase in the entry geometrycan be achieved, then a large net increase incapacity is produced; mini roundabouts(diameter less than 4 m) are the limiting case.As the entry width increases, the entry deflectionis reduced and consideration should be givento safety.
Increasing the number of entry lanes orincreasing the width of these lanes has thepotential for increased traffic conflict. Wideningentry lanes is a concern for the safety of cyclists.
Table 2.3.12.1 Geometry/CapacityRelationships
IncreaseParameter
CapacityChange
the approach width
the entry width
the flare length
the entry angle
the inscribed circlediameter
the entry radius
V
E
ll
∅
D
R
rises rapidly
rises rapidly
rises slowly
drops slowly
rises slowly
rises slightly
Intersections
Page 2.3.12.4 December 2009
2.3.12.5 Safety Analysis
Recent research in Europe has shown thatcollision rates can be decreased by replacingconventional intersections with roundabouts.The Netherlands achieved a 95% reduction ininjuries to vehicle occupants at locations whereroundabouts were installed.20 On inter-urbanroads in France, the average number ofcollisions resulting in injuries was 4 per100 million vehicles entering roundabouts,compared with 12 per 100 million vehiclesentering intersections with stop or yield signs.The safety of roundabouts, installed mostly inFrance’s urban and suburban areas, includingresidential areas, was generally superior to thatof signalized intersections.20 Researchers notedthat large roundabouts with wide entries andheavy bicycle traffic appeared to be less safethan other roundabouts. In Germany thenumber of collisions was 1.24 per 1 millionvehicles entering small roundabouts, comparedwith 3.35 for signalized intersections, and 6.58for old traffic circles.20 In Norway an extensivecollision analysis also revealed thatroundabouts are safer than signalizedintersections. The number of collisions resultingin injuries was 3 per 100 million vehiclesentering three-legged roundabouts and 5 per100 million vehicles entering signalized three-legged (T-) intersections; it was 5 for four-legged roundabouts and 10 for four-legged(cross-) intersections (with and withoutsignals).20
In the United States, a recent study confirmsthe safety benefits of roundabouts. Aninvestigation of six sites in Florida, Marylandand Nevada revealed that the conversion of T-and cross-intersections (stop controlled andsignalized) to roundabouts decreased collisionrates.20 According to the study, which wassponsored by the Federal HighwayAdministration, the reduction was statisticallysignificant.
Given that roundabouts have only recentlybegun to appear in North America, roadwayagencies have had little opportunity to gatherempirical data on the safety benefits of thestructures. Fortunately, similarities betweencollision-prediction models developed in the
United Kingdom for roundabouts and thosedeveloped in the United States for cross-intersections allow agencies to compare intheory the safety of both types of intersections.Both the U.K. and the U.S. models yieldestimates of collisions resulting in nonpropertydamage.20 In addition, both models use state-of-the-art regression analysis (Poisson andnegative binomial) and samples of sufficientlylarge size to relate collisions to particularroadway characteristics. On the basis of thesesimilarities, one could draw the conclusion thatroundabouts in the United States have thepotential to increase safety when compared withconventional intersections, just as they areprojected to do in the United Kingdom.
Nevertheless, notwithstanding their goodrecord, great care should be taken in layoutdesign to secure the essential safety aspects.The most common problem affecting safety isexcessive speed, both at entry or within theroundabout. The most significant factorscontributing to high entry and circulating speedsare:
• inadequate entry deflection
• a very acute entry angle which encouragesfast merging manoeuvres with circulatingtraffic
• poor visibility to the yield line
• poorly designed or positioned warning andadvance direction signing
• “Reduce Speed Now” signs, whereprovided, being incorrectly sited
• more than four entries leading to a largeconfiguration
Additionally, safety aspects to be considered indesigning a layout include the following:
1. Angle between legs: The collision potentialof an entry depends on both the anglecounter clockwise between its approach legand the next approach leg, and the trafficflows. A high-flow entry should have a largeangle to the next entry, and a low-flow entry

Geometric Design Guide for Canadian Roads
Page 2.4.3.1September 1999
2.4.3 INTERCHANGELOCATION ANDSPACING
Rural freeways passing close to or throughcommunities require interchanges suitablylocated to serve the needs of the community. Itis sufficient to provide one interchange for smallcommunities; larger communities require more.The precise location depends on the particularneeds of the community; however, as a generalguide, interchanges should be located at arterialroads recognized as major components in theroad system, having good continuity and acapability for expansion if required.Interchanges should be located in the proximityof major development areas; for example,central business areas and areas of existing orfuture concentrations of commercial orindustrial development. As a general guide inrural areas, interchanges are normally spacedat between 3 km and 8 km.
On urban freeways, traffic conditions and driverbehaviour and expectations are different fromthose of rural freeways, and this influencesinterchange spacing. Operating speeds tend tobe lower, trip lengths shorter, traffic volumeshigher, and drivers are accustomed to, andanticipate the need for taking a variety ofalternative actions in rapid succession.Interchanges spaced at more than 3 km over alength of urban freeway normally cannot provideadequate service to urban development, andcloser interchange spacing is called for. Ifsuccessive interchanges on urban freeways aretoo close, however, the operation of the freewaymight become impaired and the freeway loses
its capacity to collect and deliver traffic from thecrossing arterial roads.
Interchange spacing in urban areas generallyranges from 2 km to 3 km. Interchanges shouldbe located at major arterial roads, forming partof the arterial system of roads for the urban areaand providing, or having the potential to provide,capacity to deliver to and collect from theinterchanges.
Minimum spacing of interchanges is determinedby the distance required for weaving (seeChapter 2.1), speed change lanes, and theappropriate placement of directional signs.
If the arterial roads are spaced closer than 2 km,it is usually necessary either to omit some ofthe interchanges in favour of grade separationsalone or adopt some alternative means ofcombining interchanges to serve closely locatedarterial roads. Figure 2.4.3.1 illustrates how thismight be done. In the upper diagram the arterialroads are spaced at 2 km to 3 km, allowingeach arterial to be served by its owninterchange. In the lower three diagrams thearterial roads are at less than 2 km, calling forsome form of combined ramp / service roadsystem to provide the overall interchange rampcapacity to serve the arterial system. The mostsuitable configurations of ramps are very muchsite specific, and the design is dependent onthe layout of the arterial network and theparticular needs of the community it serves.
Freeway collision rates tend to increase asinterchange spacing decreases in urban areas.7
This effect on collision rates is an importantconsideration in urban area interchangespacing.
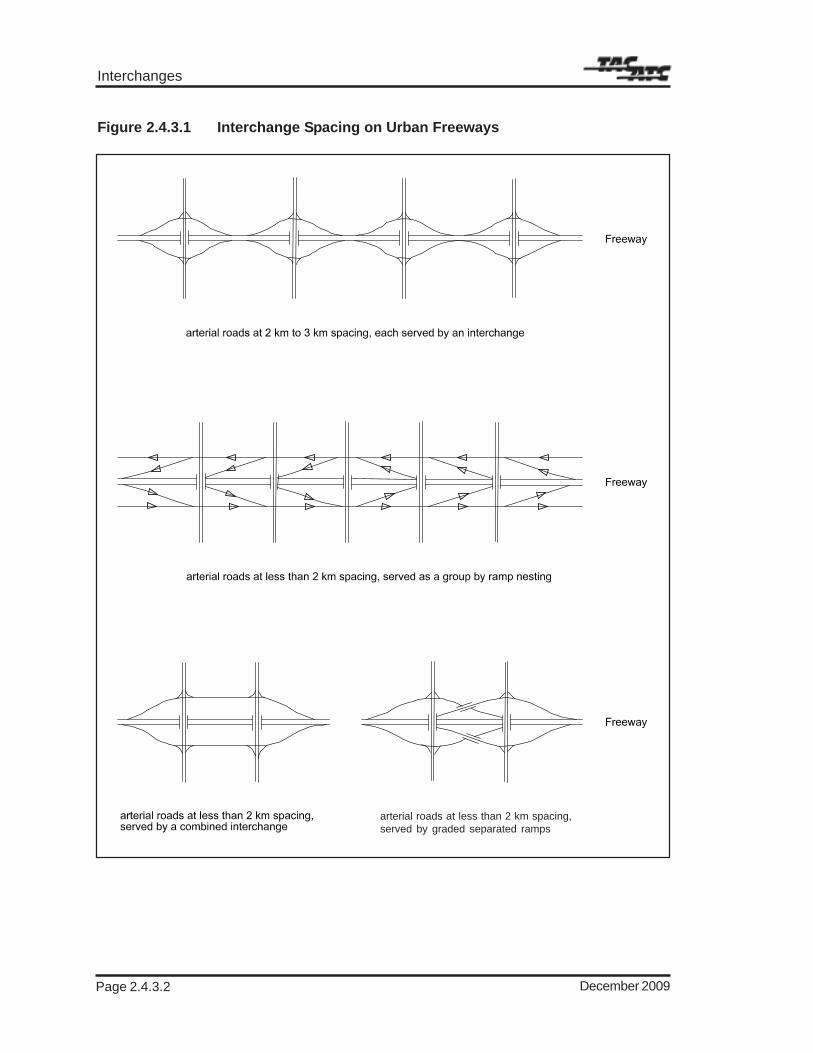
Interchanges
Page 2.4.3.2 December 2009
Figure 2.4.3.1 Interchange Spacing on Urban Freeways
arterial roads at less than 2 km spacing,served by graded separated ramps

Geometric Design Guide for Canadian Roads
Page 2.4.5.1September 1999
2.4.5 INTERCHANGETYPES
2.4.5.1 General
There is a wide variety of interchange typesavailable to the designer. The classification ofthe intersecting roads is a prime determinant inthe selection of the most suitable interchangetype for any particular application.Subsection 2.4.5.2 deals with interchangesbetween roads classified as freeways, eitherfour-leg or three-leg. Subsection 2.4.5.3discusses interchanges between freeways andother roads, which are normally arterial roadsbut in some cases are collector roads.Subsection 2.4.5.4 discusses suitable types forinterchanges between roads, neither of whichis a freeway or an expressway. Suchapplications are normally between two arterialroads or an arterial road and a collector road.In rare instances, there is an application for aninterchange between an arterial road and a localroad.
Most interchanges provide for all movementsbetween intersecting roads. Interchanges thatprovide a limited number of movements arereferred to as partial interchanges. For anymovement provided for in a partial interchange,the corresponding return movement desirablyshould be available, since the driver expects tobe able to retrace his route in the return directionon any particular trip. The absence of the returnmovement may even create a safety concern ifa frustrated motorist attempts a “wrong way”movement to regain access to a freeway.
The selection of the most suitable interchangefor any particular application, and the details ofits design, depend on a number of controls andother considerations, among the most importantof which are:
• safety
• functional and design classification ofintersecting roadways
• adjacent land use
• design speed
• traffic volume and traffic mix
• number of interchange legs
• traffic control devices
• topography
• right of way and property requirements
• service to adjacent communities
• systems considerations and designconsistency
• environmental considerations
• economics
The relative importance of these controls andconsiderations varies between interchanges.For any particular site, each control is examinedand its relative importance assessed.Alternative types and configurations are thenstudied to determine the most suitable in termsof the more important controls. While theselection of the best interchange type may varybetween sites, it is important to provide regionalconsistency, where possible, in order toreinforce driver experience. This would in turnimprove driver expectancy and hence safety.
2.4.5.2 Interchanges BetweenFreeways
Interchanges between two freeways arenormally the most costly in terms of constructioncost and property requirements.
Since freeways are fully-controlled accessfacilities, at-grade intersections within theinterchange configuration are inappropriate andit is mandatory that they be avoided.
Fully directional interchanges provide for rightand left turns through large radius ramps havingdesign speeds in the order of 70% to 80% offreeway design speeds and having overalldeflection angles in the order of 90
o. Partially
directional interchanges provide for someleft-turn movements by means of loop ramps,which have lower design speeds. Partiallydirectional interchanges have applications

Interchanges
Page 2.4.5.2 December 2009
where there are property limitations, or wheresome left-turn volumes are low.
Four-Leg Interchanges
Figure 2.4.5.1 illustrates fully-directional andpartially-directional four-leg interchangesbetween freeways. The fully-directional typeshown in illustration (i) provides single exits fromall four directions and directional ramps for alleight turning movements. The through roadsand ramps are separated vertically on fourlevels.
Partially-directional interchanges allow thenumber of levels to be reduced as the numberof loop ramps is increased. The single-looparrangement, illustration (ii), and two-looparrangement in (iii) and (iv), require three levels.A configuration in which loop ramps are carryingthe lighter volumes of left-turning traffic ispreferable, and levels should be arranged sothat exit loop ramps are on upgradesencouraging deceleration, thus increasingsafety. Illustration (v) is a full cloverleaf withcollector lanes, incorporating loops for four leftturning movements and two levels separatingthe through roads vertically. This type ofinterchange introduces undesirable weavingsections, and is only suitable where left-turnvolumes are low and property is readilyavailable. The collector roads are added to thistype of interchange so that the weavingmanoeuvres inherent in this interchange typeoccur on the collectors rather than on the mainline.
Three-Leg Interchanges
Figure 2.4.5.2 illustrates a variety offully-directional and partially-directionalthree-leg interchanges between freeways.
Illustrations (i) and (ii) are fully-directionalinterchanges requiring three levels of roadways.Illustration (iii) is fully-directional, requiring onlytwo levels. Illustrations (iv) and (v) arepartially-directional referred to as trumpetinterchanges and each incorporates one loopramp for a left-turn movement. The choicebetween the two depends on the availability ofproperty, but desirably the loop carries thesmaller volume of the two left-turn movements.
2.4.5.3 Interchanges BetweenFreeways and OtherRoads
In interchange types for this application, allramps diverging and merging with the freewayhave acceleration and deceleration lanes sothat traffic can enter and exit freeway lanes at,or close to, freeway speeds. Where the rampsconnect with the crossing roads, intersectionsoccur and are designed with suitable trafficcontrol devices.
Left-turn movements often are accommodatedon loop ramps, and loop ramps carrying trafficentering the freeway are preferable to loopramps carrying traffic exiting the freeway. Whereother considerations permit, it is desirable toarrange the levels of the through roads so thatramp traffic entering the freeway is on adowngrade and ramp traffic exiting the freewayis on an upgrade, to assist in acceleration anddeceleration respectively.
The choice of carrying the freeway over or underthe crossing road depends on topography, costand other environmental considerations. Thereare a number of operational advantages incarrying the freeway under the crossing roadas discussed in Subsection 2.4.1.2.
Interchanges between freeways and othercategories of crossing road normally providefor all turning movements. In some cases it maybe necessary to eliminate some turningmovements; however, in such cases, for anymovement that is provided the correspondingreturn movement desirably should be available.
Figures 2.4.5.3 to 2.4.5.6 illustrate interchangesfor application between freeways and arterialroads. They are shown diagrammatically withthe arterial road crossing over the freeway andwith single exit ramps from the freeway.
Diamond Interchanges
Figure 2.4.5.3 illustrates a Simple Diamondinterchange. The ramps intersect with thecrossing road at at-grade intersectionscontrolled by traffic signals or, where volumes

Geometric Design Guide for Canadian Roads
Page 2.4.5.7December 2009
Figure 2.4.5.5 Parclo B Interchanges
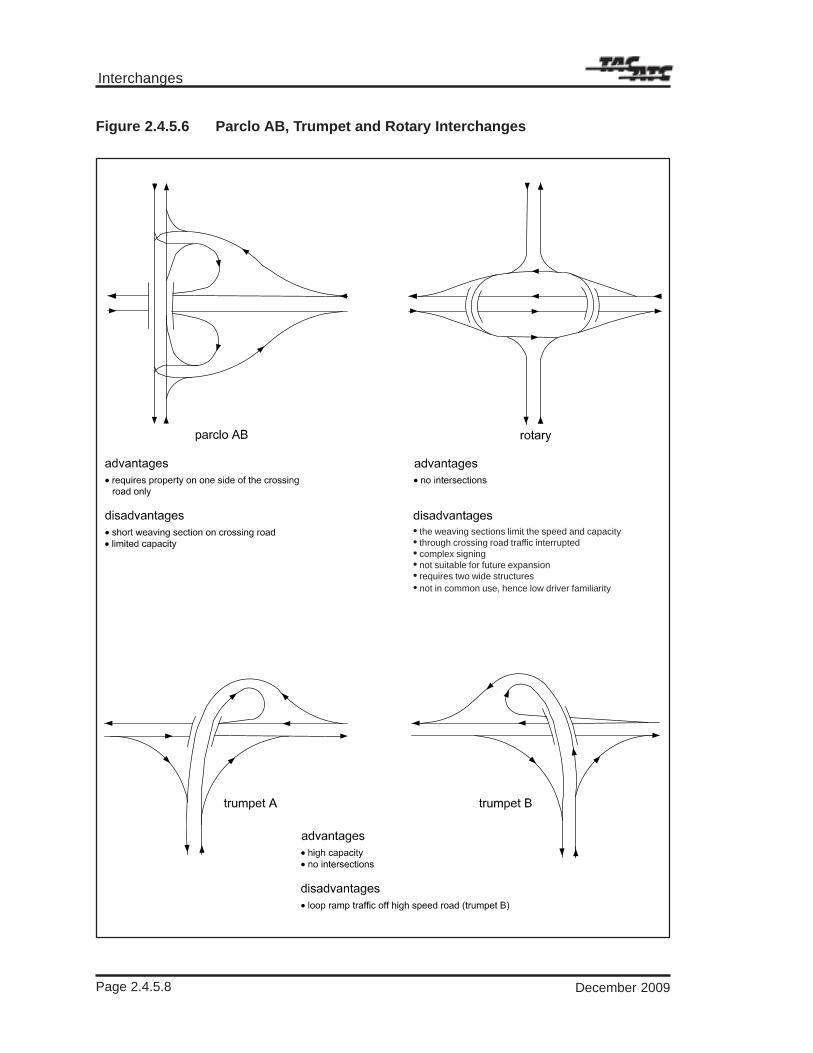
Interchanges
Page 2.4.5.8 December 2009
Figure 2.4.5.6 Parclo AB, Trumpet and Rotary Interchanges
• the weaving sections limit the speed and capacity• through crossing road traffic interrupted• complex signing• not suitable for future expansion• requires two wide structures• not in common use, hence low driver familiarity

Geometric Design Guide for Canadian Roads
Page 2.4.6.7December 2009
Exit Terminal Length
Table 2.4.6.2 shows design domain for lengthsof deceleration lanes in single-lane exits. Forparallel lane form, the length of decelerationlane, L
d is measured from the end of the taper
(Lt). For the direct taper form, the length L
d is
measured from the point at which the auxiliarylane is 3.5 m wide.
The length of deceleration, Ld, is measured to
the beginning of the ramp controlling curve. Ifthe ramp is relatively straight and ends at a stopcondition, as in a diamond interchange, thelength L
t may be measured to the intersection.
Measurement of Lt and L
d are illustrated in
Figure 2.4.6.1.
The length of an exit terminal is essentiallydetermined by the distance required fordeceleration after the vehicle has left thethrough lanes. It is based on three factors incombination as discussed in Subsection 2.4.6.2.They are:
• the running speed on the through lanes
• the control speed of the ramp proper
• the manner of deceleration
The design domain in Table 2.4.6.2 is based onthe different assumptions applied to these threefactors:
1. The running speed on the through lanes isassumed to be in the range of “operatingspeeds” used in Chapter 1.2.
2. The control speed of the ramp proper atthe downstream of the exit terminal isincluded in the range of ramp design speedsin Table 2.4.6.1. The speed change lanelengths corresponding to the ramp controlspeeds, which are governed by the designspeed of the turning roadway curve, areshown in Table 2.4.6.2.
3. The manner of deceleration includes adomain of two different concepts. For bothconcepts, it is assumed that drivers travelat the beginning of the speed change lane(start of taper) at the operating speed and
the speed is maintained until the end of thetaper in the case of the parallel lane form oruntil the speed change lane has widened to3.5 m in taper form. The first concept, whichprovides the basis of the lower values of thedesign domain, assumes braking begins atthe start of the parallel section (parallel laneform) or at the 3.5 m wide point (taper form)to decelerate to the control speed of theramp. The second concept, which providesthe basis of the higher values of the designdomain, assumes that the vehicle travelsfor 2.0 seconds to 4.0 seconds in gearwithout braking followed by leisurely brakingto the control speed of the ramp. This lattercondition is considered very generous,particularly in an urban situation. Twoseconds in gear is assumed for roadwaydesign speeds up to 110 km/h; while4.0 seconds in gear is assumed forroadway design speeds of 120 km/h andhigher.
For two-lane freeway exits, the operation isdifferent from the single-lane exit. Thisoperation may require a longer speed changelane than that for the single lane exit. The lengthis based on a different concept whereby the exitcurve to the bullnose is considered to governthe manoeuvre of the vehicle exiting to the left-hand lane of the two lanes. A total speedchange length (L
d) in the order of 400 m to
450 m for mainline roadway speeds of 100 km/h or above is recommended by both AASHTOand the Geometric Design Standards forOntario Highways for two-lane exits.
Where deceleration lanes are on grades equalor steeper than 3%, the length shown in Table2.4.6.2 should be adjusted by the appropriategrade factor shown in Table 2.4.6.3.
Exit Ramp Transition Curve Criteria
Interchange ramp alignments with theirrelatively severe geometrics are particularlyappropriate for the use of spirals. A spiral curvebeginning in the vicinity of the bullnose isnormally inserted between the exit curve ortaper ending at the bullnose, and the controllingcurve on the exit ramp as shown in Figure2.4.6.2.

Interchanges
Page 2.4.6.8 September 1999
Table 2.4.6.3 Grade Factors for Speed Change Lanes
DECELERATION LANES
Grade Design Speedof Roadway
(km/h)
Grade Factor*For All Turning Roadway Design Speeds
6% to 5% up3% to 5% upless than 3%
3% to 5% down5% to 6% down
all
0.80.91.01.21.4
ACCELERATION LANESGrade Factor*
For Turning Roadway Design SpeedsGrade Design Speed
of Roadway(km/h) 40 50 60 70 80
6% to 5% up 60708090100110
1.51.51.61.71.92.0
1.51.61.71.82.02.2
1.81.92.02.22.4
2.02.22.42.7
2.62.9
3% to 5% up 60708090100110
1.31.31.41.41.51.5
1.31.31.41.51.51.6
1.41.41.51.61.7
1.51.51.61.7
1.61.8
Grade Factor*For All Turning Roadway Design Speeds
less than 3%(up or down) all 1.0
3% to 5% down
607080
0.70.70.65
90100110
0.60.60.6
5% to 6% down
60708090100110
0.60.60.550.50.50.5
Note: * grade factor = ratio of length on grade tolength on level (as shown in Tables 2.4.6.2 and2.4.6.5)

Geometric Design Guide for Canadian Roads
Page 2.4.6.13December 2009
ramp curve to the point at which the auxiliarylane is 3.5 m wide. Acceleration lengths, L
a, are
measured from the end of the ramp controllingcurve. Measurement of L
t and L
a is illustrated
in Figure 2.4.6.1.
The length of an entrance terminal is based onthree factors in combination as discussed inSubsection 2.4.6.2. They are:
• merging with the through traffic
• control speed of the ramp proper
• manner of acceleration
The merging speed with the through traffic isassumed to be the range of operating speedsused in Chapter 1.2.
The control speed of the ramp proper at theupstream of the entrance terminal is included inthe range of ramp design speeds in Table 2.4.6.1.The speed change lane lengths correspondingto the ramp control speeds, which are governedby the design speed of the turning roadwaycurve, are shown in Table 2.4.6.5.
The manner of acceleration assumes an increaseof speed based on the acceleration of passengercars tested in the U.S.3,14
Where acceleration lanes are on grades steeperthan 3%, the length shown in Table 2.4.6.5 shouldbe adjusted by the appropriate grade factor inTable 2.4.6.3.
The length of an entrance terminal also dependson the relative volumes of through and enteringtraffic. Longer entrance terminals (i.e. the highervalues of the design domain in Table 2.4.6.5) aredesirable on higher volume roads to enableentering traffic to merge with through traffic safelyand conveniently.
Trucks and buses require longer accelerationlanes than passenger cars. Where a substantialnumber of large vehicles entering the road isexpected, longer acceleration lanes areappropriate.
Research has shown that safety can beincreased on acceleration lanes with increasedlength, especially for high speed facilities.
Where the entrance terminals occur on a crestcurve, sight distances to the lane drop may beaffected, longer acceleration lanes will then berequired as discussed later in the ‘SightDistance’ Subsection.
Entrance Ramp Transition Curve Criteria
In entrance ramp design, a spiral is introducedin the vicinity of the bullnose between the rampcontrolling curve and the entrance curve or taperto effect a smooth transition. Acceleration startsat the beginning of the spiral, and usuallycontinues beyond the spiral on the rampterminal section. The radius of the spiralincreases so as to accommodate the increasingspeed of the vehicle accelerating. The spiralparameter needs to be small enough to providea sufficiently rapid rate of increase in radius tomatch the acceleration of the vehicle. On theother hand the spiral parameter needs to besufficiently large to ensure that the comfort,superelevation and aesthetic criteria are met.The spiral parameter, can be selected from therange given in Table 2.4.6.6.
Table 2.4.6.6 Spiral Parameter forEntrance RampTransition Curves
Sight Distance at Entrance Terminals
At entrance terminals, the driver is looking fora gap in the traffic in the adjacent lanes in orderto effect a lane change and merge. A drivertherefore has to look back to find an appropriategap. This view is best provided by maintainingthe vertical alignment of the ramp in the vicinity
Ramp ControllingCurve Speed
(km/h)
Design Domain ofSpiral Parameter
(m)4050607080
50-8065-13085-140
110-280125-360

Interchanges
Page 2.4.6.14 September 1999
of the nose at elevations similar to, or above,those of the through road. If the ramp issignificantly lower, the driver might have somedifficulty effecting a safe merge. If the ramp ishigher, the driver normally has good visibilityunless the view is obscured by a traffic barrieror other visual obstruction.
A driver begins accelerating from the rampcontrolling circular curve some distance beforethe nose, usually in the vicinity of the beginningof the spiral curve. At this point, the driver looksfor a gap in the stream of traffic in the adjacentlane. The line of sight is taken to be at 120o
from the direction of travel and the object to beseen is taken to be in the centre of the adjacentlane, 1.0 m above the pavement surface. Thisis illustrated in Figure 2.4.6.4.
To allow the driver to make a mergingmanoeuvre safely, ideally he requires a view ofthe entire speed change lane at the nose asillustrated on Figure 2.4.6.4. The driver may nothave this view if the speed change lane occurson a crest curve, in which case the verticalalignment should be adjusted so as to shift thecrest curve away from the speed change lane.If this is not feasible, either the speed changelane should be lengthened or the crest curveshould be flattened to provide, preferably,decision sight distance to the end of the taperas discussed in Chapter 1.2.
2.4.6.5 Ramp Terminal Spacing
Successive ramp terminals on freeways/expressways or within an interchange arespaced to allow drivers to make decisions insufficient time to make safe manoeuvres.
In the case of successive exits, the distance isbased on the provision of adequate signing. Inthe case of successive entrances, the length isbased on the merging manoeuvre lengthrequired for the first entrance.
An entrance followed by an exit terminal createsa weaving condition, and is discussed inChapter 2.1.
The distance between an exit followed by anentrance needs to be sufficient to allow a vehicle
on a through lane to prepare for the merge aheadafter passing the exit nose.
Figure 2.4.6.5 shows the minimum values forramp terminal spacing based on design speeds.Additional distances may be required to ensuresigning requirements are met.
2.4.6.6 Safety and DesignOverview
The fundamental principle of an interchange isthe movement of vehicles through theinterchange in the safest, most efficient mannerpossible. The ability of an interchange toaccommodate drivers in this manner is closelyrelated to the efficiency with which theinformation is provided to the driver and withthe degree to which driver expectancy is met atthe interchange.
Interchanges present the motorist with acomplex set of decisions that require quickevaluation and action. Designers can reducedrivers’ stress at interchanges by keeping thealignment simple and direct, maintaining designconsistency, providing sight distances greaterthan the minimum stopping sight distances, andusing above minimum design criteria for othergeometric elements.
Collisions on ramps and connecting roadsgenerally increase with traffic volume and withdecreasing curve radius.7 It also appears thatupgrade exit ramps have lower collision ratesand thus it is preferable, from a safety viewpoint, for the connecting road to pass over thefreeway or higher speed road. The use ofcollector lanes for high volume interchangesenhance safety, especially where loop rampsare used7. The use of a collector introduces anintermediate-speed facility between the freewayand the off-ramp thereby encouraging speedslow-down prior to entering the off-ramp.
One of the key issues related to interchangedesign involves heavy truck incidents atinterchanges. In general, tight radius curveson ramps and short speed change lanes causeproblems with heavy trucks. Truck incidentson interchange ramps generally involve loss ofcontrol leading to rollover or jack-knife. Recent

Geometric Design Guide for Canadian Roads
September 1999 Page 2.4.7.1
2.4.7 OTHERINTERCHANGEDESIGN FEATURES
2.4.7.1 Operational Analysis
A series of proposed interchanges or aproposed single ramp exit/entrance can besubjected to an operational analysis, includingcapacity and design features, after the planningor preliminary design stage. The operationalanalysis is basically a test for ease of operationand for route continuity from a driver’s point ofview, both of which are affected by the location,proximity, sequence of exits and entrances,merging and diverging movements, necessaryweaving, practicability of signing, visibility of thetarget destination, and clarity of paths to befollowed. The operational analysis can beconsidered as an application of the ‘driverworkload’ approach to the evaluation of designconsistency.
A route may be tested by isolating a single pathof travel and examining it only with regard toother features of the layout that will affect adriver on the path being tested. The test canbe made using an overall plan on which thenumber of traffic lanes, the peak hour volumes,the expected running speeds, the visibilities ofdownstream features, and the signing areshown.
The operational analysis indicates whether ornot confusion is likely due to the close proximityof exits and entrances, or traffic conflict is likelybecause of weaving movements. It shouldillustrate also the clarity of the path and thefeasibility of signing. The test may show thatthe path is easy to travel, direct in character, orit may show that the path is sufficiently complexand confronted with disturbing elements thatrequire adjustments in design.
The operational analysis can also include acheck of the design adequacy, e.g. decelerationlength and ramp radius, in conjunction with thetest for ease of operation. This is a particularlyuseful approach in checking the overall designof interchanges that have non-typicalconfigurations.
2.4.7.2 Ramp Metering
Ramp metering consists of traffic signalsinstalled on entrance ramps in advance of theentrance terminal to control the timing andnumber of vehicles entering the freeway. Thetraffic signal may be pre-timed or traffic-actuated to release the entering vehiclesindividually or in platoons.
The purpose of ramp metering is to reducecongestion or improve merge operations onurban freeways. This strategy has been proveneffective in many applications throughout NorthAmerica. Ramp metering can optimize freewayvehicle flows and improve merge area safetythrough uniform spacing of entering vehicles.
The ramp metering system can include thefollowing:
• stop bar marking upstream of the rampbullnose
• passage loop downstream of the stop barto monitor vehicles released from the queue
• ramp control signs
• demand detector loops upstream of stopbar
• upstream queue detector on the rampimmediately downstream of the arterialstreet bullnose
• freeway detector loop on the upstreamapproach to determine available gaps
Provisions for ramp metering bypass lanes maybe required for potential implementation of highoccupancy vehicle priority features. Thesuitability of ramp configurations toaccommodate bypass lanes hinges on theavailability of required length along the ramp.
2.4.7.3 Bus Interface
Accommodating transit on a freeway can leadto a high level of transit service in larger cities.An interchange can provide a transfer pointbetween freeway bus service and local bus

Interchanges
Page 2.4.7.2 December 2009
feeder service and, potentially, commuterparking facilities.
Design considerations of bus interface atinterchange includes the following:
• safety
• capital costs
• alignment and geometrics
• intended operation with respect to interfacelocation, platform facilities and local busfacilities
• impact on crossing and bus roadaccess /egress locations
Sufficient sight distance on the bus route isimportant for maintaining safe and efficientoperation of the buses. Interfaces atinterchanges should be located as closely aspracticable to crossing roads of suitablegeometrics and ridership potential. Pedestrianwalk distances should be minimized betweenlocal and freeway buses.
On diamond-type ramps, the bus interface mayconsists of a widened shoulder area adjacentto the ramp roadway or may be on a separateroad. Generally, bus interface provided onentrance ramp is preferred. Bus interfaces aremore difficult to provide effectively withincloverleaf or directional-type interchanges.Guidelines4 have been developed for use inpreliminary design of Parclo A interchangeswhere bus interfaces are to be protected.Typical bus interfaces at Diamond interchangeand at Parclo A interchange are shown inFigure 2.4.7.1.
2.4.7.4 Pedestrians
The accommodation of pedestrians through anurban interchange should be considered duringthe development of interchange configuration.
In addition to allowing the driver to detect thepresence of pedestrians, adequate sightdistance for the pedestrians must be providedwhere pedestrians are expected to cross aninterchange ramp. Pedestrians must be able
to perceive gaps in the traffic flow. At rampcrossings where there are insufficient gaps inthe traffic flow to allow pedestrians to cross,pedestrian-actuated signals or a pedestrianoverpass/underpass can be considered. Ingeneral, it is desirable to provide pedestriancrossings in the shortest distance feasible.
The accommodation of bicycles at interchangesis discussed in Chapter 3.4.
2.4.7.5 Grading and LandscapingDevelopment
Grading at an interchange is determined mainlyby the alignments, profiles, cross-sections anddrainage requirements for the intersecting roadsand ramps. Contour grading can be designedto increase safety and enhance aesthetics. Flatslopes should be used where feasible, toincrease safety and to enhance the appearanceof the area. V-ditches and small ditches withsteep side slopes are usually avoided. Drainagechannels and related structures should be asinconspicuous and maintenance-free asfeasible. The need for a ‘forgiving’ roadside onthe outside of curves is particularly importantfor tighter interchange ramps.
Contour design is usually applied to residualareas of land in interchange areas betweenramps to create noise berms and for materialdisposal areas. These areas can be gradedwith varying slopes to give an undulating andnatural looking appearance. Contour design iscarried out in conjunction with drainage designwith consideration for safety and, whereappropriate, in conjunction with landscaping.Residual pockets of land in interchange areas,particularly loop ramps can be used to disposeof surplus material and to minimize spoil.Conversely, they may be used to generateadditional excavation and to minimize borrow.In placing fill in loop ramp areas, care must betaken not to compromise sight distancerequirements.
Grading of areas on the back slope can becontoured to match the adjacent topographyand can greatly improve the aesthetics of theroad. This can be accomplished, in part, byrounding the edge of the interface between thecut of slope and the adjacent hillside, and

Geometric Design Guide for Canadian Roads
Page 2.4.8.7December 2009
Figure 2.4.8.6 Typical Design Entrance Terminal Parallel Two Lane
cla
ss

Interchanges
Page 2.4.8.8 September 1999
Figure 2.4.8.7 Typical Design Entrance Terminal Tapered Single and Two Lane