ratio analysis and the prediction of business failure
TRANSCRIPT
RATIO ANALYSIS AND THE PREDICTION
OF BUSINESS FAILURE
\i
by
B. A.
Terry Longli°
Simon Fraser
air, C.A.
University 1975
RESEARCH PROJECT SUBMITTED IN PARTIAL FULFILLMENT OF
THE REQUIREMENTS FOR THE DEGREE OF
MASTER OF ARTS
in the Department
of
Economics
C Terry Longair, C.A, 1983
SIMCN FRASER UNIVERSITY
April 1983
All rights reserved. This work may not be reproduced in whole or in part, by photocopy
or other means, without permission of the author.
UNIVERSITY OF NAIROBI LIBRARY YTNTVfiRSTTY CV ;./•
ii
APPROVAL
Name: Terrance Evan Longair
Degree: Master of Arts
T itle of Project: Ratio Analysis and the Prediction of BusinessFailure
Examining Committee:
Chairperson: Lawrence A. Boland
J h I .J\JXa
Turgdt Var Senior Supervisor
Daniel McDonald
Date Approved: S./7S 3
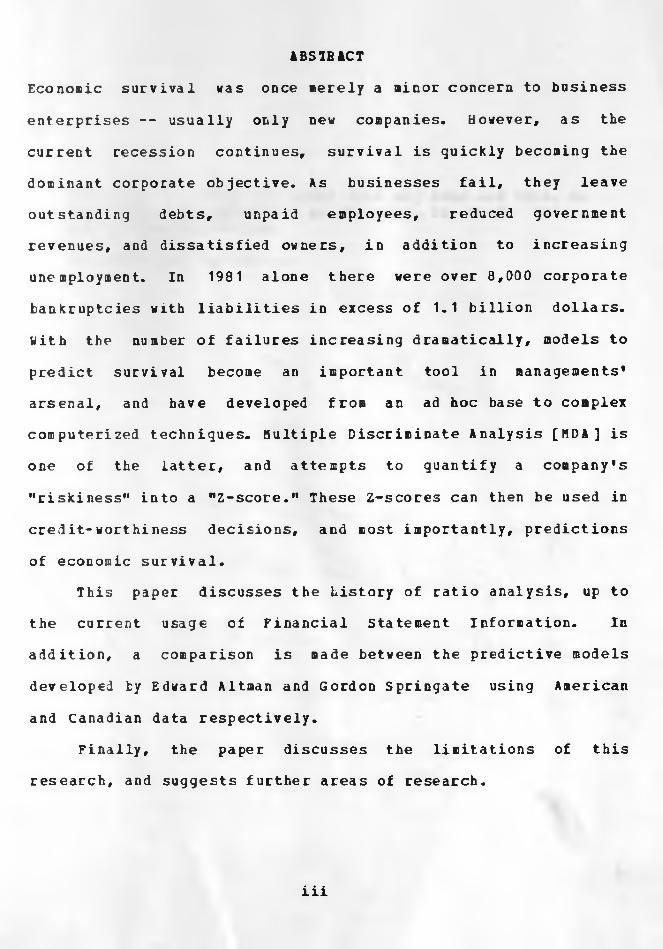
ABSTRACT
Economic survival was once merely a minor concern to business
enterprises -- usually only new companies. However, as the
current recession continues, survival is quickly becoming the
dominant corporate objective. As businesses fail, they leave
outstanding debts, unpaid employees, reduced government
revenues, and dissatisfied owners, in addition to increasing
unemployment. In 1981 alone there were over 8,000 corporate
bankruptcies with liabilities in excess of 1.1 billion dollars.
With the number of failures increasing dramatically, models to
predict survival become an important tool in managements*
arsenal, and have developed from an ad hoc base to complex
computerized techniques. Multiple Discriminate Analysis [MDA] is
one of the latter, and attempts to quantify a company's
"riskiness” into a "Z-score.” These Z-scores can then be used in
credit-worthiness decisions, and most importantly, predictions
of economic survival.This paper discusses the history of ratio analysis, up to
the current usage of Financial Statement Information. In
addition, a comparison is made between the predictive models
developed by Edward Altman and Gordon Springate using American
and Canadian data respectively.
Finally, the paper discusses the limitations of this
research, and suggests further areas of research.
iii

Dedicated to those who stuck with ae; John and Edna, A1 and Lynda, and especially ay Chairaan, Dr. Kenji Okuda, and his Administration.
For those who did not....
iv)
The actual state of accounting is not that it has no theories, but that it has an almost inexhaustible quantity of implicit, partial, and contradictorytheories. OcJthaffl,s razor has not been near the stubble.
R.J. Chambers,Accounting Evaluation and EconomicBehavior, 1966, p. 346.
v

ACKMOVLEDGEHEVTS
The author would like to express
for the help on this paper received
Dr. Irene Gordon, both of S.F.U., two Committee Chairman Dr. Turgut Var. Hiss
Processing vizard, is also thanked.
his deepest appreciation
from Hr. Roman Adler,
anonymous reviewers, and Barbara Barnett, Vord
vi
TABLE OF CONTESTS
Approval ......... ........... ............. .................... ii
Abstract ...................... ........... ................... iii
Dedication...... . . .................................... ------ iv
Quotation ........ •••••........ ........... .................... vAcknowledge me nts .................. ....... vi
List of Tables .............. .............. . viii
List of Figures .............................. .............. . ix
Introduction ............................................... 1
Business Failures in Canada .................... ...... 4
Reasons for Pailure ............................................ 9Ratio Analysis, Univariate Models ........... ......... . 19
Patio Analysis, Multivariate Models .......................... 27
Multiple Descriiinate Analysis.... ...................... . 34
Discussion.................... ••••••........ ......... ....... 44
Summary .............. ......... -........ . 52
Appendices..... ........................................... . 54
References.................................. - -......-...... - 58
vii
LIST OF TABLES
Table II — Business Bankruptcies by Industry ........... . 7Table III — Failure Age in United States 1950-1976 ••••••••• 15
Table IV — Pailure Age by Industry 1976 ..... ........ 16
Table V — Apparent Causes of Failure ........................ 17
Table VI — Discriminate Functions Using Wilks* Lanbda ...... 43
Table VII — Patios in Discrininate Functions ••••••••••••.•• 53
Table I — Business Bankruptcies in Canada .....-- - 6
viii
LIST OP PIGDHES
Figure II — Age of Failed Businesses by Industry ••.•••••••• 18
Figure I — Bankruptcies in Canada ............................... 8
iz
Introduction
The costs of Bankruptcy, and other market imperfections make financial distress an undesirable state of affairs.
[Gordon, 1971, p- 354]
In the complex and competitive business world, survival can
be seen as one measure of success. Unfortunately, the economic
downturn of the 1980s has resulted in elevating survival to the
single, most important corporate goal. Therefore, information
that will reduce uncertainty and risk often becomes vital to the
success of a business venture. Such information is obtained
through the accounting models and reporting systems of each firm
and is used by insiders (management) and outsiders (financial
analysts). As such, it is necessary to be able to interpret
available data, especially financial statements, to determine a
particular company^ financial status (healthy, growing, poor,
etc.). One method commonly used, is a comparative technique
known as ratio analysis.
The number of business failures:1 bankruptcies, forced
sales, etc., in Canada has risen dramatically in the last few
years. Springate [1978, p. 8] mentioned that "the economic
deficiency to the Canadian community will be well over three
hundred million dollars in 1978" (see Table I) . This of course
does not include the "indirect" costs such as staff retraining,
1 For a discussion of "failure", economic, financial, technical, insolvency, etc., see Weston and Brigham [1977, pp. 542-44].
1
forced retirements, increased Unemployment Insurance payments
and other opportunity costs. In other words, the costs of
business failures are substantial, and there is a need to look
at potential reduction of these costs. As a minimum, research
should be focused towards controlling these costs.
Business failures will always be a part of any free-enterprise system, and a model which can be used to
"accurately predict" any such failure may help minimize exposure
to these costs. Information on predicted corporate failures will
benefit corporations in the extension of credit, employees of
enterprises, potential investors, governments, and the business
itself. Of the current developments in this area Horrigan [1968,
p. 294] indicates that:
The most striking aspect of the present state of ratio analysis is the absence of an explicit theoretical structure. Under the dominant approach of 'pragmatical empiricism', the user of ratios is required to rely upon the authority of an author's experience. As a result, the subject of ratio analysis is replete with untested assertions about which ratios should be used and what their proper levels should be.
This implies that there is a need for further research in
this area, but to begin this we should look at the development
of ratio analysis, from its beginnings to its present state.
Basically there are two types, univariate analysis, in which
one, or a series of individual ratios is developed and analysed
by the "prudent business person". A more sophisticated type,
multivariate analysis. calls for the simultaneous analysis of these same ratios. Thereby, trends and interrelationships can be
determined, and used to develop predictive models of business
2
failure. By using Multiple Discriminate Analysis [MDA ] the
"best” ratios, those which result in the most predictive
ability, can be determined and then applied to existing data for
grouping companies into "failed" or "non-failed," in order to
develop a riskiness index.
This paper will therefore examine the development of ratio
analysis, paying particular attention to the use of ratios for
failure prediction. Secondly, the implications of this
development for future research will be discussed. However,
before the latter can be done, we should look at the reasons for
corporate failure. If in fact the reasons can be determined,
they may also have some implications for further research in
this area.
3
Business Failures in Canada
The recent poor performance of our nation's economy has been marked by a rash of business failures in all sec tors.
[ Altman, 1971, p. 333]
Before looking at ratio analysis, it might be useful to
look at the size of the problem. To be specific, what are the
costs mentioned in the introduction? As Table I indicates, the
number of bankruptcies in Canada has increased 115% in the last
five years, (1977-1981) from 3745 to 8055. For an indication of
the costs, a look at liabilities outstanding at point of
failure, as declared by the debtor,2 and therefore potential forgone assets in other enterprises, indicate that these
failures in 1981 represent close to $1.15 billion. This figure
alone has risen 72% since 1977, and by all accounts in current
news releases will continue to increase in the 1980s.3
Table II indicates the areas that firms were engaged in at
time of failure. In a sense, it indicates the "riskiness” of
different industry sectors. For instance, until 1978 it would
appear that the "Finance" and "Service" sectors have been
relatively stable. However "Primary" and "Manufacturing"
2 This of course does not include shareholders eguity.
3 The Vancouver Sun (B.C. Bankruptcies Soar, by Rod Nutt, Sun Business Writer, April 13, 1982), reported that business and personal bankruptcies in B.C. "surged 44% and 62% respectively in the first three months of this year [1982] from the same period a year earlier." The businesses that declared bankruptcy during this period reported liabilities of $65 million.
4
indicate their volatility as failures declined in the mid 1970s,
a period of economic expansion, and then shoved large increases
in 1977 and 1978. Horeover, the statistics indicate continued
increases in bankruptcies in these areas.Unfortunately, the areas of "Primary" and "Construction"
(the latter up 223% in 1 978 over 1977) are two of the main
industries in British Columbia. If an accurate failure
prediction model can be established, specific industry models
could be formulated, and hopefully used effectively in this
pro vince.4
4 A model could be used by bank managers, and other business people who wish tc make credit decisions involving a business enterprise. This model would not, of course, make the decision, but may add valuable information. This would be especially true if the decisions are being based on ad hoc methods.
5
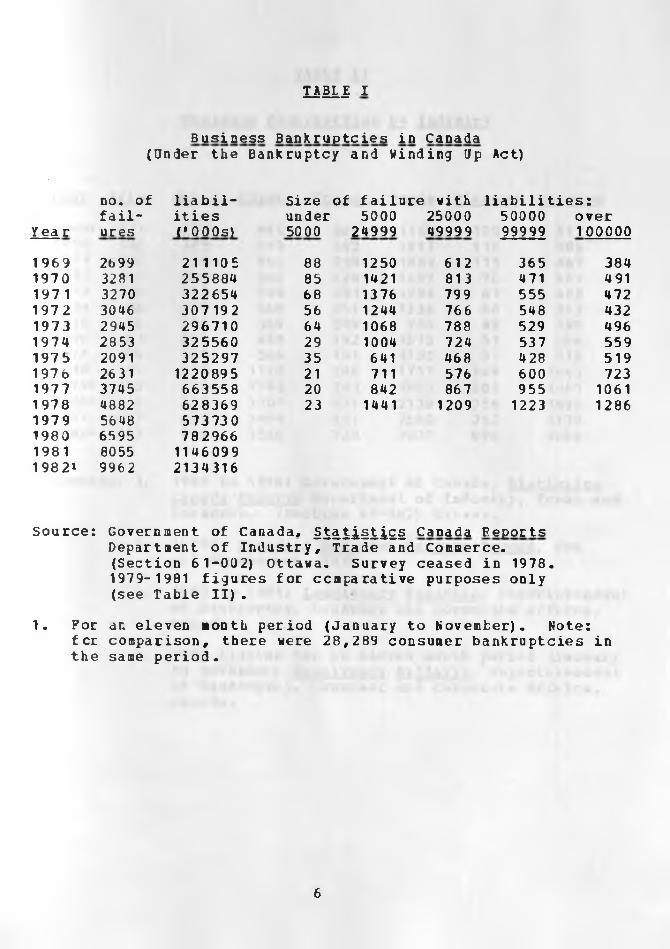
TABLE I
Business Bankruptcies in Canada(Under the Bankruptcy and Winding Up• Act)
no. of liabil- Size of failure with liabilities:fail- ities under 5000 25000 50000 over
Y ea r ures C 000s) 5000 24999 49999 99999 100000
1969 2b99 21 1105 88 1250 612 365 3841970 3281 255884 85 1421 813 471 491197 1 3270 322654 68 1376 799 555 4721972 3046 307 192 56 1244 766 548 4321973 2945 296710 64 1068 788 529 496197 4 2953 325560 29 1004 724 537 559197b 2091 325297 35 641 468 428 5191976 26 31 1220895 21 711 576 600 7231977 3745 663558 20 842 867 955 10611978 4882 628369 23 1441 1209 1223 12861979 5648 5737301980 6595 7829661981 8055 114609919821 9962 2134316
Source: Government of Canada, Statistics Canada FeportsDepartment of Industry, Trade and Commerce.(Section 6 1-002) iOttawa. Survey ceased in 1978.1979- 1981 figures for comparative purposes only(see Table II).
1. For an eleven month period (January to November). Note:f cr comparison, there were 28, 289 consumer bankruptcies inthei same period .
6
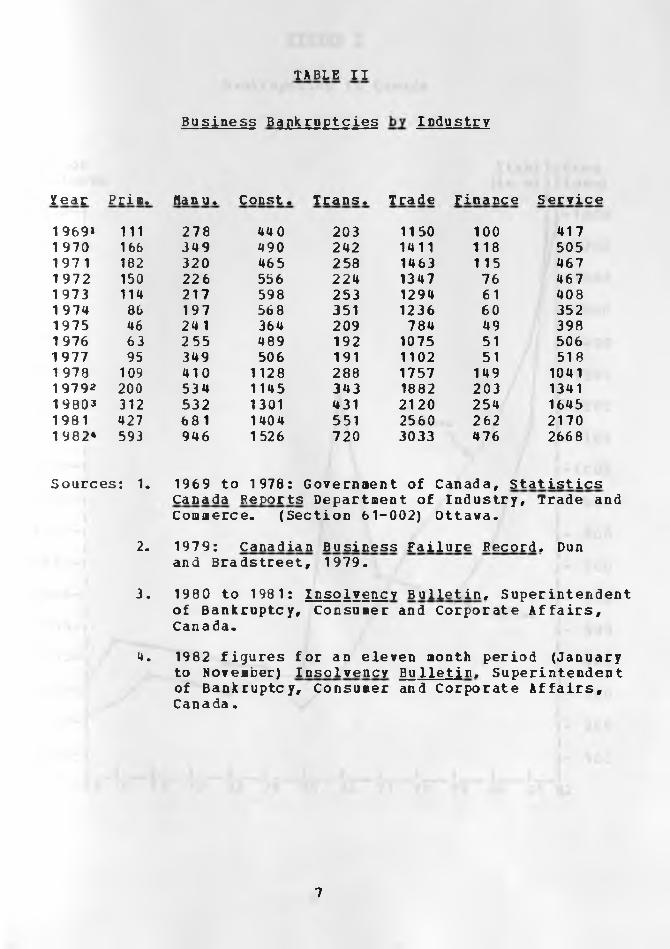
TABLE II
Business Bankruptcies I ndustry
Year Prim. Wan u. Const. Trans. Trade Finance Service
1 9691 111 278 44 0 203 1150 100 4171 970 166 349 490 242 1411 118 505197 1 182 320 465 258 1463 115 4671972 150 226 556 224 1347 76 4671973 114 217 598 253 1294 61 4081 974 86 197 568 351 1236 60 3521975 46 24 1 364 209 784 49 3981976 63 255 489 192 1075 51 5061977 95 349 506 191 1102 51 5181 978 109 410 1128 288 1757 149 104119792 200 534 1145 343 1882 203 134119803 312 532 1301 431 2120 254 16451981 427 68 1 1404 551 2560 262 21701 982* 593 946 1526 720 3033 476 2668
Sources: 1. 1969 to 1978: Governaent of Canada, StatisticsCanada Reports Department of Industry, Trade and Commerce. (Section 61-002) Ottawa.
2. 1979: Canadian Business Failure Record. Dunand Bradstreet, 1979.
3. 1980 to 1981: Insolvency Bulletin. Superintendent of Bankruptcy, Consumer and Corporate Affairs, Canada.
4. 1982 figures for an eleven month period (Januaryto November) Insolvency Bulletin. Superintendent of Bankruptcy, Consumer and Corporate Affairs, Canada.
7
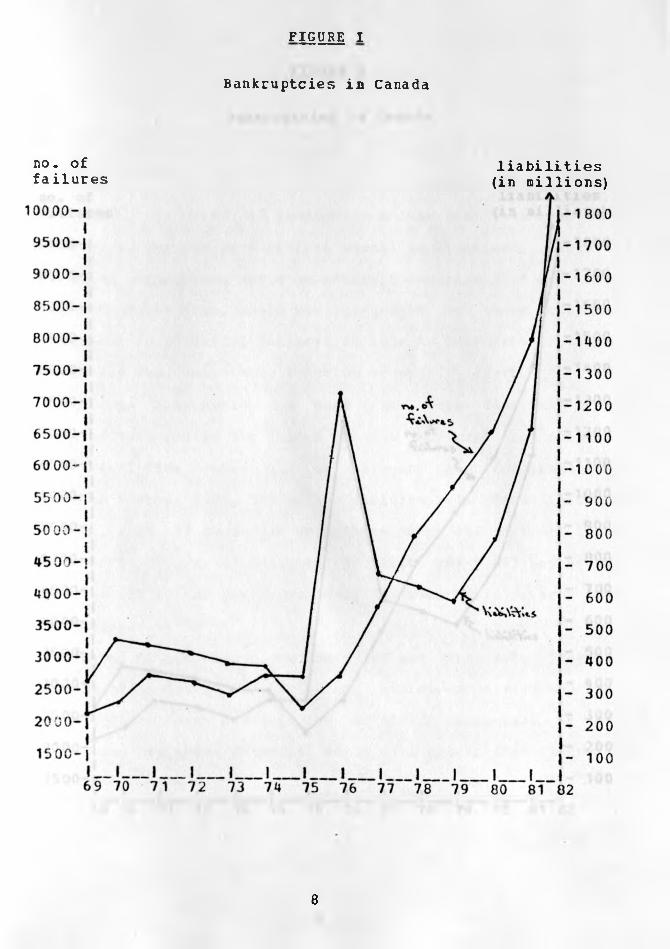
FIGURE I
Bankruptcies in Canada
no- °f liabilitiesfailures (in millions)
8
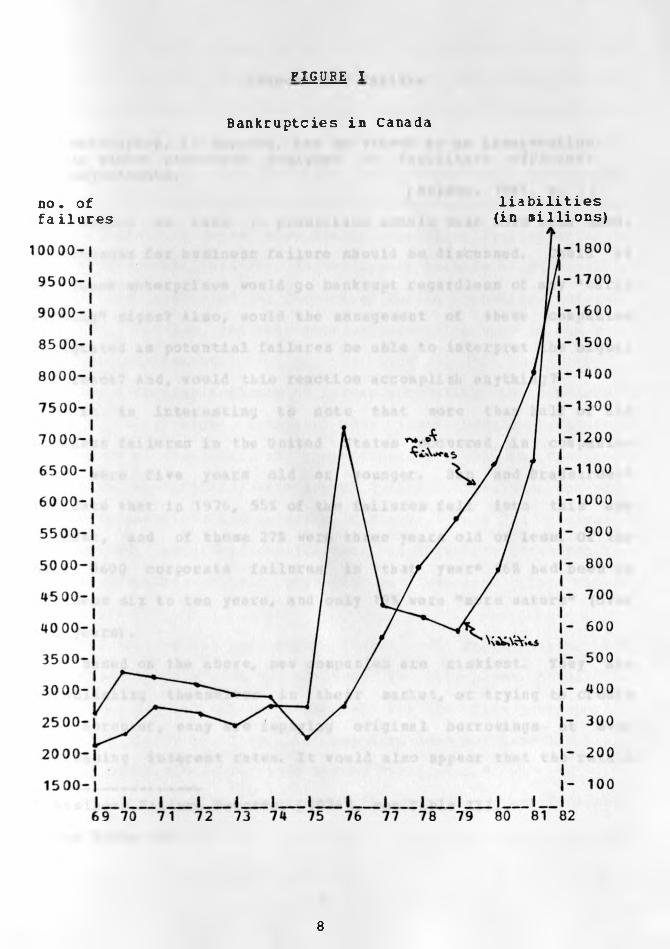
FIGURE I
Bankruptcies in Canada
no. of liabilitiesfailures (in millions)
8
Seasons for Failure
Bankruptcy, it appears, can be viewed as an intervention in market processes designed to facilitate efficient adjustments.
[Nelson, 1981, p. 3]
Before we turn to prediction models that have been used,
the reasons for business failure should be discussed. Could it
be these enterprises would go bankrupt regardless of any "early
warning” signs? Also, would the management of these companies
designated as potential failures be able to interpret the signal
and react? And, would this reaction accomplish anything?
It is interesting to note that more than half of all
business failures in the United States occurred in companies
that were five years old or younger. Dun and Bradstreet5
indicate that in 1976, 55% of the failures fell into this age
bracket, and of these 27% were three years old or less. Of the
over 9600 corporate failures in that year6 26% had been in
business six to ten years, and only 19% were ”more mature” (over
ten years) .
Based on the above, new companies are riskiest. They are
establishing themselves in their market, or trying to create
one. Moreover, many are repaying original borrowings at ever
increasing interest rates. It would also appear that the retail
5 Business Failure Becords, [1976], see Table III.
6 See Table IV.
9
industry is more susceptible to early catastrophe. The Dun and
Bradstreet studies indicate that over 34% of the retail failures
occurred in the first three years, whereas only 15% occurred in
firms over ten years of age. In comparison to the retail
industry, 25% of the failures in manufacturing were in the earlier period, and 25% in the latter. The indications are that
those industries deemed more stable, specifically manufacturing
and the wholesale industry, do not appear to have a discernible
"life,” as indicated by the age of failed companies. However,
the retail service, and construction industries vary in the ages
of failed businesses.
Are there implications as far as accounting is concerned?
Firstly, they might indicate that there should be greater
disclosure of financial, and non-financial data in "younger"
companies specifically relating to future obligations, non-arms
length transactions and so forth. Moreover, from an analyst's
perspective, solvency requirements and liquidity standards for
credit decisions should probably be increased for these
com panics.Secondly, youth may short-circuit, or even negate, the
prediction models to be reviewed in this paper. As will be
shown, the studies generally use data for the five-year period
preceding failure. Thus, if the firm does not have the track
record, other lodels may be a better "predictor."
If, however, the higher risk characteristic prevails before
the requisite period can be completed, other intangible factors.
10
will have to be closely examined (such as directors* abilities,
management's past track records, etc.). Again, this may indicate
that other items should be disclosed in financial statements-
In other words, should a question be posed regarding a
trade-off between supplementary information and a "track
record"? On the other hand, one could also speculate that the
information disclosed in the initial years may still be of value
to statement users as the company matures. It may, therefore, be
sufficient to say that the year of start-up should be clearly
disclosed as an integral part of the financial statements.
Pegardless, this point should be kept in mind when evaluating
predictive models. Possibly different models should be used,
based on the stage of the companies* development cycle. For
instance, the critical levels could be changed depending on the
"maturity" of the particular enterprise, cr different weights
should be attached to certain data points.
Age, by itself however, can not be the cause of failure.
According to Dun and Bradstreet, records for both Canada and the
United States indicate that the causes of bankruptcy can be
categorized into four main areas; "financial control,""uninsured disasters," "neglect," and "premeditated disasters."
The main grouping has been given the title of "financial
control," and includes apparent causes such as poor location,
competitive weakness, receivables and inventory difficulties,
and the most obvious — inadequate sales. Of the four groups,
this one deals with the actual management abilities within the
11
company. Thus, the statistics indicate that "better” management
of the finances might have "saved" a large portion of the failed
companies. On the other hand, it also indicates that the
majority of these failures are due to the firm's inability to
avoid certain economic conditions. Also, only a few failures were brought on by fraud, or "natural disasters". These latter
causes can therefore be disregarded.
The above indicates that timely financial statements, as
the record of economic events, are of extreme importance.
Therefore, an effective financial reporting system must be in
place before a company "opens up for business." The flow of
information must be relevant, timely, and accurately present the
financial position of the enterprise to management and/or
owners.
Moreover, this information may be used to predict the
future of the company. In fact, the Financial Accounting
Standards Board in the United States indicates that information
on past earnings (i.e. previous years net income) can be
utilized to predict future cash flows [FASB, 1978]. Regardless,
the point is that financial information can be analyzed and can
form the basis of predictions for future events — budgeting
being the best example. It therefore is reasonable to assume
this information can be used as an "early warning" mechanism of impending disaster.
Of note is that the majority of bankruptcies fell into the
category of "inadequate sales" (U4% in the U.S., and 65% in
12
Canada) . This might negate any possible value of failure
prediction models.7 After all, if the company can not sell its
goods and services, collapse is imminent — regardless of past
earnings and any predictions of future life. Moreover, the
economist would argue that the company should not be in business
anyway!
In essence, this indicates that firms should include
probabilistic budgeting,8 complementary to survival forecasting
models in their arsenal. This includes breakeven analysis and
cost-volume-profit models.
A sound knowledge of cost-volume-profit behavior and cost interrelationships is essential to many business decisions. Information which is easily understood but may not represent reality can lead to costly errors in judgement in business decisions.
[Raun, 1964, p. 927]
The utilization of such budgeting models, allows for a degree of
flexibility in the control of revenues and costs. By using, for
example, regression techniques the firm may be able to forecast
sales, based on available data. In other words, a theory of
sales and earnings could be developed.
This would allow management to be prepared to respond to differences in sales volume, and to choose among available
alternatives. [Jaedicke and Robichek, 196U, p. 917] Moreover, probabilistic models can utilize measures for relative risk of
7 Unless, of course, a model can be used to effectively predict future sales.
8 As opposed to "traditional” single scenario budgeting.
13
Thus, in tines of recession as the present, the number of
available alternatives.9
failures. and therefore risk. increase dramatically. This ir
itself does not mean that "good** predictive mode Is are even more
necessary. On the contrary. it could make the exercise
irrelevant. What happened last period, nay of course have no
relevance to the current period. If the company suddenly loses
its’ market or the market itself disappears, any predictive
model is of no help to the managers of the business. 9
9 See also Parker and Segora [1971], and Ferrara and Hayya [1970].
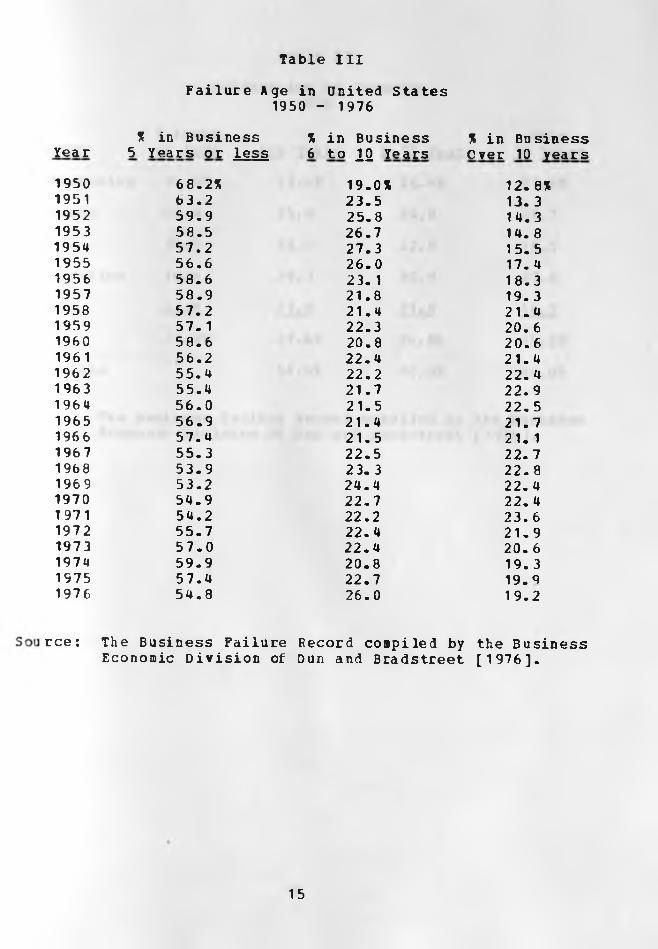
Table III
Failure Age in United States 1950 - 1976
% in Business % in Business % in BusinessYear 5 Years or less 6 to 22 Years Over 10 years1950 68-2% 19.0% 12. 8%1951 63.2 23.5 13. 31952 59.9 25.8 14.31953 58.5 26.7 14. 81954 57.2 27.3 15. 51955 56.6 26.0 17. 41956 58.6 23. 1 18.31957 58.9 21.8 19. 31958 57.2 21.4 21.41959 57. 1 22.3 20.61960 58.6 20.8 20.61961 56.2 22.4 21.41962 55.4 22.2 22. 41963 55.4 21.7 22.91964 56.0 21.5 22.51965 56.9 21.4 21.71966 57.4 21.5 21. 11967 55.3 22.5 22.71968 53.9 2 3. 3 22.81969 53.2 24.4 22. 41970 54.9 22.7 22. 41971 54.2 22.2 23. 61972 55.7 22.4 21.91973 57.0 22.4 20. 61974 59.9 20.8 19. 31975 57.4 22.7 19.91976 54.8 26.0 19.2
rce: The Business Failure Record compiled by the BusinessEconomic Division of Dun and Bradstreet [1976].
15
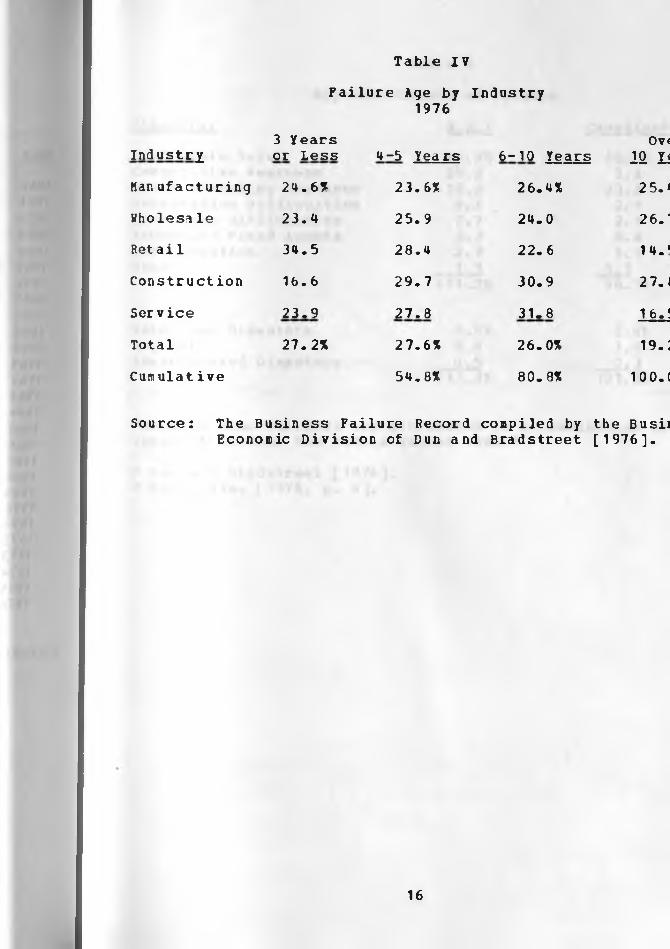
Table IV
Failure Age by Industry 1976
Industry3 Years or Less 4-5 Years 6-10 Years
Ov<12 n
Han uf actur ing 24.6* 23.6* 26.4* 2 5. fWholesale 23.4 25.9 24.0 26.'Ret ail 34.5 28.4 22. 6 14.‘
Construction 16.6 29.7 30.9 27.1
Ser vice 23.9 27.8 31.8 16.!
Total 27. 2% 27.6* 26.0* 19.;Cum ulat ive 54.8* 80.8* 100.(
Source: The Business Failure Record compiled by the BusiiEconomic Division of Dun and Bradstreet [1976].
16
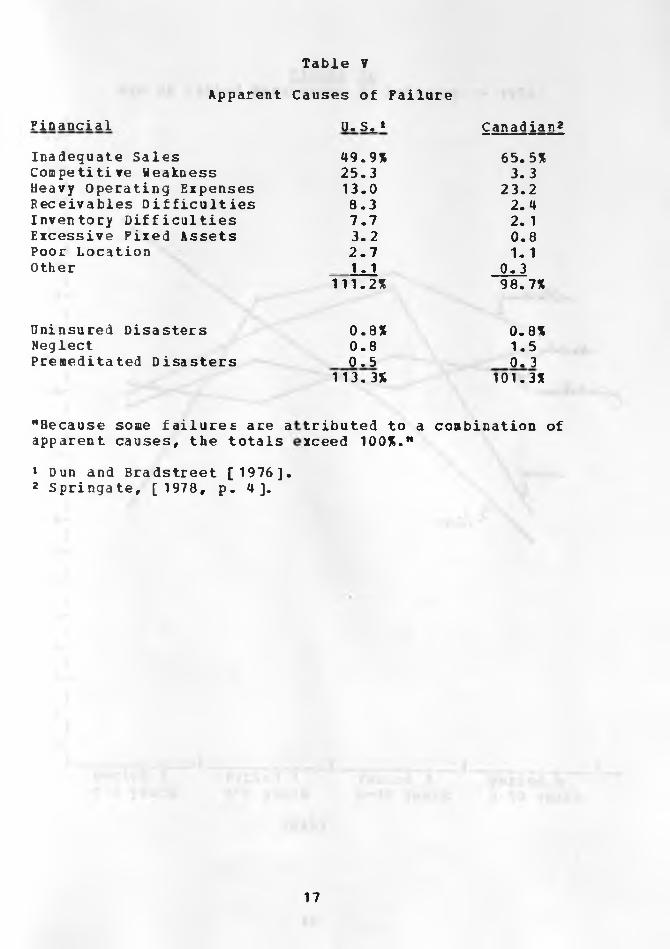
Table ?
Apparent Causes of FailureFinancial
Inadequate Sales Competitive Weakness Heavy Operating Expenses Receivables Difficulties Inventory Difficulties Excessive Fixed Assets Poor Location Other
Uninsured Disasters NeglectPremeditated Disasters
"Because some failures are a apparent causes, the totals
U. Si* Canadian249.9% 65.5%25.3 3.313.0 23.28.3 2.47.7 2. 13.2 0.82.7 1. 11.1 0.3
111.2% 98.7%
0.8% 0.8%0.8 1.50.5 0. 3
113.3% 101.3%
tributed to a combination of xceed 100%.w
1 Dun and Bradstreet [1976].2 Springate, [ 1978, p. 4].
17
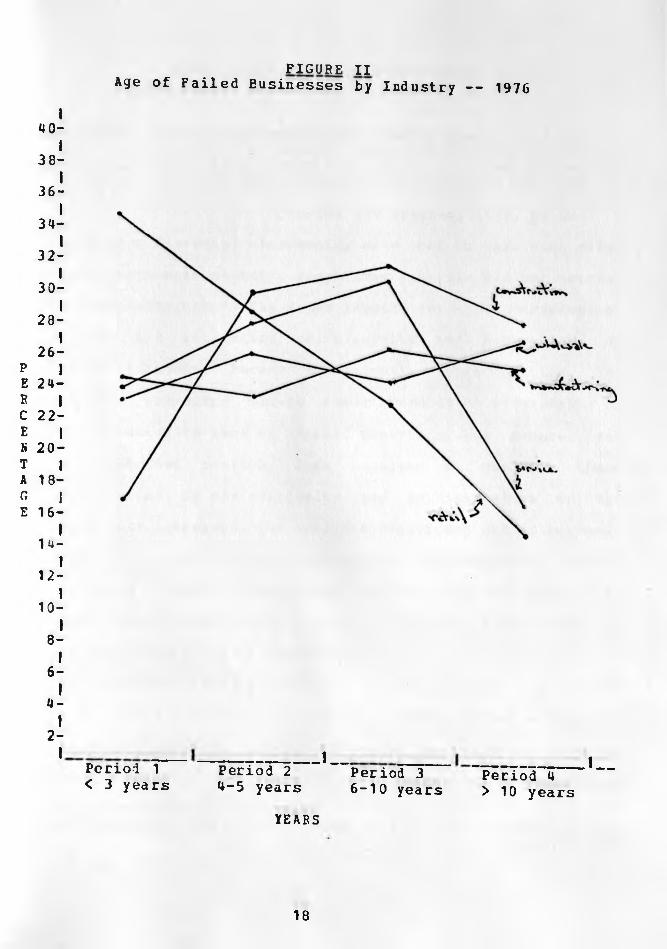
FIGURE IIAge of Failed Eusinesses by Industry -- 1976
4 0- I
3 8-I
36-I
3 4-I
32-I
30-I
28-I
26-P IE 24-R IC 22-E I N 2 0 - T | A 18- G | E 16-
I14-
I1 2 -
I10-
I8 -
I6 -
I4-I
2 -
Perioi 1 < 3 years
Period 2 4-5 years
._ !___Period 3 6-10 years
Period 4 > 10 years
1_
YEARS
18
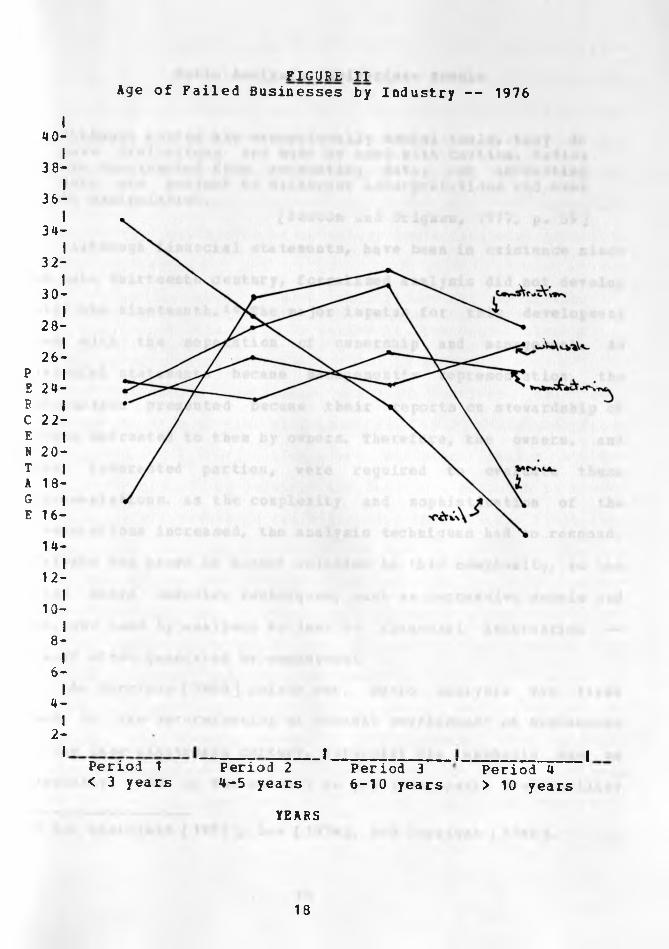
FIGURE IIAge of Failed Businesses by Industry -- 1976
4 0- I
38-36-
34-I
32 -I
3 0 -I
2 8 -I
2 6 - P IE 24-R IC 2 2 - E l N 2 0 - T I A 18-G IE 16 -
I14-
I12 -
I10-
I8 -
I6 -
I4-
I2-
Period 1 < 3 years
IPeriod 2 4-5 years
Period 3 6-10 years
__IPeriod 4 > 10 years
YEARS
18
Ratio Analysis, Univariate Models
Although ratios are exceptionally useful tools, they do have limitations and must be used with caution. Patios are constructed from accounting data, and accounting data are subject to different interpretations and even to manipulation.
[Weston and Brigham, 1977, p. 59]
Although financial statements, have been in existence since
the late thirteenth century, formalized analysis did not develop until the nineteenth.10 The major impetus for this development
came with the separation of ownership and management. As
financial statements became management’s representation, the
information presented became their reports on stewardship of
assets entrusted to them by owners. Therefore, the owners, and
other interested parties, were required to evaluate these
representations. As the complexity and sophistication of the
presentations increased, the analysis techniques had to respond.
Analysis has grown in direct relation to this complexity, to the
point where computer techniques, such as regression models and
HDA, are used by analysts to look at financial information —
itself often generated by computers!
As Horrigan [ 1968 ] points out, ratio analysis was first
used in the determination of "credit worthiness" of businesses
in the late nineteenth century. Naturally the emphasis was on
liquidity, and on the ability to pay (or repay). Profitability
10 See Chatfield [ 1977 ], Lev [1974], and Horrigan [ 1968 ].
19
was also of prime interest to the analysts as an indicator of a
basic "credit risk". As the sophistication of business continued
a new concept of current and non-current assets and liabilities
was established. Foulke [1961, p. 181] indicates that working
capital, first appeared in financial data in 1891. With this change in presentation, working capital became a very important part of the evaluation of an enterprise's financial position.
The current ratio,
... was to have a more significant and longlasting impact upon financial statement analysis than any other ratio. Truly, the usage of ratios in financial statement analysis can be said to have begun with the advent of the current ratio [Horrigan, 1968, p. 285].
By the 1920s systematic analysis routines had been
established. At that time Alexander Wall [1919] wrote his "Study
of Credit Barometrics", taking seven different ratios of 981
firms, stratified by industry and location. Although this work
has been criticized on academic grounds, this was the first real
breakthrough in ratio analysis. It would appear that this was
the first general recognition of the benefits of a "multi-ratio"
type of analysis. In the same year, the DuPont Company developed a model using multi-ratios for managerial use, called the
"triangle" system [see Kline and Hessler, 1955]. This system had
"return on investment" (profits/total assets) on the top of the
triangle, and "profit margin" (profits/sales) and "capital turnover" (sales/total assets) ratios along the sides. Although
this system was not generally accepted then, the concept of
Feturn on Investment [BOI] with its two components has become
20
the basis of "responsibility accounting".
By 1930r the emphasis of analysis shifted, from
"credit-worthiness", to one of failure prediction. In addition,
the formation of the SEC in the United States, and the
publishing of Dun and Bradstreet services on a regular basis
improved the "data base" and increased the demand for more, and
better information.
At this stage, writers began to compare ratios of failed
versus non-failed firms in an attempt to set out a predictive
model, concentrating on the change in ratios in the year
preceding failure. Another impetus for the research was to
clarify ratios of importance to determine which should be
highlighted in any evaluation of financial data. Ramser and
Foster [1931] studied the irforaation of 173 companies in
Illinois, and examined eleven types of ratios. At first, their
conclusions appear trivial as they stated that
... firms which turned out to be less successful, and those which failed, tended to have ratios which were lower than the more successful firms [Horrigan, 1968, p.289 ].
Nevertheless, they determined that sales to net worth, and sales
tc total assets were opposite to their general conclusion.
Winaker and Smith [1930] also looked at ratios as indicators of "financial difficulties". Their work consisted of
taking ten-year trends for companies failing in 1923 to 1931.
Their findings, based on the evaluation of 21 ratios, was that
the best indicator of difficulty was the ratio of net working
capital tc total assets. They also saw a steady decline in this
21
ratio beginning ten years before an individual firms* collapse.
Moreover, the rate of decline increased as failure approached,
and was the basis of their conclusions. However as pointed out
by many writers there were two main flaws with their review.
First, they did not have a Mcontrol group”, of non-failed firms
with which to compare results. Second, they did not reconcile
their analysis with the general economic events of that time
(being the beginning of the "great depression"). Thus, although
their conclusions are not theoretically valid, they succeeded in
confirming the importance of working capital. Interestingly, in
more sophisticated multivariate techniques, the working capital
to total asset ratio remains the most important, and "best"
predictive statistic in the analysis of business failure.11 More
specifically, the ratio of current assets to total assets is
determined, using Wilks* Lambda, [Wilks, 1967] to be the "best"
predictor of failure.
A third study [Fitzpatrick, 1931], improved on these
earlier works. It was the first of its type to "match" failed
and non-failed firms, and was done over the nine-year period of 1920-1929. This study analysed nineteen pairs of firms (using
asset size and sales, for the matching) and studied the three to
five year trends of the groups prior to failure. The study found
that the twenty ratios selected12, accurately predicted failure.
11 See the studies in the following section on multivariate models, and HDA for discussion of Wilks* Lambda.12 See Appendix I.
22
Moreover, the "best” indicators were profits to net worth, net
worth to debt, and net worth to fixed assets. The study
concluded [Fitzpatrick, 1931, p. 731] that ratios deteriorated
as failure approached. Therefore the ratios were valid
indicators of disaster.
derwin's [1941] study brought together ideas of previous
works, as he looked at latched firns for the six year period
preceeding failure. He compared failed fins with what he called
"estimated normal" ratios. In essence these latter ratios were
based on the projected financial position of the failed
coapanies had they maintained the same average ratios as the
surviving firms. Using 900 firms, with assets less than
$250,000, his results indicated that three ratios in particular
could be used as predictors of failure from five years before
"discontinuance" of operations. These ratios were: currentratio, net worth to total assets, and net working capital to
total assets. As Horrigan [1968, p. 89] indicates, "Herwin's
study was the first really sophisticated analysis of ratio
predictive power, and the findings of the study still appear to
be credible".
One other study of note was done in 1959 by James Walker.
He proposed that the funds statement ratio could be used instead
of working capital for predictive purposes. He theorized that
net cash flows could be used to determine "technical solvency",
which he defined as the ability to meet current liabilities
("obligations maturing within twelve months"). Of this work.
23
Comerford wrote:
Halter demonstrated an alternative to working capital position as an indicator of technical solvency..,. This new type of ratio, the funds statement ratio, brought net cash flows and related considerations into prominance. [Comerford, 1976, p. 62]
According to Horrigan [1968, p. 292] Halter was the first to
specifically incorporate the funds flow statement into ratio
ana lysis.13
Hilliam Beaver [ 1 967 ] wrote what is considered as the
benchmark study on bankruptices using univariate analysis.14 He
collected data on failed15 firms from 1954 to 1964 and matched
them with non-failed corporations; based on industry, as well as
asset size, over a five year span. He took thirty ratios for
each year and concluded that six could be useful in the
development of a "profile analysis". This analysis was not used
to strictly determine failure potential, but to outline the
"general relationships" existing between the matched firms.
Beaver used mean values in his analysis, such that for each matched pair of firms, the ratio of the non-failed firms is
deducted from the ratio of the matched firm to "mitigate the
potentially disruptive effects of industry and asset size"
13 This is interesting in light of the FASB's assertion that net income is a good indicator of future cash flows. See also Spector [1981].
14 Cf this work, Horrigan [1968, p. 291] wrote "this study will undoubtedly become a landmark for future research in ratio analysis" .
15 Failed meaning bankruptcy, or default on either bond payments or preferred stock dividends.
24
[Beaver, 1967, p. 75]. Thus, instead of using the absolute
ratios, Beaver looked at the difference of the ratios to examine
for trends and predictors. Ihe lean of the ratios was computed
for the failed and non-failed f i n s in each of the years before
failure. The comparison of these mean values Beaver called the
"profile analysis". This analysis facilitates a comparison
with previous studies, since their analysis was based entirely
upon the mean values" [Beaver, 1967, p. 79]. In other words, the
profile allowed testing for more than one specific attribute,
and its overall effect on the firm, its "profile analysis"
effect, whereas previous studies looked only at changes in a
particular mean value. 16
Beaver [1968, p. 80] put forth four concepts with respect
to the "liguid-asset-flow", or cash-flow, of the enterprise. He
hypothesized that the probability of failure decreased as:
• the "reservoir" of current assets increased• cash-flow increased,• outstanding debt decreased, and• "fund expenditures" from operations decreased.
Using the above, he developed a set of six ratios to be tested,
and determined that the ability to predict failure was strongest
in the cash-flow to total-debt ratio. He indicated that the propositions held, and the ratios were as predicted for five
years before failure. Moreover, their change in direction
correctly indicated imminent failure. He concluded by saying
16 Beaver asserted that this work could "... convey useful information in determining solvency for at least five years before failure." [Beaver, 1967, p. 98].
25
that:
Even with the use of ratios, investors will not be able to completely eliminate the possibility of investing in a firm that will fail. This is a rather unfortunate fact of life, since the costs in that event are high [ Beaver, 1968, p. 91].
With this high cost in mind, and the indications that more
than one ratio is required, it would appear, and Beaver agrees,
that univariate analysis is limited. A change in a particular
ratio may predict an occurrence with a degree of probability,
but it does not take account of the interrelationships of the
financial statement model. In other words, the changes in
combined ratios would probably be of better predictive quality
in looking at the possibility of failure.
26
Ratio Analysis, Multivariate Models
Under the dominant approach of 'pragmatical empiricism,' the user of ratios is required to rely upon the authority of an author's experience. As a result, the subject of ratio analysis is replete with untested assertions about which ratios should be used and what their proper levels should be; and similarly, the expected relationships of the various ratios with a quantification of some desired, or undesired end have generally not been formulated.
[Horrigan, 1968, p. 294]
As previously mentioned this analytical approach looks at
all selected ratios in an attempt to build a more relevant
predictive model. "The major feature of the multivariate
approach to failure prediction is the simultaneous consideration
of several indicators in the prediction process" [Lev, 1974, p.
145].
Heir Tamari [1966] was one of the first to look at ratio
analysis in this way. His idea was to weight the ratios such
that those deemed important would be given more emphasis. The
weightings Tamari gave to six ratios of importance were
calculated to yield an index of the individual firm's risk.
Thus, "...each [ratio] is given a weight according to its
importance in the eyes of financial analysts, economists, and
credit men..." [Tamari, 1966, p. 19].
By applying these weightings, he developed a critical
threshold such that firms under a "low level" (set at 30 points) had a good chance of failing, whereas firms over a "high level"
(60 points) had a low probability of failure. It is interesting
27
to note th a t T a a a r i ' s o b j e c t i v e was not to deve lop
fa i lure p r e d i c t i o n a o d e l , but to see i f r a t i o s coul<
in f i n a n c i a l a n a l y s i s , i n o t h e r words, he did not
study t o be deemed a s a " s c i e n t i f i c " i n d i c a t i o n <
d i f f i c u l t i e s . He c o n c lu d e d tha t p r e v i o u s s t u d ie s , l i l
do not p ro v e t h a t companies with weak r a t i o s < index n e c e s s a r i l y go bankrupt o r f a i l t o e v e n t u a l l y . I t i s t h e r e f o r e n ecessary t o s' p r o b a b i l i t y o f f i r a s with d i f f e r e n t i n d i c e s bankrupt o r im p ro v in g t h e i r f i n a n c i a l p o s i t i o n [ 1966, p. 2 0 ] .
This, th en , i s th e b a s i s o f the d i s c r i a i n a t e anal y:
to development o f f a i l u r e p r e d i c t i o n . I f r a t i o s of
could be d e t e r a i n e d , and weights a t t a c h e d , the resi
an i n d i c a t i o n o f th e f i r a s r e l a t i v e " r i s k " .
On the matter o f these " w e i g h t s " , Taaari
assigned h i s w e i g h t s , in that "no a a th e a a t i c a l
employed" [ B o th e r a s , 1979, p. 1 8 ] . However, he recogi
■ore advanced t e c h n i g u e o f a s s ig n in g weights should
for a t ru e p r e d i c t i v e a o d e l . HDk succeeds in
mathematically d e t e r m in e s w e ig h t in g s f o r those ra t io?
be r e l e v a n t . The f i r a s r i s k i n e s s i s then ca l cu la l
idea o f a c r i t i c a l l e v e l , can be detera ined (s*
comments in the f o l l o w i n g s e c t i o n ) .
Edward Altaan i n d i c a t e d i n h i s Ph.D. d is s e r ta l
that the t e c h n iq u e o f HDA was f i r s t used in tl
Pischer, f o r the grouping o f p lan t t y p e s , and by
id e n t i f in g v a r i a t i o n s o f s e a s u r e s e n t s o f Egyptian si
P. 27] , i n . o r e r e c e n t s t u d i e s Paul Boel [ 1962] de,
28
sethod in h i s a n a l y s i s o f r a c e s o f i n s e c t s , and the f i r s t studyin the b u s i n e s s f i e l d was c o m p l e t e d in 1964 by Neuwirth and
Shegda. T h i s l a t t e r s t u d y examined c r e d i t d e c i s i o n -m a k in g , and
its o b j e c t i v e was t o g r o u p l o a n s as " g o o d ” o r "bad” .
F in a n c i a l r a t i o s u s e d f o r f a i l u r e p r e d i c t i o n were examined
by Edaister i n 1 972 . I n u s i n g d i f f e r e n t a n a l y s i s t e ch n iq u es f o r
pred ic t ive pow er , he c o n c l u d e d t h a t HDA co u ld s e t t l e the dual
problem o f d e v e l o p i n g a p p r o p r i a t e r a t i o s and a ss ig n in g
appropriate w e i g h t s . He a l s o f o u n d th a t as a r e s u l t o f MDA a
simple f u n c t i o n c o u l d b e o b t a i n e d i n b u i ld in g the c r i t i c a l
leve ls [ B o t h e r a s , 1979, p . 2 0 ] .
flare Blum, d e v e l o p e d a * P a i l i n g Company Model*, in 1974, to
predict f a i l u r e , a s s o o n a s p o s s i b l e b e f o r e b a n k r u p t c y .18 Using
115 bankrupt f i r m s from 1954 t o 1958 with a s s e t s in e xcess o f $1
mil l ion, matched with 115 n o n - f a i l e d companies , he deve loped a
model f o r th e f i v e y e a r s p r e c e d i n g f a i l u r e . He then a p p l i e d
d is cr im inate a n a l y s i s t o s e e i f i t c ou ld d i s t i n g u i s h between
fa i l in g and n o n - f a i l i n g f i r m s . His a c c u r a c y was i n the range o f
94 percent one y e a r b e f o r e f a i l u r e , 80 p e rc e n t two years b e f o r e ,
and 70 p e r c e n t f o r t h r e e t o f i v e y e a r s b e f o r e f a i l u r e [Blum,
1974, p. 2 ] . Beyond f i v e y e a r s , d i s c r i m i n a t i o n was not found to
be s t a t i s t i c a l l y s i g n i f i c a n t , and:
Botheras” ' [ ^ 9 7 9 ] n o t e s t h a t Ftoneered MDA inevaluation o f c r e d i t in i n s t a l m e n t f i n a n c i n g .
i . His o t - l e c t i v e i n development o f a model vas t o analyse thehis o b j e c t i v e i i n o c t r i n e " , which a l lo w s f a i l i n g
l e g a i i s t i c " r a i l i n g Company . “ ege - i t h n o n - f a i l e d ones , thereby companies, m t h e U . S . , t o avoiding a n t i - c o m b i n e s l a w s .
29
. . . m c o m p a r i s o n w i t h o t h e r s t u d i e s o f b u s i n e s s f a i l u r e , the F a i l i n g Company Model was d e m o n s t r a te d t o be more r e l i a b l e th a n a r e p o r t e d m u l t i v a r i a t e model . However, i t s a c c u r a c y was o n l y a p p r o x i m a t e l y t h a t o f the l e a d in g u n i v a r i a t e s t u d y p u b l i s h e d t o d a te [ B e a v e r ' s ] . This c o n c l u s i o n s i m p l y r e i n f o r c e s t h e need f o r f u r t h e r r e s e a r c h [ B l u m , 1 9 7 4 , p. 1 4 ] .
In 1 972 , Edward Altman p u b l i s h e d h i s s tudy o f th e
p r e d i c t o r s o f f a i l u r e , u s i n g f i n a n c i a l r a t i o s . I n t h i s s t u d y ,
Altman s e l e c t e d 33 p a i r s o f m a n u f a c t u r in g f i r m s us ing i n d u s t r y ,
and a s s e t s i z e r a n g i n g f r o m $ 0 . 7 t o $ 2 5 .9 m i l l i o n [A l tm an , 1972,
p. 6 1 ] f o r t h e m a tc h in g c r i t e r i a . Twenty-two i n d i c a t o r s ,
( f i n a n c i a l r a t i o s and n o n - f i n a n c i a l v a r i a b l e s ) , were computed
for each f i r m i n t h e s a m p le . Of t h e s e i n d i c a t o r s , f i v e were
chosen t o h a v e t h e b e s t p r e d i c t i v e p o w e r , 19 us ing " . . . a
c l a s s i f i c a t i o n t e s t somewhat s i m i l a r t o B e a v e r ' s ” [ L e v , 1979, p .
146] . A l t m a n 's m o d e l , u s i n g t h e f i v e v a r i a b l e s , c o r r e c t l y
p r e d i c t e d 95 p e r c e n t o f t h e f i r m s in the f i r s t year , and 72
p e rc e n t two y e a r s p r e c e e d i n g f a i l u r e . His r e s u l t s i n d i c a t e d t h a t
a c cu r a c y d i m i n i s h e s beyond the two y e a r s , and that the model
becomes u n r e l i a b l e f o r p r e d i c t i v e a b i l i t y [A l tm a n , 1972, p. 7 3 ] .
In h i s g e n e r a l re mar ks on t h e ao d e l , Altman [ 1972, p. 82]
s t a t e d t h a t due t o t h e s m a l l sa m p le s i z e , and th e lon g p e r i o d
r e v i e w e d , on e m o d e l f o r a l l m a n u fa c tu r in g f i r m s was
i n a p p r o p r i a t e . M o r e o v e r , he i n d i c a t e d t h a t p a r t i c u l a r i n d u s t r y
g r o u p i n g s , o r g r o u p s o f r e l a t e d i n d u s t r i e s , would be more
r e p r e s e n t a t i v e (and p r e s u m a b ly " b e t t e r " ) o f the ty p e o f f i r m and
o f the sampled f i r m s . "
30
its environment.
Of further research, Altman suggested that Meyer and Pifer
[1970] is of "primary relevance to the subject". They developed
a linear regression model, similar to MDA, to predict commercial
tan* failures. This study involved 39 pairs of banks; with size,
location and age as the criteria used in the matching. For the
regression model 32 variables were computed, some quite
specific; for instance, growth of loans to total assets and
coefficient of variation of total loans. Similar to Altman, they
concluded that a reliable model could only be developed for a
two year time period before failure. Approximately 80 percent of
the sample was correctly grouped, but the model was not accurate
for two years preceeding failure or earlier [Lev, 1974, p. 148].
In 1973, Balmeister and Jones duplicated Altman's study of
railroad failures, using MDA with companies of a larger size. It
was indicated that although the predictive ability of their
model was not as "good" as Altman's, MDA could be used to point
out those companies "which possess a profile which is
significantly similar to firms which have failed in the past."
[Balmeister and Jones, 1973, p. 15]
Robert Libby [1974] utilized the MDA technique in two
separate studies. The first study looked at decision-making by
loan officers and the second at the use of MDA as a predictor.
His initial study concerned itself with the behavioral aspects
of decision-makers. A summary of his findings indicate that a
decline towards failure will continue, even if there are
31
substantial changes within the firs, for example management
shake-up or merger. Thus:
...the author concluded that H D A models accurately predicted failure even when the decision-maker'sprocesses intervened in the usual routine of firms [Springate, 1978, p. 27].
In the second study, Libby used a step-wise method of
determining the '•best*' predictors with ratios used by Beaver.
The resulting ratios20 are similar to those finally selected by
Altman. Libby summarized that the predictive capacity of a model
with as few as five ratios, is only slightly less than one with
the fourteen initially selected,21 and that five appeared to be
the optimal number.In a newspaper article in 1977, Richard Taffler indicated
that, using MCA, he had developed a "risk profile index" for
English companies. He generated this index by using
"off-setting" ratios such that a critical index value could be
generated. The critical value was set equal to zero, and thus a
firm with a negative value (similar therefore to a Z-score)
would be classed as a failed firm, and non-failed enterprises
would have a positive score.
Current research in bankruptcy Prediction models is
including current value accounting inforiatin in its analysis.
Interestingly research has indicated that including data
adjusted for inflation does not improve the predictive ability.
20 See Appendix II.21 Predictive power declined from 90% to 85% [Springate, 1978,p. 28].
32
Norton and Snith [1979] indicated that including general price
level [GPL] financial information does not add to the predictive
quality over conventional accounting models,22
flensah [1983] included specific price-level adjusted [SPL]
data for prediction and compared SPL to historic cost [HC]
accounting models (in addition to an HC/SL model) using MDA , in
a one-tailed t-statistic, and logistic regression.
The results of the discriminant analysis show that there is no difference in predictive accuracy between the SPL and combined HC/SPL models on one hand, and the HC model on the other at any of the visual significance levels.When costs are accounted for, the SPL model dominates the HC model, but both dominate the HC/SPL model.
[Mensah, 1983, p. 241]
With Canada moving towards current cost accounting, with
the issuance of section 4510 of the CICA Handbook in 1982,23
research is now being focused on the influence of
"inflation-accounting” data predictive models. It will be interesting to see replications of studies using PIDA with the
adjusted data. However it will take some time, before
preliminary results are made available. Hopefully the
conclusions of Norton and Smith [1979] can be discounted, and
the expense of adjusting accounting data for the effects of
changing prices is of some benefit.
22 See also Solomon and Beck [ 1980 ] and Ketz [ 1978 ] who indicated that the Norton and Smith study did not examine the use of GPL information in the supplementary statement form.
23 Currently requiring current cost information, for certain corporations, on a supplementary basis.
33
Multiple Discriminate Analysis
The operation performed by MDA is essentially to identify the variables, and their relationships to each other, which best distinguish between groups but which are most similar within groups,
[Comerford, 1967, p. 71]In a sophisticated method of multivariate analysis,
Multiple Discriminate Analysis, is used to discriminate (or
group) a sample into a priori groupings. It is effective when
there is more than one independent attribute, or variable, and
can be used to divide the sample into a maximum of X-1 groups,
(where X is the number of variables). As the discrimination is
based on all the variables simultaneously, it is a more advanced
technique than the rather simplistic methods used in univariate
models.
As this analysis looks at combinations of the variables, it
continues to improve the predictive ability, by adding variables
when they increase the difference between the means of the
groups. In other words, MDA will seek combinations that best
differentiate the groupings, without regards to the individual
variables* predictive ability. Added to these specific variables
will be the weightings, generated mathematically to maximize the
discrimination.
From the resultant linear equation developed, a Z value for
each firm is calculated. A critical index is then established
"at a point where there is a minimum number of
34
■isclassifications. The accuracy of the function is determined
from the number of aisclassifications of the samples.H
[Springate, 1978, p. 35] For a geometric interpretation of MDA,
see Comerford [ 1967, p. 224] and for a mathematical
interpretation, see Tatsuoka [ 1970, p. 25-38 ].
It is important at this point to look at the assumptions
involved in the utilization of MDA. First, it is assumed that
each group is identifiable and discrete. For failure prediction
purposes, two a priori groups are used, "failed" and
"non-failed" firms. Obviously, this discrete assumption does not
compromise the "reality" of the problem. The second important
assumption is that all observations (firms) can be described by
a set of accurate measurements. Again, this particularlassumption does not jeopardise the analysis, as the model uses
data from audited financial statements only.
The third basic assumption is that the critical value
indices, or "Z" scores, for each group has a normal
distribution. A normal distribution is required in order to
determine probabilities of incorrect classification of
observations from either group. No difficulties are seen with
this assumption, and to assume otherwise would severely limit
the use of MDA.
A discriminate function is calculated such that variables
and weightings maximize the difference between the means of the
groupings relative to the variance of the groups. Thus "... the
quality to be maximized is a familiar term in the analysis of
3WIvers'tty op NairobiLIBRARY
35
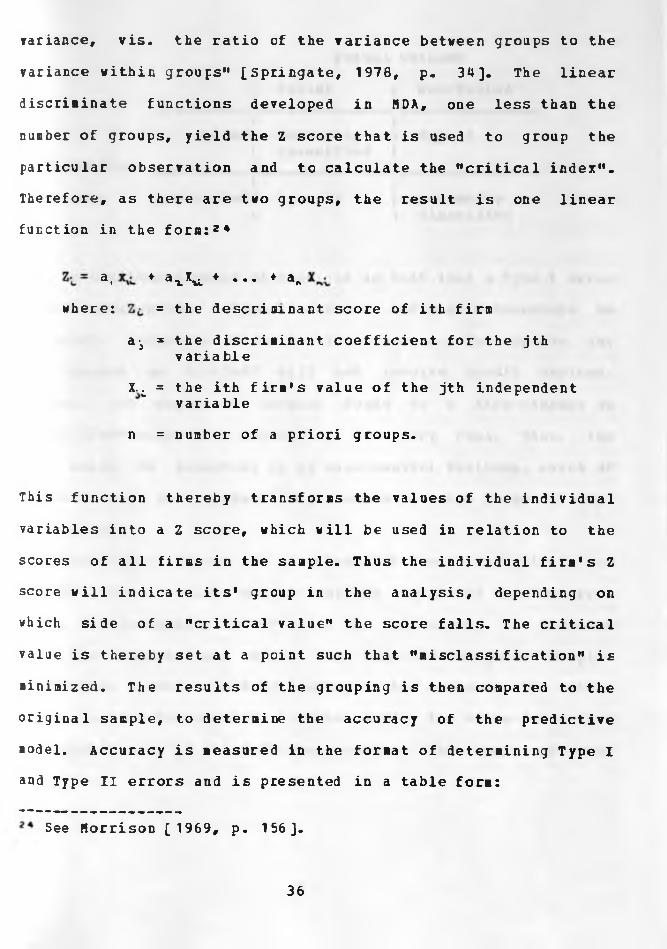
variance, vis. the ratio of the variance between groups to the
variance within groups" [Springate, 1978, p. 3**]. The linear
discriminate functions developed in HDA, one less than the
number of groups, yield the Z score that is used to group the
particular observation and to calculate the "critical index".
Therefore, as there are two groups, the result is one linear
function in the form:2*
a, ♦ axX^ ♦ ... ♦ a,where: = the descriminant score of ith firm
a-j = the discriminant coefficient for the jth variable
X.t = the ith firm's value of the jth independent variable
n = number of a priori groups.
This function thereby transforms the values of the individual
variables into a Z score, which will be used in relation to the
scores of all firms in the sample. Thus the individual firm's Z score will indicate its* group in the analysis, depending on
which side of a "critical value" the score falls. The critical
value is thereby set at a point such that "misclassification" is
minimized. The results of the grouping is then compared to the
original sample, to determine the accuracy of the predictive
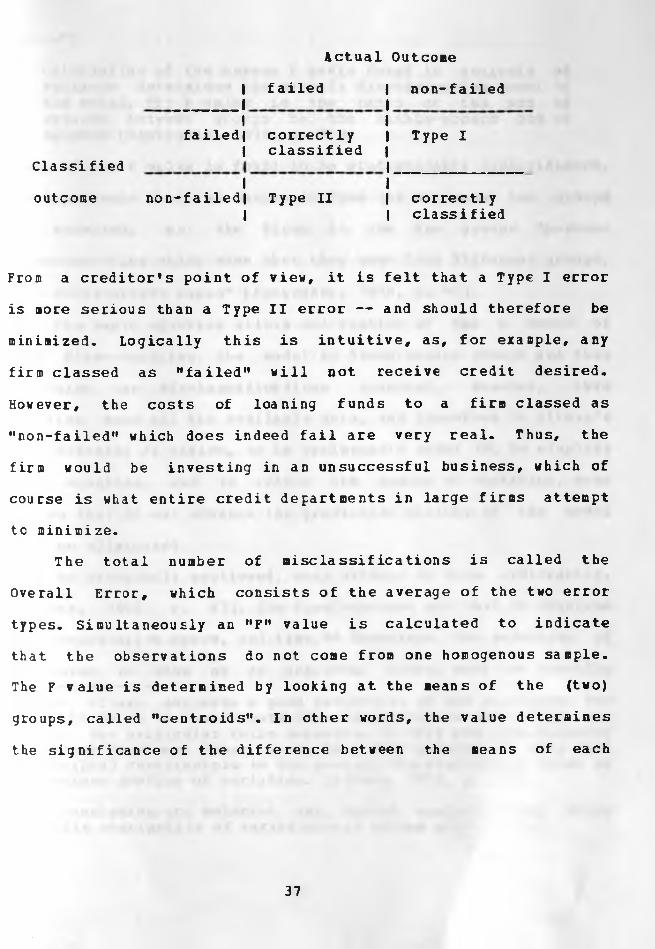
model. Accuracy is measured in the format of determining Type I and Type II errors and is presented in a table form:
See Morrison [ 1969, p. 156].
36
Actual Outcome
Classified
outcome
11
failed | non-failed
Ifailedl correctly
1I Type I 11 classified
1non-failed| Type II
1| correctly
1 | classified
From a creditor's point of view, it is felt that a Type I error
is more serious than a Type II error — and should therefore be
minimized. Logically this is intuitive, as, for example, any
firm classed as "failed" will not receive credit desired.
However, the costs of loaning funds to a firm classed as
"non-failed" which does indeed fail are very real. Thus, the
firm would be investing in an unsuccessful business, which of
course is what entire credit departments in large firms attempt
to minimize.The total number of misclassifications is called the
Overall Error, which consists of the average of the two error
types. Simultaneously an "F" value is calculated to indicate
that the observations do not come from one homogenous sample. The F value is determined by looking at the means of the (two)
groups, called "centroids". In other words, the value determines
the significance of the difference between the means of each
37
ratio.2 s
Calculation of the common F ratio found in anaiysis of variance determines the overall discriminating power of the model. The F value is the ratio of the sum of squares between groups to the within-groups sum of squares [Springate, 1978, p. 40].
Thus, if the F value is found to be statistically insignificant,
the hypothesis that the sample is from (in our case) two groups
is accepted, as the firms in the two groups "possess
characteristics which show that they come from different groups,
on a multivariate basis” [Springate, 1978, p. 41].
The basic equation allows calculation of the Z score of
each firm— enabling the model to discriminate groups and thus
determine the mi scla ssif ica tions (errors). However, this
equation uses all the available data, and therefore in Altman's
case contains 22 ratios, or in Springate*s model 19. To simplify
this equation, and to reduce the number of variables, some
ratios that do not enhance the predictive ability of the model
must be eliminated.As previously mentioned, many writers do this arbitrarily,
[Altman, 1968, p. 47]. The disadvantages are that it requires
more computation space, and time.26 Therefore, the selection of
variables is done on an empirical basis, with the specific
25 As Altman suggests a good indication of how successful the ADA will be is to investigate the average values in each of the groups for particular ratio measures. If they are significantly different from each other, there is a good possibility they will be helpful contributors to the overall discriminanting power of a complete profile of variables. [Altman, 1971, p. 335]26 As variables are selected and tested against every other possible combinaticn of variables— as Altman chose to do.
38
ratios s e l e c t e d r a t i o n a l i z e d t o be the - b e s t - p r e d i c t o r s .
A mathematica l a l t e r n a t i v e i s Wilks ' Step-Wise Hetl
[ Milks, 1967 ] . Th is t e ch n iq u e uses a s t e p - v i s e approach in 1
evaluation o f s p e c i f i c v a r i a b l e s when added to the model, a
stors when the s t a t i s t i c a l output y i e l d s a d iscr im inat ion vJ
an acceptable degree o f m i s c l a s s i f i c a t i o n s . There fore , the moc
in i t ia tes i t s i t e r a t i v e procedure by s e l e c t i n g the variat
which best d i s c r i m i n a t e s , and c a l c u l a t e s the Wilks' Lambda. I
the second i t e r a t i o n , the model w i l l eva lu ate a l l the varianJ
and s e l e c t a se con d v a r i a b l e t h a t , a long with the f i r s t chose
improves the d i s c r i i i n a t i n g a b i l i t y .
In the s t e p - w i s e method, the v a r i a b l e with the large
F-value i s added at each i t e r a t i o n . [S p r in g a t e , 1978, p. 35]
In a d d i t io n , Wi lks ' method d e v e l o p s a measurement, ca l l
Lambda, o f "unused d i s c r i m i n a t i n g c a p a b i l i t y [ t h a t ] remains
the unused v a r i a b l e s . The l a r g e r the Lambda, the le s s l ike l ihe
that a l l the d i s c r i m i n a t i n g c a p a b i l i t y o f the var iab les has be
u t i l i z e d . " [ S p r i n g a t e , 1978, p. 3 6 ] .
Accord ing t o H c r r i s e n £ 1969, p. 157] another s t a t i s t i c
d i f f e r e n t i a t e , c a l l e d a f lahalanobis D* (which i s a t ransfor i
F~stat is t i c ) can be c a l c u l a t e d .After a t r a n s f o r m a t i o n t h i s D2 s t a t i s t i c becomes an F s t a t i s t i c , which i s then used t o see i f the two groups
. . - A f f e r e n t from each other . In tactare s t a t i s t i c a l l y d i f f e r e n t from each other . in ia c t ; K s a t f S ? 1i r d - p l T the . u l t i d i . e n s i o n a l sanalog_o f thefa m i l ia r t - t e s t ~ f o r tie s t a t i s t i c a l s i g n i f i c a n c e o f the
a- j r-iovA nn 139- 1h 4 ], and Hensah [ 1983, 230 ]?e ai h e C° I a t e r f o r 'an 'explanation o f the one-ta i ] t - s t a t i s t i c , and Lachenbruch* s u-method.
39
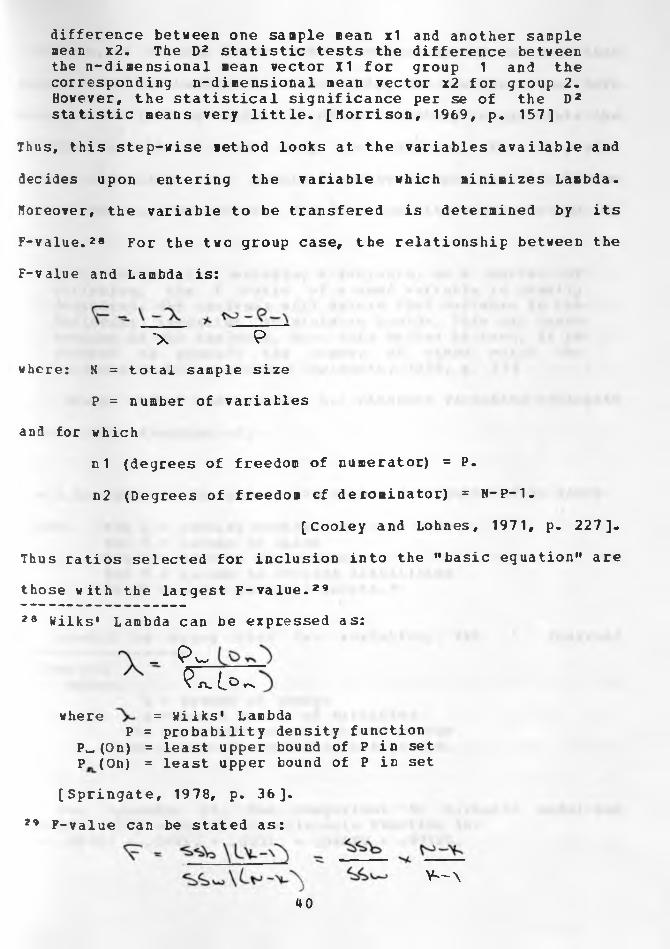
difference between one sample mean x1 and another sample mean x2. The D2 statistic tests the difference between the n-dimensional mean vector X1 for group 1 and the corresponding n-dimensional mean vector x2 for group 2* However, the statistical significance per se of the D2 statistic means very little- [Morrison, 1969, p. 157]
Thus, this step-wise method looks at the variables available and
decides upon entering the variable which minimizes Lambda.
Moreover, the variable to be transfered is determined by its
F-value.2* For the two group case, the relationship between the
F-value and Lambda is:
■x 9where: N = total sample size
P = number of variables
and for whichn1 (degrees of freedom of numerator) = P-
n2 (Degrees of freedom cf derominator) = N— P-1.[Cooley and Lohnes, 1971, p. 227 ].
Thus ratios selected for inclusion into the "basic equation" are
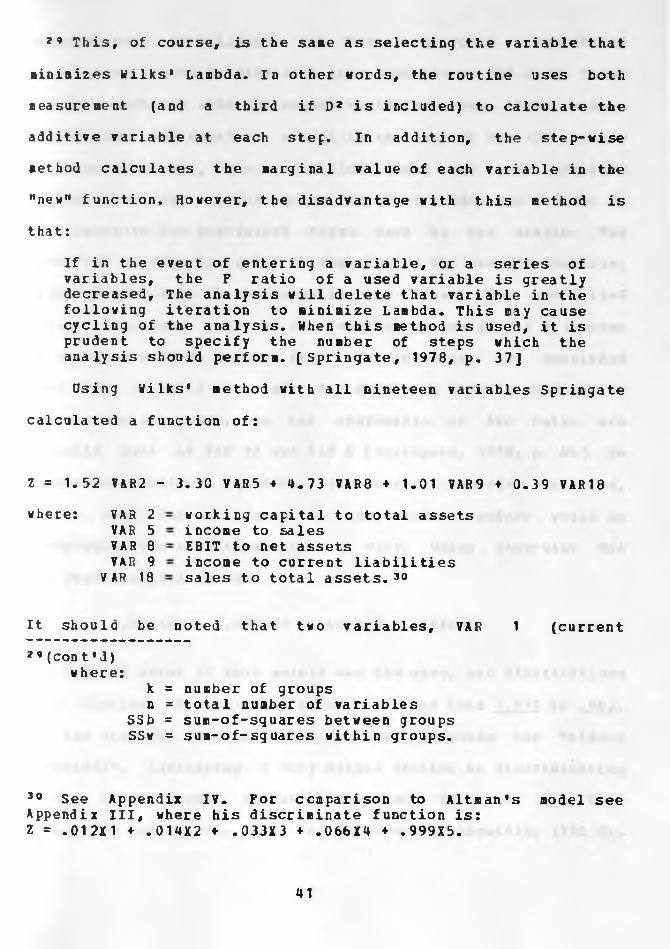
those with the largest F-value.2928 Wilks* Lambda can be expressed as:
_ P w
9 JV. {.O rv
where = Wilks* LambdaP = probability density function
Pw (On) = least upper bound of P in set p (On) = least upper bound of P in set
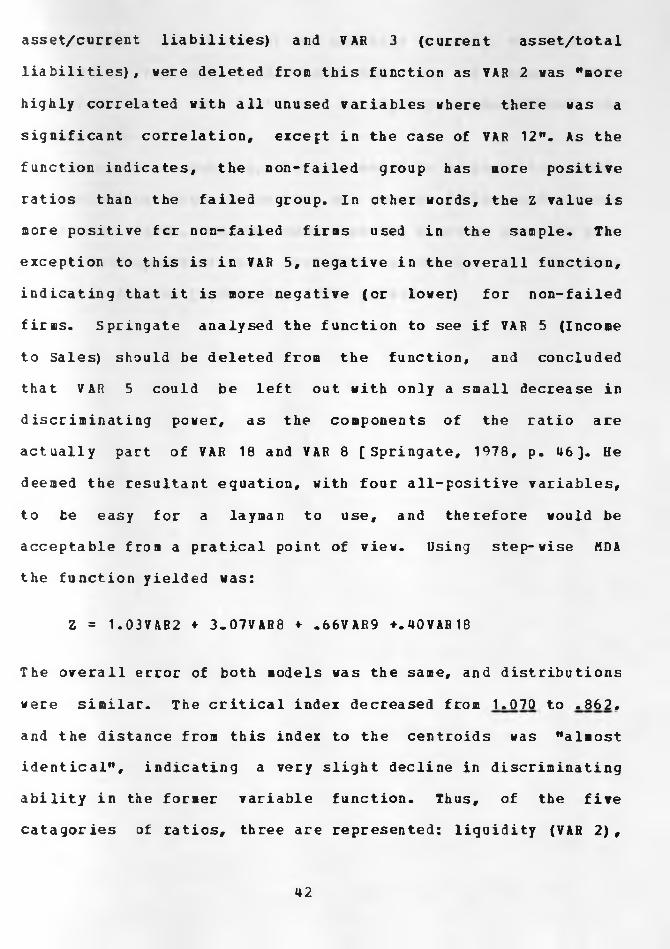
[Springate, 1978, p. 36].29 F-value can be stated as:
hoV— \
29 This, of course, is the saie as selecting the variable that
minimizes Wilks' Lambda. In other words, the routine uses both
measurement (and a third if D2 is included) to calculate the
additive variable at each step. In addition, the step-wise
■ethod calculates the marginal value of each variable in the
"new" function. However, the disadvantage with this method is
tha t:
If in the event of entering a variable, or a series of variables, the F ratio of a used variable is greatly decreased. The analysis will delete that variable in the following iteration to minimize Lambda. This may cause cycling of the analysis. When this method is used, it is prudent to specify the number of steps which the analysis should perform. [Springate, 1978, p. 37]
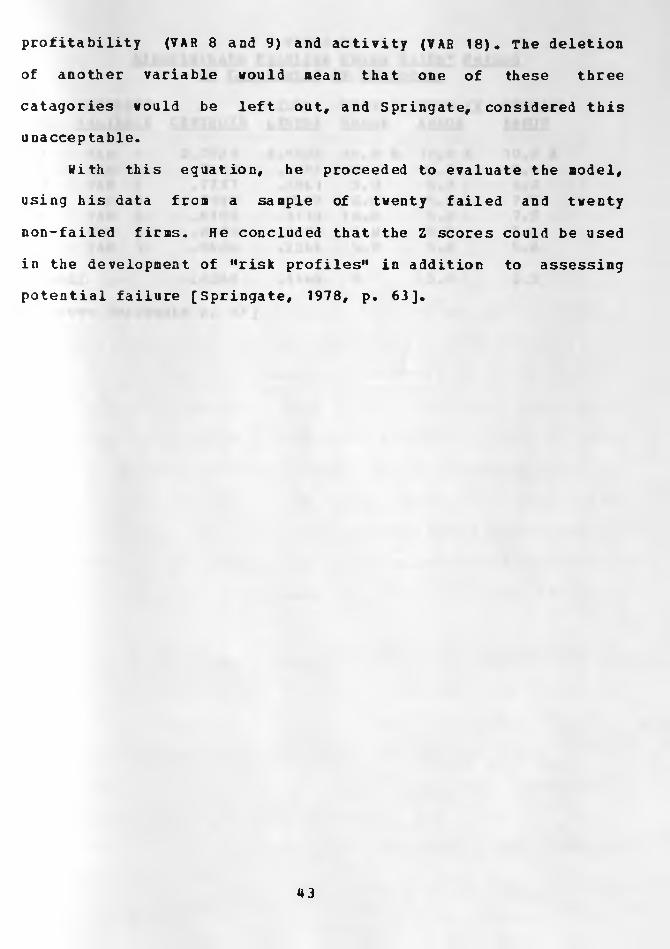
Using Wilks' method with all nineteen variables Springate
calculated a function of:
Z = 1.52 VAR2 - 3.30 V AR 5 ♦ 4.73 VAR8 ♦ 1.01 VAR 9 ♦ 0.39 VAR 18where: VAR 2
VAR 5 VAR 8 VAR 9
V AR 18
working capital to total assetsincome to salesEBIT to net assetsincome to current liabilitiessales to total assets.30
It should be noted that two variables, VAR 1 (current2 9 (con t'd)
where:k = number of groups n = total number of variables
SSb = sum-of-squares between groups SSw = sum-of-sguares within groups.
30 See Appendix IV. For comparison to Altman's model see Appendix III, where his discriminate function is:Z = .012X1 ♦ .014X2 «■ .033X3 ♦ .066X4 ♦ .999X5.
41
asset/current liabilities) and VAR 3 (current asset/total
liabilities), were deleted from this function as VAR 2 was "more
highly correlated with all unused variables where there was a
significant correlation, except in the case of VAR 12". As the
function indicates, the non-failed group has more positive
ratios than the failed group. In other words, the Z value is
more positive fcr ncn-failed firms used in the sample. The
exception to this is in VAR 5, negative in the overall function,
indicating that it is more negative (or lower) for non-failed
firms. Springate analysed the function to see if VAR 5 (Income
to Sales) should be deleted from the function, and concluded
that VAR 5 could be left out with only a small decrease in
discriminating power, as the components of the ratio are
actually part of VAR 18 and VAR 8 [Springate, 1978, p. 46]. He
deemed the resultant equation, with four all-positive variables,
to be easy for a layman to use, and therefore would be
acceptable from a pratical point of view. Using step-wise MDA
the function yielded was:
Z = 1.03VAR2 ♦ 3.07VAB8 ♦ .66VAR9 ♦.40VAR18
The overall error of both models was the same, and distributions
were similar. The critical index decreased from 1.070 to .862,
and the distance from this index to the centroids was "almost identical", indicating a very slight decline in discriminating
ability in the former variable function. Thus, of the five
catagories of ratios, three are represented: liquidity (VAR 2),
42
profitability (VAR 8 and 9) and activity (VAR 18). The deletion
of another variable would mean that one of these three
catagories would be left out, and Springate, considered this unacceptable.
With this equation, he proceeded to evaluate the model,
using his data from a sample of twenty failed and twenty
non-failed firms. He concluded that the Z scores could be used
in the development of "risk profiles" in addition to assessing
potential failure [Springate, 1978, p. 63].
43
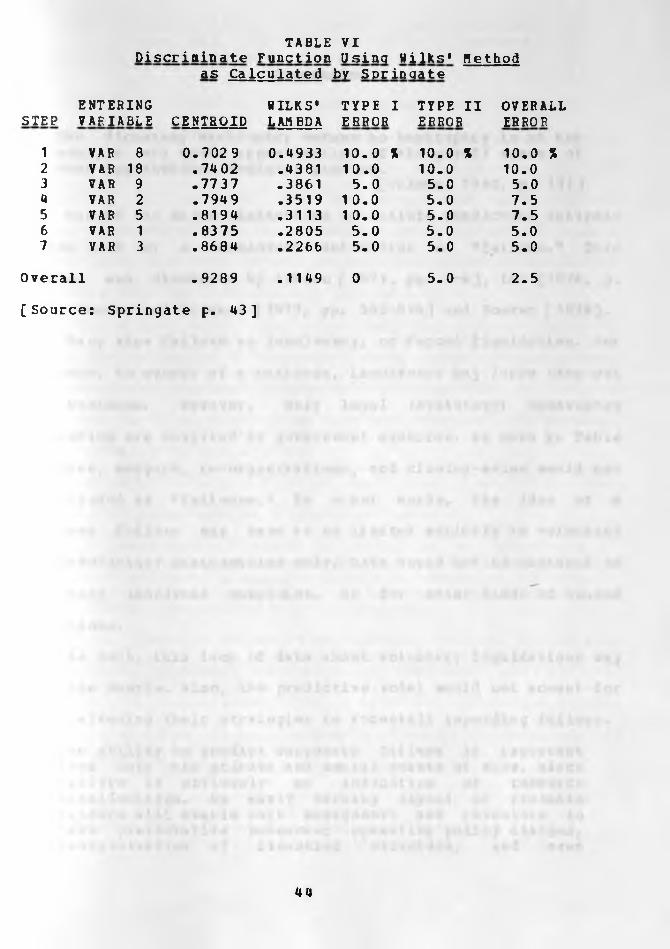
TABLE VIDiscriainate Function Using Wilks* Method
as Calculated by Springate
ENTERING WILKS* TYPE I TYPE II OVERALLSTEP VARIABLE CENTROID LAMBDA ERROR ERROR ERROR
1 VAR 8 0.702 9 0.4933 10.0 % 10.0 % 10.0 X2 VAR 18 .7402 .4381 10.0 10.0 10.03 VAR 9 .7737 .3861 5.0 5.0 5.04 VAR 2 .7949 .3519 1 0.0 5.0 7.55 VAR 5 .8194 .3113 1 0.0 5.0 7.56 VAR 1 .8375 .2805 5.0 5.0 5.07 VAR 3 .8684 .2266 5.0 5.0 5.0
Overall . 9289 .1149 0 5.0 2.5
[Source: Springate p. 43]
44
Discussion
The dichotomy bankruptcy versus no bankruptcy is at the most, a very crude approximation of the payoff space of some hypothetical decision problem.
[Ohlson, 1980, p. 111]One of the major limitations of failure prediction analysis
is the lack of a consistent definition of •’failure." This
problem was discussed by Altman [ 1971, pp. 2-4], Lev [ 1974, p.
133], Weston and Brigham [ 1977, pp. 542-544] and Foster [ 1 978 ].
Many view failure as insolvency, or forced liquidation. For
instance, to owners of a business, insolvency may force them out
of business. However, only legal (statutory) bankruptcy
statistics are complied by government agencies, as seen in Table
I. Thus, mergers, re-organizations, and closing-sales would not
be included as "failures." In other words, the idea of a
business failure may have to be limited strictly to voluntary
and involuntary bankruptcies only. Data would not be captured on
temporary insolvent companies, or for other kinds of ceased
operations.
As such, this lack of data about voluntary liquidations maybias the sample. Also, the predictive model would not acount for
firms altering their strategies to forestall impending failure.
The ability to predict corporate failure is important from both the private and social points of view, since failure is obviously an indication of resource misallocation. An early warning signal of probable failure will enable both management and investors to take preventative measures; operating policy changes, reorganization of financial structure, and even
45
voluntary liquidation will usually shorten the length of time losses are incurred and thereby improve both private and social resource allocation. [Lev, 1974, p.
134]
In Canada therefore, "failed" firms are represented by
companies that have declared bankruptcy (or filed proposals). It
should be kept in mind that this is only one portion of "failed"
companies. Not included will be firms that have sold off
inventory at "fire-sale" prices and allowed leases to lapse,
enterprises that sold out (or merged) with competitors, or even
companies that their owners shut and left.
The second major limitation regarding failure prediction
models is the lack cf a theoretical base. Ohlson posed the basic
question "why forecast bankruptcy?" [Ohlson, 1980, p. 111]. He concluded that "... there is no concensus varying significantly
and arbitrarily across studies."
Horrigan [ 1968, p. 292] is much more forward in this
analysis of the emergence of predictive models.
This development, which is still in a relatively embryonic stage, has teen characterized by careful and well-constructed a priori analysis in contrast to the senseless proliferation of ratios which characterized the early development of ratio analysis.
Basically, there is no theory of financial failure, or the role
of financial ratiosas predictors of survival. Due to this
absence many researchers take a heuristic approach utilizing
varying numbers of ratios, and models. Because of this, it is
difficult to generalize the empirical results. [Lev, 1974, p.149 ]
Attempts to construct a theory of corporate failure, that is, to identify and generalize the major causes of
46
failure, have been meager and generally unsatisfactory because of the complexity and diversity of business operations, the lack of a well-defined economic theory of the firm under uncertainty, and a surprising reluctance by many researchers to incorporate the failure phenomenon in their models. [Lev, 1974, p. 134]
Moreover, Gordon [197 1, P- 347] wrote "The academicans withfirst hand knowledge of the su bjec t have left the scene ofaction. "
Altman [1971, p. 341] suggested using aggregate data on a
times series basis. He postulated a form for business failure
&F.R. = where: AF.B . =
LGNP =
k SP =
4 MS =
f (hGNP, h.SP, & MS)
guarterly change in Dun and Bradstreet's failure rate
quarterly change in real GNP
quarterly change in the standard poor 500 Index of Common Policies
quarterly change in money supply
47
In the analysis of the above model, he indicated that the
failure rate varied negatively with overall econoaic activity,
stock market performance, and money supply conditions. In the
context of railroad failures in the United States, Altman
indicated that this model was of little information value
although there were M. .. significant statistical values for the independent variables.” [Altman, 1971, p. 342]
The need for predictive models however is still present. As
indicative of the increasing number of failures. MThe ratio
fills that need as a simple, quick method of comparison....
Thus, the ratio is certainly a very admirable device because it
is simple and it has predictive value” [Horrigan, 1968, p. 294].
There are also methcdolcgica1 problems with using multi-
discriminate analysis for forecasting purposes. Basically, the
sample is grouped, and matched a priori. Because the studies are
"essentially retrospective" [Lev, 1974, p. 149] there is a bias
in the sample selection.
This problem may be overcome by using non-matched,unbalanced samples. Moreover, studies of existing "live" firms
should be undertaken (i.e. before knowledge of disaster is
known). In addition, previous studies have restricted their
samples to large corporations — both failed and non-failed. For
example, Altman included matched firms with assets of at least
$700,000. Obviously, smaller firms, and unincorporated
businesses would not be included. Therefore the predictive
models developed would be bias towards the larger companies.
48
It would be interesting to include a greater range of firi
size. And also to develope prediction models specifically for
the smaller enterprise. This could also have a significant
impact on the current standard-set ting argument in Canada- At present there is a "Big G.A.A.P. versus Little G.A.A.P."3*
discussion.
The development of models for smaller firms could indicate
there is a need for different accounting principles for
companies depending on their size. On the other hand similar
models (i.e. using the same variables) may indicate that there is no requirement to change from the status quo.
Another statistical problem of forecasting is that they use
failures over a period of time as opposed to one year only. For
example Beavers* study used ratios between 1954 and 1964.
floreover studies like Springate's do not detail the exact periods covered for failed companies.
This problem is accentuated in Canada, due to the problems
in accumulating data. Whereas in the Onited States companies
file annually with the government, this is not necessarily so in
Canada. In addition, specific data is not collected and
accumulated for “failed" companies. The Department of Consumers and Corporate Affairs keeps track only of the legal
bankruptcies, under the Bankruptcy and Winding Dp Act. Springate
[1978, p. 65] suggests that better quality data be accumulated
by accounting bodies, say the Canadian Institute of Chartered
31 Generally Accepted Accounting Principles — G.A.A.P.
49
Accountants, to enable further research. Comparisons could then
be made with the United States, and other countries. This would
entail replications of studies, and generation of specific
Canadian models. This latter research would also have as a
by-product a test to see if indeed accounting regulations are
materially different in various countries.
The readily available data would also allow for different
sample configurations. As already mentioned, the matched firms
approach leads to an upwards bias of failed companies. If the
average failure rate of enterprises in Canada is, say 2%, then
large samples with only 2% unsuccessful firms should be used.
Moreover, failed firms included in the samples should have
the same date of failure. This "cross-sectional” approach would
have more meaning, as they would be included with non-failed
firms from the same period. This would also enable research into
establishing forecasts from each year-Finally, a bank of data would enable researchers to
establish specific models for industries, and geographic areas.
Due to the regional disparities in this country, this would also
be an important improvement in this field.32 It would be
interesting to try to establish risk profiles by industry and by
area with an eye to developing specific market profiles. These
could be compared to similar markets in othe countries,
specifiedly the United States.
32 Regional differences, on a provincial basis, are examined by Mason and Strain [1982] using data from Consumer and Corporate Affairs, Ottawa.
50
The different number of ratios has already been mentioned.
Beaver [ 1968 ] selected thirty, Altman [ 1972] twenty-two
(manufacturing) and fourteen (railroads), Edmister [1972]
nineteen, and Springate [1978] selected nineteen. Clearly there
is no concensus to the effective mix of data. A few points have
to be kept in mind however when selecting ratios.
First, multicollinarity has to be avoided (or at best
minimized). This is usually done by specifically excluding
variables which are essentially the same, for example "quick**
assets/current liabilities and cash plus receivables/current
liabilities should not be utilized simultaneously.
Second, the variables have to be "operational." If a
resulting model is to be widely expected, the ratios should be
straightforward and easy to calculate. For instance, a model
using different measurement scales, or market values of shares may not be understood. Horeover, if not calculated by the
particular enterprise, could prove costly.33 On the other hand,
however, the excessive limitation of the variables employed in
the research entails a loss of descriptive information on the
firms." [Finardi, 1982, p. 6] "Besides, data are actually
difficult to collect." [Finardi, 1982, p. 8]
One approach as to which variables to use could be
determined by professional analysts, stock investors, and credit
granting institutions. Behavioral studies should be assimilated
into failure prediction models to aid in the potential
33 See also Morrison [ 1969, p.162].
51

operationalizing of a model. A presentation of the various
models determined could be presented to these groups of people
for their reactions. Moreover studies of choices using MDA, in
addition to their decision models could be tested. Also, an
interesting study would use nDA to "check” previous decisions!
It however should be stressed that the critical indeces
developed are not substitutes for other decision models. At best
they can be used to complement any developed models. And, if no
sophisticated model is used at all, could help to formulate a
rationally based decision model for credit-granting decisions.
52
Summary
He have looked at the development of ratio analysis, from
its humble beginnings to the advent of computerized techniques,
focusing on Multiple Discriminate Analysis. It is clear that
development of the HDA is only now beginning in earnest. One
impediment to MDA's progress has been an educational gap
existing between theoreticians and practitioners. Now that the
computing sciences, in all its manifestations, have become more
widely accepted and understood, we can use computers for more
"useful" tasks. By useful, we mean that in addition to regular
bookkeeping activities, (recording, posting, footing and so
forth) computers can (and now should) be used for budgeting,
predictive analysis, and other forecasting models.
He have seen two predictive models developed in an attempt to establish a model that will accurately predict business
failures. The models developed by Altman £ 1972 ] and Springate
[ 1978 ] are similar in nature, and in part both agree on the
ratios of importance. For maximum predictive "power" they have
concluded that these ratios together can best differentiate
groups of failed versus non-failed enterprises.
53
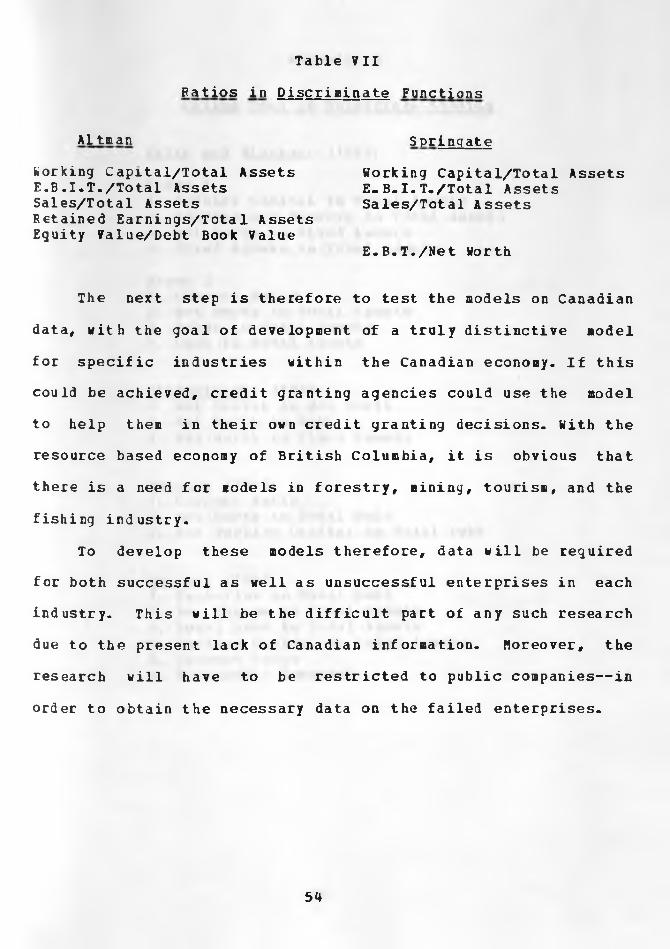
Table VII
Ratios in Discriminate Functions
Al tm an S pringateWorking Capital/Total Assets E.B-I.T./Total Assets Sales/Total Assets Retained Earnings/Total Assets Equity Value/Debt Book Value
Working Capital/Total Assets E. B.I. T./Total Assets Sales/Total Assets
E.B.T./Net Worth
The next step is therefore to test the models on Canadian
data, with the goal of development of a truly distinctive model
for specific industries within the Canadian economy. If this could be achieved, credit granting agencies could use the model
to help them in their own credit granting decisions. With the
resource based economy of British Columbia, it is obvious that
there is a need for models in forestry, mining, tourism, and the
fishing industry.
To develop these models therefore, data will be required
for both successful as well as unsuccessful enterprises in each
industry. This will be the difficult part of any such research
due to the present lack of Canadian information. Moreover, the
research will have to be restricted to public companies— in
order to obtain the necessary data on the failed enterprises.
54
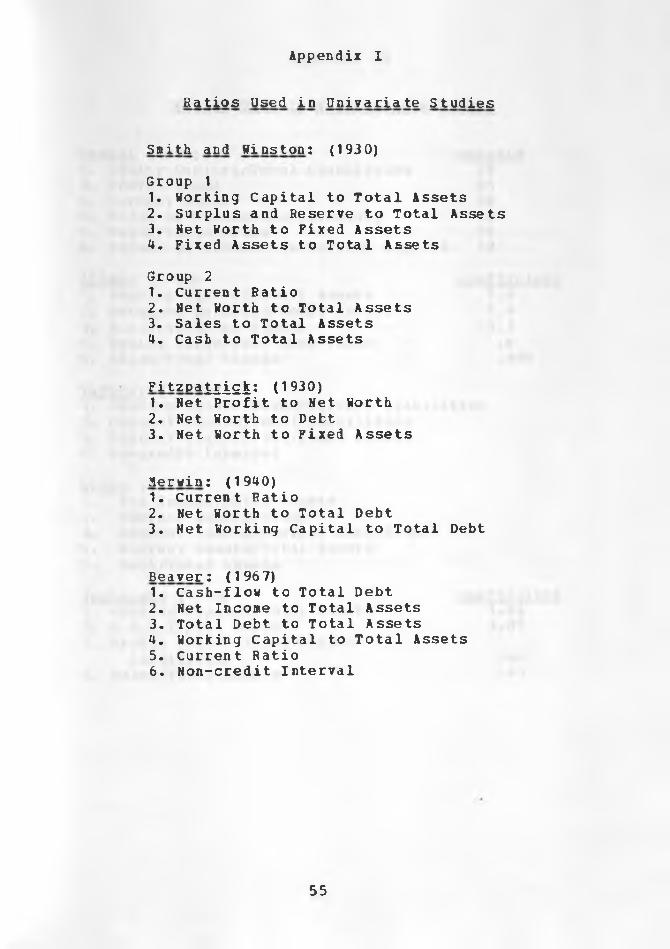
Appendix I
Ha tios Used in Univaria te Studies
Smith and Winston: (193 0)
Group 11. Working Capital to Total Assets2. Surplus and Reserve to Total Assets3. Net Worth to Fixed Assets4. Fixed Assets to Total Assets
Group 21- Current Ratio2. Net Worth to Total Assets3. Sales to Total Assets4. Cash to Total Assets
Fitzpatrick: (1930)1. Net Profit to Net Worth2. Net Worth to Debt3. Net Worth to Fixed Assets
flerwin : (1940)1. Current Ratio2. Net Worth to Total Debt3. Net Working Capital to Total Debt
Beaver: (196 7)1. Cash-flow to Total Debt2- Net Income to Total Assets3. Total Debt to Total Assets4. Working Capital to Total Assets5. Current Ratio6. Non-credit Interval
55
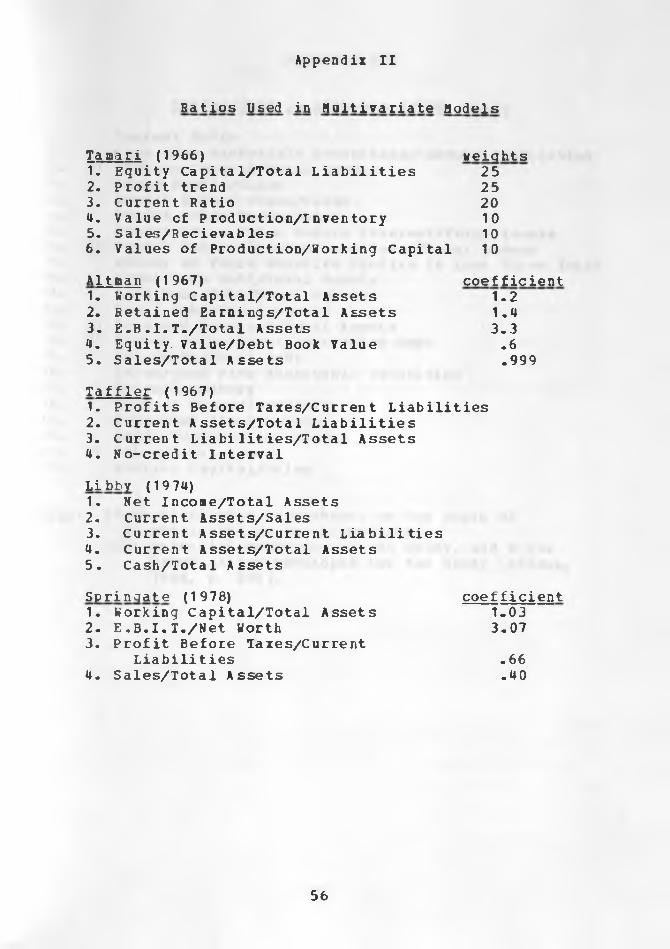
Appendix II
Ratios Used in Multivariate Models
Ta ma ri (1966) weightsT. Equity Capital/Total Liabilities 252. Profit trend 253- Current Ratio 204. Value cf Production/Inventory 105. Sales/Recievab les 106. Values of Production/Sorking Capital 10
Altman (1 967) coef ficient1. Working Capital/Total Assets 1.22. Retained Earnings/Total Assets 1.43. E.B.I.T./Total Assets 3.34. Equity. Value/Debt Book Value .65. Sales/Total Assets .999
Taffler (1967)1. Profits Before Taxes/Current Liabilities2. Current Assets/Total Liabilities3. Current Liabilities/Total Assets4. No-credit Interval
Li bby (1974)1. Net Income/Total Assets2. Current Assets/Sales3. Current Assets/Current Liabilities4. Current Assets/Total Assets5. Cash/Total Assets
Springate (1 978) coefficient1. Working Capital/Total Assets 1.032. E.B.I.T./Net Worth 3.073. Profit Before Taxes/Current
Liabilities .664. Sales/Total Assets .40
56

Appendix III
1. Current Ratio2. Cash plus Marketable Securities/Current Liabilities3. X1 Working Capital/Total Assets4. Cross Profit/Sales5. Profit Before Taxes/Sales6. Profit After Taxes/Sales7. Profit After Taxes Before Interest/Total Assets8. X2 Profit Before Interest and Taxes/Total Assets9. Number of Years Negative Profits in Last Three Years10. Short Term Debt/Total Assets11. Long Term Debt/Total Assets12. Total Debt/Total Assets13. X3 Retained Earnings/Total Assets14. XU Market Value Eguity/Par Value Debt15. Net Korth/Total Debt16. Sales/Cash Plus Marketable Securities17. Sales/Inventory18. Cost of Sales/Inventory19. Sales/Net Fixed Assets20. Sales/Current Liabilities21. X5 Sales/Total Assets22. Working Capital/Sales
R a t i o s qsed in Altman* s ( 1968) S t u d y
Note: these attributes were chosen on the basis of(i) popularity in the literature
(ii) potential relevancy to the study, and a few"new** ratios developed for the study [Altman, 1968, p. 5 9U J.
57
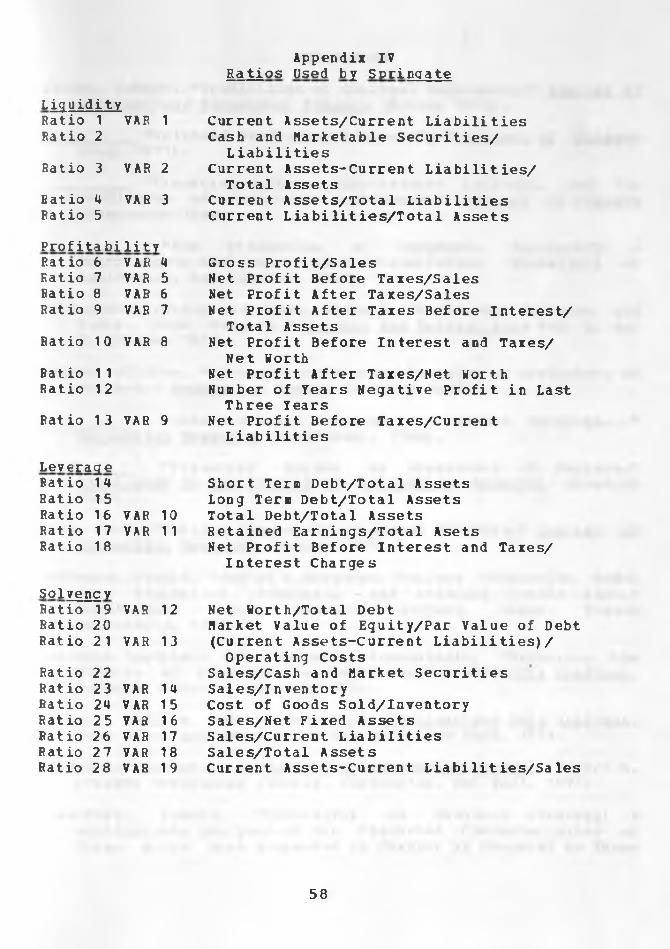
Appendix IVRatios Used bj Springate
LiquidityRatio 1 VAR 1 Current Assets/Current LiabilitiesRatio 2 Cash and Marketable Securities/
LiabilitiesRatio 3 VAR 2 Current Assets-Current Liabilities/
Total AssetsRatio 4 VAR 3 Current Assets/Total LiabilitiesPatio 5 Current Liabilities/Total AssetsProf ita bilityRat 10 6 VAR 4 Gross Profit/SalesRatio 7 VAR 5 Net Profit Before Taxes/SalesRatio 8 VAR 6 Net Profit After Taxes/SalesRatio 9 VAR 7 Net Profit After Taxes Before Interest/
Total AssetsRatio 10 VAR 8 Net Profit Before Interest and Taxes/
Net NorthBat io 1 1 Net Profit After Taxes/Net WorthRatio 12 Number of Years Negative Profit in Last
Three YearsRat io 13 VAR 9 Net Profit Before Taxes/Current
LiabilitiesLeverageRat io 14 Short Term Debt/Total AssetsRatio 15 Long Term Debt/Total AssetsRatio 16 VAR 10 Total Debt/Total AssetsRat io 17 VAR 11 Retained Earnings/Total AsetsRatio 18 Net Profit Before Interest and Taxes/
Interest Charges
SolvencyPatio 19 VAR 12 Net Worth/Total DebtRatio 20 Market Value of Equity/Par Value of DebtRat io 21 VAR 13 (Current Assets-Current Liabilities)/
Operating CostsRatio 22 Sales/Cash and Market SecuritiesRat io 23 VAR 14 Sales/InventoryRatio 24 VAR 15 Cost of Goods Sold/InventoryRat io 25 VAR 16 Sales/Net Fixed AssetsRatio 26 VAR 17 Sales/Current LiabilitiesRat io 27 VAR 18 Sales/Total AssetsRatio 28 VAR 19 Current Assets-Current Liabilities/Sales
58
BeferencesAltman, Edward. "Predictions of Railroad Bankruptcy." Journal of
Economic and flanagenent Science (Spring 1972) .
__________"Railroad Bankruptcy Propensity." Journal of Finance(May, 1971).
__________ "Financial Ratios, Discriminant Analysis, and thePrediction of Corporate Bankruptcy." Journal of Finance (September 1968) .
__________ "The Prediction of Corporate Bankruptcy: ADescriminate Analysis." Ph.D dissertation, University of California, Los Angeles, 1967.
Balaeister, Philip and Jones, Richard. "Railroads, Failures and M.D.A. Hade Mergers." Mergers and Acquisitions Vol. 8, No. 2, (Summer 1973).
Beaver, william. "Alternate Accounting Measures as Predictors of Failure." Accountinq Review (January 1968).
__________ "Informational Content of Annual Earnings..."Accounting Research (Supplement, 1968).
__________ "Financial Ratios as Predictors of Failure."Supplement to the Journal of Accounting Research (January 1967).
Blum, Marc. "Failing Company Discriminant Analysis." Journal of Accounting Research (Spring 1974).
Botheras, Donald. "Use of a Business Failure Prediction Model for Evaluating Potential and Existing Credit Risk."Unpublished H.B.A. research project, Simon FraserUniversity, 1979.
Canadian Institute of Chartered Accountants, "Reporting the Effects of Changing Prices," Section 4510 CICA Handbook. Toronto, Ontario, December 1982.
Cooley, William and Lohmes, Paul. Multivariate Data Analysis, John Wiley and Sons, Inc., New York, New York, 1971.
Chafield, Michael. A History of Accounting Thought. Robert G. Krieger Publishing Company, Huntington, New York, 1 977.
Comerford, Robert. "Bankruptcy as Business Strategy: AMultivariate Analysis of the Financial Characteristics of Firms Which Have Succeeded in Chapter XI Compared to Those
59
which have Failed." Ph.D. dissertation, University ofMassachusettes, 1976.
Dun & Bradstreet. The Failure Record Through 1976. Dun &Bradstreet Inc., New YorkT New York, 1976.
Edmister, Robert. "An Empirical Test of Financial Ratio Analysis for Small Business Failure Prediction." Journal of Financial and Q ualitative A paly si s (March 197 2) •
Ferrara, William and Hayya, Jack. "Towards Probabilistic Profit Budgets." Management Accounting (October, 1970).
Financial Accounting Standards Board [ FASB ], "Statement ofFinancial Accounting, Concepts No. 1, Objectives of financial Reporting by Business Enterprises." Financial Accounting Standards Board, Stanford Connecticut, 1978.
Finardi, Alessandra d'Aaico, "Forecasting Insolvency: APreliminary Approach to the Problem." Unpublished research paper, Istituto Unwersitario Di Bergamo, Italy, 1982.
Fitzpatrick, Paul. "Symptons of Industrial Failures." Catholic Uni versity Press 1931.
Foster, George. Financial Statement Analysis. Prentice Hall, Englewood Cliffs, New Jersey, 1978.
Foulke, Roy. Practical Financial Statement Analysis McGraw-Hill Book Company, 5th Edition, New York, New York, 1961.
Gordon, Myron J. "Towards A Theory of Financial Distress," Journal of Finance. (May 1971).
Heath, Lloyd and Rosenfield, Paul. "Solvency: The Forgotten Half of Financial Reporting," Journal of Accountancy. (January, 1979) .
Hoel, Paul G. Introduction to Mathematica1 Statistics. New York: John Wiley and Sons, Inc., 1962.
Horrigan, James. "A Short History of Financial Patio Analysis." Accounting Review (April 1968).
Jaedicke, Robert K. and Robichek, Alexander A. "Cost-Volume- Profit Analysis Under Conditions of Uncertainty." Accounting Review (October, 1964).
Ketz, J. Edward. "The Effect of General Price-Level Adjustments on the Predictive Ability of financial Ratios." Journal of Accounting Research, Vol. 16 (Supplement, 1978).
Kline, C.A., and Hessler, H.L. "The DuPont Chart System for
60
IfAppraising Accounting. Publishing
Operating Perfornance." Readings in Cost ed: William E. Thomas Jr- South-western
Company, Cincinatti, Ohio, 1955.
Lev, Baruch. Financial Sta tementPrentice-Hall Inc. , Englewood Cliffs,
k New Approach.. Hew Jersey, 1974.
Libby, Robert. "Prediction Achievement and the Use of Simulated Decision Mahers In Information Evaluation." ph-D. dissertation, University of Illinois, 1974.
Mason, Greg and Strain, Frank. "Bankruptcies in Canada — An Analysis." Western Economic Review (July 198 2).
Hensah, Yaw M. "The Differential Bankruptcy Predictive Ability of Specific Price Level Adjustments: Some EmpiricalEvidence." Accounting Review (April, 1983).
Her win, Charles. Financial Characteristics of American Manufacturing,^forporations. U.S. Government Printing Office, 194l7~”
Meyer, P. A., and Pifer, H. W. "Prediction of Bank Failures." Journal Of Finance (September 1 970).
Morrison, Donald. "On the Interpretation of Discriminant Analysis." Journal of Marketing Research (May, 1969).
Nelson, Philip. "Corporations in Crisis, Behavioral Observations for Bankruptcy Policy." Praeger Publishers, New York, New York, 1981.
Neuwirth, Sidney and Shegda, Michael. "Discriminant Analysis." Management Science (March-April 1964).
Norton, Curtis L. and Smith, Ralph E. "A Comparison of General Price Level and Historical Cost Financial Statements in The Prediction of Bankruptcy." Accounting Re view (January, 1979).
Ohlson, James A. "Financial Ratios and the Probabilistic Prediction of Bankruptcy." Journal of Accounting Research (Spring , 1 980) .
Parker, George and Segura, Ediliberto. "How to Get a Better Forecast" Harvard Business Re view (March-April, 197 1).
Ramser and Foster. "A Demonstration of Ratio Analysis," Bulletin No._ M University of Illinois Press, Bureau of Business Research, Urbana, 111., 1931.
Raun, "The Limitation of Profit Graphs, Breakeven Analysis, and Budgets." Accounting Review (October, 1964).
61 ^ " R s n - y G p
Smith, Raymond. "Test Analysis of Unsuccessful Industrial Companies." Bulletin 31. University of Illinois Press, Bureau of Business Research, Urbana, 111-, 1930.
Smith, R., and Winakor, A.H. "Changes in financial Structure of Unsuccessful Industrial Companies-" Bulletin 51 University of Illinois Press, Eureau of Business Research, Urbana, 111., 1935.
Solomon, Ira and Beck, Paul J. "A Comparison of General Price Level and Historical Cost Financial Statements in the Prediction of Bankruptcy: A Comment." Accounting Review,(July, 1980).
/Spector, Steven. "An Examination of the FASB Assertion of
Predictability of Cash Flows." Unpublished M.A. thesis, Simon Fraser University, 1981.
Springate, Gordon. dieting the Possibility of Failure in aCanadian Firm: a Discriminant Analysis." Unpublished H.B.A. research project, Simon Fraser University, 1978.
Taffler, Richard. "How to Tell Who’s Going Bust." Sunday Times (February 27, 1977).
Tamari, Heir. "Financial Ratios as a Means of Forecasting Bankruptcy," International Management Review, 1966.
Tatsuoka, Maurice. "Discriminant Analysis: The Study of Group Differences." Selected Topics in Advanced Statistics: AnElementary Approach, Number 6. Institute for Personality and Ability Testing, Champaign, Illinois, 1970.
Wall, Alexander. "Study of Credit Barometrics." Federal Reserve B ul let in (March 1919).
iarkentin, Edward M. "Canadian Analysis of Bankruptcy Studies Using a Canadian and an American Discriminant Analysis." Unpublished research report, Simon Fraser University, 1978.
Walker, James. "A Discriminant Function for Earnings Price Ratios of Large Industrial Corporations." Review of Economics and Statistics 41 (February 1959).
Weston, J. Fred and Brigham, Eugene. Essentials of Managerial Finance. 4th Edition, The Dryden Press, Hindale Illinois, 1977.
Wilks, S.S. Collected Papers Contributions to Mathematical Statistics, edited by T.W. Anderson, John Wiley and Sons, Inc., New York, New York, 1967.
62