ranger-based data collection - ecostats.com · ranger-based data collection has since been...
TRANSCRIPT

Ranger-Based Data Collection

Biodiversity and Protected Areas Management Project (BPAMP)
Department of Nature Conservation and Protection
Ministry of Environment
#48, Samdech Preah Sihanouk
Tonle Bassac, Chamkarmon
Phnom Penh
Cambodia

Ranger-Based Data Collection
A reference guide and training manual
for protected area staff in Cambodia
All pictures Virachey National Park. Cover page: Ho Chi Minh Trail - David Zeller 2005. This page left: Sun
Bear scratches - BPAMP 2005; top right: Tiger snares - Phillip Thomas 2005; bottom right: Veal Yak Yu - Thon
Soukhon, 2006.
June 2006
Ministry of Environment Biodiversity and Protected
Areas Management Project
Department of Nature
Conservation and Protection
World Bank Global Environment Facility

Foreword
The Ministry of Environment has been given the responsibility to manage the protected areas established
by Royal Decree in 1993. These protected areas constitute about 18% of Cambodia’s land. Ensuring the
integrity of these areas and safeguarding their biodiversity is one of the key duties of the Department of
Nature Conservation and Protection of the Ministry of Environment. The Ministry needs to know whether
and how effectively it fulfils its role, it is therefore essential for the Department of Nature Conservation
and Protection to ensure that protected area status and trends are monitored.
To assess and monitor protected area status and trends is also a goal of the Convention on Biological
Diversity’s Programme of Work on Protected Areas. The target set is: by 2010, national and regional sys-
tems are established to enable effective monitoring of protected area coverage, status and trends at
national, regional and global scales, and to assist in evaluating progress in meeting global biodiversity
targets.
Assessment and monitoring requires accurate and up-to-date data. These data can be provided from dif-
ferent sources, such as scientific monitoring programmes, but the most obvious source are rangers who
patrol the protected areas at a regular basis.
The World Bank and Global Environment Facility funded, and Ministry of Environment implemented
Biodiversity and Protected Areas Management Project has tested and implemented ranger-based data
collection in Virachey National Park. Ranger-based data collection has since been introduced in other
protected areas with the support from Flora and Fauna International and the Wildlife Conservation
Society. The data collected by rangers on biodiversity and illegal activities are analysed using a comput-
erised management information system (MIST) to provide timely and up-to-date information for decision-
making, planning and monitoring.
The Biodiversity and Protected Areas Management Project has compiled the experience made during
the implementation of ranger-based data collection in a comprehensive manual. I am please to present
you this manual which forms part of the national ranger training curriculum, and which provides man-
agers with clear instructions how to monitor trends in illegal activities and biodiversity.
Mr. Chay Samith
Director, Department of Nature Conservation and Protection
Ministry of Environment
i

Approval
This manual and the guidelines therein have been reviewed by the
Department of Nature Conservation and Protection
of the Ministry of Environment
and approved for implementation
His Excellency Dr. Mok Mareth
Senior Minister
Minister of Environment
June 2006
ii

Table of contents
Foreword . . . . . . . . . . . . . . . . . . . . . . . . . . . . . . . . . . . . . . . . . . . . . . . . . . . . . . . . . . . . . . . . . . . . . .i
Approval . . . . . . . . . . . . . . . . . . . . . . . . . . . . . . . . . . . . . . . . . . . . . . . . . . . . . . . . . . . . . . . . . . . . . .ii
Table of contents . . . . . . . . . . . . . . . . . . . . . . . . . . . . . . . . . . . . . . . . . . . . . . . . . . . . . . . . . . . . . . .iii
List of figures . . . . . . . . . . . . . . . . . . . . . . . . . . . . . . . . . . . . . . . . . . . . . . . . . . . . . . . . . . . . . . . . . .iii
List of tables . . . . . . . . . . . . . . . . . . . . . . . . . . . . . . . . . . . . . . . . . . . . . . . . . . . . . . . . . . . . . . . . . . .iii
Acknowledgements . . . . . . . . . . . . . . . . . . . . . . . . . . . . . . . . . . . . . . . . . . . . . . . . . . . . . . . . . . . . .iv
Acronyms . . . . . . . . . . . . . . . . . . . . . . . . . . . . . . . . . . . . . . . . . . . . . . . . . . . . . . . . . . . . . . . . . . . . . .v
1. Introduction . . . . . . . . . . . . . . . . . . . . . . . . . . . . . . . . . . . . . . . . . . . . . . . . . . . . . . . . . . . . . . . . .6
2. Background . . . . . . . . . . . . . . . . . . . . . . . . . . . . . . . . . . . . . . . . . . . . . . . . . . . . . . . . . . . . . . . . .7
3. Ranger-based data collection as part of protected area management . . . . . . . . . . . . . . . . .9
4. Standardised data collection . . . . . . . . . . . . . . . . . . . . . . . . . . . . . . . . . . . . . . . . . . . . . . . . . .11
4.1 Standardised nomenclature . . . . . . . . . . . . . . . . . . . . . . . . . . . . . . . . . . . . . . . . . . . . . . .11
5. Steps required before starting RBDC . . . . . . . . . . . . . . . . . . . . . . . . . . . . . . . . . . . . . . . . . . .14
5.1 Information needs assessment . . . . . . . . . . . . . . . . . . . . . . . . . . . . . . . . . . . . . . . . . . . .14
5.2 Design of the patrol data sheet . . . . . . . . . . . . . . . . . . . . . . . . . . . . . . . . . . . . . . . . . . . .15
5.3 Prepare instructions for filling in the patrol data sheet . . . . . . . . . . . . . . . . . . . . . . . . . . .17
5.4 Prepare instructions for the set-up of GPS units . . . . . . . . . . . . . . . . . . . . . . . . . . . . . . .17
5.5 Delineate management sectors . . . . . . . . . . . . . . . . . . . . . . . . . . . . . . . . . . . . . . . . . . . .17
5.6 Agree on standard monthly MIST outputs . . . . . . . . . . . . . . . . . . . . . . . . . . . . . . . . . . . .17
5.7 Set-up of MIST computer and software . . . . . . . . . . . . . . . . . . . . . . . . . . . . . . . . . . . . . .18
6. Field instructions . . . . . . . . . . . . . . . . . . . . . . . . . . . . . . . . . . . . . . . . . . . . . . . . . . . . . . . . . . .19
7. Data entry in MIST . . . . . . . . . . . . . . . . . . . . . . . . . . . . . . . . . . . . . . . . . . . . . . . . . . . . . . . . . .21
8. RBDC training schedule . . . . . . . . . . . . . . . . . . . . . . . . . . . . . . . . . . . . . . . . . . . . . . . . . . . . .22
9. References . . . . . . . . . . . . . . . . . . . . . . . . . . . . . . . . . . . . . . . . . . . . . . . . . . . . . . . . . . . . . . . .24
Appendices . . . . . . . . . . . . . . . . . . . . . . . . . . . . . . . . . . . . . . . . . . . . . . . . . . . . . . . . . . . . . . . . . . .26
Appendix 1: Monitoring of wildlife population trends and trends in illegal activities . . . . . . . . .27
Appendix 2: Flow diagram - data to be recorded about illegal actives in Virachey National Park . . .32
Appendix 3: List of observation codes . . . . . . . . . . . . . . . . . . . . . . . . . . . . . . . . . . . . . . . . . . . 35
Appendix 4: Example patrol data sheets . . . . . . . . . . . . . . . . . . . . . . . . . . . . . . . . . . . . . . . . . .36
Appendix 5: Instructions for filling in the patrol data sheet . . . . . . . . . . . . . . . . . . . . . . . . . . . .41
Appendix 6: RBDC field instructions . . . . . . . . . . . . . . . . . . . . . . . . . . . . . . . . . . . . . . . . . . . . .44
Appendix 7: GPS set up . . . . . . . . . . . . . . . . . . . . . . . . . . . . . . . . . . . . . . . . . . . . . . . . . . . . . . .45
Appendix 8: Glossary . . . . . . . . . . . . . . . . . . . . . . . . . . . . . . . . . . . . . . . . . . . . . . . . . . . . . . . . .47
List of figures
Fig. 1: Adaptive management cycle . . . . . . . . . . . . . . . . . . . . . . . . . . . . . . . . . . . . . . . . . . . . . . . . . .9
Fig. 2: The role of ranger-based data collection in the protected area management cycle . . . . . . .10
Fig. 3: Chart which illustrates a downwards trend in illegal activities using indices . . . . . . . . . . . . .23
Fig. 4: Comparison of actual and calculated patrol distance . . . . . . . . . . . . . . . . . . . . . . . . . . . . . .28
Fig. 5: Extent of areas patrolled in the hypothetical protected area between 2000 and 2002 . . . . .30
Fig. 6: Data and information flow and database replication at protected area
and national/regional level . . . . . . . . . . . . . . . . . . . . . . . . . . . . . . . . . . . . . . . . . . . . . . . . . . .31
List of tables
Tab. 1: Data hierarchy and standards used in ranger-based data collection . . . . . . . . . . . . . . . . . .13
iii

Acknowledgements
The concept of ranger-based data collection (RBDC) was introduced in Cambodia in 2003 by Dr. Robbie
Robinson. The RBDC concept was then adapted to the specific situation of Virachey National Park and
field tested by rangers with support from Mr. Koy Sokha, Mr. Robert Howard and Mr. Tep Borin - I would
like to thank them all.
During the last three years rangers and staff of the Biodiversity and Protected Areas Management Project
(BPAMP) have been implementing ranger-based data collection in Virachey National Park and their
experience has made a significant contribution to this manual. I would like to thank them all, even if I can-
not mention them all by name here. In particular, I would like to thank those BPAMP staff who were direct-
ly involved in carrying out RBDC training, field testing and data processing: Mr. Oliver Mannion, Mr. Pot
Sin, Mr. Johan Robinson, Mr. Stephan De Greef, Mr. Chhun Praseth, Mr. David Murphy, Mr. Sun Vuthy,
Mr. David Zeller and Mr. Ung Sokhakun. I also would like to thank senior park protection staff and in par-
ticular the director of Virachey National Park, Mr. Chou Sophark, for their support.
Ranger-based data collection has also been implemented in Bokor National Park and in Kulen-Promtep
Wildlife Sanctuary. Experience in these protected areas contributed to the development of this manual
and thanks goes to all staff and rangers involved in RBDC, in particular to staff of the Wildlife
Conservation Society (WCS) who implemented RBDC in Kulen-Promtep Wildlife Sanctuary.
Special thanks go to Mr. Meas Sophal, the BPAMP project director, for his support, and to Mr. Richard
Lloyd for his contributions to the writing of this manual.
The testing, customisation and implementation of ranger-based data collection in Virachey and Bokor
National Parks and the production of this manual was made possible with financial support from the
World Bank, Global Environment Facility and the Government of Cambodia through BPAMP. I would like
to thank all of them and in particular the Ministry of Environment for supporting the Biodiversity and
Protected Areas Management Project.
Klaus Schmitt
Senior Project Advisor
iv
Acronyms
BPAMP Biodiversity and Protected Areas Management Project
CBD Convention on Biological Diversity
CITES Convention on International Trade in Endangered Species of Wild Fauna and Flora
DNCP Department of Nature Conservation and Protection
DSA Daily Subsistence Allowance
ESRI Environmental Systems Research Institute
GIS Geographic Information System
GPS Global Positioning System
ISM Information System Manager
MIKE Monitoring of the Illegal Killing of Elephants
MIST Management Information System
MoE Ministry of Environment
PDA Personal Digital Assistant
RBDC Ranger-based Data Collection
SQL Structured Query Language
VNP Virachey National Park
WCS Wildlife Conservation Society
v

1. Introduction
Managers of protected areas require up-to-date information on a wide range of subjects including ecol-
ogy, park protection, tourism and socio-economics to manage parks effectively. Use of information should
form an integral part of protected area management, or in other words: form an integral part of decision-
making, monitoring and evaluation, and planning in protected area management. For information to be
useful it must be based on the timely analysis of up-to-date data and presented in such a way that man-
agers can understand it.
Relevant and geo-referenced data on wildlife and illegal activities collected by rangers on park protec-
tion patrols can easily be processed into information and made available in a timely manner to protect-
ed area managers. If this information is to be used for monitoring, data collection and patrol deployment
must follow ranger-based data collection (RBDC) procedures.
This reference guide and training manual describes in detail the requirements for RBDC. It is written as
a reference guide for senior protected area managers as well as managers at the Department of Nature
Conservation and Protection, as a guide for the set-up of ranger-based data collection at protected area
level, and as a training manual for rangers.
Chapter 2 provides a general introduction to the principles of ranger-based data collection.
Chapter 3 explains the role of ranger-based data collection in the protected area management cycle.
Chapter 4 introduces the concept of and need for standardised data collection and nomenclature.
Chapter 5 describes the elements of RBDC which must be put in place in a protected area before RBDC
can start in the field.
Chapter 6 gives instructions on how to carry out RBDC in the field.
Chapter 7 introduces the steps necessary before data processing.
Chapter 8 gives an outline of the schedule of the RBDC modules to be taught as part of the ‘Ranger
Basic Training Course’ and the ‘Park Protection Ranger Training Course’.
Additional information, including a glossary, is contained in the appendices. Appendix 1 is of particular
relevance to senior staff, park directors, park protection wardens, information system managers and sen-
ior staff at the Department of Nature Conservation and Protection. It describes in detail how data collect-
ed by ranger park protection patrols can be used for the monitoring of wildlife population trends and
trends in illegal activities.
6

2. Background
Up-to-date, relevant and timely information is an essential prerequisite which will enable managers of
protected areas to make informed decisions, to monitor and evaluate, and to plan. Use of information is
an integral part of effective protected area management.
The Convention on Biological Diversity's programme of work on protected areas (CBD Secretariat 2005)
lists in decision VII/28, under goal 1.4 - to substantially improve site-based protected area planning and
management - several activities which can only be carried out if up-to-date data are available.
Furthermore, there is a growing demand to monitor the effectiveness of protected area management and
donor countries and organisations increasingly demand accountability and quantifiable achievements in
return for their assistance. Again, this can only be achieved if up-to-date data are available.
The need to collect data which are up-to-date and readily available for day-to-day management decision-
making, without the need to wait for results from scientific surveys or monitoring programmes, has lead
to the design of ranger-based data collection procedures.
the data collection procedures have been designed to meet the objective:
park portection patrols need to be deployed based on intelligence information, they need to follow trails
of poachers etc. and, therefore cannot carry out systematic surveys or scientific monitoring. park portec-
tion patrols can collect opportunistic data on illegal activities and key wildlife species which can be
processed in a timely way into information for day-to-day management decision-making. Data collected
opportunistically by ranger patrols can be used to calculate indices for monitoring. Indices provide meas-
ures of relative density for comparisons in monitoring
programmes (Caughly and Sinclair 1994). For oppor-
tunistic data to be utilised in monitoring programmes,
the following criteria must be met:
• data collection must follow the RBDC principles,
• data collection in distinct strata/management sec-
tors must be consistent from month to month,
• the number of kilometres patrolled per month
must be high, and
• the bias in spatial distribution of patrol coverage
must be low, i.e. patrols must be more or less
evenly distributed.
Ranger-based data collection is the opportunistic collection of ecological data and data on
illegal activities by rangers on park protection patrols
to provide timely, reliable and up-to-date information to protected area management for their
day to day management decision-making.
Key principles of RBDC
- regular recording of
waypoints,
- use of standardised
terminology,
- consistent deployment of
patrols in distinct strata
Ranger-based data collection has the following benefits:
• It requires a minimum of training and education.
• It requires little additional equipment.
• It uses existing patrol systems and no extra patrols or expenses for monitoring are required.
• It provides data for monitoring, using indices, without the need for expensive baseline data.
• It provides timely information for the day-to-day decision-making of protected area mangers.
7

After the successful testing and implementation in Virachey National Park, RBDC became a key compe-
tence of the competency profiles for protected area staff which the Biodiversity and Protected Areas
Management Project developed for Virachey National Park. These competency profiles, or job descrip-
tions, are based on experiences from South Africa and the competence standards developed for protect-
ed area jobs in South East Asia by the ASEAN Regional Centre for Biodiversity Conservation (Appleton
et al. 2003). The draft competency profiles went through an extensive review process and the
Department of Nature Conservation and Protection (DNCP) adopted them as national standards in 2006.
The competency profiles list for all protected area positions:
• role
• key result areas
• competences
• critical outputs and outcomes
Ranger-based data collection is a key competence for all park protection staff, the Information System
Manager and the Park Director.
An important competence of the Park Director is the ability to interpret and use results from MIST. MIST
is the spatial management information system which is used to analyse the data from ranger-based data
collection. The Warden Park Protection must be able to supervise the ranger-based data collection in liai-
son with Chief of Ranger Station and the Information System Manager. The Chief of Ranger Station's key
role, with respect to ranger-based data collection, is to collate and store RBDC data on offences (illegal
activities) and observations of key animal species for protected area management in line with MIST pro-
cedures. The Patrol Team Leaders are responsible for ranger-based data collection in the field, while
Park Protection Rangers must be able to competently complete the RBDC patrol data sheets in the field
This manual has been written for RBDC using hand-held GPS (Global Positioning System) units and
patrol data sheets under rough field conditions in the humid tropical climate of Cambodia.
When conditions are conducive, the combination of a hand-held GPS with waterproof,
rugged housing and paper and pencil can be replaced with a hand-held computer with
integrated or attached GPS receiver. This enables field data collection in digital form
and fast data processing.
A PDA (Personal Digital Assistant) with an integrated GPS receiver can be used
for ranger-based data collection. Data entry forms for PDAs can be easily creat-
ed to meet the user’s needs, alternatively an existing software such as CyberTracker can be used.
Important factors to be considered when using a PDA are battery life (depending on type and length of
patrols) and the fact that such an electronic device may be too delicate for use under certain field condi-
tions. A waterproof case can protect a PDA, but it can also cause damage to the electronics of the PDA
if moisture is trapped inside the case over longer periods.
8

3. Ranger-based data collection as part of protected area management
Managers at all levels require up-to-date and timely information to enable them to make informed deci-
sions for planning, implementation and monitoring and evaluation of the activities for which they are
responsible. Information is based on the analysis of data1 and ranger-based data collection provides, in
a timely manner, exactly those data which are necessary for effective and timely decision-making in pro-
tected area management.
Protected area managers should aim for
management by objectives, a proactive and
results-oriented approach, emphasising
accomplishments and outcomes. The first
step of the management cycle is to arrive at
a plan based on clearly defined goals and
using the best knowledge available. This plan
is then implemented with constant monitoring
and evaluation. Management which antici-
pates change, and includes feedback and
adjustment loops, and rapid learning for man-
agers, is called adaptive management. It can
also be described as a continuous process of
actions based on planning, implementing,
monitoring, evaluation, and adjustment (see
figure 1 and BPAMP 2005).
An overview of the position of ranger-based data collection in the protected area management cycle and
its role in the management cycle is given in figure 2 and summarised in the note below:
Management decision-making has effects on the real
world; for example it can lead to a reduction of poach-
ing. Over time such effects/outcomes can be proven
through monitoring and evaluation based on the
analysis of data from ranger-based data collection.
This is illustrated in figure 2 which shows the position
of RBDC in the management cycle: a continuous
process of data collection, provision of information
and decision-making for planning, implementation
and controlling (i.e. monitoring and evaluation). The
decision-making, based on the information provided,
has effects on the real world and the cycle described
above starts again. For additional information see
appendix 1.
The management information needs determine what
data rangers must collect while on patrol. Only data
which can be processed into information which is useful to managers is going to be collected by rangers,
stored in the MIST database and analysed. The standardised terminology used in RBDC is determined
by database and analysis requirements and by the species nomenclature (fig. 2). More details about the
data collection standards are given in chapter 4.
Figure 1: Adaptive management cycle.
Ranger-based data collection
provides the DATA necessary to
generate timely and relevant
INFORMATION (using the tool
MIST) and communicate this
information to MANAGEMENT
for effective decision-making.
1 The terms data and information are often used interchangeably. In the context of RBDC and analysis of the
data for management decision-making, it is important to clearly distinguish between the two terms: data are
facts which have been recorded while information is processed data.
9

With such standards in place long familiarisation periods and re-training are no longer necessary when
staff are transferred. Standardised procedures also lessen the negative effect if individuals leave the
organisation, because enough people with knowledge remain to train new staff. Furthermore, standard-
ised data collection and digital data transfer from the protected areas to the Department of Nature
Conservation and Protection will enable managers in DNCP to make informed decisions about protect-
ed area management in Cambodia. It will also make it easier for DNCP to meet its national and interna-
tional reporting obligations.
Ranger - based data collection
Data
MISTtool for data entry/ download/storage/ analysis & reporting
Information
Type of data to be collected
decision - making for:· planning· implementation· controlling (M&E)
man
agem
ent
info
rmat
ion
nee
ds
det
erm
ine
eff
ects
of d
ecis
ion
s
on
th
e re
al wo
rld
Management
Speciesnomenclatur
D ata collectionstandards
dat
abas
e
and
an
alys
is
req
uir
emen
ts
det
erm
ine
Management cycle
Figure 2: The role of ranger-based data collection in the protected area management cycle.
10
4. Standardised data collection
It is essential that ranger-based data collection procedures and data nomenclature, i.e. the terms used to
describe observations, (as well as monitoring, evaluation and reporting) are standardised throughout the pro-
tected area system. Only then can DNCP effectively manage a national protected area system. Without such
standards in place Cambodia will have a number of individual protected areas managed according to different,
and a central authority which has no easy means to control what is going on, has no way to evaluate manage-
ment effectiveness, and has no ability to report comprehensively on the protected areas under its authority.
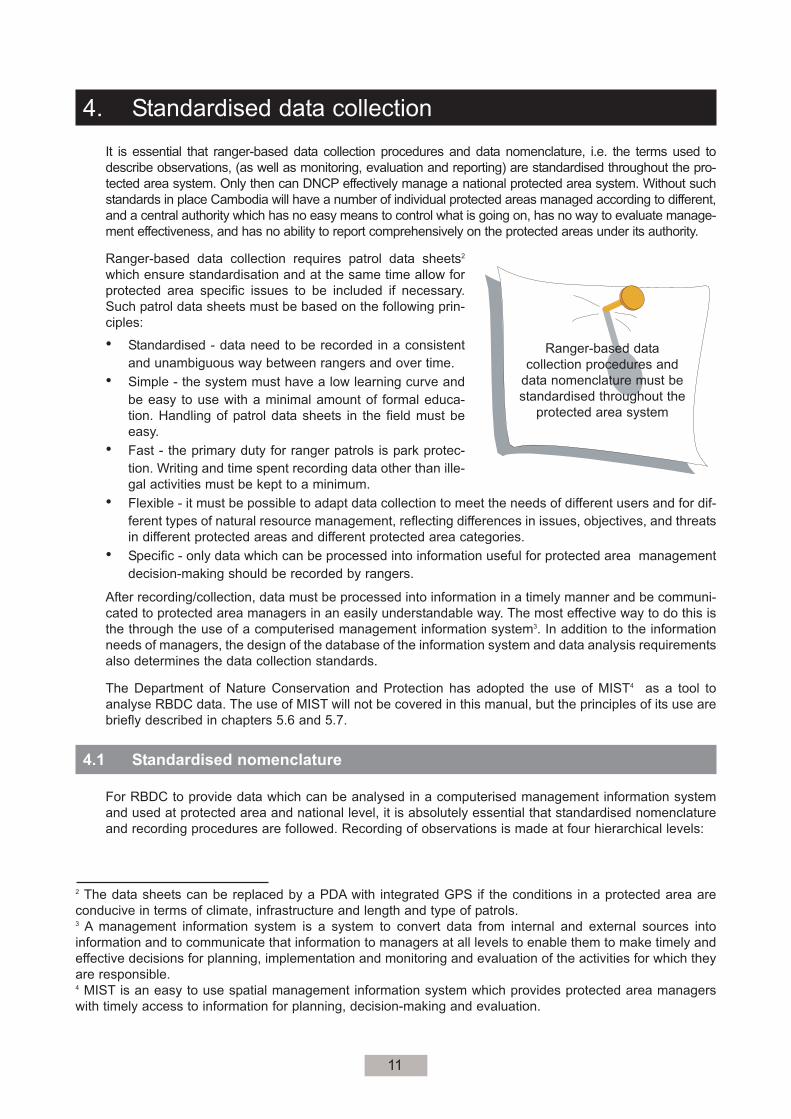
Ranger-based data collection requires patrol data sheets2
which ensure standardisation and at the same time allow for
protected area specific issues to be included if necessary.
Such patrol data sheets must be based on the following prin-
ciples:
• Standardised - data need to be recorded in a consistent
and unambiguous way between rangers and over time.
• Simple - the system must have a low learning curve and
be easy to use with a minimal amount of formal educa-
tion. Handling of patrol data sheets in the field must be
easy.
• Fast - the primary duty for ranger patrols is park protec-
tion. Writing and time spent recording data other than ille-
gal activities must be kept to a minimum.
• Flexible - it must be possible to adapt data collection to meet the needs of different users and for dif-
ferent types of natural resource management, reflecting differences in issues, objectives, and threats
in different protected areas and different protected area categories.
• Specific - only data which can be processed into information useful for protected area management
decision-making should be recorded by rangers.
After recording/collection, data must be processed into information in a timely manner and be communi-
cated to protected area managers in an easily understandable way. The most effective way to do this is
the through the use of a computerised management information system3. In addition to the information
needs of managers, the design of the database of the information system and data analysis requirements
also determines the data collection standards.
The Department of Nature Conservation and Protection has adopted the use of MIST4 as a tool to
analyse RBDC data. The use of MIST will not be covered in this manual, but the principles of its use are
briefly described in chapters 5.6 and 5.7.
4.1 Standardised nomenclature
For RBDC to provide data which can be analysed in a computerised management information system
and used at protected area and national level, it is absolutely essential that standardised nomenclature
and recording procedures are followed. Recording of observations is made at four hierarchical levels:
Ranger-based data
collection procedures and
data nomenclature must be
standardised throughout the
protected area system
2 The data sheets can be replaced by a PDA with integrated GPS if the conditions in a protected area are
conducive in terms of climate, infrastructure and length and type of patrols.3 A management information system is a system to convert data from internal and external sources into
information and to communicate that information to managers at all levels to enable them to make timely and
effective decisions for planning, implementation and monitoring and evaluation of the activities for which they
are responsible.4 MIST is an easy to use spatial management information system which provides protected area managers
with timely access to information for planning, decision-making and evaluation.
11

1. Observation groups
Observation groups are related sets of observations such as mammals, birds, reptiles, amphibians,
plants and illegal activities. Observation Groups are fixed throughout the protected area system. They
are not recorded by rangers, they are assigned by MIST and used for example for aggregated display
such as all illegal activities recorded during a specific period.
2. Observations
Observations are the actual recordings made by rangers while on patrol. They can be grouped into ani-
mals and illegal activities. Animal observations: Standardised mammal and bird lists produced by the
Wildlife Conservation Society (WCS) for Cambodia are used in RBDC. Examples of animal observations
are Douc Langur, King Cobra and Saurus Crane. Observations of illegal activities: The following nomen-
clature is used to record illegal activities: Poaching, Plant harvesting, Encroachment, and Fire. For each
of these four observations a distinction between direct evidence and sign must be made. NB. the nomen-
clature for illegal activities cannot be modified at protected area level5.
3. Observation codes
Observation codes are a further specification of the observation. They can be grouped into codes for ani-
mals and for illegal activities. Examples of animal observation codes are sighting, call, footprint, nest etc.
The observation codes are observation specific (e.g. Elephant footprint; nest for example does not apply to
Elephant) and must also be standardised throughout the protected area system. Examples of observation
codes for illegal activities are hunting, logging, mining gold etc. (for more details see appendix 2).
Observation code master lists, based on the situation in Virachey National Park, have been developed (see
appendix 3). These list can be amended to reflect different situations found in other protected areas.
4. Remarks
Remarks are further details for specific observation codes (see appendix 2), they are often protected
area specific.
A tabular overview of the four levels of data used in ranger-based data collection is given in table 1.
Rangers must record
animal observations based on standard-
ised mammal and bird lists etc.,
illegal activities under the headings of
Poaching, Plant harvesting,
Encroachment, and Fire,
observation codes based on standard-
ised master lists, and
remarks which can be protected area
specific.
5 Following this standard is essential for national level data analysis and reporting. Imagine a situation where
– for example Poaching direct sign hunting – is reported without using a standardised nomenclature. What
DNCP might get from the parks could include: wildlife poaching, forest crime poaching, hunting, hunters
arrested, suspected found in forest, hunting crime, and so on. Such data cannot be processed in a database,
neither can DNCP evaluate such data easily or report using these data and a computer-based tool for data
analysis.
12

Table 1: Data hierarchy and standards used in ranger-based data collection.
Observation Groups
Observations
Observation
Codes
Observation
Remarks
Further details forspecific observation codes:Examples are:
number of poachers arrested, weaponsconfiscated; under poaching direct evidence huntinglength and width in cm under Tiger footprint
Remarks are often protected area specific.
A related set of obser vations:- Mammals- Birds- Reptiles- Illegal Activities
Observation Groups are not recorded by rangers, they are assigned by MIST for aggregated display, e.g. all illegal activities encountered during a specified period.
Individual species or illegalactivity recordings- King Cobra- Tiger- Saurus Crane- Poaching sign*- etc.
* Observations under illegal activities are:- Poaching - Plant harvesting- Encroachment- Fire
A distinction between direct evidence and sign must be made for all recordings of illegal activities.
Further specification of the observation:Animals-
-
-
Sighting- Call- Footprint- etc.Illegal activities- Hunting- Logging- etc.
The Observation Codes are observation specific.
Only recorded for
specific observationcodesMust be recorded for each observation
13


The terminology for observations of illegal activities must follow the standards given in table 1. The obser-
vation codes and details recorded under remarks (e.g. nationality, tribe, village names, items confiscat-
ed etc.) may be protected area specific, but the same term must be used in all protected areas for the
same kind of activity; i.e. poaching must always be called poaching and not forest crime etc.
All observation codes and remarks which should be recorded by rangers are included in master lists
which are used for the development of the patrol data sheets, and to create protected area specific
lookup lists for data entry in MIST.
The terminology included in the master lists in MIST is shown in appendices 2 and 3, and the boxes at
the bottom of the patrol data sheet shown in appendix 4. Protected area specific additions can be made
providing they follow the same hierarchical logic as shown in table 1. These additions will then be includ-
ed in the master lists of MIST.
Changes to the master lists cannot be made by an individual protected area. They must be communicat-
ed to DNCP and, if justified, be included in the master lists by the database manager of the Department
of Nature Conservation and Protection.
5.2 Design of the patrol data sheet
The results from the first step of the information needs assessment are used to design the protected area
specific patrol data sheet (see appendix 4). The patrol data sheet is not a static document, it can be
adjusted any time once adaptive management, as illustrated in figures 1 and 2, provides the feed back
from patrols which makes additions to, or modifications of, the patrol data sheets necessary.
In order for the patrol data sheet to be suitable for ranger-based data collection the following criteria must
be considered:
1. Only data which can be processed into information which is useful to managers must
be collected.
2. Data recording needs to be easy and fast.
3. Patrol data sheets need to meet RBDC requirements and their use in the field
needs to be easy without sacrificing details required by managers.
1. Only data which can be processed into useful information is to be collected
The patrol data sheet must as a minimum provide space to record (1) the names of patrol members, (2)
the date of the patrol, (3) co-ordinates and time of waypoints based on GPS readings, (4) the observa-
tion, and (5) remarks. All observations and remarks which rangers should record should be clearly listed
on the patrol data sheet or on a separate sheet which needs to be carried by patrols to ensure that only
data which can be processed into information which is useful to managers are collected.
2. Data recording needs to be easy and fast
For each observation a three-letter code has been assigned, and for each observation code a one or
two-letter abbreviation (code) has been assigned as shown in the boxes at the bottom of the patrol data
sheet in appendix 4. These abbreviations/codes must be listed either on the patrol data sheet itself or on
a separate sheet which needs to be carried by patrols. The codes are used to complete the field
‘Observation Code’ in the patrol data sheet in order to minimise writing in the field and at the same time
to ensure that only observations chosen by management are recorded (see example in appendix 4).
3. Patrol data sheets need to meet RBDC requirements and must be easy to use
For RBDC data to be used for monitoring it is essential that waypoints are recorded at least every 30
minutes while a patrol is moving – even if no observation is made. If waypoints are taken at regular inter-
vals, the distance covered by patrols can be calculated at reasonable accuracy. Distance is required to
calculate indices for monitoring which take effort into account. Regular recording of waypoints also
ensures that the routes covered by patrols can be recorded. The more waypoints are taken, the greater
the accuracy of the route and distance covered.
15

The amount of time a GPS receiver can be used by rangers on foot patrols in remote areas is constrained
by battery life and so using a track log6 or taking waypoints every few minutes is not possible – the lat-
ter is also very time consuming. The number of waypoints to take depends on how fast the patrol is mov-
ing. The slower the patrol the less frequent waypoints need be taken. As a guideline, rangers should take
waypoints at least every 30 minutes.
The need for regular recording of waypoints (for a detailed explanation see appendix 1) has implications
on the design of the patrol data sheet. Patrol data sheets can provide fields and tick-box for every pos-
sible observation which needs to be recorded. This makes filling in of the patrol data sheet easy, but may
result in a multi page patrol data sheet which is not very easy to handle by patrols under field conditions.
Almost all of the fields and tick-boxes in such a patrol data sheet would remain empty for most RBDC
recordings because of the need to take a waypoint recording at least every 30 minutes. In Virachey
National Park (VNP) for example ranger patrols recorded more than 19,000 waypoints in 2005, most of
which were just waypoints without any observations. Only 142 incidences (i.e. waypoints) of illegal activ-
ities were recorded in 2005 – this is the only time when tick-boxes and a lot of data entry fields would
help to ensure that observations are recorded completely. If a multi-page patrol data sheet with a lot of
tick-boxes and data entry fields would be used in VNP, in more than 99% of all recordings these fields
would remain empty.
The need for (1) easy handling of patrol data sheets in the field, (2) accurate and complete recording of
all the details required by management and (3) recording of a waypoint at least every 30 minutes, can
be met using 2 different design concepts for patrol data sheets. Regardless of the design concept, the
patrol data sheets should provide space for the same information in their respective headers (date,
ranger station, type of patrol, GPS number, patrol day, patrol or team number or code, names of team
members, page number), while the actual data entry fields should be designed as described below:
• One patrol data sheet: A single page patrol data sheet (A4 size) with one row for each observation/
recording. The fields of the patrol data sheet must include as a minimum: running number, waypoint
number, UTM coordinates, time, observation code, and total. Remarks are written in a ‘free-hand’
field where patrols need to describe the details of illegal activities based on the structure given in the
flow diagram developed during the information needs assessment. The flow diagrams must be car-
ried by patrols to ensure that recording is complete. Brief remainders about what to record about ille-
gal activities can be listed in boxes on the patrol data sheet itself.
• Two different patrol data sheets: The same as above, but instead of providing space for the written
recording of observations under remarks on the back page of the patrol data sheet, this option uses
front and back page for fields listed above. If an illegal activity is encountered patrols will use a sep-
arate patrol data sheet7 for the recording of details of illegal activities with the appropriate number of
fields and tick-boxes (see example in appendix 4). The main patrol data sheet must have the option
to refer to the detailed patrol data sheet on illegal activities, and this in turn must have a field to link
it to the respective waypoint on the main patrol data sheet.
Depending on protected area management information needs, more columns (fields) may be needed on
the main patrol data sheet in addition to those listed above. Examples are: direction and distance to
observation8, and for mammals number of adult males and females and number of young. In a protect-
ed area which is mainly covered by dense forest, such as Virachey National Park, no separate columns
for direction and distance and number of adult males and females are required in the patrol data sheet.
If there is the need to record direction and distance or number of adult males and females and number
of young this can be done in the remarks column.
6 Track logs and RBDC principles can be used during mobile (car or boat) and air patrols when the GPS unit
can be easily connected to an external battery. In such situations data can either easily be stored directly onto
a portable computer/PDA or a PDA with integrated GPS can be used.7 Further additional data sheets may be used for specific recording requirements such as MIKE (Monitoring of
the Illegal Killing of Elephants – a CITES initiative).8 This may only be required in protected areas with open vegetation where wildlife observations can be made
over large distances. For further explanation see chapter 6 (additional principles).
16

5.3 Prepare instructions for filling in the patrol data sheet
The next step of the information needs assessment is to adjust the 3-page instruction for filling in the
patrol data sheet, which is shown in appendix 5, to the specific situation of the protected area. It is impor-
tant to note that only minor modifications can be made to the instructions sheet, and that no modifica-
tions can be made to the RBDC rules and principles listed in chapter 6.1. Modifications to the instruction
for filling in the patrol data sheet can only be made to section 1 (to be filled in before the start of each
patrol or each day of a multi-day patrol) and section 3 (remarks). The field instructions which are shown
in appendix 6 should be modified accordingly.
5.4 Prepare instructions for the set-up of GPS units
Clear instructions for the set-up of the specific GPS (Global Positioning System) model(s) used in the
protected area must be developed before the start of ranger-based data collection following the instruc-
tions shown in appendix 7.
All recordings made as part of ranger-based data collection must be geo-referenced using a hand-held
GPS receiver. This will provide sufficiently accurate position information to record where patrols have
been and to geo-reference (i.e. provide a co-ordinate reference for) ecological and illegal activity data
collected.
All GPS receivers used in protected areas must be set up in the same way for at least the time and unit
set up (position format, map datum, and distance). An example for the set-up of Garmin Map 60C is
shown in appendix 7.
5.5 Delineate management sectors
The protected are must be divided in strata (management sectors) which are similar in terms of patrol
intensity. See appendix 1 for a detailed explanation.
5.6 Agree on standard monthly MIST outputs
A set of standard monthly report, chart, and map outputs can be produced by MIST on button click:
Maps showing:
patrol coverage (areas patrolled shown in 1 km² grid cells, or any other size required by managers)
distribution and number of illegal activities
distribution and numbers of key wildlife species
Reports containing information about:
patrols (performance indicators such as time and distance patrolled per ranger, costs per km
patrolled, arrests per patrol day etc.)
illegal activities (indices and numbers)
key wildlife species (indices, numbers and population structure)
These outputs should be sufficient for all routine monthly information requirements of protected area
managers. Additional reports can easily be added but care must be taken not to include one-off informa-
tion request in the list of standard monthly outputs.
Standardised outputs are produced in MIST by clicking on map items, page tabs, list entries, and but-
tons. Specific, or one-off, information requests can easily be met by using the MIST query wizards and
a visual SQL Query Builder which provide advanced functions for production of maps, graphics, charts
and diagrams from any kind of database request in an easily understandable way. There is therefore no
need to add all possible information requests in the list of standard outputs, because any kind of infor-
mation request can easily be processed in MIST using advanced functions.
17

5.7 Set-up of MIST computer and software
A computer and appropriate software is needed to store and analyse the data. A spatial Management
Information System software programme (MIST) has been designed to support storing and processing
of RBDC data (Schmitt and Salle 2002) and has been adopted by DNCP for use in the protected area
system of Cambodia.
MIST is a custom-made tool which provides managers with easy and timely access to information for
planning, decision-making and evaluation. MIST is easy to customise and can be set-up to meet the
needs of different users and for different types of natural resource management, reflecting differences in
issues, objectives, and threats at local level and different protected area categories. MIST has been
developed as a programme which is not dependent on a highly trained GIS (Geographic Information
System) expert, which is easy to use, maintain and customise, and which provides different levels of
access for users – depending on their knowledge of database management and GIS. MIST can be used
on stand alone computers, a client/server network and at site level as well as national level after data
replication from the protected areas.
Entering data into a database without mistakes is very time-consuming and risks creating a bottle-neck
which makes it impossible to provide up-to-date information. MIST avoids this problem through data
download from GPS units and the use of look-up lists for data entry. This not only avoids data entry
errors, it also makes the process of data entry easy and fast. Protected area specific look-up lists need
to be created from master lists in MIST before data entry can start.
MIST uses ESRI (Environmental Systems Research Institute) shape file format for the display of spatial
data. Protected area specific shape files need to be provided by the GIS unit of the Ministry of
Environment and set-up in MIST prior to its use.
Ranger-based data collection and data processing can only start after all the elements
described above are in place:
• a list of species (mammals, birds, reptiles, amphibians) to be recorded by ranger patrols togeth-
er with their related observation codes,
• flow diagrams for all aspects of illegal activities to be recorded by ranger patrols,
• a data sheet (or two) designed based on the species lists and flow diagrams,
• a 3-page instruction for filling in the data sheet,
• RBDC field instructions,
• clear instructions for the set-up of the specific GPS model(s) used,
• a sub-division of the protected area in strata (management sectors) which are similar in terms
of patrol intensity,
• a set of standard monthly report, chart, map outputs to be produced by MIST on a single button
click, and
• a MIST computer and database with protected area specific look-up tables and shape files.
18

6. Field instructions
The field instructions given below form the basic contents of the RBDC training for rangers. A protected
area specific training can only be carried out after an information needs assessment and the develop-
ment of a patrol data sheet. If this is not the case the training must use the patrol data sheet and termi-
nology from a protected area where RBDC procedures are already in place as an example.
The brief field instructions (an example is given in appendix 6) should be laminated and carried by
rangers for reference in the field.
General rules
• Before starting a new patrol, make sure all waypoints from previous patrols have already been down-
loaded to the computer and deleted from the GPS unit.
• Do not change the settings of the GPS unit.
• Read the WAYPOINT number, LOCATION (48P-UTM) and TIME off the GPS unit.
o Do NOT change the Waypoint number. Use the number generated by the GPS
unit.
o Do NOT change the symbol of a Waypoint. The symbol must be the default
symbol.
o Record the time in 24 hour format.
o Waypoints stored in the GPS and written down on the patrol data sheet must match.
• Each waypoint must be stored in the GPS and recorded on the patrol data sheet.
• Follow the instructions recording of patrol observations (see appendix 5) when recording an obser-
vation.
• Take a waypoint whenever recording an observation. If you encounter more than one observation at
the same location, take a separate waypoint for each observation.
• Use only the OBSERVATION CODES listed in the boxes in the boxes at the bottom of the patrol data
sheet.
• Only record those observations of which you are 100% sure.
• For wildlife observations enter the number of individuals under TOTAL.
• For all other observations (illegal activities, physical features and degraded areas) and for 'position'
enter 1 under TOTAL.
• Take a waypoint at the start and end of each patrol day.
• Take a waypoint at the start and end of each stopping period such as ambush, lunch etc. (do not take
waypoints while stopped).
• Write detailed descriptions under REMARKS following the instructions given in the REMARKS box
at the bottom of the back page the patrol data sheet.
• Make a patrol data sheet entry (waypoint) at least once every 30 minutes while moving on patrol. For
an explanation of this key rule see appendix 1.
• If you cannot get a GPS reading due to poor satellite cover or dense canopy record the observation
and time only, continue the patrol and take a GPS reading as soon as the openness of the canopy
allows it and enter this waypoint as 'position'.
• Data from a GPS unit which is not set according to the GPS rules will be considered invalid, and the
rangers of that patrol will not be entitled to DSA.
• If waypoints are not taken every 30 minutes during the patrol rangers of that patrol will not be enti-
tled to DSA.
Additional principles
• Only record what is specified in the patrol data sheet and on the remarks chart. NB. there is one
exception: if you do encounter something in the field that you consider important to management,
describe it in detail under remarks and write 'position' for observation.
19

• Record observations about animals and birds only if 100% certain. For example, if, due to its size,
rangers cannot tell the difference between a tiger and a leopard footprint, they need to record "big
cat footprint” (providing it is in the list of observations identified during the information needs assess-
ment).
• Quality, not quantity, is important. A recorded observation is only useful if it is accurate. Only record
those observations of which you are 100% sure.
Example: You see a large mammal about 200 metres away for a glimpse in dense vegetation. You can-
not accurately identify it but villagers have told you lately that they have seen Gaur around. Do you record
a sighting of 1 Gaur? In this case you cannot accurately identify the animal, therefore do not record it.
• Record species observations only if they fulfil the criteria listed below:
- The species is listed on the patrol data sheet, and can be correctly identified.
- The observation is a recent sign which clearly indicates the presence of the species.
If you cannot identify the species without any doubt from a sighting, sign, or dead body, either:
- do not record it, or
- record it in general terms such as cat sp., deer sp. etc.
• There are 4 types of species observations:
- direct sightings -- an observation is recorded as a sighting if an animal species is directly sighted
and positively identified
- calls -- some animals, such as Elephants for example, can be positively identified by their distinct
call, while others can be identified to genus level, for example Hornbill.
- fresh signs -- some animal species leave distinct signs that can only be of that particular animal
species, e.g. elephant footprint. An observation should be recorded only if the sign is fresh, i.e.
less than one day old, and thus indicates a recent presence of the species.
- carcasses -- the cause of the death should be recorded as natural death or cause of death
unknown. NB. if the animal has been poached (e.g. died caught in snare) record it as illegal activ-
ity and describe the method of poaching used, e.g. gunshot, snare, spear etc. in remarks.
- To avoid the recording of the same carcass twice or more times, only carcasses less than 4 days
old should be recorded. As easy indicator for a 4-day old death is whether the carcass smells. If it
smells, do not record it, if it still has skin and meat attached and does not smell, record this as an
observation.
• When encountering a herd of animals do not record "1 group". Either count all individuals if the herd
is relative small, or estimate the number of species using the following technique. Count five (or ten)
animals, look at space they occupy, estimate how many times the ‘space of five’ fits within the size
of the entire herd, and multiply this number by five (or ten) to get the estimated total number. In such
a case write 'number estimated' in remarks.
• Recording of direction and distance to an animal observation may be required in protected areas
with open vegetation. In such areas wildlife observations can be made over large distances, but the
actual waypoint will be taken at the position of the observer and not at the position of the wildlife
specie(s). In such cases rangers should record direction (compass) and estimate the distance to the
wildlife. MIST will then calculate the actual position of the observation. Recording of direction and dis-
tance is only required if the observation is more than 100 m away from the GPS. If the patrol data
sheet provides columns for direction and distance fill these in, otherwise write direction an distance
in the remarks column.
• When recording mammals the number of adult males and females and number of young should be
recorded if possible. Do this only if you are 100% certain. Young mammals are those which fit under
the belly of their mother. If the patrol data sheet provides columns for number of adult males and
females and number of young fill these in, otherwise write the numbers in the remarks column.
20

7. Data entry in MIST
As soon as possible after the end of the patrol the completed patrol data sheets and GPS unit should be
handed to the staff member responsible for data entry – the Information System Manager (ISM). The
competencies and responsibilities of the Information System Manager are described in the DNCP staff
competency profiles for protected area staff in Cambodia.
Quality control
Once the ISM has received the patrol data sheets and GPS unit s/he must carry out a quality control, i.e.
check whether the patrol data sheets have been filled in correctly and whether the GPS unit has been
used according to the instructions:
• all waypoint, 48P, UTM, Time, Observation Code and Total fields are filled in
• all GPS readings have the correct number of digits
• long time gaps between recordings are explained
• start times of rest periods and ambushes are recorded and the times when the patrol resumed
• co-ordinates etc. for ‘start and end of patrol’ are recorded
• direction and distance are filled in (only if observation is more than 100 m away)
• distinction between sexes is possible, given the species and distance to the animal observed
• page numbering is correct
• remarks are clear and complete
• waypoints were taken at least every 30 minutes
• the GPS unit used was set according to GPS rules
MIST data entry
After the quality control the ISM needs to download the waypoints from the GPS into the MIST database
and enter the observation records following the instructions given in a separate MIST manual. The ISM
must also fill in 4 fields on the patrol data sheet:
• Date received: this is the date when the patrol data sheets and GPS unit have been received by the
ISM
• Received by/entered by: here the name of the person who received the patrol data sheets and GPS
unit and, once data entry has been completed for a patrol day, the name of the person entering the
data into the MIST computer has to be recorded
• Date entered into MIST: this is the date when the data have been entered into the MIST computer
• Patrol ID: to be filled at the beginning of data entry in the MIST computer (this number is assigned
by MIST)
NB a supervisor has to initial the patrol data sheet once the entered data have been checked against the
original patrol data sheet. The supervisor also needs to confirm by signature (1) that the GPS unit used
was set according to GPS rules, and (2) that waypoints were taken at least every 30 minutes.
21

8. RBDC training schedule
Ranger-based data collection is a key competence of protected area staff and is therefore taught as part
of the Basic Ranger Training Course and Park Protection Ranger Training Course of the national ranger
training curriculum for Cambodia.
A brief outline of the RBDC training module for both training courses is given below:
RBDC module basic ranger training (1 day)
Introduction to ranger-based data collection: what is RBDC, objective and principles (chapter 2)
The role of RBDC in protected area management (chapter 3 and section on RBDC and MIST on the next
page)
Standardised nomenclature used in RBDC (chapter 4.1 and appendices 2 and 3)
In addition to the information provided in chapter 4.1 explain the need for standards using examples
such as time, calendar and language. Without everybody using the same concept (i.e. standard) of
time and date (e.g. the next meeting will be on Monday 24th at 15:00 hours) communication would
be basically impossible. Without using consistent data collection, analysis, evaluation and reporting
standards in the protected area system of Cambodia, effective management will not be possible.
How to record observations and fill in the RBDC patrol data sheet (chapter 6 and appendices 4 and 5)
This is the key lesson and a lot of emphasis must be placed on the correct use of the flow diagrams
(either park specific if an information needs assessment has been carried out, or ‘generic’ using the
VNP flow diagram in appendix 2) and going through a lot of different examples how to fill in the patrol
data sheet (see appendix 4). Emphasis must also be placed on the '30 minutes rule' as explained in
detail in appendix 1.
Please note: the RBDC training module must be taught after the introduction of the use of GPS. The
instructions for the set-up of GPS units (appendix 7) should be repeated as part of the RBDC train-
ing.
RBDC field exercise 1
Break into groups. Each group should take a GPS unit and 2 patrol data sheets and take regular way-
points and record a selection of different types of [pretend] observations including:
o species observations (direct sighting and sign)
o observation of illegal activity with remarks
o observation with poor satellite coverage (no GPS reading)
o start and end of patrol day observations
o rest period
Review of patrol data sheets from field exercise 1
RBDC field exercise 2
Same as field exercise 1 – but with the input from the review of the first field exercise.
Review of patrol data sheets from field exercise 2 and round up
RBDC module park protection ranger training (1 day)
This is a refresher training because all park protection rangers should have gone through the basic train-
ing before doing the park protection training. The one-day training should follow the same principles as
the basic training but with more focus on field exercises and review.
Emphasis must be put on the '30 minutes rule' and the monitoring related patrol deployment issues
described in appendix 1. At the end of the training module a test should be carried out which shows
whether rangers have understood the principles explained in appendix 1.
22

RBDC and MIST
During the training rangers should be shown how the data they collect in the filed are used in manage-
ment decision-making.
A short computer presentation should be given which demonstrates:
• waypoint download from GPS units,
• data entry using look up lists, and
• data analysis and report production in form of tables, graphs and maps on a single button click.
Alternatively the steps listed above can be presented in a power point presentation. A set of maps and
reports from MIST should be used to illustrate the role of RBDC in the management of protected areas.
Distribution maps
Distribution maps can be used for monitoring and planning. Examples are species distribution maps com-
piled from data collected over long periods will provide information about seasonal movement patterns
and trends in distribution.
A time series of indices as shown in figure 3 should be used to explain the monitoring of trends without
a base-line. Appendix 1 provides additional information on the use of indices.
Figure 3 shows that the patrolled
distance remained fairly similar
from month to month: 232 to 290
km with an average of 267 km.
At the same time the index for
snares collected per month
shows a clear downwards trend
from 0.025 in January to 0.017 in
December.
Maps showing the distribution of illegal activities should be used for pro-active deployment of patrols. If,
when looking at aggregated data over long periods, patterns become evident (e.g. increased fishing
activities in a certain area at the beginning of the dry season) this information can be used to deploy
patrols pro-actively.
Patrol Deployment Planning
Deployment of patrols is done based on park protection requirements and intelligence information. In
addition, maps showing areas recently patrolled should be used to prepare a two week (or one month)
patrol operation plan.
Performance Indicators
Performance indicators - such as number of patrol days per month, kilometres patrolled per day and
costs per kilometre patrolled - are calculated as part of routine outputs and should be used for monitor-
ing and evaluation of the implementation of the annual operations and monthly patrol operation plans
(BPAMP 2006). This will show whether or not the patrol targets set in the plans have been achieved.
Rangers should be encouraged to use RBDC because it not only provides the data for effective protect-
ed area management it also proofs to anybody the amount of hard work done by rangers while on
patrols.
23
50
100
150
200
250
0.025
Snares/kmKm
0.020
0.015
Distance patrolled
Snares/km
300
350
0
Jan
Feb
Mar
May
Jul
Au
g
Sep
Oct
Nov
Dec
Jun
Ap
r
Fig. 3: Chart which illustrates a downwards trend in illegal activities using indices.

9. References
Allen, S.H., and Sargeant, A.B. 1975. A Rural Mail-carrier Index of North Dakota Red Fox. Wildlife
Society Bulletin 3: 74-77.
Appleton, M.R., Texon, G.I. and Uriate, M.T. 2003. Competence Standards for Protected Area Jobs inSouth East Asia. ASEAN Regional Centre for Biodiversity Conservation. Los Baños, Philippines. 104
pp.
BPAMP 2005. Participatory Development of Management Plans for Protected Areas in Cambodia.Ministry of Environment and BPAMP, Cambodia. 55 pp.
BPAMP 2006. Annual Operations and Budget Planning and Monitoring and Evaluation for ProtectedAreas in Cambodia. Ministry of Environment and BPAMP, Cambodia. 42 pp.
CBD Secretariat 2005. Handbook of the Convention on Biological Diversity. 3rd edition. CBD, UN and
UNEP, Montreal, Canada. xl + 1493 pp.
Caughley, G., and Sinclair, A.R.E. 1994. Wildlife Ecology and Management. Blackwell Scientific
Publications, Boston, Oxford, London, Edinburgh, Melbourne, Paris, Berlin, Cambridge, MA. 334 pp.
Eberhardt, L.L. 1978. Transect Methods for Population Studies. Journal of Wildlife Management 42: 1-31.
Eltringham, K.S., Coosey, I.A., Dixon, W.J.B., Raine, N.E., Sheldrick, C.J., McWilliam, N.C. and Packer,
M.J. 1999. Large Mammals of Mkomazi. Pages 485-504 in Coe, M.J., McWilliam, N.C., Stone, G.N.
and Packer, M.J. editors. Mkomazi: The Ecology, Biodiversity and Conservation of a Tanzanian
Savanna. Royal Geographical Society. London.
Goldsmith F.B. ed. 1991. Monitoring for Conservation and Ecology. Chapman and Hall. London. 275 pp.
Lamprey, H.F. 1964. Estimation of the Large Mammal Densities, Biomass and Energy Exchange in the
Tarangire Game Reserve and the Masai Steppe in Tanganika. East African Wildlife Journal 2: 1-46.
Norton-Griffiths, M. 1978. Counting Animals. Second revised edition. African Wildlife Foundation, Nairobi,
Kenya. 109 pp.
Ottichilo, W.K. 1999. Comparison of Sample and Total Counts of Elephant and Buffalo in Masai Mara,Kenya. African Journal of Ecology 37: 435-438.
Schmitt, K., Jaeckel, W. and Atukunda-Muhimbura, A. 1999. An Information System for WildlifeMonitoring Based on Data Collected by Park Rangers (Uganda). Presentation at the 2nd
International Wildlife Management Congress in 1999 in Gödollo, Hungary.
Schmitt, K and Sallee, K. 2002. Information and Knowledge Management in Nature Conservation.Supporting Planning, Decision-making and Evaluation in Wildlife Management in Uganda with aSpatial Management Information System (MIST). GTZ-UWA. Uganda. 33 pp.
24

25

APPENDICES
26

APPENDIX 1: Monitoring of wildlife population trends and trends in illegal activities
A standard text book on monitoring such as Goldsmith (1991) already stated one year before the Rio
Declaration “The recording of changes in the abundance of plants and animals is vital for decision-mak-
ing in conservation. It has become of increasing interest particularly in view of concern over projected
global environmental change which is likely to profoundly affect the diversity of species on earth.” This
text book emphasises the distinction between monitoring and surveys. A survey “…. is an inventory, it is
static in its background philosophy and it is usually done once only.” Monitoring on the other hand “…. is
purpose oriented; it tells us how something(s) is/are changing; it is repeated at regular intervals and it
often provides the baseline for recording possible changes in the future. Thus it is dynamic in philoso-
phy, purpose oriented and needs to be critically examined prior to implementation.”
Goldsmith (1991) provides the following definition for monitoring: “Intermittent (regular of irregular) sur-
veillance carried out in order to ascertain the extent of compliance with a predetermined standard or the
degree of deviation from the expected norm.” Surveillance is “an extended programme of surveys,
undertaken in order to provide a time series, to ascertain the variability and/or range of states or values
which might be encountered over time.” A survey is “an exercise in which a set of qualitative or quantita-
tive observations are made, usually by means of a standardised procedure …”. (Goldsmith 1991, p. 2).
When planning a monitoring programme issues such as purpose, intensity and frequency of monitoring,
method (e.g. total count, random or stratified random sampling, use of plots or transects etc.), analysis
and interpretation must be taken into consideration. It may be possible to count every species of a rare
plant in a small protected area, but for most species populations an estimate of the mean number per
unit area, together with a standard error of that mean, is commonly used in scientific monitoring.
Sampling, rather than total counts, is widely used to get the data required for monitoring because it can
be done faster and is less expensive, both in terms of finances and human resources. Simple monitor-
ing schemes are likely to be the most effective and have a chance to succeed over a longer period which
will inevitably involve many different people. Ranger patrols do not systematically cover the entire park
area, neither do patrols follow random patterns. All these issues were considered when designing the
concept of ranger-based data collection with the aim to provide managers of protected areas with rele-
vant, up-to-date and readily available information on wildlife populations (biodiversity) and illegal activi-
ties for monitoring and evaluation.
Systematic transect counts are widely used to collect data for the monitoring of population trends of large
mammals (Lamprey 1964, Eberhardt 1978, Norton-Griffiths 1978). A number of studies comparing sam-
ple and total counts have shown that sample counts provide reliable results (e.g. Lamprey 1964,
Eltringham et al. 1999, Ottichilo 1999). Sample counts require dedicated staff and adequate financial
resources to be carried out.
Ranger patrols do not follow systematic transects - they are deployed based on park protection require-
ments, areas patrolled recently, and intelligence information. Patrols do not follow straight lines (tran-
sects) but follow paths of least resistance (e.g. around rather than through a swamp) or, for example,
footprints of poachers. The question therefore is: how can data collected opportunistically by rangers on
park protection patrols be used for the monitoring of illegal activities, wildlife populations and biodiversi-
ty? This can be done through the use of indices which provide measures of relative density for compar-
isons in monitoring programmes.
A study over a 5-year period by Allen and Sargeant (1975) has shown that indices can be compared with cen-
sus data. They found a positive correlation (r = 0.958) between the index (number of red foxes per 1,000 miles
driven by rural mail carriers in North Dakota) and township aerial census data (red fox families per township).
A pilot study carried out in Murchison Falls Conservation Area in Uganda (1998 - 2001) compared popula-
tion estimates from 21 aerial counts (systematic reconnaissance flights, Norton-Griffiths 1978) with monthly
indices from ranger park protection patrols. A direct comparison of population estimates from the first 6 of the
21 systematic reconnaissance flights with indices from ranger patrols was carried out for a presentation at the
2nd International Wildlife Management Congress and gave a poor correlation, R²=0.5 (Schmitt et al. 1999).
When comparing all 21 population estimates from aerial counts in Murchison Falls Conservation Area with
indices from ranger patrols, and particularly when looking at the spatial distribution of patrols and the distance
patrolled per month, it becomes apparent that there is a relationship between effort and precision.
27

Based on these findings one can conclude that:
The importance of distance recording
Rangers on park protection patrols often collect geo-referenced data whenever encountering illegal activ-
ities or wildlife species using a GPS and a patrol data sheet (fig. 4A). Such data are useful for the pro-
duction of species/illegal activity distribution maps and reports on the numbers of illegal activities, but
they can not be used for monitoring because they do not take sampling intensity into consideration.
The most appropriate way to account for sampling intensity of ranger patrols is distance patrolled.
Distance recording can be done using the track log function of the GPS unit providing the GPS is turned
on during the entire duration of the patrol. This is not an option for multi-day foot patrols in remote areas
due to limitations with the internal memory of the GPS and the high costs for batteries. A practical alter-
native for ranger patrols is to take waypoints at regular intervals. The distance patrolled can then be cal-
culated with reasonable accuracy using MIST (fig. 4B). The shorter the time interval between waypoint
recording the more accurate will be the distance calculation. Rangers must therefore take a GPS read-
ing at least every 30 minutes while moving on patrol.
Data collected opportunistically by routine ranger park protection patrols can be used to obtain precise
indices for monitoring trends in wildlife populations and illegal activities if the bias in spatial distribu-
tion is low and the number of kilometres patrolled high. This can be achieved in discrete and relative-
ly small areas which are similar in terms of patrol intensity.
A B
Waypoint at the beginning and end of the patrol day
Waypoint for wildlife sighting and illegal activity
Patrol path
Patrol distance calculated from waypoints taken
Waypoint taken every 30 minutes
Patrol distance calculated from waypoints taken
Figure 4: Comparison of actual and calculated patrol distance. A: based on waypoints taken
when recording an observation, and B: based on RBDC principles.
28

The example shown in figure 4 illustrates the importance of taking regular waypoints for the accuracy of
the patrol distance calculation. Figure 4A shows a patrol where rangers only take waypoints when actu-
ally encountering an illegal activity or a sighting/sign of wildlife. The patrol distance calculated from the
waypoints, using Euclidean Distance, is much less than the actual distance patrolled. The same patrol is
used in figure 4B with additional waypoints taken every 30 minutes. The calculated patrol distance is fair-
ly similar to the actual distance patrolled. Please note that the calculated distance will always be slightly
less than the actual distance patrolled.
The use of indices for monitoring
If the distance patrolled has been calculated with reasonable accuracy, distance related indices can be
calculated. Examples are: elephants seen per kilometre patrolled, snares collected per kilometre
patrolled, costs per kilometre patrolled (per month, per arrest etc.). An index such as snares collected per
kilometre patrolled can show changes in relative hunting pressure over time without knowing the actual
number of poachers or number of animals killed. It can be used to indicate the success or failure of anti-
poaching measures.
Without the distance information monitoring cannot be done. Lets look at a hypothetical example to illus-
trate this:
In a protected area ranger patrols have recorded data on snares collected during a 3 period:
Based on these figures the protected area management reports that they have been successful at
significantly reducing illegal activities between 2000 and 2002. This statement cannot be made with
certainty and may be wrong. Based only on the numbers of snares confiscated no conclusion about
changes in the extent of illegal activities can be made because the effort (intensity) put in the collec-
tion of the data has not been taken into consideration.
An effort measure which can be added easily is the number of patrols carried out:
One could conclude that, because the sampling intensity (or patrol effort) has been the same during
the monitoring period, there has been a significant reduction in illegal activities. Again, this statement
cannot be made with certainty and may be wrong. Number of patrols is not a good measure of inten-
sity because patrols for example can be of different duration.
Another effort measure which can be added easily is the number of patrol days:
The number of patrol days, as a measure of effort, are similar and one could conclude that there has
been a significant reduction in illegal activities. Again, this statement cannot be made with certainty
and may be wrong. The number of patrol days is not a good measure of intensity because the dis-
tances covered during patrol days may vary.
YearNo. of snares
collected
2000 200
2001 100
2002 50
YearNo. of snares
collectedNo. of patrols
2000 200 20
2001 100 20
2002 50 20
YearNo. of snares
collectedNo. of patrols
No. of patrol
days
2000 200 20 40
2001 100 20 34
2002 50 20 38
29

It is therefore essential to record the actual distance patrolled as a measure of effort, only then can
indices per kilometre patrolled be calculated:
The distances patrolled per year are similar and the indices show a significant decrease in snares
collected per kilometre patrolled. Based on this, one could conclude that there has been a significant
reduction in illegal activities. Again, this statement cannot be made with certainty and may be wrong
because the spatial distribution has not been taken
into consideration as an important measure of inten-
sity. Figure 5 illustrates the importance of the spatial
deployment if data collected by patrols are to be used
for monitoring.
Figure 5 shows the areas which were patrolled dur-
ing the period 2000 – 2002. Although the actual dis-
tance patrolled per year remained similar (740 – 800
km), the area covered by patrols decreased steadily
from year to year due to a higher patrolling intensity
in smaller areas. Therefore, again, no statement
about trends can be made with certainty because the
spatial distribution was not without bias, was not
more or less even.
Only if the distance patrolled has been recorded with
reasonable accuracy (and if the distance is high and
fairly similar over time) and if the spatial deployment
is without bias can indices be used for monitoring of
trends in illegal activities and wildlife populations.
Management sectors
The delineation of management sectors can best be done based on the documented patrol deployment
and on the location of patrol infrastructure, such as ranger outposts, roads and trails. The park shown in
the hypothetical example in figure 5 should be divided into three management sectors which will be sim-
ilar in shape to the areas patrolled in the year 2000. The borders of the management sectors should fol-
low natural or man-made features. The Warden Park Protection must then ensure that patrol deployment
within the management sectors is done without spatial bias (i.e. more or less evenly distributed) and that
the number of kilometres patrolled is high and fairly similar from month to month. The latter may be dif-
ferent for the dry and rainy season.
YearNo. of snares
collectedNo. of patrols
No. of patrol
days
Distance
patrolled (km)
Snares col-
lected/km
2000 200 20 40 800 0.25
2001 100 20 34 740 0.14
2002 50 20 38 770 0.06
30
Figure 5: Extent of areas patrolled in the hypo-
thetical protected area between 2000 and 2002.

Implications for protected area management
The quality and usefulness of a monitoring system depends on the quality of its data. The protected area
management must therefore ensure that:
• the protected area is sub-divided into strata (management sectors) which are similar in
terms of patrol intensity,
• patrols are deployed effectively in terms of spatial distribution and distance,
• GPS readings are taken at least every 30 minutes while the patrols are moving,
and
• the quality and consistency of RDBC is high.
If all this is done, the opportunistic nature of the RBDC data collection will resemble random sampling
over time, and thus can be used for monitoring in distinct strata such as management sectors.
The way data from RBDC are used in decision-making at protected area level, and the link to the nation-
al/regional level through database replication and the information flow at national/regional level is shown
in figure 6. MIST can be tailor-made to reflect differences in issues, objectives, and threats at local level
and different protected area categories due to the easy customisability of the programme. Because of
the design of the database and the database replication module MIST becomes a tool for use at nation-
al or regional (trans boundary) level once data from the protected areas are replicated to the central MIST
database.
effects of actions on real world
effe
cts
of a
ctio
ns o
n re
al w
orl
d
database replication
Data capture
Data entry, data
download MIST protected area database
Information User
Decisions, actions
MIST Central database
Information
User
User process , unders tanding
Decisions, actions
Meta database
User's memory, knowledge base
Other inputs: informal information system, training, etc.
Other inputs: external data, documents, manuals, etc.
Knowledge exchange
Pro
tect
ed A
rea
leve
lN
atio
nal
an
d re
gio
nal
leve
l
access dissemination
Figure 6: Data and information flow and database replication at protected area and
national/regional level.
31

AP
PE
ND
IX 2
: F
low
dia
gra
m -
data
to
be r
eco
rded
ab
ou
t ille
gal
acti
ves i
n V
irach
ey N
ati
on
al
Park
Poac
hin
g
dir
ect
evid
ence
H
un
tin
g
Fish
ing
nu
mb
er c
auti
on
ed
nu
mb
er o
f po
ach
ers
seen
, no
t ca
ug
ht
anim
als
con
fisc
ated
loca
l res
iden
ts
Bra
o
Ch
aray
K
avet
K
reu
ng
Ta
mp
eon
wea
po
ns/
item
s co
nfi
scat
ed
wea
po
ns/
item
s se
en
AK
-47
M16
C
KC
auto
mat
ic w
eap
on
ar
row
ax
e (s
ho
rt/l
on
g h
and
le)
b
oat
b
oat
en
gin
e
bo
w
bu
llet
av
et c
ase
ca
rtri
dg
e
chai
n s
aw
cag
e fo
r w
ildlif
e
elec
tric
ro
d
fish
ing
net
fl
ash
lig
ht
g
un
ho
me
-mad
e
seri
al
nu
mb
er
spec
ies
and
n
um
ber
s
'an
imal
' tre
e
bu
llet
ca
mp
ca
rtri
dg
es
do
g fo
ot
pri
nt
fi
shin
g n
et
gu
n s
ho
t h
eard
fo
otp
rin
t (h
um
an)
tu
rtle
ho
oks
w
ire
snar
e h
ole
w
ire
tig
er s
nar
e
po
ach
ed a
nim
al
live
d
ead
p
arts
war
nin
g le
tter
issu
ed
nu
mb
er a
rres
ted
bo
nes
fe
ath
ers
g
all b
lad
der
h
orn
s
mea
t
skin
sk
ull
st
om
ach
Ko
k La
k C
om
mu
ne
Yo
rn v
illag
e
O'C
hay
vill
age
..
..
han
d g
ren
ade
kn
ife
mac
het
e
min
e
po
iso
n
rice
kg
spea
r
turt
le h
oo
k
wir
e sn
are
w
ire
tig
er s
nar
e
sig
n
Hu
nti
ng
Fi
shin
g
OB
S_C
OD
E
spec
ies
and
um
ber
s,
cau
se o
f dea
th
OB
SER
VATI
ON
off
end
er in
form
atio
n
Kh
mer
m
ino
rity
p
olic
e
mili
tary
m
ilita
ry p
olic
e
fore
str
y o
ffic
er
Cam
bo
dia
n
Lao
V
ietn
ames
e
loca
l au
tho
rity
ou
tsid
er
no
n-r
eo
ffen
ce
co
ntr
act
sig
ned
nu
mb
er f
ined
REM
AR
KS
ac
tion
take
n*
un
der
lined
tex
t ar
e h
ead
ing
s
* in
th
e M
IST
dat
a en
try
form
06/2
006
32

O
BS_C
OD
E
OB
SERVATIO
N
Plant
harvestin
g d
irect evid
ence
nu
mb
er of h
arvesters
seen, n
ot cau
gh
t
weap
on
s/items
con
fiscated
weap
on
s/items
seen
axe (sh
ort/lo
ng
han
dle)
ch
ain saw
Eag
lewo
od
h
om
e-mad
e gu
n
Malva n
uts (rip
e/un
ripe)
kg
mach
ete
sign
Kg
of h
arvest
nu
mb
er of trees felled
n
um
ber o
f log
s
nu
mb
er of stum
ps +
diam
eter
nu
mb
er of sh
oo
ts
size of p
on
d (m
²)
local resid
ents
B
rao
Ch
aray
Kavet
K
reun
g
Tamp
eon
warn
ing
letter issued
nu
mb
er arrested
Ko
k Lak Co
mm
un
e
Yorn
village
O
'Ch
ay village
....
offen
der in
form
ation
Kh
mer
min
ority
po
lice
military
military p
olice
fo
restry officer
C
amb
od
ian
Lao
Vietn
amese
local au
tho
rity
ou
tsider
no
n-reo
ffence co
ntract sig
ned
nu
mb
er fined
action
taken*
nu
mb
er cautio
ned
Leng
th/w
idth
of ro
ad
nu
mb
er of saw
mills
luxu
ry log
s
log
s class 1 & 2
co
nstru
ction
timb
er
species an
d n
um
bers
size (len
gth
, diam
eter at base, at to
p)
REM
AR
KS
Eaglew
oo
d
Fru
it tree M
alva tree
Raisin
tree
Rattan
Log
po
nd
s
Log
gin
g
Eaglew
oo
d
Fru
it tree M
alva tree
Raisin
tree
Rattan
Log
s
Log
po
nd
s
Log
gin
g road
Saw
mill
** Log
gin
g ro
ads an
d saw
mills can
be
record
ed in
the sam
e way u
nd
er direct
eviden
ce, if the o
ffend
ers are presen
t
**
* un
derlin
ed text are h
eadin
gs
in th
e MIST d
ata entry fo
rm
33
06/2
00
6

O
BS_
CO
DE
O
BSE
RVA
TIO
N
Encr
oac
hm
ent
dir
ect
evid
ence
Cu
ltiv
atio
n
Ro
ad
Swid
den
Tr
esp
assi
ng
nu
mb
er o
f en
cro
ach
ers
see
n,
n
ot
cau
gh
t
wea
po
ns/
item
s co
nfis
cate
d
wea
po
ns/
item
s
seen
axe
(sh
ort
/lo
ng
han
dle
)
chai
n s
aw
ho
me
-mad
e g
un
m
ach
ete
g
ems
sc
rap
met
al
sig
n
Cu
ltiv
atio
n
Ro
ad
Swid
den
Tr
esp
assi
ng
size
(m²)
n
um
ber
of p
eop
le
loca
l res
iden
ts
Bra
o
Ch
aray
K
avet
K
reu
ng
Ta
mp
eon
war
nin
g le
tter
issu
ed
nu
mb
er a
rres
ted
Ko
k La
k C
om
mu
ne
Yo
rn v
illag
e
O'C
hay
vill
age
..
..lo
cal a
uth
ori
ty
ou
tsid
er
no
n-r
eo
ffen
ce
con
trac
t si
gn
ed
nu
mb
er fin
ed
ac
tio
n t
aken
*
nu
mb
er c
auti
on
ed
go
ld
gem
sto
nes
m
etal
size
(m²)
[cu
ltiv
atio
n/s
wid
den
]
nu
mb
er o
f peo
ple
an
d h
ou
ses
le
ng
th/w
idth
(m) [
road
]
off
end
er in
form
atio
n
Kh
mer
m
ino
rity
p
olic
e
mili
tary
m
ilita
ry p
olic
e
fore
stry
off
icer
C
amb
od
ian
La
o
Vie
tnam
ese
REM
AR
KS
Min
ing
Min
ing
* u
nd
erlin
ed t
ext
are
hea
din
gs
in t
he
MIS
T d
ata
entr
y fo
rm
06/2
006
34

APPENDIX 3: List of observations codes
All observations must be further qualified by a specific observation code.
Further details are recoded under remarks.
New protected area specific codes can be added to those shown in the table below.
But care must be taken not to add details which should be recorded as remarks at
the level of the observation codes. The existing codes cannot be changed.
All codes currently included in the MIST master lists of observation codes for illegal activities and ani-
mals are shown in the table below. These codes are based on the situation in Virachey National Park.
Other codes can be added to cover specific situations found in other protected areas. Please note that
under animal observations the actual name of the species will be recorded by ranger patrols.
Illegal Activities
Observation Code
Animals
Observation Code
Encroachment Cultivation
Mining
Road
Swidden
Trespassing
Bird species name Call
Egg
Nest
Photo
Poached
Sighting
Fire
Plant harvesting
Position
Eaglewood
Fruit tree
Malva tree
Raisin tree
Rattan
Sawmill
Logging
Logs
Log ponds
Logging road
Mammal species name Call
Dead-carnivore eating
Dead-cause unknown
Dig
Dropping
Footprint
Natural death
Photo
Scratch
Sighting
Trail
Poaching Fishing
Hunting
Reptile species name Dead-cause unknown
Footprint
Photo
Sighting
Amphibian species name Photo
Sighting
35

AP
PE
ND
IX 4
: E
xam
ple
patr
ol
data
sh
eets
l
OB
SERV
ATIO
NS
- Ille
gal a
ctiv
itie
s:PO
ACH
ING
dire
ct o
bser
vatio
n: P
OD
- H
untin
g, F
ishi
ng;
POA
CHIN
G s
ign:
PO
S - H
untin
g, F
ishi
ngPL
AN
T H
ARV
ESTI
NG
di
rect
obs
erva
tion:
PH
D- E
agle
woo
d cu
ttin
g, F
ruit
tree
cut
ting,
Log
ging
, Mal
va tr
ee c
uttin
g, R
esin
tree
cut
ting,
Rat
tan
cutt
ing,
Sa
wm
illsi
gn: P
HS-
Eag
lew
ood
cut,
Frui
t tre
e cu
t, Lo
gs, L
og p
onds
, Log
ging
road
, Mal
va tr
ee c
ut, R
esin
tree
cut
, Rat
tan
cut,
Saw
mill
ENCR
OA
CHM
ENT
dire
ct o
bser
vatio
n: E
ND
- Cu
ltiva
tion,
Min
ing
gold
, Min
ing
gem
sto
nes,
Min
ing
met
al, R
oad,
Sw
idde
n, T
resp
assi
ngsi
gn: E
NS
- Cul
tivat
ion,
Min
ing
gold
, Min
ing
gem
sto
nes,
Min
ing
met
al, R
oad,
Sw
idde
n, T
resp
assi
ngFI
RE d
irect
obs
erva
tion:
FID
; FIR
E si
gn: F
IS
GR
OU
ND
PA
TR
OL
DA
TA S
HE
ET
VIR
AC
HE
Y N
AT
ION
AL
PA
RK
Dat
eD
ayof
pa
trol
day
sRa
nger
Sta
tion
GPS
no
ru
n.
Nos
Way
-po
int
LOCA
TIO
N
O
BSER
VATI
ON
CO
DE
TOTA
LRE
MA
RKS
�
48P
UTM
48P
UTM
48P
UTM
48P
UTM
48P
UTM
48P
UTM
48P
UTM
48P
UTM
BAN
_s
248
PU
TM
48P
UTM
POD
_H
1
48P
UTM
48P
UTM
48P
UTM
48P
UTM
48P
UTM
48P
UTM
Page
-
04/2
006
Rece
ived
/en
tere
d by
:D
ate
ente
red
into
MIS
T:D
ate
rece
ived
:Pa
trol
ID:
ID n
umbe
r fro
m M
IST
from
GPS
di
spla
y
Obs
erva
tion
reco
rdin
gs o
f mam
mal
s ba
sed
on s
peci
es li
sted
(3 o
r 4-le
tter
cod
es*)
and
on
addi
tiona
l inf
orm
atio
n (1
- or
2 le
tter
cod
e)Th
e ex
ampl
e sh
ow is
the
sigh
tingo
f 2
Bant
eng
* 4
lett
er c
odes
are
ass
igne
d by
MIS
TTIM
E
Reco
rdin
g of
ille
gal a
ctiv
ities
bas
ed o
n3
or 4
-lett
er c
odes
and
a fu
rthe
r sp
ecifi
catio
n (1
- or 2
-lett
er c
ode*
)Th
e ex
ampl
e sh
ow is
one
inci
denc
e of
po
achi
ng d
irect
evi
denc
e hu
ntin
g*
bold
lett
ers
in b
ox b
elow
OB
SERV
ATIO
NS
- Mam
mal
s:
BA
N (B
ante
ng),
BSP
(Bea
r sp.
), B
BR
(Bla
ck B
ear)
, BSB
(Sun
Bea
r), C
AT (C
at s
p.),
CFC
(Fis
hing
Cat
), CG
C (G
olde
n Ca
t), C
MC
(Mar
bled
Ca
t), C
VT
(Civ
et s
p.),
CLI (
Larg
e In
dian
Civ
et),
CLS
(Lar
ge-s
pott
ed C
ivet
), CP
C (C
omm
on P
alm
Civ
et),
CSI (
Smal
l Ind
ian
Cive
t), C
SP (S
mal
l-too
thed
Pal
m C
ivet
), D
LE (D
hole
), D
LR (D
ouc
Lang
ur),
ELE
(Ele
phan
t), G
AU
(Gau
r),
GYC
(Yel
low
-che
eked
Gib
bon)
, HB
R (H
og B
adge
r), L
PD (L
eopa
rd),
LPC
(Clo
uded
Leo
pard
), LM
D (L
esse
r Mou
sede
er),
MSP
(Mac
aque
sp.
), M
LT (L
ong-
taile
d M
acaq
ue),
MPT
(Pig
-tai
led
Mac
aque
), M
ST (S
tum
p-ta
iled
Mac
aque
), M
JS (M
untja
c sp
.), M
RM (R
ed M
untja
c), O
SP (O
tter
sp.
), PO
R (A
sian
Por
cupi
ne),
SAM
(Sam
bar)
, SLR
(Silv
ered
Lan
gur)
, SS
W (S
outh
ern
Sero
w),
SPG
(Sun
da P
ango
lin),
TIG
(Tig
er),
WPG
(Wild
Pig
)v
Add
cod
es fo
r: se
en, c
all, f
resh
foot
prin
t, fr
esh
drop
ping
, fre
sh s
crat
ch, n
atur
al d
eath
, cau
se o
f dea
th u
nkno
wn
36

Team num
ber:
Team Leader:
GPS-user:
Run
Nos
Continue O
bservations or Rem
arks
RE
MA
RK
S - illegal activities:D
etails about people: number of people seen, cautioned, w
arned or arrested (Cam
bodian, Lao or Vietnam
ese); Khm
er or ethnic minority+village; m
ilitary, military
police, police or forestry officer.W
eapons/items seen or confiscated: autom
atic weapon (A
K47, M
16, CK
C, other)+serial num
ber, home-m
ade gun, axe (short or long handle), arrow, boat+engine, bow
, bullets (head, case or w
hole cartridge), chainsaw, cage, electric rod, fishing net, flash light, hand grenade, kg of rice, knife, m
achete, mine, poison, spear, turtle hook, w
ire snare, w
ire tiger snare; species and number of anim
als confiscated (live, dead, or parts: bones, feathers, gall bladder, horns, meat, skin, skull, stom
ach), Eaglewood, K
g M
alva nuts (ripe or unripe), scrap metal, gem
s.Poaching (direct and sign): sign or num
ber of; 'animal' tree, bullets (head, case or w
hole cartridge), camps in use, fishing nets, gun shots heard, foot print (hum
an or dog) turtle hooks, w
ire snares, snares, tiger snare holes, and poached animals (species, num
ber and cause of death).Plant H
arvesting (direct and sign): number, species and size of; trees felled, logs or stum
ps. Also kg of harvest, size of pond or length of transport road.
Encroachm
ent (direct and sign): length, width and area (m
²) of encroached area.Fire (direct and sign): fire controlled or not controlled. A
rea of burn (m²).`
OB
SER
VATIO
NS - R
eptilesM
NL
(Monitor sp.), M
BL
(Bengal M
onitor), MW
T (W
ater Monitor), SC
R (Siam
ese Crocodile), B
KT
(Banded K
rait), C
OB
(Cobra sp.), C
KG
(King C
obra), CM
D (M
onocellate Cobra), C
IS (Indochinese Spitting Cobra), R
CS (C
omm
on Ratsnake), R
SI (Indochinese R
atsnake), PWS (Puff-faced W
ater Snake), RPY
(Reticulated Python), E
TT
(Elongated Tortoise), GPT
(Giant A
sian Pond Turtle), SST
(Giant Soft-shelled Turtle), M
SE (M
alayan Snail-eating Turtle), MB
T (M
alyan Box Turtle, A
ST (SE A
sian Soft-shelled Turtle), T
SP (Turtle sp.), IMT
(Impressed Tortoise).
OB
SER
VATIO
NS - B
irdsC
HP (C
hestnut-headed Partridge), GPF (G
reen Peafowl), PG
P (Grey Peacock Pheasant), PSR
(Silver Pheasant), H
MY
(Hill M
yna), HSP (H
ornbill sp.), HB
G (G
reat Hornbill), H
OP (O
riental Pied Hornbill), L
AT (Lesser A
djutant), R
JF (Red Junglefow
l), RC
W (R
ed-collared Woodpecker), R
TN
(River Tern), SC
N (Sarus C
rane), SFB (Siam
ese Fireback), VSP
(Vulture sp.), V
RH
(Red-headed V
ulture), VSI (W
hite-shouldered Ibis), WN
S (Wooly-necked Stork)
Others: any other observation of relevance to park m
anagement
The box below provides the
details rangers must record
when encountering an
illegal activity
37

Th
is i
s a
nd
exam
ple
of
a f
ille
d i
n p
atr
ol
data
sh
eet
Ru
n N
o.
2:
Sig
hting o
f 2 P
ig-t
aile
d m
acaques,
no w
aypoin
t because t
he c
anopy w
as s
o d
ense t
hat
the p
atr
ol did
not
get
enough s
ate
llite
fix
es f
or
a G
PS
positio
n r
ecord
ing
Ru
n N
o.
3:
Positio
n w
aypoin
t w
hic
h w
ill b
e u
se
d in M
IST
to c
alc
ula
te t
he c
oord
inate
s o
f th
e M
PT
_s o
bserv
ation
Ru
n N
o.
6:
Horn
bill
call
Ru
n N
o.
7:
Sig
n o
f poachin
g h
unting:
2 w
ire s
nare
s
Ru
n N
o.
8:
Direct
evid
ence o
f poachin
g h
unting:
2 p
oachers
carr
yin
g o
ne A
K-4
7 a
nd o
ne d
ead p
angolin
escaped [
text
continues o
n b
ack p
age]
because t
hey w
ere
on t
he o
ther
sid
e o
f th
e r
iver
when w
e s
aw
them
. W
e c
harg
ed t
hem
after
cro
ssin
g t
he r
iver, b
ut
they g
ot
aw
ay
because t
he r
iver
cro
ssin
g t
ook t
oo
long.
Run N
o. 1
1, 1
2:
2 o
bserv
ations m
ade f
rom
the s
am
e p
ositio
n:
Sun B
ear
scra
tches a
t th
e p
ositio
n o
f th
e G
PS
user, a
nd t
wo W
ild P
igs w
ere
seen a
bo
ut
200 m
etr
es t
o t
he n
ort
h
Ru
n N
o.
14:
[text
continues o
n b
ack p
age]
wait in c
ase t
he n
ois
e w
as f
rom
people
poachin
g n
earb
y.
Dat
e12
.12
.200
5D
ay1
of
p
atro
l d
ays
Ran
ger
Sta
tio
n
Veu
nsa
iG
PS
no
119
run
. N
osLO
CAT
ION
TIM
EO
BSER
VATI
ON
C
OD
ETO
TAL
REM
ARK
S�
14
57
014
20
UTM
157
609
007
:55
PO
S1
248
P
48P
UTM
-08
:22
MP
T_s
2
34
648
P7
01
-
197
UTM
157
56
1008
:28
PO
S1
44
748
P7
008
45
UTM
157
52
21
09:0
0P
OS
1
54
848
P7
004
73
UTM
157
491
209
:35
PO
S1
64
948
P7
0007
3U
TM15
74
802
10:0
2H
SP
_c1
75
048
P6
998
21
UTM
157
45
1910
:28
PO
S_H
1 18
51
48P
699
66
9U
TM15
74
119
11:0
3P
OD
_H2
poa
cher
s ca
rry
ing
on
e A
K-
-47
an
d o
ne
dea
d p
ang
olin
esc
aped
->
95
248
P6
994
58
UTM
157
36
38
11:4
2P
OS
1
105
348
P6
994
51
UTM
157
36
42
13:1
8P
OS
1 1
En
d o
f br
eak
1148
P6
9917
2U
TM15
73
415
13:3
6B
SB
_s
1248
P6
9917
2U
TM15
73
415
13:3
6W
PG
_s2
Abo
ut
200
m n
orth
1348
P6
9891
5U
TM15
73
27
514
:00
PO
S1
1448
P6
986
05U
TM15
73
103
14:1
81
PO
S1
Sta
rt o
f am
bush
– w
e he
ard
som
e n
oise
an
d d
ecid
ed t
o hi
de
and
->
1548
P6
986
14U
TM15
73
109
15:5
5P
OS
1E
nd
of
ambu
sh
1648
P6
984
96U
TM15
72
87
616
:10
PO
S1
17
Way
-p
oin
t
54
55
56
57
58
59
60
48P
698
401
UTM
157
26
67
16:3
5P
OS
1E
nd
of
patr
ol d
ay
GR
OU
ND
PA
TR
OL
DA
TA
SH
EE
T
VIR
AC
HE
Y N
AT
IO
NA
L P
AR
K
star
t of
pat
rol
No
GP
S s
ign
al
Sta
rt o
f lu
nch
bre
ak
2 w
ire
snar
es c
olle
cted
38

Exam
ple
of fro
nt a
nd b
ack p
age o
f a d
eta
iled d
ata
sheet fo
r the re
cord
ing o
f illegal a
ctiv
ities
Detailed Illegal A
ctivity Data Sheet V
irachey National P
ark
From p
atrol data sheet
this may ap
ply to all record
ings on this p
age
Poaching
Hunting
Fishing
Plant harvesting
Eaglew
ood
Fruit tree
Malva tree
Raisin tree
Rattan
Log
ging
Logg
ing p
ond
Logg
ing road
Saw
mill
D
1= d
iameter at b
ase D2 =
diam
eter at top of log
Encroachm
ent
Cultivation
M
ining
Road
Sw
idd
en
Trespassing
cautioned
local resid
ent
Khmer
*
Cam
bod
ian
Taken to p
olice
w
arning
letter issued to
minority
Brao
*Lao
_________________
non-reoffence contract
local authority
police
Charay
*V
ietnamese
_________________
fined
m
ilitary
Kavet
_________________
arrested
outsid
er*
military p
olice
Kreung
_________________
seen, not caught
forestry officer
Tam
peon
_________________
numb
er of weap
ons/items confiscated
seen
list weap
ons and serial num
bers
species
code
N
o
Live
Dead
Part
________________
___________________ __
________________
___________________ __
________________
_____________________
direct evid
ence
numb
er of peop
le
numb
er of houses
leng
th/wid
th (m)
______ size (m
²)
______
Num
ber of p
eople
AK-47
flash light
arrow
gem
s
automatic w
eapon
gun hom
e-mad
e
axe
(short/long hand
le)
hand
grenad
e hom
e-mad
e
b
oat
knife
b
oat engine
M16
bow
machete
bullet
M
alva nuts (ripe/unrip
e) kg
bullet case
mine
cag
e for wild
life
p
oison
cartrid
ge
rice kg
chain saw
scrap
metal
CKC
spear
Eag
lewood
turtle hook
electric rod
wire snare
fishing net
w
ire tiger snare
Nam
e of village
_______________________
_______________________
_______________________
_______________________
_______________________
Species
N
o
length
D1
D
2
______
____________________________
________________________________________________________
______
______
______ ______ ______ ______ ______ ______ ______ ______ ______ ______ ______ ______ ______ ______
______
______
______ Stum
ps
no.
Ø
______
numb
er of shoots
numb
er of trees felled
num
ber of log
s
num
ber of saw
mills
numb
er of stump
s
Kg
of harvest
leng
th/wid
th of road
size of pond
(m²)
_____________________
animals confiscated
For mining, list typ
e (gold, g
em stone,
metal) and
notes here:
Date
Team
Num
ber
Run N
o.W
aypoint
numb
er48P
UTM
Time
Ob
servation C
ode
39

Fr
om p
atro
l dat
a sh
eet
Poac
hing
H
untin
g
Fi
shin
g
Plan
t har
vest
ing
Ea
glew
ood
Frui
t tre
e
M
alva
tree
Rais
in tr
ee
Ra
ttan
Logs
Log
pond
s
Lo
ggin
g ro
ad
Saw
mill
D1=
dia
met
er a
t bas
e D
2 =
dia
met
er a
t top
of l
og
Encr
oach
men
t
Cu
ltiva
tion
Min
ing
Road
Swid
den
Tres
pass
ing
M
ark
circ
les
with
a ti
ck
w
rite
num
bers
in s
quar
e bo
xes
'ani
mal
' tre
egu
n sh
ot h
eard
bulle
tfo
otpr
int (
hum
an)
cam
ptu
rtle
hoo
ks
ca
rtrid
ges
wire
sna
re h
ole
dog
foot
prin
tw
ire ti
ger s
nare
fishi
ng n
et
sign
spec
ies
code
No
ca
use
of d
eath
____
____
____
____
___
____
____
____
____
____
____
_ _
____
____
____
____
___
____
____
____
____
____
____
_ _
____
____
____
____
___
____
____
____
____
____
____
__
____
____
____
____
___
____
____
____
____
____
____
__
note
s:
num
ber o
f sho
ots
num
ber o
f tre
es fe
lled
num
ber o
f log
s
nu
mbe
r of s
awm
ills
num
ber o
f stu
mps
Kg o
f har
vest
leng
th/w
idth
of r
oad
____
____
__ si
ze o
f pon
d (m
²)__
____
____
__
Spec
ies
N
o
leng
th
D1
D
2
__
____
____
____
____
____
____
____
____
____
____
____
____
____
____
____
____
____
____
____
____
____
____
____
__
____
____
____
____
____
____
____
__
____
__
__
____
____
__
__
____
____
__
__
____
____
__
__
____
____
__
__
____
____
__
Stum
ps n
o.
Ø
____
____
____
____
__
For
min
ing,
list
type
(gol
d, g
em s
tone
, m
etal
) and
not
es h
ere:
nu
mbe
r of p
eopl
e
num
ber o
f hou
ses
leng
th/w
idth
(m)
size
(m²)
DE
TAIL
ED
ILL
EG
AL
AC
TIV
ITY
DA
TA S
HE
ET
VIR
AC
HE
Y N
AT
ION
AL
PA
RK
Dat
eTe
am
Num
ber
Run
No.
Way
poin
t nu
mbe
r48
PU
TMTi
me
Obs
erva
tion
Code
40

APPENDIX 5: Instructions for filling in the patrol data sheet
VIRACHEY NATIONAL PARK
Ranger-Based Data Collection (RBDC)
Instructions for Filling in the Patrol Data Sheet
Before the start of a patrol
• Take enough patrol data sheets (twice the number of planned patrol days).
• Keep patrol data sheets (and maps and other important documents) in a “Clear Plastic Bag”.
• Always carry spare pens, pencils and batteries when on patrol.
• Ensure that the GPS unit is correctly setup and that all previous waypoints and tracks have been
saved to a computer and have been deleted from the GPS, according to the VNP GPS instructions.
Filling in the patrol data sheet
1. To be filled in before the start of each patrol or each day of a multi-day patrol:
A new patrol data sheet must be used for each day of patrol. More than one sheet can be used in one
day. Before the start of each day's patrol, fill in the patrol data sheet header information:
2. Recording of observations (patrol data sheet entries):
When the patrol starts fill in the first row of the patrol data sheet (see instructions below) and write
‘position’ under OBSERVATION CODE and ‘start’ under REMARKS.
NB: The vehicle drive or boat ride to the drop-off point (and back to the base) is not part of a foot patrol,
and must not be recorded on the patrol data sheets as part of the patrol. If you encounter an observa-
tion on the way to the start of the patrol, e.g. an illegal activity, record this on the patrol data sheet but do
not give it a running number [RUN No].
For each observation (illegal activities, wildlife, physical features or degraded areas) a waypoint must be
taken, and a running number [RUN No], WAYPOINT number, LOCATION, TIME, OBSERVATION CODE,
and TOTAL must be entered onto the patrol data sheet. For specific observation REMARKS must be
entered as well. Each line on the patrol data sheet represents one data entry:
Date day/month/year
Ranger Station Siem Pang, Veunsai, Taveng, Dragon Tail
Type of patrol Foot patrol, Vehicle patrol, Water patrol
GPS no BPAMP inventory number
Day .. of patrol .. days More than one sheet might be filled in per day
Page no Sequential page number, starting with page 1 for the first day of the patrol
Names Team number, Team Leader, GPS User, Team members (data sheet back side)
Run. Nos: Each observation (=row) gets its own number starting from 1. For each patrol day of a multi-day patrol the
‘run. Nos’ starts with 1. If several observations are made from one point (e.g. elephants ahead of patrol
and gibbons to the right), each gets its own number and waypoint. NB a waypoint has to be recorded for
each observation (row)!
Waypoint - Location - Time: all data are to be copied from the GPS display. TIME must be in 24 hour format.
Observation Code: A list of observations and additional codes which should be recorded is shown in the boxes
at the bottom of the data sheet. NB use only the codes listed on the data sheet.
Total: For mammals, birds and reptiles this is the number of individuals seen or the number of individuals
deduced from signs. For illegal activities always enter 1 under total; each illegal activity is recorded as
one encounter or incident. Details such as number of poachers etc. are written under REMARKS.
NB there must be a total for every observation; the total for illegal activities is always 1.
Remarks: See detailed description below.
41

Specific instructions for recording - POSITION:
All patrols must make at least one data entry with a GPS reading every 30 minutes. If a patrol does not
make any observation for about 30 minutes take a waypoint, record location (run. Nos, waypoint, UTM
and time only) and write 'position' under observation. TOTAL is 1 for all ‘position’ entries.
NB: Frequent recording of positions is very important in order to get a good idea of the course and length of
the path followed by the patrol because: (1) calculation and display of the areas covered by the patrols will
be more accurate and (2) calculation of indices such as elephants per kilometre or snares per kilometre can
only be made if the distances covered by the patrols can be calculated as accurately as possible.
Specific instructions for recording - NO GPS READING:
If you want to record an observation but cannot get a GPS reading due to poor satellite cover or dense
canopy do the following:
(1) record the observation and time only – fill in ‘Run. No’, Time, Observation Code, Total and - if required
- Remarks
(2) continue the patrol and take a GPS reading as soon as the openness of the canopy allows it and
enter this waypoint as a position
Specific instructions for recording - START:
• Start of a patrol Running number [RUN No] is 1. Record waypoint, time and UTM co-ordinates in the first
row of the patrol data sheet, write ‘position’ under observation code, and ‘start of patrol’ under remarks.
• Start of a new day of a multi-day patrol Use a new patrol data sheet. RUN No is 1. Record waypoint,
time and UTM co-ordinates in the first row of the new patrol data sheet, write ‘position’ under obser-
vation code, and ‘start day #’ under remarks.
• Start of an activity such as ambush, observation post or listening post. Record waypoint, time and
UTM co-ordinates, write ‘position’ in the observation code, and describe the activity under remarks.
• Start of a rest period or meal break Record waypoint, time and UTM co-ordinates, write ‘position’ in
the observation code, and describe the type of break (e.g. lunch or rest) under remarks.
Specific instructions for recording - END:
• End of a patrol Record waypoint, time and UTM co-ordinates in the row after the last observation,
write ‘position’ in the observation code, and 'end of patrol' under remarks.
• End of a day of a multi-day patrol, going into night camp or outpost Record waypoint, time and UTM
co-ordinates, write ‘position’ in the observation code, and ‘end day #’ under remarks.
• End of an activity such as ambush, observation post or listening post. Record waypoint, time and
UTM co-ordinates, write ‘position’ in the observation code, and ‘end of activity’ under remarks.
• End of a rest period or meal break Record waypoint, time and UTM co-ordinates, write ‘position’ in
the observation code, and type of break (e.g. 'lunch' or 'rest') under remarks.
NB at the start and end of each patrol day a GPS reading must be taken, and entered on the patrol data
sheet.
3. Remarks:
Any additional information to complement the observation code must be written under remarks. Remarks
should be very detailed and should follow the instructions given in the REMARKS box at the bottom of
the back page of the patrol data sheet. Write remarks about:
• direct evidence of illegal activities (poaching, plant harvesting, encroachment, fire)
• signs of illegal activities (poaching, plant harvesting, encroachment, fire)
• degraded areas, giving the length and width of the area, and description of disturbances. Take a
track log around the area and write the name the track log is saved as in the remarks column.
• salient physical features
• any other remarks of relevance to park management
42

REMEMBER
• Read the WAYPOINT number, LOCATION (UTM) and TIME using the GPS.
o Do NOT change the Waypoint number. Use the number generated by the GPS.
o Do NOT change the symbol of a Waypoint. The Waypoint symbol must be the default symbol.
o Do NOT change the GPS settings.
o Waypoints stored in the GPS must match the UTM locations entered onto the patrol data sheet.
• Follow the instructions recording of patrol observations when recording an observation.
• Use only the OBSERVATION CODES listed in the boxes at the bottom of the patrol data sheet.
• For wildlife observations enter the number of individuals under TOTAL.
• For all other observations (illegal activities, physical features and degraded areas) and for 'position'
enter 1 under TOTAL.
• Take a waypoint at the start and end of each patrol day.
• Take a waypoint at the start and end of each stopping period such as ambush, lunch etc. (do not take
waypoints while stopped).
• Write detailed descriptions under REMARKS following the instructions given in the REMARKS box
at the bottom of the back page the patrol data sheet.
• Make a patrol data sheet entry at least once every 30 minutes while moving on patrol.
• If you cannot get a GPS reading due to poor satellite cover or dense canopy record the observation
and time only, continue the patrol and take a GPS reading as soon as the openness of the canopy
allows it and enter this waypoint as 'position'.
• Data from a GPS which is not set according to VNP GPS rules will be considered invalid, and the
rangers of that patrol will not be entitled to DSA.
• If waypoints are not taken every 30 minutes during the patrol rangers of that patrol will not be enti-
tled to DSA.
The RBDC instructions above are an
example for Virachey National Park how to fill
in the patrol data sheet. Such an instruction
sheet will be given to rangers during the
RBDC training. The instructions shown above
should be used with minimum modifications
(e.g. name of ranger stations) for all protected
areas in Cambodia.
NB section 2 - recording of observations -
cannot be changed.
43

APPENDIX 6: RBDC field instructions
The brief field instructions shown above should be laminated and carried by each patrol.
Please note that the month and year when the last changes were made must be shown on the brief field
instructions, and on the flow charts and patrol data sheet(s). This ensures that only the most recent patrol
data sheet(s) and instructions are used.
Before starting a patrol
- Ensure that the GPS unit is set up correctly and thatwaypoints and tracks have been downloaded to acomputer and deleted from the GPS.
- Take spare batteries and enough patrol data sheetsfor the intended duration of the patrol.
At the beginning of each patrol day
- Fill in DATE, RANGER STATION, TYPE OF PATROL, GPSNO, DAY … OF PATROL, PAGE NUMBER and NAMES ofpatrol members on back page
- Take GPS reading (waypoint) LOCATION and TIME atstart of patrol (write position under OBSERVATIONcode and start under REMARKS; first line; run. Nos= 1)
When recording an observation
- allocate a RUNNING NUMBER and take a WAY-POINT foreach observation - even if several are made at thesame point !
- use GPS to get WAY-POINT, LOCATION and TIME
- use only codes listed on the patrol data sheet
- there must be a total (number) for each observation.For animals record the total number seen or numberof individuals deducted from signs. For illegal activitiesalways enter 1 under total. The number of trees felled,of poachers, of snares etc. will be recorded underREMARKS. For Position always enter 1 under total.
- add a 1- or 2-letter code (as shown on the datasheet) when recording illegal activities, animal calls,footprints, droppings, etc. – record only freshfootprints, droppings and scratches (from today)
- if a data sheet is full, use a new sheet, fill in DATE ofpatrol and PAGE NUMBER (bottom right)
At the end of the patrol or at night camp
- take a GPS reading and record LOCATION and TIME
(write position under OBSERVATION and end ornight camp under REMARKS)
Important
- if you cannot get a GPS reading record observationand time only (fill in run Nos, Total and Remarks) –continue patrol and take a GPS reading as soon asthe openness of the canopy allows it
- if you have not recorded any observation forabout 30 minutes, take a GPS reading, fill in run.Nos, LOCATION and write position underOBSERVATION
- at the beginning of any period when the patrol stops,take a waypoint and write position underOBSERVATION and write start of ambush, rest, lunchbreak etc. under REMARKS. When resuming thepatrol again take a waypoint, write position underOBSERVATION, and end of ambush etc. underREMARKS.
Remarks
write remarks about
- direct evidence of illegal activities (i.e. when youarrest somebody)
- signs of illegal activities
- carcasses of poached animals found
- degraded areas
- salient physical features
- anything else of relevance you observe
follow instructions at the bottom of the back page
- for more remarks use back of sheet; copy therelated running number (run. Nos)
animals more than 100 m away:
- if you see animals which are more than 100 metresaway record DIRECTION (compass) and DISTANCE(estimate) and number of young (Only very youngoffspring are considered as YOUNG) under remarks
05/2006
BRIEF INSTRUCTIONS FOR FILLING IN THE
VIRACHEY NATIONAL PARK PATROL DATA SHEET
44

APPENDIX 7: GPS set up
1) Batteries in
2) Satellite page:
• USE WITH GPS OFF
3) Track Log Set-up page:
• RECORDING METHOD = AUTO
• INTERVAL = NORMAL
4) System Set-up page:
• GPS = NORMAL
• WAAS = DISABLED
• BATTERY TYPE = ALKALINE
• TEXT LANGUAGE = ENGLISH
• EXTERNAL POWER LOST = TURN OFF
5) Time Set-up page:
• TIME FORMAT = 24 HOUR
• TIME ZONE = BANGKOK
Topographic maps in Cambodia use two different map datums: INDIAN 1954 and INDIAN 1960. The
old 1:50,000 scale topographic maps are based on the INDIAN 1960, the newer 1:100,000 scale
maps on the INDIAN 1954 datum.
By default, each Garmin GPS unit is set to WGS84 datum, which is about 500m different to the Indian
datums. The GPS units map datum setting must therefore be changed to accurately show positions
in Cambodia. Garmin supports the INDIAN THAILAND datum which is close to, but not exactly the
same as INDIAN 1954 or 1960. For the most accurate setting use a USER datum as described
below.
6) Units Set-up page:
• POSITION FORMAT = UTM UPS
• MAP DATUM = USER
DX: +198m
DY: +881m
DZ: +317m
DA: +861m
DF: +0.28361370
• DISTANCE SPEED = METRIC
• ELEVATION VS = METRIC
• DEPTH = METRIC
• TEMPERATURE = CELCIUS
7) Interface Set-up page:
• USB (GARMIN DATA F) = NOT CONNECTED
• SERIAL DATA FORMAT = GARMIN
8) Waypoint symbol:
• Waypoint symbol must be set to
• Do not change the waypoint symbol
NB: all other settings are the Garmin default setting
Important
Always store GPS receivers with
a full set of alkaline batteries
inside!
Do not wear the GPS with a belt
clip on your belt
Use the set-up which follows the
example given for the GARMIN
GPS 60C in appendix 7
45

Set up of Garmin GPSMAP 60C for use in Cambodia
1. Press twice to view the MAIN MENU.
2. Navigate the MAIN MENU using highlight SETUP MENU and press
MENU
ENTERM
M
ENTER
and
change
as
shown
on the
right
ENTER
and change as
shown belowENTER
USER DATUM
DX:
+198m
DY:
+881m
DZ:
+317m
DA:
+861m
DF:
+0.28361370
SAVE
46
• Change to
USER
• Fill in DX,
DY, DZ, DA
and DF
• then SAVE

APPENDIX 8: Glossary
Bias: Inaccuracies or irregularities in the collection, analysis, or interpretation of data which may cause
distortion of the research results; can be caused by intended or unintended subjective choices or per-
ceptions.
Data: Data are facts which have been recorded.
Database query: A database query is the process of requesting data from the database and receiving
the results.
Geographic information system (GIS): A computerised database management system used for the
capture, conversion, storage, retrieval, analysis, and display of spatial data.
Geo-referenced: Data which are connected to a specific location on the earth's surface.
Index (plural Indices): Indices are statistical measures of change.
Information: Information is processed data.
Map datum: A datum is used to describe the actual shape of the earth in mathematical terms. Datums
were developed to accurately map topographic differences in the earth's surface based on an ellipsoid
(because the earth's surface is not perfectly round). A datum is a set of parameters defining a coordi-
nate system, and a set of control points whose geometric relationships are known, either through meas-
urement or calculation.
Meta database: A database containing meta-data. Meta-data are data about data. They describe char-
acteristics such as the content, quality and condition of the data.
Monitoring: Intermittent (regular of irregular) surveillance carried out in order to ascertain the extent of
compliance with a predetermined standard or the degree of deviation from the expected norm.
Monitoring tells us how something(s) is/are changing, it is repeated at regular intervals, it is dynamic in
philosophy and purpose oriented.
Nomenclature: Nomenclature is a system of assigning (unique) names.
Objectives: Objectives describe expected results of implementing a plan. They are described in meas-
urable terms and indicate a specific period of time during which these results will be achieved.
Opportunistic: Opportunistic refers to the recording of incidents/observations as and when encountered
in contrast to systematic sampling.
Random: A sample is a subset of a larger population. A random sample is one chosen by a method
involving a random (i.e. unpredictable) component.
SQL: Structured Query Language is a standard interactive and programming language for getting infor-
mation from and updating a database.
Stratum (plural strata): A sub-division of a (sample) area defined by a characteristic.
Surveillance: Surveillance is an extended programme of surveys, undertaken in order to provide a time
series, to ascertain the variability and/or range of states or values which might be encountered over time.
Survey: A survey is an exercise in which a set of qualitative or quantitative observations are made, usu-
ally by means of a standardised procedure; it is an inventory, it is static in its background philosophy and
it is usually done once only.
Systematic: Systematic sciences follow logical, consistent and ordered methods.
47

Project Liaison Office
Biodiversity and Protected Areas Management Project (BPAMP)
Department of Nature Conservation and Protection
Ministry of Environment
#48, Samdech Preah Sihanouk, Tonle Bassac, Chamkarmon,
Phnom Penh, Cambodia
Tel/Fax: (855)-23-213900
E-mail: [email protected]
Virachey National Park Headquarters in Banlung District, Ratanakiri Province
Tel: (855)-75-974176/974013
E-mail: [email protected]
