range environmental vulnerability assessment ….. periodic ... · marine corps installations...
TRANSCRIPT
…..
Marine Corps Installations Command
FINAL
Range Environmental Vulnerability AssessmentPeriodic Review ReportMarine Corps Air Ground Combat Center Twentynine Palms, California
April 2016
FINAL
REVA Periodic R
eview R
eportM
arine Corps A
ir Ground C
ombat C
enter Tw
entyninePalm
s, California
April
2016
Imagine the result
Marine Corps Installations Command MCICOM (GF-5) 3000 Marine Corps Pentagon, Room 2D153 Washington, DC 20350
Range Environmental Vulnerability Assessment Periodic Review Marine Corps Air Ground Combat Center Twentynine Palms, California
April 2016
UNCLASSIFIED - DISTRIBUTION STATEMENT A. Approved for public release, distribution is unlimited.

Marine Corps Installations Command REVA Periodic Review MCAGCC Twentynine Palms
i
Table of Contents
Table of Contents ii
Executive Summary vii
1. Introduction 1-1
1.1 Purpose 1-1
1.2 Scope and Applicability 1-1
1.3 Installation Overview 1-2
1.4 Summary of Areas Addressed in the Periodic Review 1-5
2. Assessment Methods and Results 2-1
2.1 Estimated Munitions Constituents Loading 2-1
2.1.1 Munitions Constituents Loading Approach 2-1
2.1.2 Munitions Constituents Loading Assumptions 2-3
2.1.3 Operational Range Clearance 2-4
2.2 Conceptual Site Model 2-7
2.2.1 Potential Pathways 2-7
2.2.1.1 Surface Water and Sediments 2-8
2.2.1.2 Groundwater 2-13
2.2.2 Potential Receptors 2-17
2.3 Screening-Level Assessment Results 2-18
2.3.1 Surface Water Screening-Level Results 2-19
2.3.2 Sediment Screening-Level Results 2-27
2.3.3 Groundwater Screening-Level Results 2-31
2.4 Lead Assessment Results 2-33
2.4.1 Munitions Constituents Loading Area Lead Deposition 2-33
2.4.2 Small Arms Range Assessment 2-35
2.5 Field Data Collection 2-39
2.5.1 Samples 2-39
2.5.2 Screening Criteria 2-39
2.5.3 Results 2-39
2.5.4 Summary 2-40
3. Findings and Conclusions 3-1
ii Marine Corps Installations Command REVA Periodic Review MCAGCC Twentynine Palms
Table of Contents
4. References 4-1
Tables
Table 2-1: Summary of Ranges Contributing to MC Loading Areas 2-2
Table 2-2: Estimated Annual MC Loading Rates 2-5
Table 2-3: Estimated Annual Lead Deposition 2-6
Table 2-4: Screening-Level Estimates of Annual Average MC Concentrations in Surface Water at the Identified Downstream Off-Range Receptor Locations 2-21
Table 2-5: Screening-Level Estimates of Cumulative MC Concentrations in Sediment at Playas 2-28
Table 2-6: Model Predicted Perchlorate Concentration Reaching the Water Table and the Model Predicted Travel Time for Perchlorate to Reach the Water Table 2-32
Table 2-7: Lead Deposition Associated with MC Loading Areas in Receptor Drainage Areas 2-33
Table 2-8: Summary of SARAP Results 2-36
Table 2-9: Summary of Sediment Samples 2-39
Table 2-10: Sediment Sample Results May 2015 2-41
Table 3-1: Summary of Results and Conclusions of the Hydrologic Subwatershed Areas where MC Loading Areas are Located 3-1
Figures
Figure 1-1: MCAGCC Twentynine Palms Operational Range Training Areas 1-3
Figure 1-2: MCAGCC Twentynine Palms Operational Ranges 1-7
Figure 1-3: MCAGCC Twentynine Palms MC Loading Areas and Small Arms Ranges 1-9
Figure 2-1: Graphical Conceptual Site Model of MCAGCC Twentynine Palms 2-9
Figure 2-2: MCAGCC Twentynine Palms Surface Water Features 2-11
Figure 2-3: MCAGCC Twentynine Palms Groundwater Features 2-15
Figure 2-4: Drainage Areas of Downstream Off-Range Surface Water Receptor Locations 2-23
Figure 2-5: Predicted Surface Water Concentration Detected at Off-Range Receptor Locations 2-25
Figure 2-6: Predicted Sediment Concentration Exceeding DoD Screening Value at Off-Range Receptor Locations 2-29
Figure 2-7 Small Arms Ranges at MCAGCC Twentynine Palms 2-37

Table of Contents
Appendices
A Operational Range Summary
B Screening-Level Analysis Parameters and Methodology
C Small Arms Range Assessment Protocol
Marine Corps Installations Command REVA Periodic Review MCAGCC Twentynine Palms
iii

Table of Contents
This page intentionally left blank
iv Marine Corps Installations Command REVA Periodic Review MCAGCC Twentynine Palms
Acronyms and Abbreviations
Acronym Definition µg/kg micrograms per kilogram µg/L micrograms per liter CSM conceptual site model CVOT Combat Vehicle Operator Training CY calendar year DoD Department of Defense DoDIC Department of Defense Identification Code DoN Department of the Navy EOD explosive ordnance disposal GIS geographic information system HE high explosive HMX cyclotetramethylene tetranitramine HQMC Headquarters Marine Corps in/yr inches per year ITX Integrated Training Exercise lb pounds lb/yr pounds per year m meters m2 square meters MC munitions constituents MCAGCC Marine Corps Air Ground Combat Center MCCS Marine Corps Community Service MDL method detection limit MEB Marine Expeditionary Brigade MFTL Mojave Fringe-Toed Lizard mg/kg millligrams per kilogram MOUT military operations in urban terrain MTU Marksmanship Training Unit NEW net explosive weight ORC Operational Range Clearance RDX cyclotrimethylene trinitramine REVA Range Environmental Vulnerability Assessment RFMSS Range Facility Management Support System RTA Range Training Area SAR small arms range SARAP Small Arms Range Assessment Protocol SSC Species of Special Concern TECOM Training and Education Command TOC total organic carbon TNT trinitrotoluene
Marine Corps Installations Command REVA Periodic Review MCAGCC Twentynine Palms
v
Acronyms and Abbreviations
Acronym Definition U.S. United States USFWS United States Fish and Wildlife Service UXO unexploded ordnance
vi Marine Corps Installations Command REVA Periodic Review MCAGCC Twentynine Palms
Executive Summary
The United States Marine Corps (Marine Corps) Range Environmental Vulnerability Assessment (REVA) program is a proactive and comprehensive program designed to support the Marine Corps’ Range Sustainment Program. This REVA Periodic Review for Marine Corps Air Ground Combat Center (MCAGCC) Twentynine Palms documents the assessment of munitions loading from 2011 to 2014.
The REVA periodic review installation data collection and site visit was conducted in September 2014; at that time, 25 operational range training areas (RTAs) and 46 operational ranges were identified. A total of 31 munition constituent (MC) loading areas were identified. Of these MC loading areas, surface water and sediment screening-level fate and transport assessments were conducted for 24 MC loading areas, while groundwater screening-level fate and transport assessment was conducted for 7 MC loading areas. Indicator MC were assessed, which include cyclotetramethylene tetranitramine (HMX), cyclotrimethylene trinitramine (RDX), trinitrotoluene (TNT), and perchlorate. Annual lead deposition in the MC loading areas was also estimated, and a total of 11 fixed ranges were qualitatively evaluated using the Small Arms Range Assessment Protocol (SARAP).
The results of the screening-level analyses predicted MC concentrations in surface water significantly lower than the DoD screening values for applicable receptors. Assessment of sediment at Quackenbush Lake playa predicted HMX, RDX, and TNT at concentrations above the applicable lower bound Department of Defense (DoD) screening values. HMX was also predicted to be accumulating at Lavic Lake playa above the applicable lower bound DoD screening value, while TNT was predicted to be accumulating at Deadman Lake and Lavic Lake playas above the applicable lower bound DoD screening value. Perchlorate concentrations in sediment accumulating in all assessed playas were predicted to be above the median method detection limit (MDL); there is no applicable DoD sediment screening benchmark. No MC were predicted to reach groundwater at levels above median MDLs with the exception of perchlorate; regardless, perchlorate was not predicted to exceed the applicable California drinking water benchmark. Significant lead deposition associated with HE ranges was predicted to occur in the area draining to Deadman Lake playa. The SARAPs indicated a low-moderate probability for migration of lead from small arms ranges to off-range areas.
To address findings from the sediment screening-level assessment and lead deposition screening, limited field data collection was performed at MCAGCC Twentynine Palms in May 2015, involving composite sediment sampling at the Deadman Lake, Quackenbush Lake, and Mesquite Lake playas. No explosives were detected in the collected samples; perchlorate was only found at a reference location in Mesquite Lake playa. Lead was detected in samples collected from Deadman Lake playa; however, all concentrations were below the applicable DoD ecological freshwater sediment screening value.
The quantitative, qualitative, and field assessments of surface water, sediment, and groundwater did not indicate significant releases of MC from operational RTAs or ranges at MCAGCC Twentynine Palms. It is recommended that an evaluation of all operational range areas be conducted in the next periodic review cycle, or sooner if significant changes at the installation warrant reevaluation.
Marine Corps Installations Command REVA Periodic Review MCAGCC Twentynine Palms
vii

Executive Summary
This page intentionally left blank
viii Marine Corps Installations Command REVA Periodic Review MCAGCC Twentynine Palms
Marine Corps Installations Command REVA Periodic Review MCAGCC Twentynine Palms
1-1
Section 1 Introduction
1. Introduction
1.1 Purpose
The United States (U.S.) Marine Corps (Marine Corps) Range Environmental Vulnerability Assessment
(REVA) program meets the requirements of the Department of Defense (DoD) Instruction 4715.14
Operational Range Assessments.
The REVA program is a proactive and comprehensive program designed to support the Marine Corps’
Range Sustainment Program. Operational ranges across the Marine Corps are being assessed to
determine whether a release or substantial threat of a release of munitions constituents (MC) from
operational ranges to off-range areas creates an unacceptable risk to human health or the environment.
This is accomplished through assessments of operational range areas and periodic five-year review
assessments and, where applicable, the use of fate and transport modeling and analysis of the REVA
indicator MC based on site-specific environmental conditions at the operational ranges and training areas.
This report presents the periodic review assessment for Marine Corps Air Ground Combat Center
(MCAGCC) Twentynine Palms, located in Southern California. For the purposes of this report, the name
“MCAGCC Twentynine Palms” will be used to reference any and all training conducted at the installation.
This report documents the review of munitions loading from 2011 through 2014, referred to as the periodic
review period. The results of the prior REVA assessments are provided in the Final Range Environmental Vulnerability Assessment, Marine Corps Air Ground Combat Center Twentynine Palms and the Range Environmental Vulnerability Assessment Five Year Review, Marine Corps Air Ground Combat Center Twentynine Palms (Malcolm Pirnie 2007; ARCADIS / Malcolm Pirnie 2012).
1.2 Scope and Applicability
The scope of the REVA program includes Marine Corps operational ranges located within the United States
and overseas. Operational ranges (as defined in 10 United States Code 101 (e)(3)) include, but are not
limited to, fixed ranges, live-fire maneuver areas, small arms ranges (SARs), buffer areas, and training
areas where military munitions are known or suspected currently to be or historically to have been used.
The indicator MC evaluated in the REVA program include cyclotetramethylene tetranitramine (HMX),
cyclotrimethylene trinitramine (RDX), trinitrotoluene (TNT), perchlorate, and lead. Studies have shown that
HMX, RDX, and TNT are detected in a high percentage of samples containing MC because they are
common high explosives (HEs) used in a wide variety of military munitions and because of their chemical
stability within the environment. Perchlorate is a component of the solid propellants used in some military
munitions. Perchlorate also is considered an indicator MC because its high solubility, low sorption potential,
and low natural degradation rate make the compound highly mobile in the environment. Lead is the most
prevalent (by weight) potentially hazardous constituent in small arms ammunition and is used as an
indicator to identify potential impacts of training related to small arms usage. Additional information
pertaining to the physical and chemical characteristics of the REVA indicator compounds is provided in the
REVA Reference Manual (Headquarters Marine Corps [HQMC] 2009).
1-2 Marine Corps Installations Command REVA Periodic Review MCAGCC Twentynine Palms
Section 1 Introduction
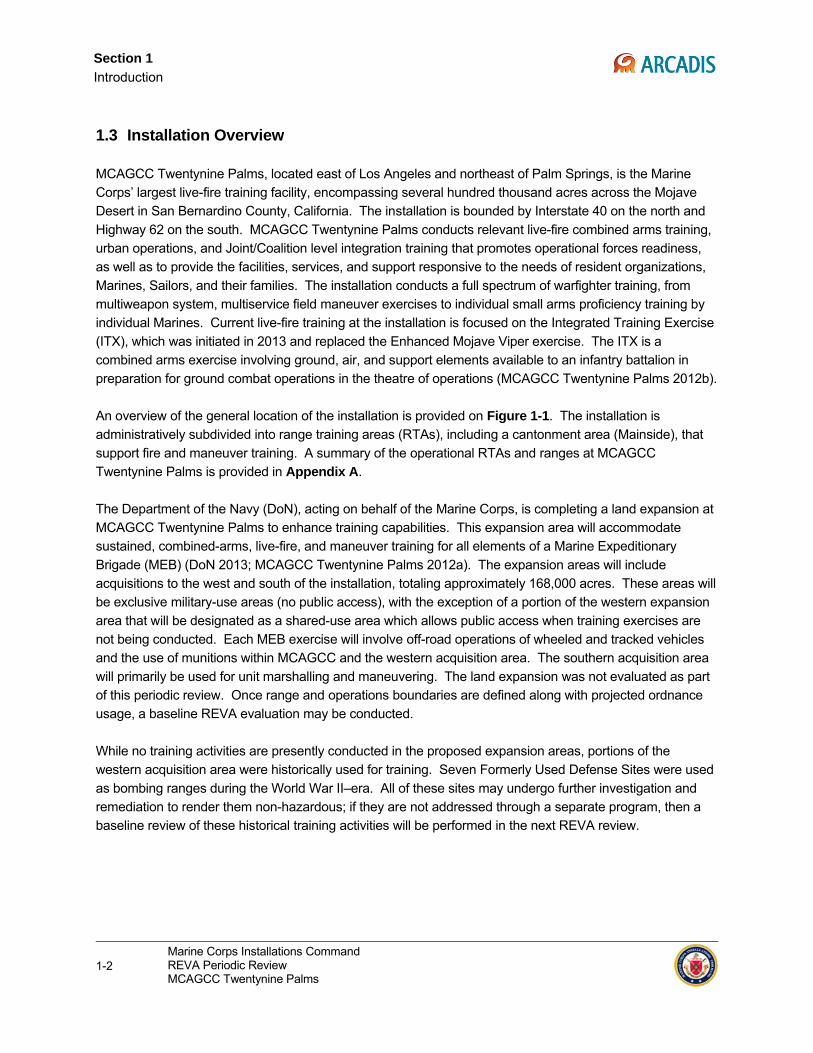
1.3 Installation Overview
MCAGCC Twentynine Palms, located east of Los Angeles and northeast of Palm Springs, is the Marine
Corps’ largest live-fire training facility, encompassing several hundred thousand acres across the Mojave
Desert in San Bernardino County, California. The installation is bounded by Interstate 40 on the north and
Highway 62 on the south. MCAGCC Twentynine Palms conducts relevant live-fire combined arms training,
urban operations, and Joint/Coalition level integration training that promotes operational forces readiness,
as well as to provide the facilities, services, and support responsive to the needs of resident organizations,
Marines, Sailors, and their families. The installation conducts a full spectrum of warfighter training, from
multiweapon system, multiservice field maneuver exercises to individual small arms proficiency training by
individual Marines. Current live-fire training at the installation is focused on the Integrated Training Exercise
(ITX), which was initiated in 2013 and replaced the Enhanced Mojave Viper exercise. The ITX is a
combined arms exercise involving ground, air, and support elements available to an infantry battalion in
preparation for ground combat operations in the theatre of operations (MCAGCC Twentynine Palms 2012b).
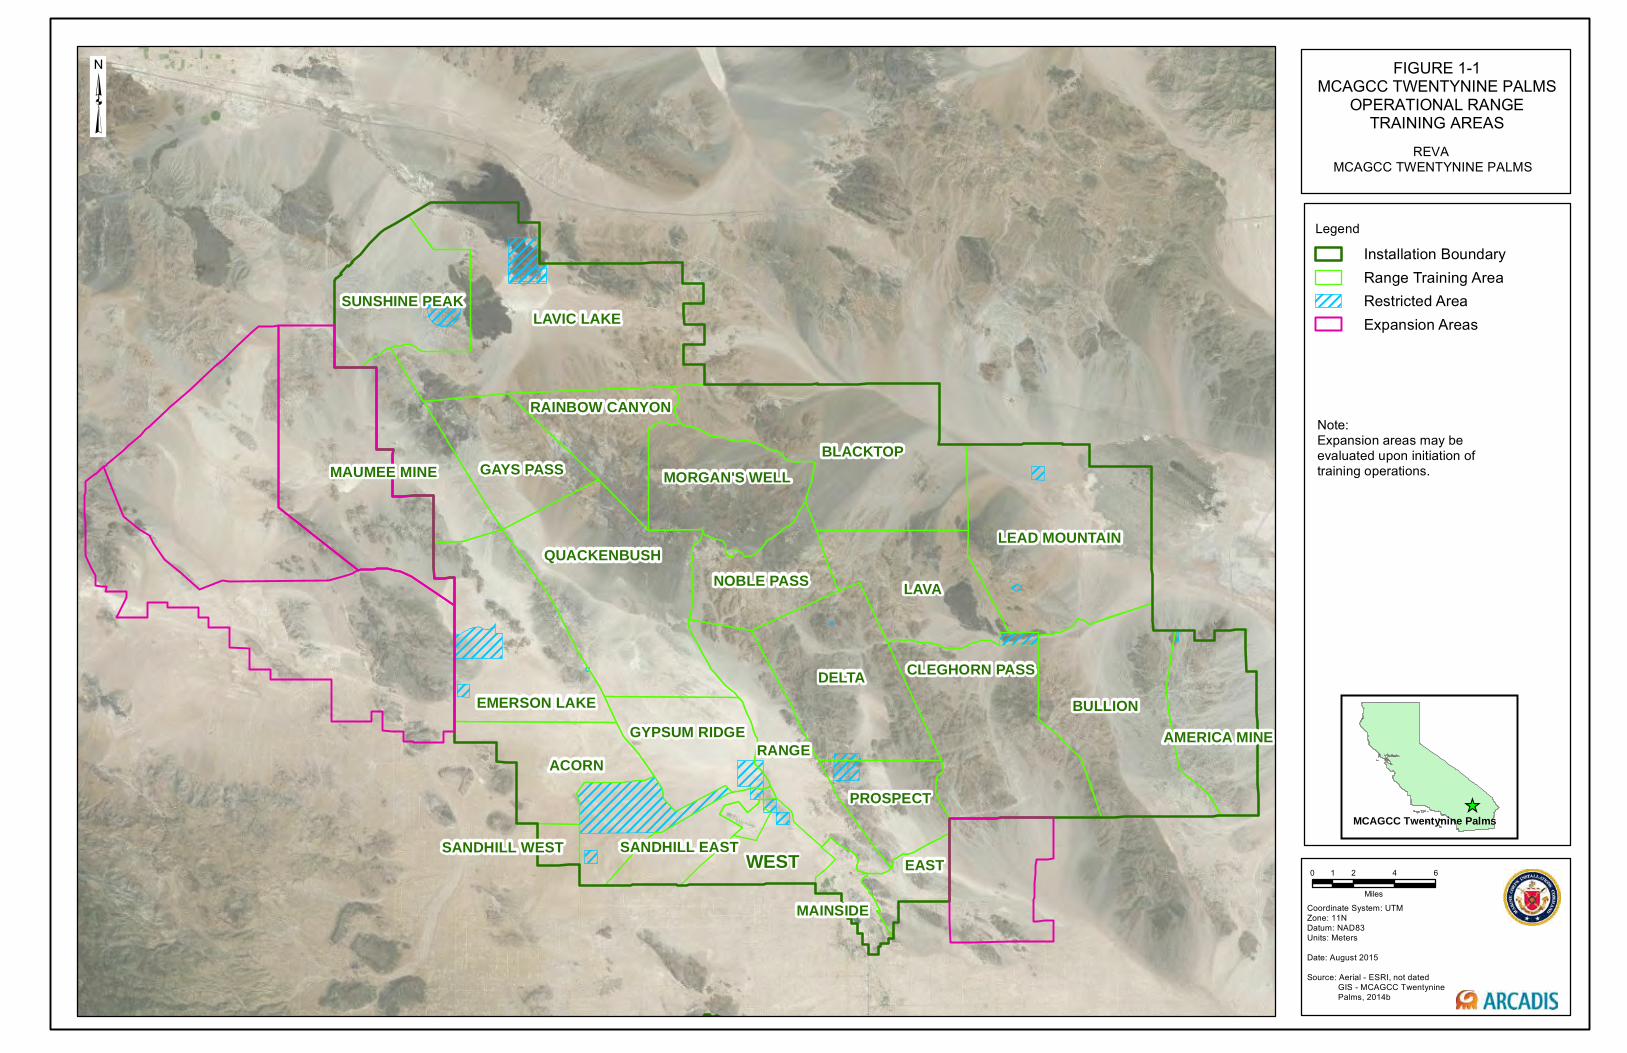
An overview of the general location of the installation is provided on Figure 1-1. The installation is
administratively subdivided into range training areas (RTAs), including a cantonment area (Mainside), that
support fire and maneuver training. A summary of the operational RTAs and ranges at MCAGCC
Twentynine Palms is provided in Appendix A.
The Department of the Navy (DoN), acting on behalf of the Marine Corps, is completing a land expansion at
MCAGCC Twentynine Palms to enhance training capabilities. This expansion area will accommodate
sustained, combined-arms, live-fire, and maneuver training for all elements of a Marine Expeditionary
Brigade (MEB) (DoN 2013; MCAGCC Twentynine Palms 2012a). The expansion areas will include
acquisitions to the west and south of the installation, totaling approximately 168,000 acres. These areas will
be exclusive military-use areas (no public access), with the exception of a portion of the western expansion
area that will be designated as a shared-use area which allows public access when training exercises are
not being conducted. Each MEB exercise will involve off-road operations of wheeled and tracked vehicles
and the use of munitions within MCAGCC and the western acquisition area. The southern acquisition area
will primarily be used for unit marshalling and maneuvering. The land expansion was not evaluated as part
of this periodic review. Once range and operations boundaries are defined along with projected ordnance
usage, a baseline REVA evaluation may be conducted.
While no training activities are presently conducted in the proposed expansion areas, portions of the
western acquisition area were historically used for training. Seven Formerly Used Defense Sites were used
as bombing ranges during the World War II–era. All of these sites may undergo further investigation and
remediation to render them non-hazardous; if they are not addressed through a separate program, then a
baseline review of these historical training activities will be performed in the next REVA review.
WEST
LAVIC LAKE
DELTA
LAVA
BLACKTOP
BULLION
LEAD MOUNTAINQUACKENBUSH
ACORN
CLEGHORN PASSEMERSON LAKE
GAYS PASS MORGAN'S WELL
SUNSHINE PEAK
NOBLE PASS
PROSPECT
GYPSUM RIDGE
EAST
RANGE AMERICA MINE
MAUMEE MINE
RAINBOW CANYON
SANDHILL EAST
MAINSIDE
SANDHILL WEST
Coordinate System: UTM Zone: 11NDatum: NAD83Units: Meters
Date: August 2015
Source: Aerial - ESRI, not dated GIS - MCAGCC Twentynine Palms, 2014b
MCAGCC Twentynine Palms
0 2 4 61
Miles
Legend
Installation BoundaryRange Training AreaRestricted AreaExpansion Areas
FIGURE 1-1MCAGCC TWENTYNINE PALMS
OPERATIONAL RANGETRAINING AREAS
REVA MCAGCC TWENTYNINE PALMS
Note: Expansion areas may beevaluated upon initiation of training operations.
Marine Corps Installations Command REVA Periodic Review MCAGCC Twentynine Palms
1-5
Section 1 Introduction
1.4 Summary of Areas Addressed in the Periodic Review
In September 2014, the REVA team conducted a periodic review site visit at MCAGCC Twentynine Palms
and identified 25 operational RTAs and 46 operational ranges. The operational RTAs and ranges are
shown on Figure 1-1 and Figure 1-2, respectively. Eighteen RTAs at MCAGCC Twentynine Palms are
authorized for live-fire training and use conventional air and ground munitions. These areas support large-
scale combined arms operations, including the ITX. According to the Standard Operating Procedures for
Range/RTA and Airspace (MCAGCC Twentynine Palms 2014a), all conventional munition expenditures
within the RTAs must be at least 1,000 meters from other scheduled RTA boundaries, the installation
boundary, and restricted area boundaries. In 2013, a new RTA (Morgan’s Well) was established in the
north-central portion of the installation, and the boundaries of five other RTAs were modified. Morgan’s Well
is a live-fire RTA that supports air-delivered ordnance as well as artillery training. Boundaries of Rainbow
Canyon, Noble Pass, and Blacktop RTAs shifted due to the establishment of Morgan’s Well RTA, and the
shared boundary between the Lead Mountain and Bullion RTAs was moved approximately 2 miles north.
The remaining seven RTAs, all located in the southwest section of the installation, are designated as non-
live-fire areas. Training activities in these RTAs consist mainly of non-live-fire maneuvering and may include
the use of blank ammunition, smoke grenades, simulators, and illumination rounds. In 2013, the Sandhill
RTA was split into two RTAs (Sandhill East and Sandhill West) due to an expansion of the adjacent
restricted area toward the installation boundary (MCAGCC Twentynine Palms 2014a).
The 46 operational ranges at MCAGCC Twentynine Palms are generally unchanged since the REVA five-
year review. Range 230, a military operations in urban terrain (MOUT) range, was identified during the site
visit as a new range but was not evaluated in this periodic review because it remains under construction and
has not yet been authorized for use. One new and currently active range (Range 705A) was identified
during the periodic review site visit completed in September 2014. Range 705A is a combat vehicle
operator training (CVOT) course established within the West and Mainside RTAs. Since no military
munitions are authorized for use on this range, it was not evaluated as part of this periodic review.
Since the REVA five-year review, the installation has focused on adding or changing capabilities at existing
ranges in order to address current training requirements, rather than constructing new ranges. In line with
this approach, HESCO® barriers were added to the perimeter of the Range 051 demo pit to further enhance
fragmentation containment, and a new net explosive weight (NEW) limit of 2,000 pounds was also
established at this range. Similarly, new training capabilities and a higher NEW limit of 2,000 pounds (lb)
were added to Range 112 to accommodate required explosive ordnance disposal (EOD) training. Lastly,
sniper towers were constructed on Ranges 111 and 113 allowing snipers to engage targets at higher angles
and from several different shooting positions within and on top of the towers.
Eleven of the 46 operational ranges at MCAGCC Twentynine Palms are SARs. Six SARs are located within
the marksmanship training unit (MTU) range complex located within the Range RTA. Four SARs are
located outside of the MTU but still within the Range RTA. The skeet range, located within the Mainside
RTA, is evaluated in this periodic review as a SAR. In 2013, bullet traps were removed from Ranges 2 and
3 at the MTU range complex and replaced with earthen impact berms. MTU personnel stated that a liquid
1-6 Marine Corps Installations Command REVA Periodic Review MCAGCC Twentynine Palms
Section 1 Introduction
copolymer is regularly applied and maintained on the surface of all the earthen impact berms within the
MTU to minimize erosion. Range 106A, which is located in the Range RTA and was formerly used as a
grenade range, was converted to a machine gun certification range in 2012. As such, it was evaluated as a
SAR during this periodic review.
MC loading areas are identified in REVA to describe where the majority of MC are deposited during training
missions on a range or training area. These areas may encompass an entire range, target area, or a
portion of the range area. During this periodic review period, 31 MC loading areas were identified at
MCAGCC Twentynine Palms and are shown on Figure 1-3. The figure indicates whether the MC loading
areas were identified based on RTA boundary or the location of a range, target area, or portion of range.
The 11 SARs identified for qualitative evaluation are shown on Figure 1-3; further discussion of these range
evaluations is found in Section 2.4.

RANGE 106A
RANGE105
RANGE 215SKEET RANGE
RANGE 500
RANGE 112
RANGE 106
RANGE 705
RANGE 100
RANGE 705A
RANGE 630
RANGE 109
RANGE 220
RANGE 400
RANGE 102
RANGE 800
RANGE 410A
RANGE 107
RANGE 620
RANGE 601
RANGE 410
RANGE 110
RANGE 401
RANGE 108
RANGE 113
RANGE 205
RANGE 210
RANGE 215A
RANGE 114
RANGE 111
RANGE 200
RANGE 225
RANGE 230
RANGE 103RANGE 104
RANGE 110A
RANGE 700
RANGE 101
RANGE105A
RANGE 113A
FIGURE 1-2MCAGCC TWENTYNINE PALMS
OPERATIONAL RANGES
Coordinate System: UTM Zone: 11NDatum: NAD83Units: Meters
Date August 2015
Source: Aerial - ESRI GIS - MCAGCC Twentynine Palms, 2014b
MCAGCC Twentynine Palms
0 1 2 30.5
Miles
REVA MCAGCC TWENTYNINE PALMS
LegendInstallation BoundaryRange Training AreaRestricted Area
RANGE
DELTA
PROSPECT
WEST
MAINSIDE
BULLION
EASTEAST
CLEGHORN PASS
QUACKENBUSH
MORGAN'S WELL
RANGE 1ARANGE 1
RANGE 2ARANGE 3
RANGE 2RANGE 3A
RANGE 051

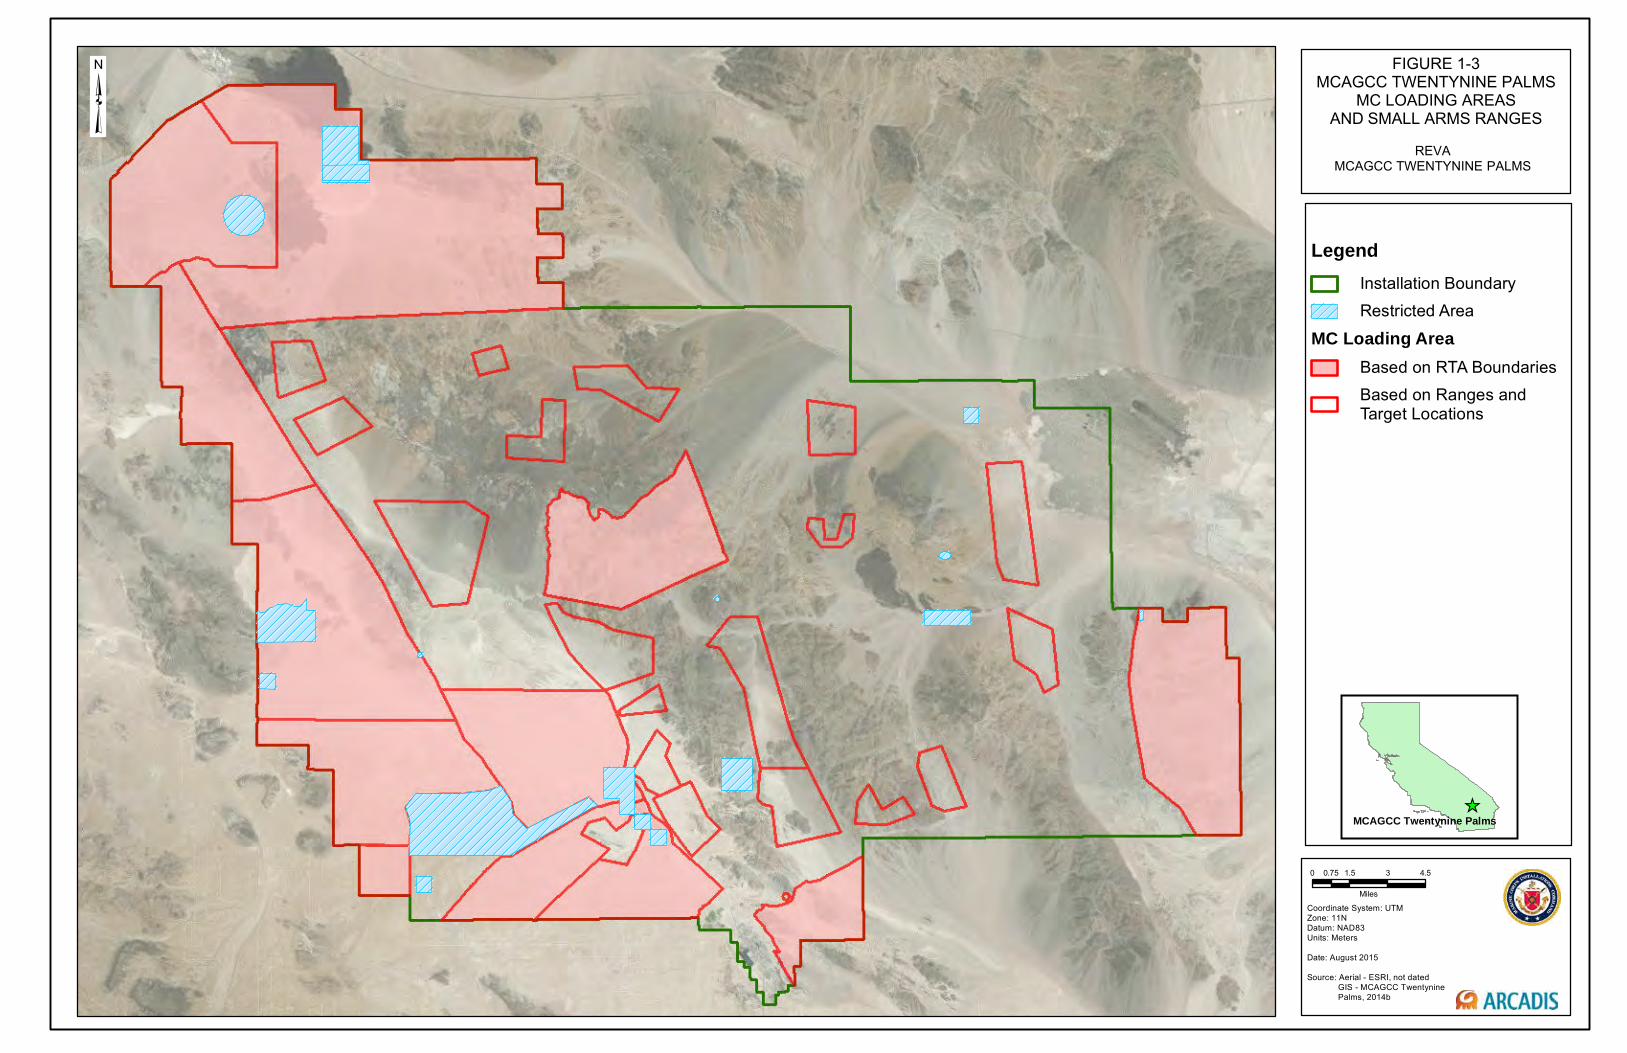
FIGURE 1-3MCAGCC TWENTYNINE PALMS
MC LOADING AREASAND SMALL ARMS RANGES
Coordinate System: UTM Zone: 11NDatum: NAD83Units: Meters
Date: August 2015
Source: Aerial - ESRI, not dated GIS - MCAGCC Twentynine Palms, 2014b
MCAGCC Twentynine Palms
0 1.5 3 4.50.75
Miles
REVAMCAGCC TWENTYNINE PALMS
LegendInstallation BoundaryRestricted Area
MC Loading AreaBased on RTA BoundariesBased on Ranges andTarget Locations
2. Assessment Methods and Results
MCAGCC Twentynine Palms was assessed qualitatively through the development of a site-specific conceptual site model (CSM) and quantitatively through screening-level transport assessments. This section contains discussions on the MC deposition estimates, the site-specific CSM, the screening-level modeling results, results of qualitative lead evaluations, and a summary of sampling results.
2.1 Estimated Munitions Constituents Loading
2.1.1 Munitions Constituents Loading Approach
The MC loading of HE and perchlorate was estimated based on mass-loading principles using military munitions expenditure data and dud / high order / low order detonation rates. Studies have shown that MC are deposited on the operational range through low and high order detonations and may leach from corroded unexploded ordnance (UXO). These processes are represented in the equation:
Total MC loading = MC (low orders) + MC (high orders) + MC (UXO)
Note: 1) MC (low orders) is the amount of MC deposited as a result of low order detonations. 2) MC (high orders) is the amount of MC deposited as a result of high order detonations. 3) MC (UXO) is the amount of MC deposited as a result of UXO with breached casings.
MC remaining from low order detonations are the most significant contributors to MC loading, but the REVA process accounts for MC contributed from all three of these potential sources. MC loading rates for low order detonations, high order detonations, and UXO were estimated for each MC loading area using the following equations:
MC (low order) = (number of military munitions expended) x (low order rate) x (amount of residual remaining from a low order detonation)
MC (high order) = (number of military munitions expended) x (high order rate) x (amount of residual remaining from a high order detonation)
MC (UXO) = (number of military munitions expended) x (dud rate) x (amount of residual exposed as a result of damage to UXO casing)
MC loading areas were defined based on known history and current training activities in order to estimate MC loading rates, which act as source terms in the screening-level models. These areas represent locations at which significant MC loading is occurring or suspected to have occurred from training with munitions containing HE (TNT, RDX, and HMX), illumination rounds, and/or other munitions containing solid propellants (perchlorate) and metals (lead). MC loading areas were adjusted for the periodic review to reflect updated information about locations of range facilities, known targets, surface danger zones, aerial imagery,
Marine Corps Installations Command REVA Periodic Review MCAGCC Twentynine Palms
2-1
Section 2
Assessment Methods and Results
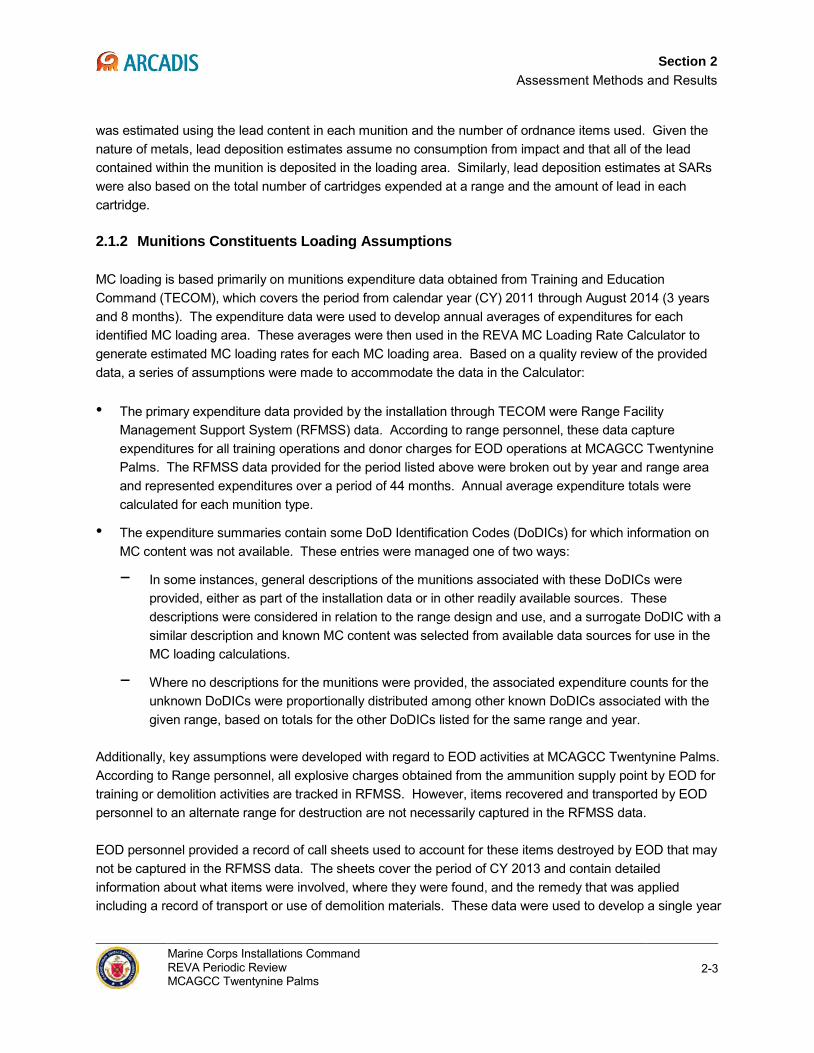
information from range personnel, visual notes from the site visit, and munitions data. Some MC loading areas account for expenditures from multiple ranges; a summary of MC loading areas and their contributing ranges is presented in Table 2-1. Training-specific information for some ranges and training areas indicated minimal use and/or use of munitions that result in negligible MC loading since the five-year review. Therefore, MC loading areas were not defined at these locations. MC loading is calculated using similar methods described in the REVA Five-Year Review Report and the REVA Five-Year Review Manual (ARCADIS/Malcolm Pirnie 2012; HQMC 2010).
Table 2-1: Summary of Ranges Contributing to MC Loading Areas
MC Loading Area Contributing Ranges Acorn TA-ACORN America Mine TA-AMERICA MINE Black Top I / Morgan’s Well I TA-BLACKTOP, TA-MORGANS WELL Black Top II TA-BLACKTOP Bullion TA-BULLION, 2013 EOD DATA FOR BULLION, R-210 (LIVE MOUT) Cleghorn Pass I R-400, R-410, R-410A Cleghorn Pass II TA-CLEGHORN PASS, TA-CLEGHORN PASS FARP, R-500 Delta TA-DELTA, R-205 (CONVOY), R-205 (LIVE MOUT), R-401 East TA-EAST, R-100, R-200 MOUT TOWN, R-215 (UWTC), R-215 (CLSA) Emerson Lake TA-EMERSON LAKE Gays Pass I TA-GAYS PASS Gays Pass II TA-GAYS PASS Gypsum Ridge TA-GYPSUM RIDGE Lava TA-LAVA Lavic Lake TA-LAVIC LAKE Lead Mountain I TA-LEAD MOUNTAIN Maumee Mine TA-MAUMEE MINE Morgan’s Well II TA-MORGANS WELL, TA-RAINBOW CANYON, R-601 Noble Pass TA-NOBLE PASS Prospect TA-PROSPECT Quackenbush TA-QUACKENBUSH (LAKE), R-220, R-220 A, R-220 C1, R-220 C2, R-220
C5, R-220 D, R-220 F1, R-220 F2, R-220 F4, R-220 H, R-220 I, R-220 O, R-220 S, R-220 U, R-220 W, R-620, R-630
Rainbow Canyon TA-RAINBOW CANYON Range 051 R-051, 2013 EOD DATA FOR R-051 Range I R-104, R-105 A, R-106, R-106 A, R-107, 2013 EOD DATA FOR R-107 Range II R-108, R-109 Range III R-110, 2013 EOD DATA FOR R-110, R-110A Range IV R-111, R-112, 2013 EOD DATA FOR R-112, R-113, 2013 EOD DATA FOR
R-113, R-113 A, R-114, 2013 EOD DATA FOR R-114 Sand Hill East TA-SANDHILL Sand Hill West TA-SANDHILL Sunshine Peak TA-SUNSHINE PEAK West R-102, R-225, R-800 (TA WEST), R-800 IED TRAINING LANE, R-800
VILLAGE 1 (TVCS), R-800 VILLAGE 2 (TVCS), R-800 VILLAGE 3 NOTE: TA = Training Area R = Range
MC loading was estimated using the REVA MC Loading Rate Calculator (described in the REVA Reference Manual [HQMC 2009]) and modified to account for standard management practices involving removal of explosive hazards, such as implemented at demolition and EOD ranges at MCAGCC Twentynine Palms. These modifications are described in Section 2.1.2. Total lead deposition at impact areas and HE ranges
2-2 Marine Corps Installations Command REVA Periodic Review MCAGCC Twentynine Palms
Section 2 Assessment Methods and Results
was estimated using the lead content in each munition and the number of ordnance items used. Given the nature of metals, lead deposition estimates assume no consumption from impact and that all of the lead contained within the munition is deposited in the loading area. Similarly, lead deposition estimates at SARs were also based on the total number of cartridges expended at a range and the amount of lead in each cartridge.
2.1.2 Munitions Constituents Loading Assumptions
MC loading is based primarily on munitions expenditure data obtained from Training and Education Command (TECOM), which covers the period from calendar year (CY) 2011 through August 2014 (3 years and 8 months). The expenditure data were used to develop annual averages of expenditures for each identified MC loading area. These averages were then used in the REVA MC Loading Rate Calculator to generate estimated MC loading rates for each MC loading area. Based on a quality review of the provided data, a series of assumptions were made to accommodate the data in the Calculator:
• The primary expenditure data provided by the installation through TECOM were Range Facility Management Support System (RFMSS) data. According to range personnel, these data capture expenditures for all training operations and donor charges for EOD operations at MCAGCC Twentynine Palms. The RFMSS data provided for the period listed above were broken out by year and range area and represented expenditures over a period of 44 months. Annual average expenditure totals were calculated for each munition type.
• The expenditure summaries contain some DoD Identification Codes (DoDICs) for which information on MC content was not available. These entries were managed one of two ways:
− In some instances, general descriptions of the munitions associated with these DoDICs were provided, either as part of the installation data or in other readily available sources. These descriptions were considered in relation to the range design and use, and a surrogate DoDIC with a similar description and known MC content was selected from available data sources for use in the MC loading calculations.
− Where no descriptions for the munitions were provided, the associated expenditure counts for the unknown DoDICs were proportionally distributed among other known DoDICs associated with the given range, based on totals for the other DoDICs listed for the same range and year.
Additionally, key assumptions were developed with regard to EOD activities at MCAGCC Twentynine Palms. According to Range personnel, all explosive charges obtained from the ammunition supply point by EOD for training or demolition activities are tracked in RFMSS. However, items recovered and transported by EOD personnel to an alternate range for destruction are not necessarily captured in the RFMSS data.
EOD personnel provided a record of call sheets used to account for these items destroyed by EOD that may not be captured in the RFMSS data. The sheets cover the period of CY 2013 and contain detailed information about what items were involved, where they were found, and the remedy that was applied including a record of transport or use of demolition materials. These data were used to develop a single year
Marine Corps Installations Command REVA Periodic Review MCAGCC Twentynine Palms
2-3
Section 2
Assessment Methods and Results
of averages which supplemented information developed from the RFMSS data, using the following assumptions:
• The call sheets represented 12 months of operations. These data were assumed to represent a typical year of operation, and the totals were added to the corresponding annual averages developed from the expenditure data.
• DoDICs where MC content data were not available in Munitions Items Disposition Action System (MIDAS) or other inventories were managed using assumptions similar to those described previously in this section.
• Only EOD call sheets documenting the destruction of ordnance items on ranges other than where they were originally expended were used to supplement the RFMSS data. EOD call sheets documenting items destroyed on the ranges where they were originally expended were not used to supplement the RFMSS data, as it is assumed that these ordnance items as well as the donor charges used to destroy them were already accounted for in RFMSS.
• Expenditures associated with EOD and demolition activities were adjusted to reflect an assumed 100% high order detonation for the MC loading calculations. Lead deposition associated with EOD and demolition activities was conservatively reduced to 5% of potential deposition in these instances to account for standard operating procedures where munitions debris is routinely collected and removed following EOD operations.
• RFMSS data provided by the installation included dud/UXO rates for some expenditures. These rates were not used to replace the standard dud assumptions in the REVA MC Loading Rate Calculator because these data were not reported for a long enough period to develop meaningful dud rates, and the data may not have been reported consistently. As such, the standard dud rate assumptions were used in order to maintain a higher level of conservatism in the loading estimate.
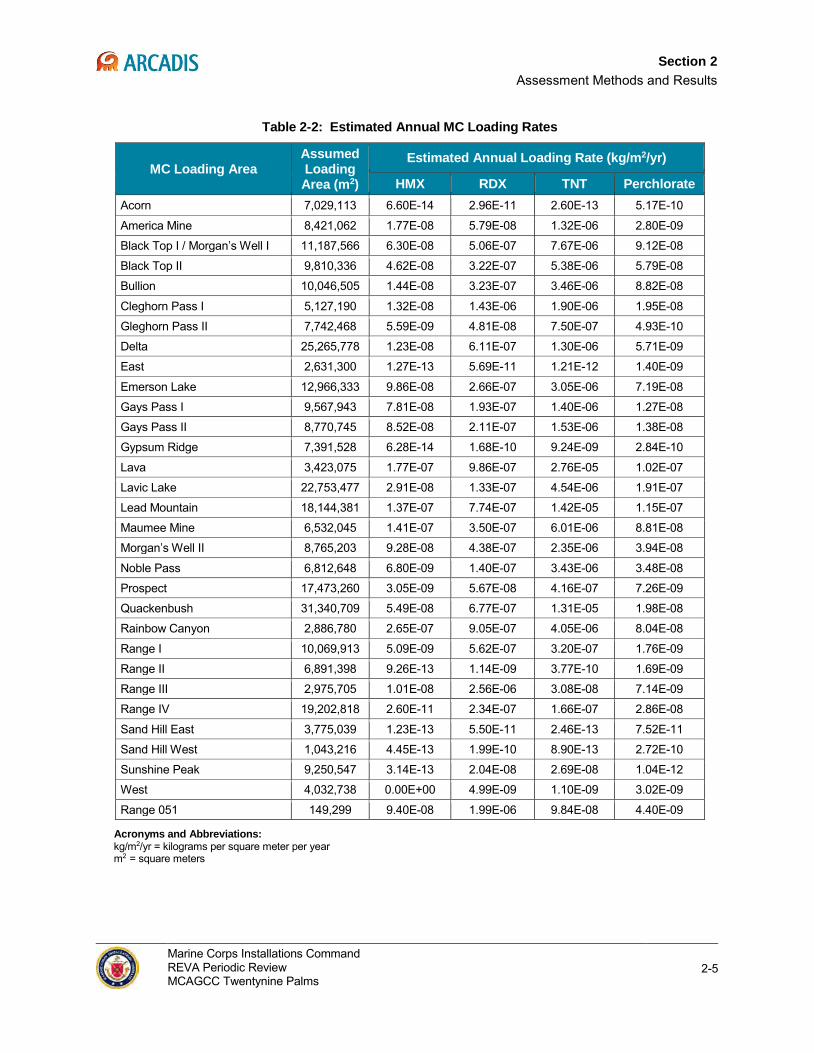
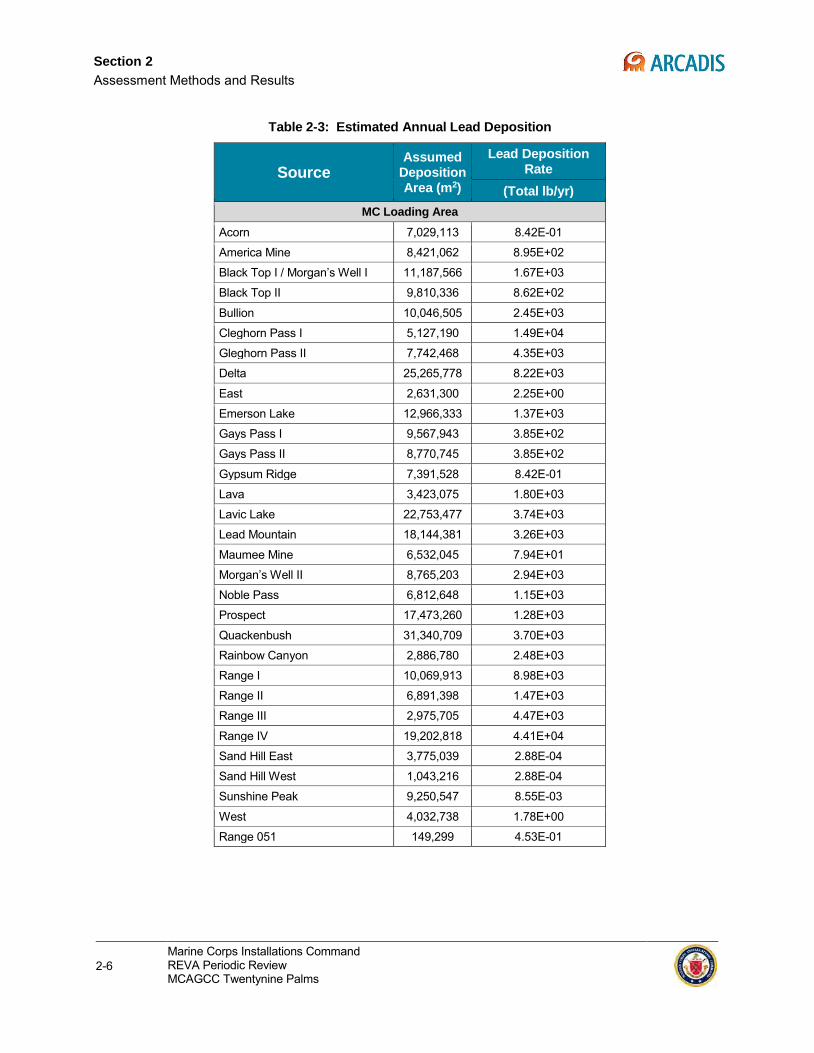
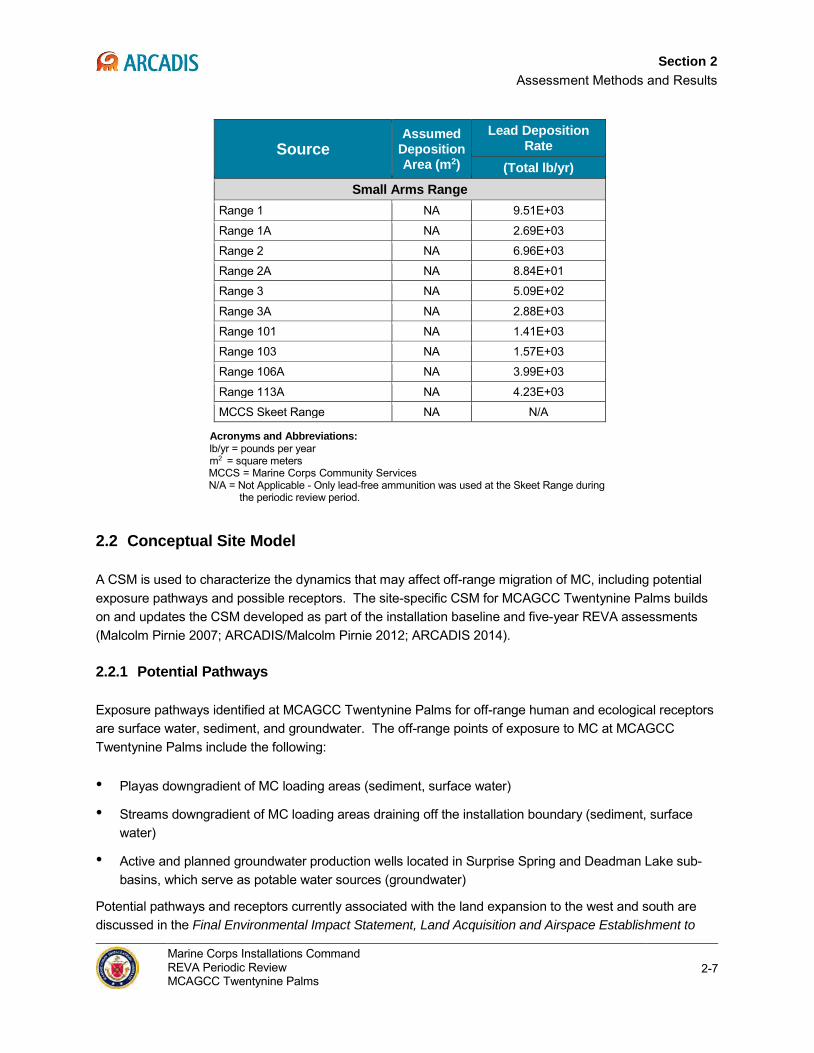
The MC loading rates generated by the REVA MC Loading Rate Calculator are listed in Table 2-2. Quantitative evaluations of potential MC migration are discussed in Section 2. The estimated deposition of lead in each MC loading area and SAR is presented in Table 2-3. Qualitative evaluations of potential lead migration are discussed in Section 2.4. Additional details regarding the MC loading methods are outlined in the REVA Reference Manual (HQMC 2009).
2.1.3 Operational Range Clearance
Operational range clearance (ORC) activities at MCAGCC Twentynine Palms have been modified since the REVA five-year review. Identification of areas that require ORC is based on regular analysis of range/RTA scheduling, munition expenditures, and areas where movement and live fire co-exist. Once identified, installation EOD personnel are tasked with completing surface and limited subsurface clearances of those areas. Since documentation containing specific details regarding the area, frequency, and scope of the ORC activities at MCAGCC Twentynine Palms was not available, ORC activities were not factored into the MC loading estimations for the Periodic Review.
2-4 Marine Corps Installations Command REVA Periodic Review MCAGCC Twentynine Palms
Section 2 Assessment Methods and Results
Table 2-2: Estimated Annual MC Loading Rates
MC Loading Area Assumed Loading Area (m2)
Estimated Annual Loading Rate (kg/m2/yr)
HMX RDX TNT Perchlorate Acorn 7,029,113 6.60E-14 2.96E-11 2.60E-13 5.17E-10
America Mine 8,421,062 1.77E-08 5.79E-08 1.32E-06 2.80E-09
Black Top I / Morgan’s Well I 11,187,566 6.30E-08 5.06E-07 7.67E-06 9.12E-08
Black Top II 9,810,336 4.62E-08 3.22E-07 5.38E-06 5.79E-08
Bullion 10,046,505 1.44E-08 3.23E-07 3.46E-06 8.82E-08
Cleghorn Pass I 5,127,190 1.32E-08 1.43E-06 1.90E-06 1.95E-08
Gleghorn Pass II 7,742,468 5.59E-09 4.81E-08 7.50E-07 4.93E-10
Delta 25,265,778 1.23E-08 6.11E-07 1.30E-06 5.71E-09
East 2,631,300 1.27E-13 5.69E-11 1.21E-12 1.40E-09
Emerson Lake 12,966,333 9.86E-08 2.66E-07 3.05E-06 7.19E-08
Gays Pass I 9,567,943 7.81E-08 1.93E-07 1.40E-06 1.27E-08
Gays Pass II 8,770,745 8.52E-08 2.11E-07 1.53E-06 1.38E-08
Gypsum Ridge 7,391,528 6.28E-14 1.68E-10 9.24E-09 2.84E-10
Lava 3,423,075 1.77E-07 9.86E-07 2.76E-05 1.02E-07
Lavic Lake 22,753,477 2.91E-08 1.33E-07 4.54E-06 1.91E-07
Lead Mountain 18,144,381 1.37E-07 7.74E-07 1.42E-05 1.15E-07
Maumee Mine 6,532,045 1.41E-07 3.50E-07 6.01E-06 8.81E-08
Morgan’s Well II 8,765,203 9.28E-08 4.38E-07 2.35E-06 3.94E-08
Noble Pass 6,812,648 6.80E-09 1.40E-07 3.43E-06 3.48E-08
Prospect 17,473,260 3.05E-09 5.67E-08 4.16E-07 7.26E-09
Quackenbush 31,340,709 5.49E-08 6.77E-07 1.31E-05 1.98E-08
Rainbow Canyon 2,886,780 2.65E-07 9.05E-07 4.05E-06 8.04E-08
Range I 10,069,913 5.09E-09 5.62E-07 3.20E-07 1.76E-09
Range II 6,891,398 9.26E-13 1.14E-09 3.77E-10 1.69E-09
Range III 2,975,705 1.01E-08 2.56E-06 3.08E-08 7.14E-09
Range IV 19,202,818 2.60E-11 2.34E-07 1.66E-07 2.86E-08
Sand Hill East 3,775,039 1.23E-13 5.50E-11 2.46E-13 7.52E-11
Sand Hill West 1,043,216 4.45E-13 1.99E-10 8.90E-13 2.72E-10
Sunshine Peak 9,250,547 3.14E-13 2.04E-08 2.69E-08 1.04E-12
West 4,032,738 0.00E+00 4.99E-09 1.10E-09 3.02E-09
Range 051 149,299 9.40E-08 1.99E-06 9.84E-08 4.40E-09
Acronyms and Abbreviations: kg/m2/yr = kilograms per square meter per year m2 = square meters
Marine Corps Installations Command REVA Periodic Review MCAGCC Twentynine Palms
2-5
Section 2
Assessment Methods and Results
Table 2-3: Estimated Annual Lead Deposition
Source Assumed
Deposition Area (m2)
Lead Deposition Rate
(Total lb/yr) MC Loading Area
Acorn 7,029,113 8.42E-01
America Mine 8,421,062 8.95E+02
Black Top I / Morgan’s Well I 11,187,566 1.67E+03
Black Top II 9,810,336 8.62E+02
Bullion 10,046,505 2.45E+03
Cleghorn Pass I 5,127,190 1.49E+04
Gleghorn Pass II 7,742,468 4.35E+03
Delta 25,265,778 8.22E+03
East 2,631,300 2.25E+00
Emerson Lake 12,966,333 1.37E+03
Gays Pass I 9,567,943 3.85E+02
Gays Pass II 8,770,745 3.85E+02
Gypsum Ridge 7,391,528 8.42E-01
Lava 3,423,075 1.80E+03
Lavic Lake 22,753,477 3.74E+03
Lead Mountain 18,144,381 3.26E+03
Maumee Mine 6,532,045 7.94E+01
Morgan’s Well II 8,765,203 2.94E+03
Noble Pass 6,812,648 1.15E+03
Prospect 17,473,260 1.28E+03
Quackenbush 31,340,709 3.70E+03
Rainbow Canyon 2,886,780 2.48E+03
Range I 10,069,913 8.98E+03
Range II 6,891,398 1.47E+03
Range III 2,975,705 4.47E+03
Range IV 19,202,818 4.41E+04
Sand Hill East 3,775,039 2.88E-04
Sand Hill West 1,043,216 2.88E-04
Sunshine Peak 9,250,547 8.55E-03
West 4,032,738 1.78E+00
Range 051 149,299 4.53E-01
2-6 Marine Corps Installations Command REVA Periodic Review MCAGCC Twentynine Palms
Section 2 Assessment Methods and Results
Source Assumed
Deposition Area (m2)
Lead Deposition Rate
(Total lb/yr) Small Arms Range
Range 1 NA 9.51E+03
Range 1A NA 2.69E+03
Range 2 NA 6.96E+03
Range 2A NA 8.84E+01
Range 3 NA 5.09E+02
Range 3A NA 2.88E+03
Range 101 NA 1.41E+03
Range 103 NA 1.57E+03
Range 106A NA 3.99E+03
Range 113A NA 4.23E+03
MCCS Skeet Range NA N/A
Acronyms and Abbreviations: lb/yr = pounds per year m2 = square meters MCCS = Marine Corps Community Services N/A = Not Applicable - Only lead-free ammunition was used at the Skeet Range during
the periodic review period.
2.2 Conceptual Site Model
A CSM is used to characterize the dynamics that may affect off-range migration of MC, including potential exposure pathways and possible receptors. The site-specific CSM for MCAGCC Twentynine Palms builds on and updates the CSM developed as part of the installation baseline and five-year REVA assessments (Malcolm Pirnie 2007; ARCADIS/Malcolm Pirnie 2012; ARCADIS 2014).
2.2.1 Potential Pathways
Exposure pathways identified at MCAGCC Twentynine Palms for off-range human and ecological receptors are surface water, sediment, and groundwater. The off-range points of exposure to MC at MCAGCC Twentynine Palms include the following:
• Playas downgradient of MC loading areas (sediment, surface water)
• Streams downgradient of MC loading areas draining off the installation boundary (sediment, surface water)
• Active and planned groundwater production wells located in Surprise Spring and Deadman Lake sub-basins, which serve as potable water sources (groundwater)
Potential pathways and receptors currently associated with the land expansion to the west and south are discussed in the Final Environmental Impact Statement, Land Acquisition and Airspace Establishment to
Marine Corps Installations Command REVA Periodic Review MCAGCC Twentynine Palms
2-7
Section 2
Assessment Methods and Results
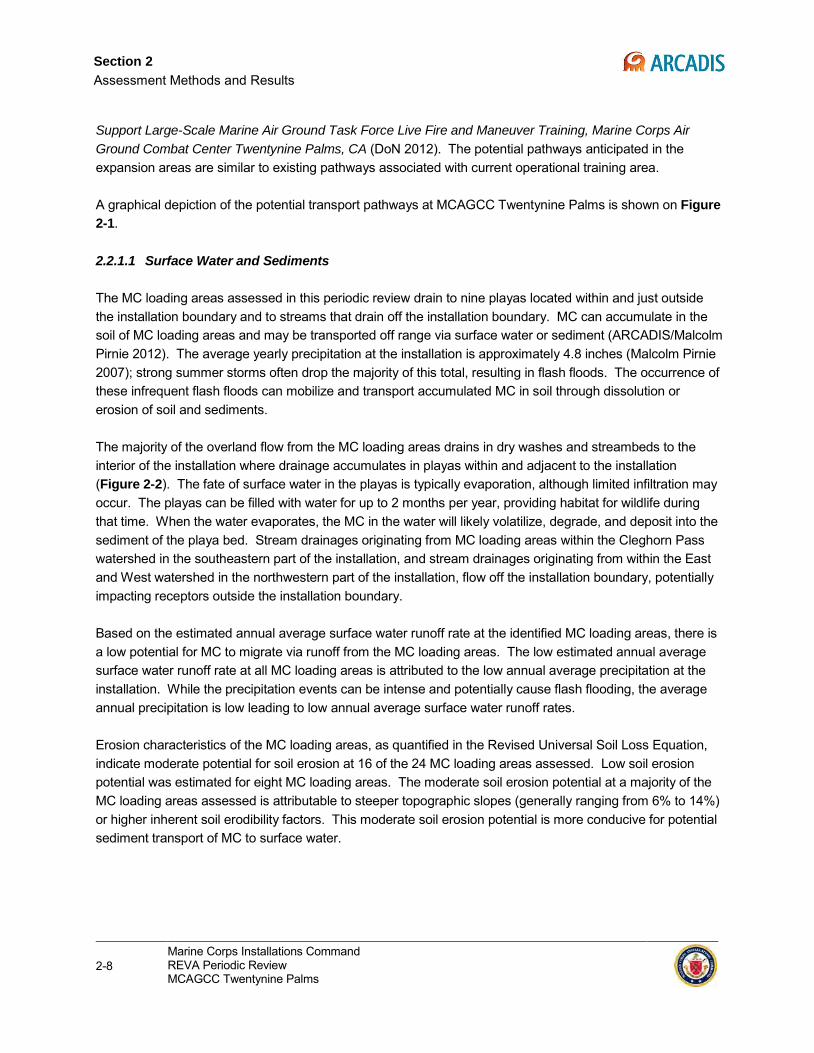
Support Large-Scale Marine Air Ground Task Force Live Fire and Maneuver Training, Marine Corps Air Ground Combat Center Twentynine Palms, CA (DoN 2012). The potential pathways anticipated in the expansion areas are similar to existing pathways associated with current operational training area.
A graphical depiction of the potential transport pathways at MCAGCC Twentynine Palms is shown on Figure 2-1.
2.2.1.1 Surface Water and Sediments
The MC loading areas assessed in this periodic review drain to nine playas located within and just outside the installation boundary and to streams that drain off the installation boundary. MC can accumulate in the soil of MC loading areas and may be transported off range via surface water or sediment (ARCADIS/Malcolm Pirnie 2012). The average yearly precipitation at the installation is approximately 4.8 inches (Malcolm Pirnie 2007); strong summer storms often drop the majority of this total, resulting in flash floods. The occurrence of these infrequent flash floods can mobilize and transport accumulated MC in soil through dissolution or erosion of soil and sediments.
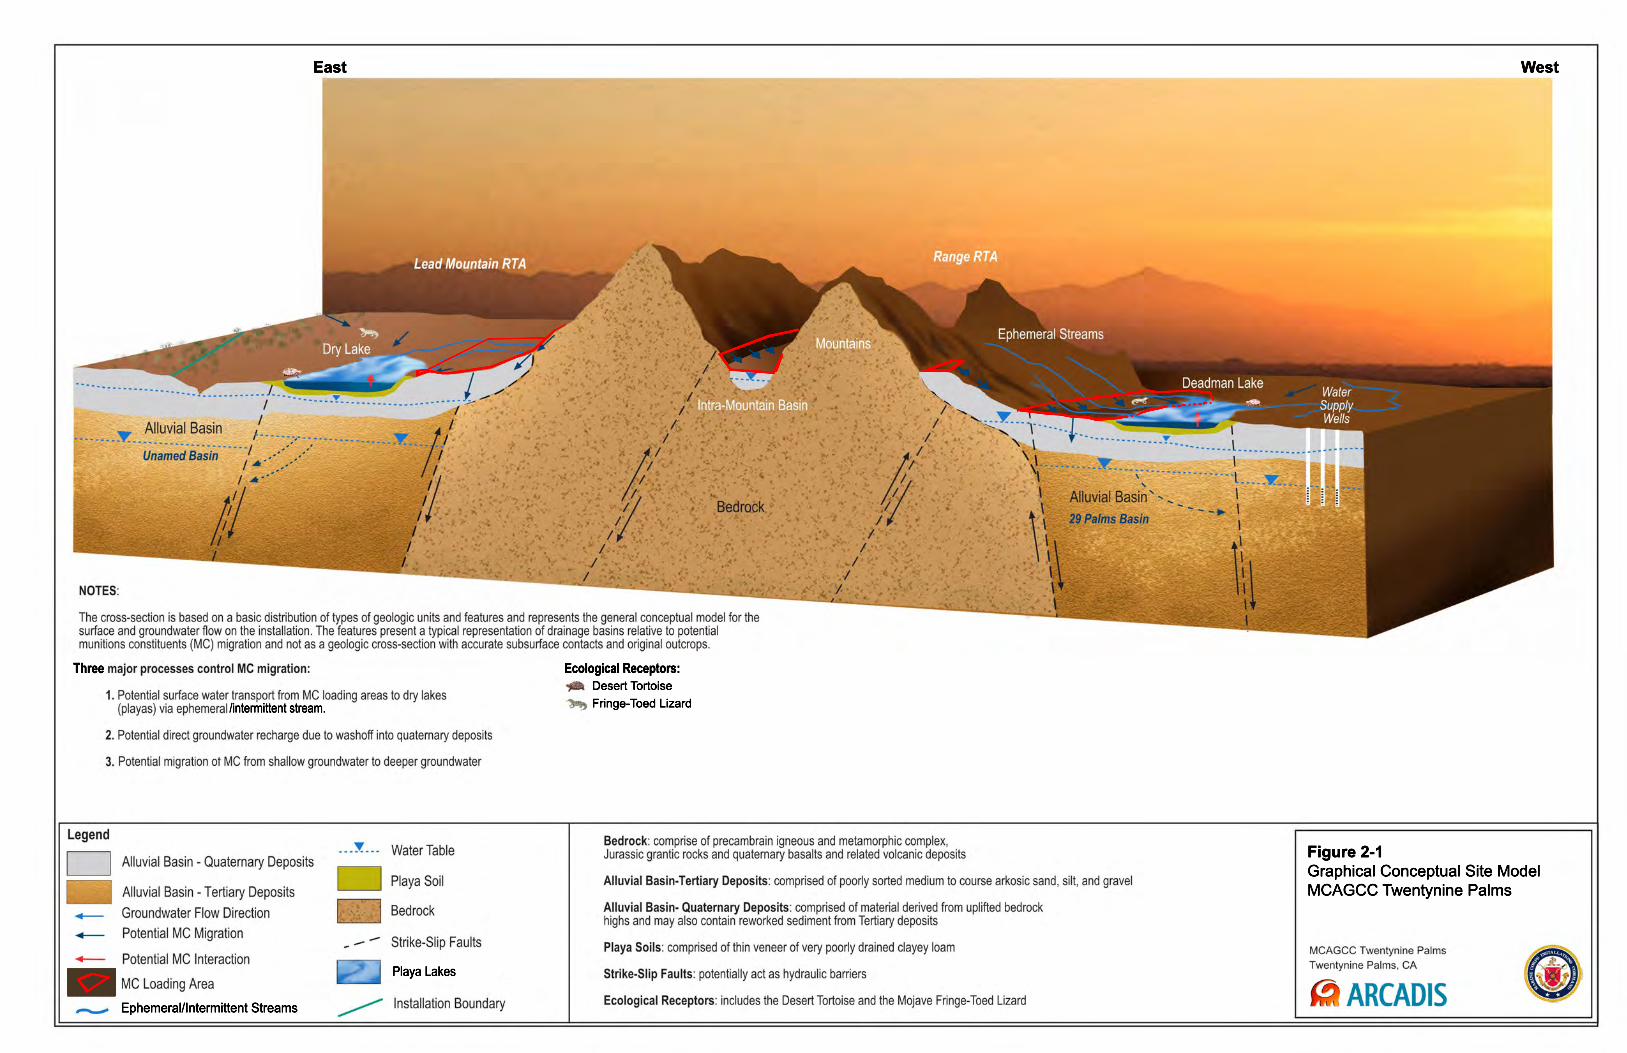
The majority of the overland flow from the MC loading areas drains in dry washes and streambeds to the interior of the installation where drainage accumulates in playas within and adjacent to the installation (Figure 2-2). The fate of surface water in the playas is typically evaporation, although limited infiltration may occur. The playas can be filled with water for up to 2 months per year, providing habitat for wildlife during that time. When the water evaporates, the MC in the water will likely volatilize, degrade, and deposit into the sediment of the playa bed. Stream drainages originating from MC loading areas within the Cleghorn Pass watershed in the southeastern part of the installation, and stream drainages originating from within the East and West watershed in the northwestern part of the installation, flow off the installation boundary, potentially impacting receptors outside the installation boundary.
Based on the estimated annual average surface water runoff rate at the identified MC loading areas, there is a low potential for MC to migrate via runoff from the MC loading areas. The low estimated annual average surface water runoff rate at all MC loading areas is attributed to the low annual average precipitation at the installation. While the precipitation events can be intense and potentially cause flash flooding, the average annual precipitation is low leading to low annual average surface water runoff rates.
Erosion characteristics of the MC loading areas, as quantified in the Revised Universal Soil Loss Equation, indicate moderate potential for soil erosion at 16 of the 24 MC loading areas assessed. Low soil erosion potential was estimated for eight MC loading areas. The moderate soil erosion potential at a majority of the MC loading areas assessed is attributable to steeper topographic slopes (generally ranging from 6% to 14%) or higher inherent soil erodibility factors. This moderate soil erosion potential is more conducive for potential sediment transport of MC to surface water.
2-8 Marine Corps Installations Command REVA Periodic Review MCAGCC Twentynine Palms
/intermittent stream.
Three
Playa Lakes
Ephemeral/Intermittent Streams
Ecological Receptors:Desert TortoiseFringe-Toed Lizard
Figure 2-1Graphical Conceptual Site ModelMCAGCC Twentynine Palms
East West

Salt MiningOperations
Ames Lake
Bristol Lake
Miller LakeSouth Miller Lake
Dry Lake
Lavic Lake
Emerson Lake
Deadman Lake
Mesquite Lake
Galway Lake
Quackenbush Lake
Emerson Lake East
Upper Mesquite Lake
Lower Sunshine Lake
FIGURE 2-2MCAGCC TWENTYNINE PALMS
SURFACE WATERFEATURES
Coordinate System: UTM Zone: 11NDatum: NAD83Units: Meters
Date: August 2015
Source: MCAGCC Twentynine Palms, 2014b
MCAGCC Twentynine Palms
0 2 4 61
Miles
REVAMCAGCC TWENTYNINE PALMS
LegendMC Loading AreaInstallation BoundaryPlaya Lake(Ephermal/Intermittent)Stream/Wash(Ephermal/Intermittent)
WatershedBristol LakeCleghorn Pass/Dale LakeDeadman LakeDry LakeEast and West SunshineEmerson LakeGalway LakeGoat MountainLavic LakeMesquite LakeQuakenbushUpper Emerson
Section 2 Assessment Methods and Results
Water that accumulates in the playas may present a potential, limited exposure pathway for ecological species, including the federally threatened Agassiz's desert tortoise and the Mojave fringe-toed lizard (MFTL), a California Species of Special Concern (SSC) (Malcolm Pirnie 2007). Sediment accumulated along drainages and in the playas may also present a potential exposure pathway to ecological species. Although there is no documented extensive use of drainages and playas for recreation, surface water is considered a potential exposure pathway for human health through incidental contact. However, installation personnel are prohibited from entering playas within the installation boundary when they are wet, and there is no extensive recreational use of the playas anticipated outside of the installation.
Salt mining operations are located outside the installation at Bristol Lake Playa, downgradient of several MC loading areas, including Delta, Lava, Lead Mountain, Bullion, Prospect, Noble Pass and America Mine MC loading areas. Salt produced by the existing operations may be used in a variety of products, including those destined for human consumption. However, exposure of produced salt to oncoming drainage is anticipated to be negligible since the production involves the extraction of local, briny groundwater (mostly pumped from deep groundwater zones), which is placed in constructed ponds and trenches for evaporation. Although there is a possibility of a potential human exposure to MC in surface water and sediment through incidental contact by salt mine workers, there is no known human consumption of surface water for drinking water. Therefore, the playas do not represent a significant human exposure pathway.
There are several playas that exist in the western expansion area, including Galway Lake and Emerson Lake, which were identified as potential off-range receptor locations in this REVA periodic review. Other playas that exist in the western expansion area include Melville Lake, Soggy Lake, and Means Dray Lake. The southern expansion area falls in the Cleghorn Pass watershed, where Dale Lake Playa exists several miles downgradient of the expansion area. Based on U.S. Geological Survey maps, no seeps or springs are known to exist in the western or southern expansion areas.
2.2.1.2 Groundwater
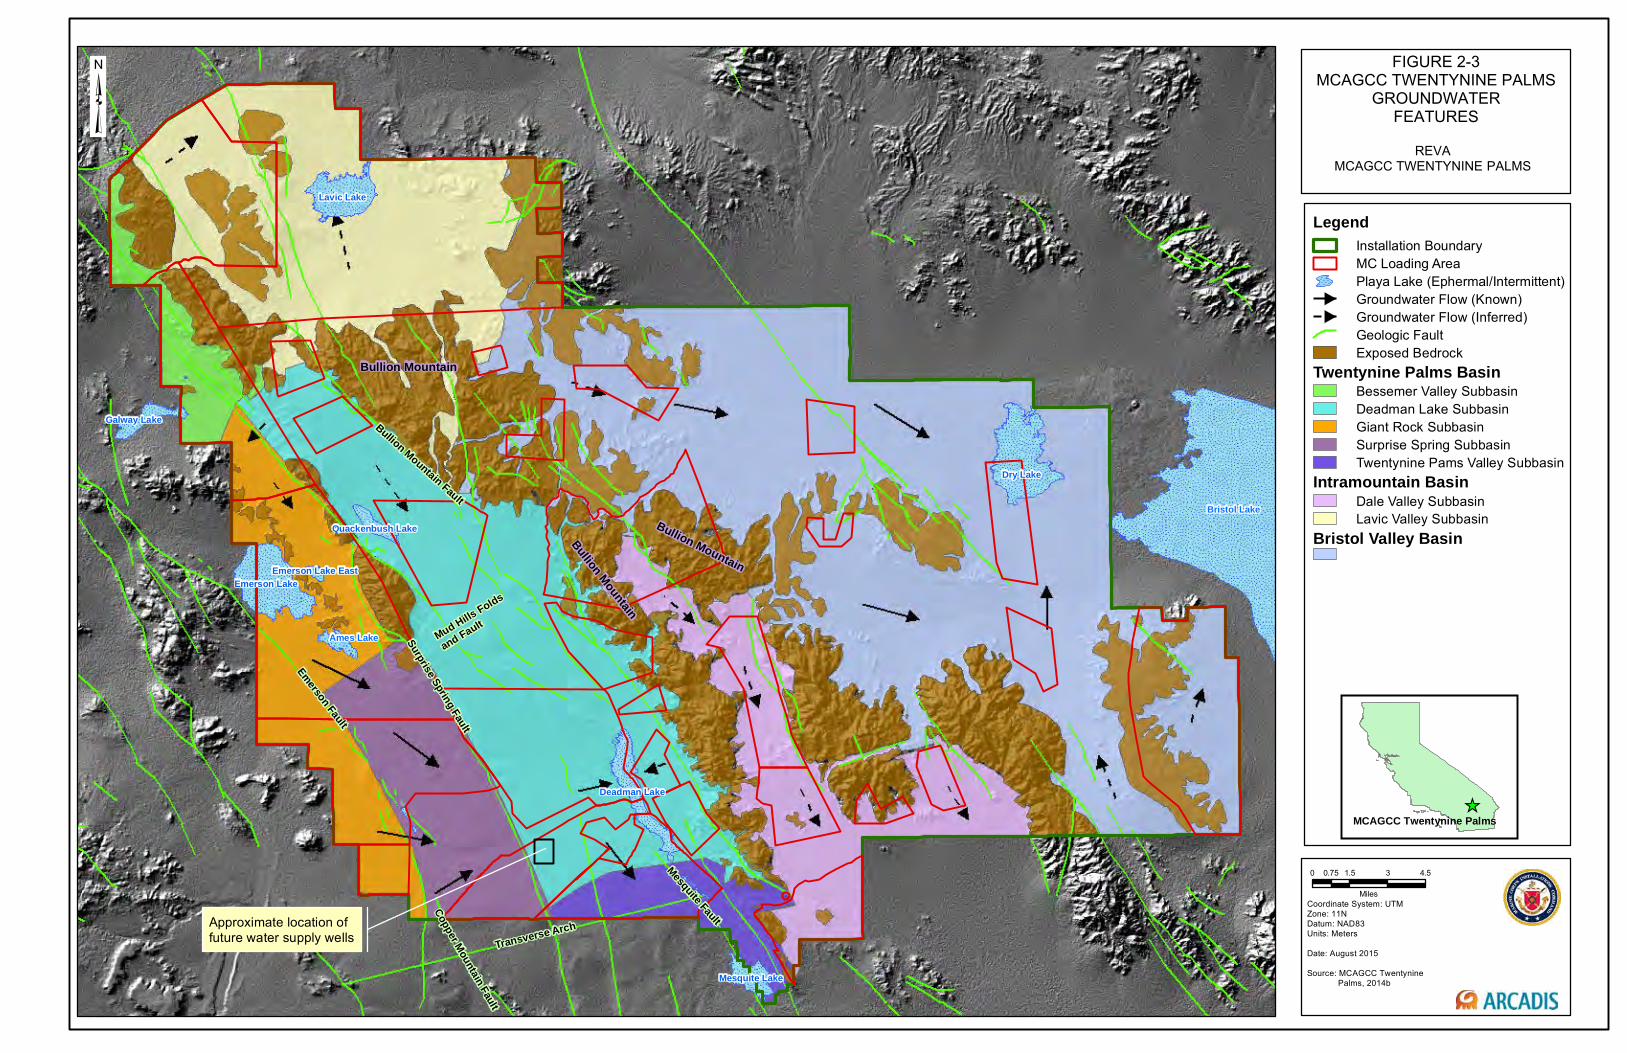
Groundwater at MCAGCC Twentynine Palms is found in the alluvium-filled basins that flank the bedrock uplands. Primary groundwater basins include the Twentynine Palms basin on the southwestern margin of the Bullion Mountains (composed of five groundwater sub-basins covering parts of MCAGCC Twentynine Palms), the Bristol Valley basin on the northeastern side of the Bullion Mountains, and several smaller intramountain sub-basins (portions of the Dale Valley and Lavic Valley) that are located in the Bullion and Lava Bed mountains (Figure 2-3).
Shallow perched groundwater exists beneath playa lakes throughout the installation (ARCADIS/Malcolm Pirnie, 2012). The source of the perched groundwater is likely from limited infiltration through playa soils and/or from infiltration through the permeable alluvial soils surrounding the playas during flood events. Recharge directly through the playa soils is minimal due to the low permeability of these soils which can have a thickness of up to 50 feet (Li and Martin 2008). As a result, potential MC migration from the playa lakes down to the shallow perched groundwater is limited.
Marine Corps Installations Command REVA Periodic Review MCAGCC Twentynine Palms
2-13
Section 2
Assessment Methods and Results
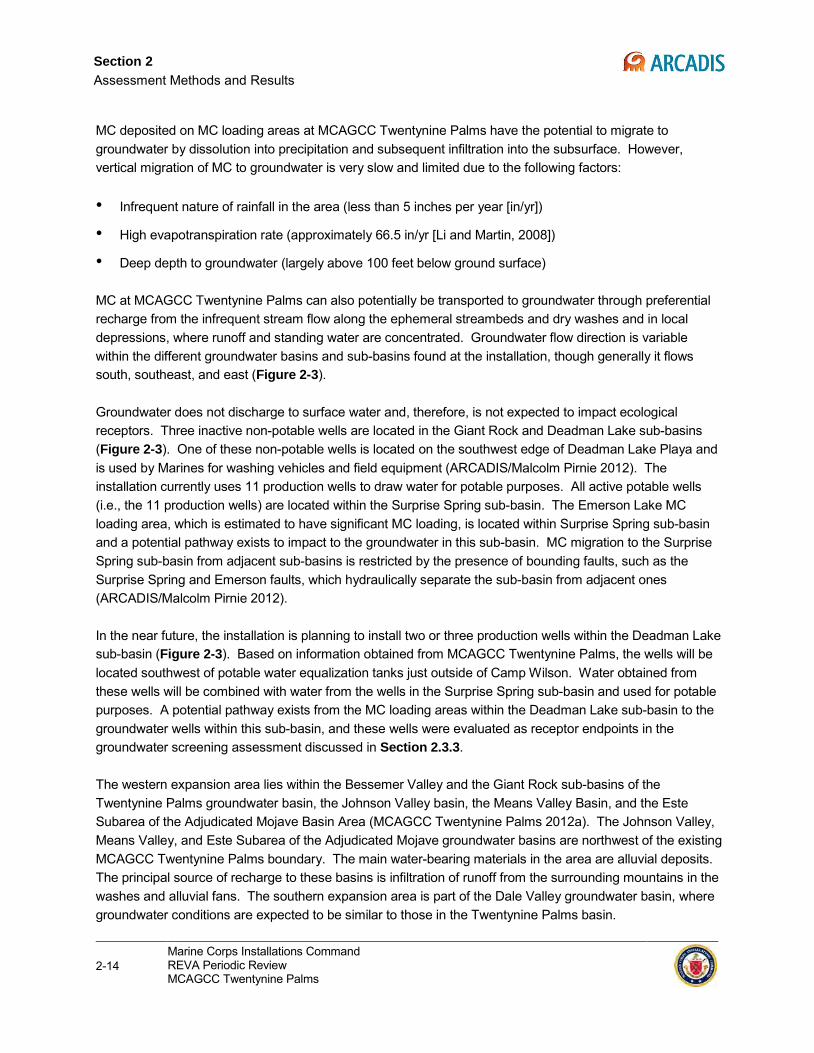
MC deposited on MC loading areas at MCAGCC Twentynine Palms have the potential to migrate to groundwater by dissolution into precipitation and subsequent infiltration into the subsurface. However, vertical migration of MC to groundwater is very slow and limited due to the following factors:
• Infrequent nature of rainfall in the area (less than 5 inches per year [in/yr])
• High evapotranspiration rate (approximately 66.5 in/yr [Li and Martin, 2008])
• Deep depth to groundwater (largely above 100 feet below ground surface)
MC at MCAGCC Twentynine Palms can also potentially be transported to groundwater through preferential recharge from the infrequent stream flow along the ephemeral streambeds and dry washes and in local depressions, where runoff and standing water are concentrated. Groundwater flow direction is variable within the different groundwater basins and sub-basins found at the installation, though generally it flows south, southeast, and east (Figure 2-3).
Groundwater does not discharge to surface water and, therefore, is not expected to impact ecological receptors. Three inactive non-potable wells are located in the Giant Rock and Deadman Lake sub-basins (Figure 2-3). One of these non-potable wells is located on the southwest edge of Deadman Lake Playa and is used by Marines for washing vehicles and field equipment (ARCADIS/Malcolm Pirnie 2012). The installation currently uses 11 production wells to draw water for potable purposes. All active potable wells (i.e., the 11 production wells) are located within the Surprise Spring sub-basin. The Emerson Lake MC loading area, which is estimated to have significant MC loading, is located within Surprise Spring sub-basin and a potential pathway exists to impact to the groundwater in this sub-basin. MC migration to the Surprise Spring sub-basin from adjacent sub-basins is restricted by the presence of bounding faults, such as the Surprise Spring and Emerson faults, which hydraulically separate the sub-basin from adjacent ones (ARCADIS/Malcolm Pirnie 2012).
In the near future, the installation is planning to install two or three production wells within the Deadman Lake sub-basin (Figure 2-3). Based on information obtained from MCAGCC Twentynine Palms, the wells will be located southwest of potable water equalization tanks just outside of Camp Wilson. Water obtained from these wells will be combined with water from the wells in the Surprise Spring sub-basin and used for potable purposes. A potential pathway exists from the MC loading areas within the Deadman Lake sub-basin to the groundwater wells within this sub-basin, and these wells were evaluated as receptor endpoints in the groundwater screening assessment discussed in Section 2.3.3.
The western expansion area lies within the Bessemer Valley and the Giant Rock sub-basins of the Twentynine Palms groundwater basin, the Johnson Valley basin, the Means Valley Basin, and the Este Subarea of the Adjudicated Mojave Basin Area (MCAGCC Twentynine Palms 2012a). The Johnson Valley, Means Valley, and Este Subarea of the Adjudicated Mojave groundwater basins are northwest of the existing MCAGCC Twentynine Palms boundary. The main water-bearing materials in the area are alluvial deposits. The principal source of recharge to these basins is infiltration of runoff from the surrounding mountains in the washes and alluvial fans. The southern expansion area is part of the Dale Valley groundwater basin, where groundwater conditions are expected to be similar to those in the Twentynine Palms basin.
2-14 Marine Corps Installations Command REVA Periodic Review MCAGCC Twentynine Palms
Dry Lake
Lavic Lake
Emerson Lake
Deadman Lake
Mesquite Lake
Galway Lake
Quackenbush Lake
Emerson Lake East
FIGURE 2-3MCAGCC TWENTYNINE PALMS
GROUNDWATERFEATURES
Coordinate System: UTM Zone: 11NDatum: NAD83Units: Meters
Date: August 2015
Source: MCAGCC Twentynine Palms, 2014b
MCAGCC Twentynine Palms
0 1.5 3 4.50.75
Miles
REVAMCAGCC TWENTYNINE PALMS
LegendInstallation BoundaryMC Loading AreaPlaya Lake (Ephermal/Intermittent)Groundwater Flow (Known)Groundwater Flow (Inferred)Geologic FaultExposed Bedrock
Twentynine Palms BasinBessemer Valley SubbasinDeadman Lake SubbasinGiant Rock SubbasinSurprise Spring SubbasinTwentynine Pams Valley Subbasin
Intramountain BasinDale Valley SubbasinLavic Valley Subbasin
Bristol Valley Basin
Approximate location offuture water supply wells
Bristol Lake
Ames Lake
Bullion Mountain
Bullion Mountain
Bullion Mountain
Bullion Mountain Fault
Mud Hills Folds
and Fault
Emerson Fault
Surprise Spring Fault
Copper Mountain Fault
Mesquite Fault
Transverse Arch
Section 2 Assessment Methods and Results
Groundwater recharge is principally from groundwater subsurface flow originating as surface runoff from the surrounding mountains, recharging along the bedrock-alluvial deposit interface, and migrating through adjacent basins.
2.2.2 Potential Receptors
The potential receptors identified at MCAGCC Twentynine Palms include:
1) Humans
• Potable water use from groundwater supply wells
• Incidental contact of surface water and sediment at the salt mining operations at Bristol Lake playa
• Incidental contact of surface water outside the installation boundary
2) Ecological species
As discussed in Section 2.2.1.2, potential MC exposure to humans from groundwater use is limited. This is because the vertical migration of MC to groundwater at MCAGCC Twentynine Palms is very slow due to the low rainfall, high evapotranspiration and deep depth to groundwater. Although there is a possibility for human exposure through incidental contact of surface water/ or sediment, the potential of MC exposure through this pathway is highly limited.
Ecological receptors have been identified as the primary potential receptors of concern for MC transport at MCAGCC Twentynine Palms. Ecological receptors, including special status species, may be exposed to MC in storm water runoff and deposited sediment that accumulates in drainages and playa lakes. Ten ecosystems have been described at MCAGCC Twentynine Palms; the dominant ecosystem is creosote/bursage scrub, covering approximately 90% of the installation (ARCADIS/Malcolm Pirnie 2012). Wildlife species present across much of the installation are typical of Mojave Desert fauna, whose distribution is generally limited by the availability of water. There are no ecological receptors associated with groundwater. Based on information obtained from MCAGCC Twentynine Palms, there have been no new protected species identified at the installation since the completion of the REVA five-year review. Only the federally threatened species, Agassiz's desert tortoises (Gopherus agassizii), was identified in the REVA Five-Year Review Report as a special status species (ARCADIS/Malcolm Pirnie 2012). The desert tortoise is found throughout the Mojave Desert, and critical habitat is located near the installation, though not within its boundaries. Critical habitat is a specific geographic area that contains the biological and physical features essential to the species’ conservation and that may require special management considerations or protection. The U.S. Fish and Wildlife Service (USFWS) designated critical habitat for the desert tortoise in portions of California, Nevada, Arizona, and Utah in a final rule, published 8 February 1994 (USFWS 1994). The installation’s Integrated Natural Resources Management Plan (MCAGCC Twentynine Palms 2012) designates approximately 7,900 acres within the installation as Special Use or Restricted Areas, which is separate from critical habitat outside the installation. Within the Special Use Areas, off-road vehicle travel is not authorized, and other types of military operations are limited in order to minimize impacts to the tortoise populations. Since the REVA five-year review was completed, one of the existing Restricted Areas was expanded to further safeguard the desert tortoise population in that area.
Marine Corps Installations Command REVA Periodic Review MCAGCC Twentynine Palms
2-17
Section 2
Assessment Methods and Results
Playas on the installation provide habitats for a variety of avian, reptilian, and mammalian populations, including the MFTL (Uma scoparia), a California SSC. The installation also provides habitat for the Emory’s crucifixion thorn (Castela emoryi), another California SSC. Small crucifixion thorn populations in Blacktop, Emerson Lake, and southern Lavic Lake RTAs are protected from destruction during training by warning posts placed around the growth areas (DoN 2013).
As previously noted, an expansion of MCAGCC Twentynine Palms is underway. The shared-use area of the western acquisition area (described in Section 1.3) is already heavily used by off-highway vehicles and contains low numbers of desert tortoises. No other federal special status species are present, and no special requirements will be placed on this area (DoN 2013). However, three new Restricted Areas will be established in the military use–only areas to protect habitats supporting moderate densities of desert tortoises: two Restricted Areas (12,015 acres combined) in the western acquisition area and one Restricted Area (2,935 acres) in the southern acquisition area. Two of these areas are adjacent to existing protected areas; Ord-Rodman Desert Wildlife Management Area is adjacent to the western acquisition area and is Cleghorn Lakes Wilderness adjacent to the southern acquisition area. The third is located in the western portion of the western acquisition area and is not contiguous with existing or proposed conservation areas. A new Restricted Area will also be created on the existing installation, encompassing a new area within the Sunshine Peak Training Area (I,987 acres) and an existing Restricted Area within the Sunshine Peak and Lavic Lake Training Areas (8,901 acres). This new Restricted Area is being created to increase the protection of desert tortoises within the boundaries of the existing installation.
2.3 Screening-Level Assessment Results
The average annual MC concentrations in surface water, sediment, and groundwater were estimated based on the average annual MC loaded for each MC at each loading area (Appendix B) and were conducted for the period 2011 to 2014. In order to determine conservative estimates of MC concentrations in surface water, sediment, and groundwater at identified potential off-range receptor locations downgradient of MC loading areas, surface water and sediment screening-level fate and transport assessments were conducted for 24 of the 31 identified MC loading areas. Groundwater screening-level fate and transport assessment was conducted for 7 of the 31 identified MC loading areas. The procedures used are presented in the REVA Five-Year Review Manual (HQMC 2010). The following MC loading areas were selected for quantitative screening-level assessments based on range use and their potential for MC migration to off-range receptor locations. All REVA MC were modeled for each MC loading area assessed.
The following MC loading areas were assessed for surface water and sediment:
America Mine Delta Lead Mountain Rainbow Black Top I/ Morgan’s
Emerson Lake Maumee Mine Range 051
Black Top II Gays Pass I Morgan’s Well II Range I Bullion Gays Pass II Noble Pass Range III Cleghorn Pass I Lava Prospect Range IV Cleghorn Pass II Lavic Lake Quackenbush Sunshine Peak
2-18 Marine Corps Installations Command REVA Periodic Review MCAGCC Twentynine Palms
Section 2 Assessment Methods and Results
The following MC loading areas were assessed for groundwater:
Emerson Lake Range I Gays Pass I Range III Gays Pass II Range IV Quackenbush
The surface water and sediment screening assessment was not conducted for seven identified MC loading areas (Acorn, East, Gypsum Ridge, Range II, Sand Hill East, Sand Hill West and West) because these areas were estimated to have low MC loading and are expected to contribute very little MC mass in surface water and sediment to downstream off-range receptor locations. The groundwater screening assessment was not conducted for 24 identified MC loading areas, because these areas were either estimated to have low MC loading or are located outside a drinking water source groundwater sub-basin; therefore, the MC loading areas are not expected to impact potential groundwater receptors.
Brief discussions of the results of surface water, sediment, and groundwater screening-level assessments are presented in the following sections. Results were compared to REVA median method detection limits (MDLs). The median values were determined using MDLs from several laboratories to establish a set of comparison values to identify next steps in the REVA process. MDLs do not represent a regulatory action level but are used within REVA to determine if the predicted concentrations of REVA MC generated from the fate and transport models are detectable. Predicted concentrations exceeding MDLs are recommended for additional review. Parameter values used in the screening assessment are presented in Appendix B. Technical memoranda describing the surface water, sediment, and groundwater screening-level assessments are also provided in Appendix B.
2.3.1 Surface Water Screening-Level Results
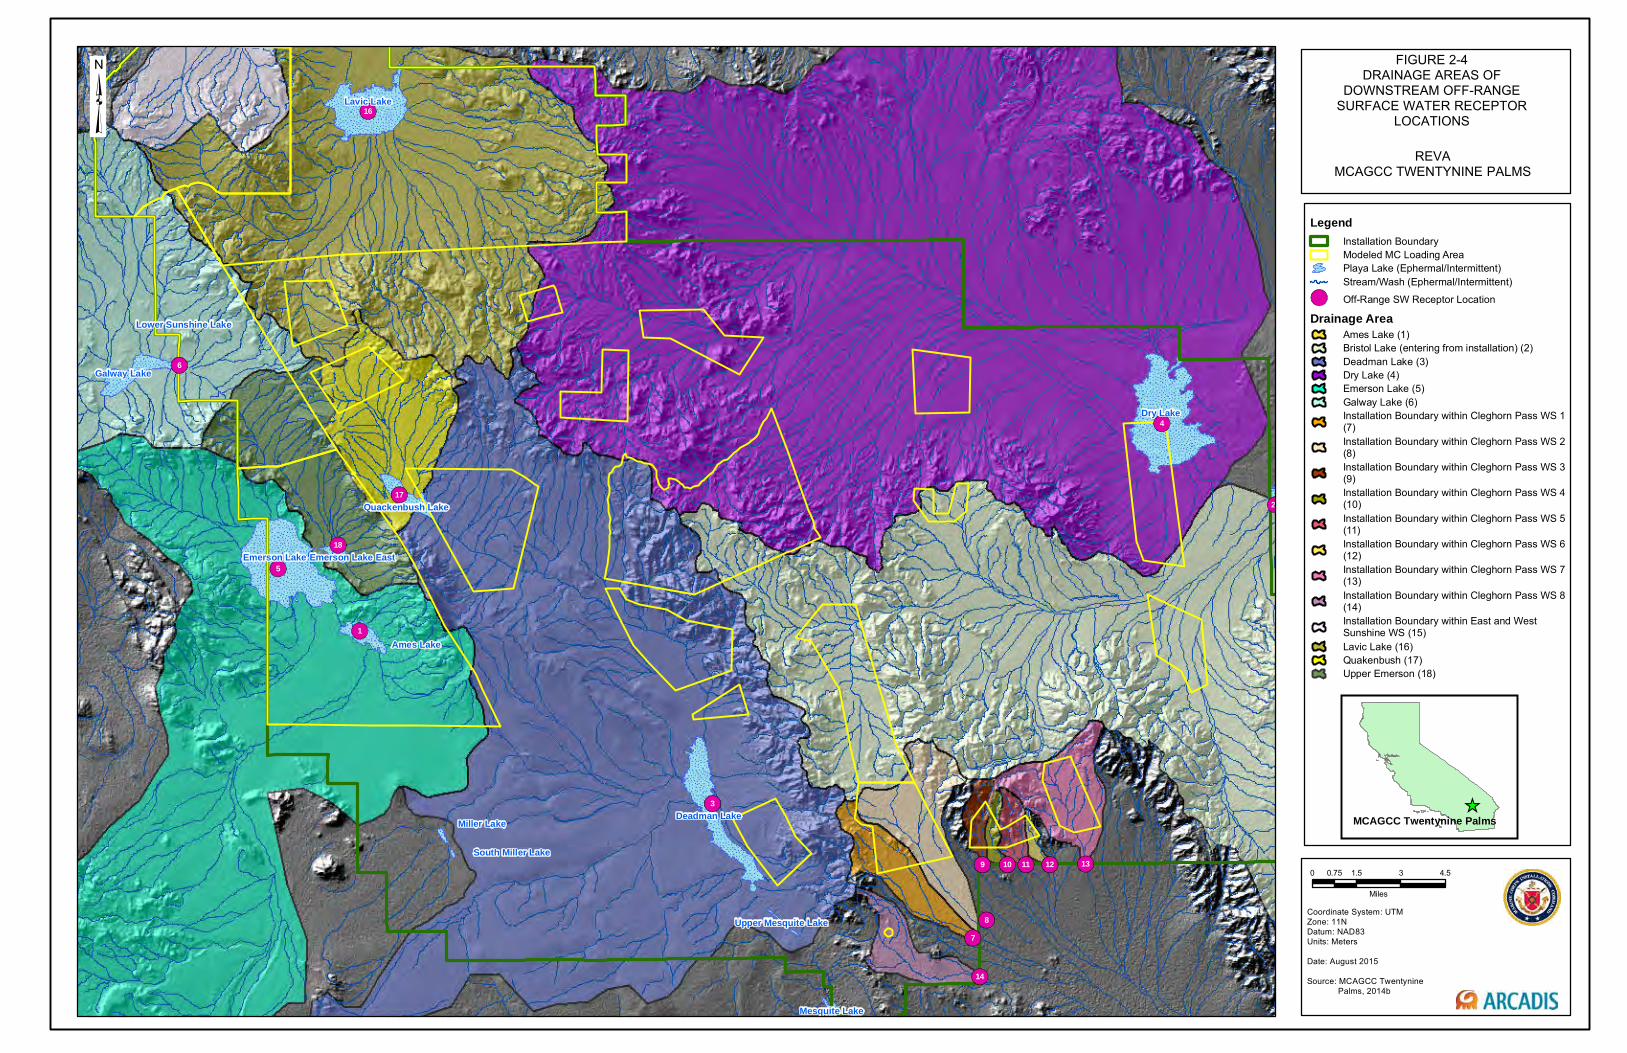
The 24 MC loading areas assessed at MCAGCC Twentynine Palms drain to 18 off-range receptor locations, which include nine playas located within and just outside the installation boundary and nine streams draining off the installation boundary (Figure 2-4). Eight of the nine playas (Ames Dry Lake, Deadman Lake, Dry Lake, Emerson Lake, Galway Lake, Lavic Lake, Quackenbush Lake, and Upper Emerson Lake) are located within the installation boundary, and one (Bristol Lake) is located just outside the installation boundary.
The primary receptors identified for surface water at MCAGCC Twentynine Palms are potential ecological receptors. Although the ephemeral streams and washes that contain water following storm events may represent the closest potential ecological receptor locations, the downgradient off-range locations at the playas (the ultimate drainage end points) and the installation boundary were selected as the modeled receptor locations in order to predict potential off-range releases.
Figure 2-4 shows the MC loading areas in relation to the drainage areas of the 18 off-range receptor locations. A summary of the 18 off-range receptor locations, associated MC loading areas, and the approximate percentage of the MC loading area draining to the off-range receptor locations is provided in Appendix B.
Marine Corps Installations Command REVA Periodic Review MCAGCC Twentynine Palms
2-19
Section 2
Assessment Methods and Results
The REVA screening-level surface water assessment at MCAGCC Twentynine Palms involved 1) estimating the average annual MC concentrations in surface water runoff at the edge of each MC loading area using a multimedia partitioning model to estimate the MC mass partitioned to surface water runoff and 2) conducting a mixing calculation to determine the cumulative contribution of MC from individual MC loading areas draining to an off-range receptor location. This was done by combining MC mass contributed from individual MC loading areas draining to the same downstream off-range receptor location and dividing the total mass by the surface water runoff volume of the receptor location drainage area. A technical memorandum in Appendix B provides further details of this assessment.
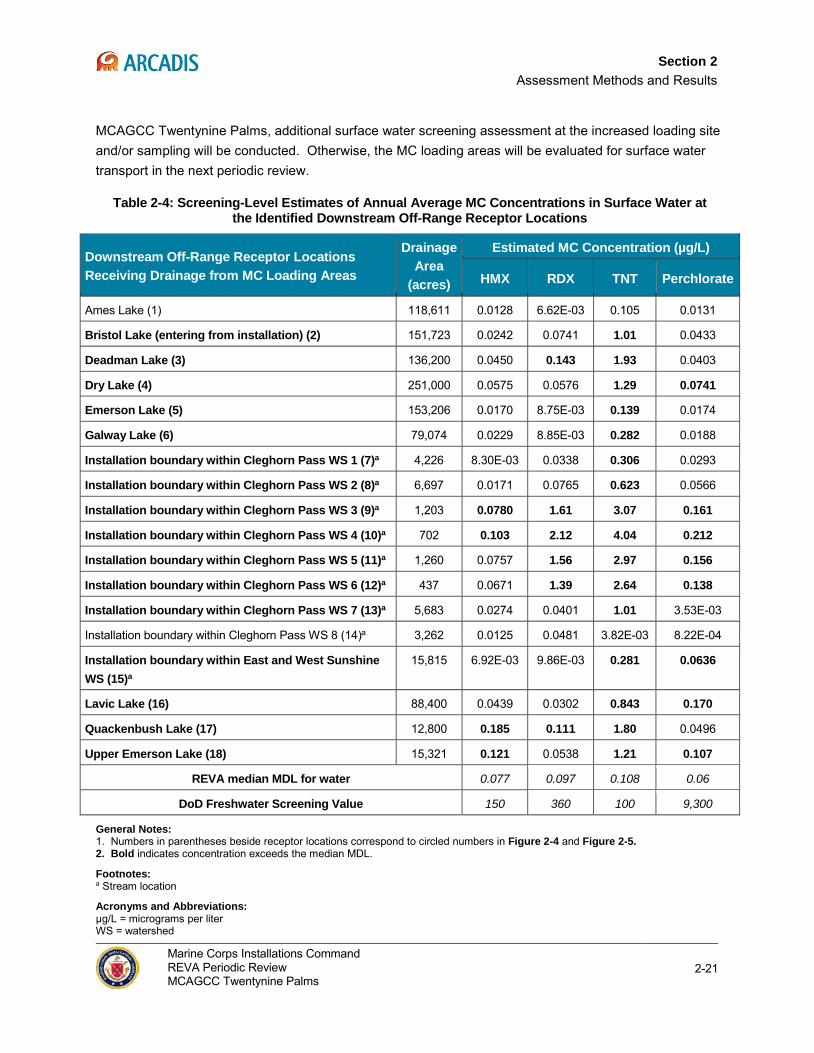
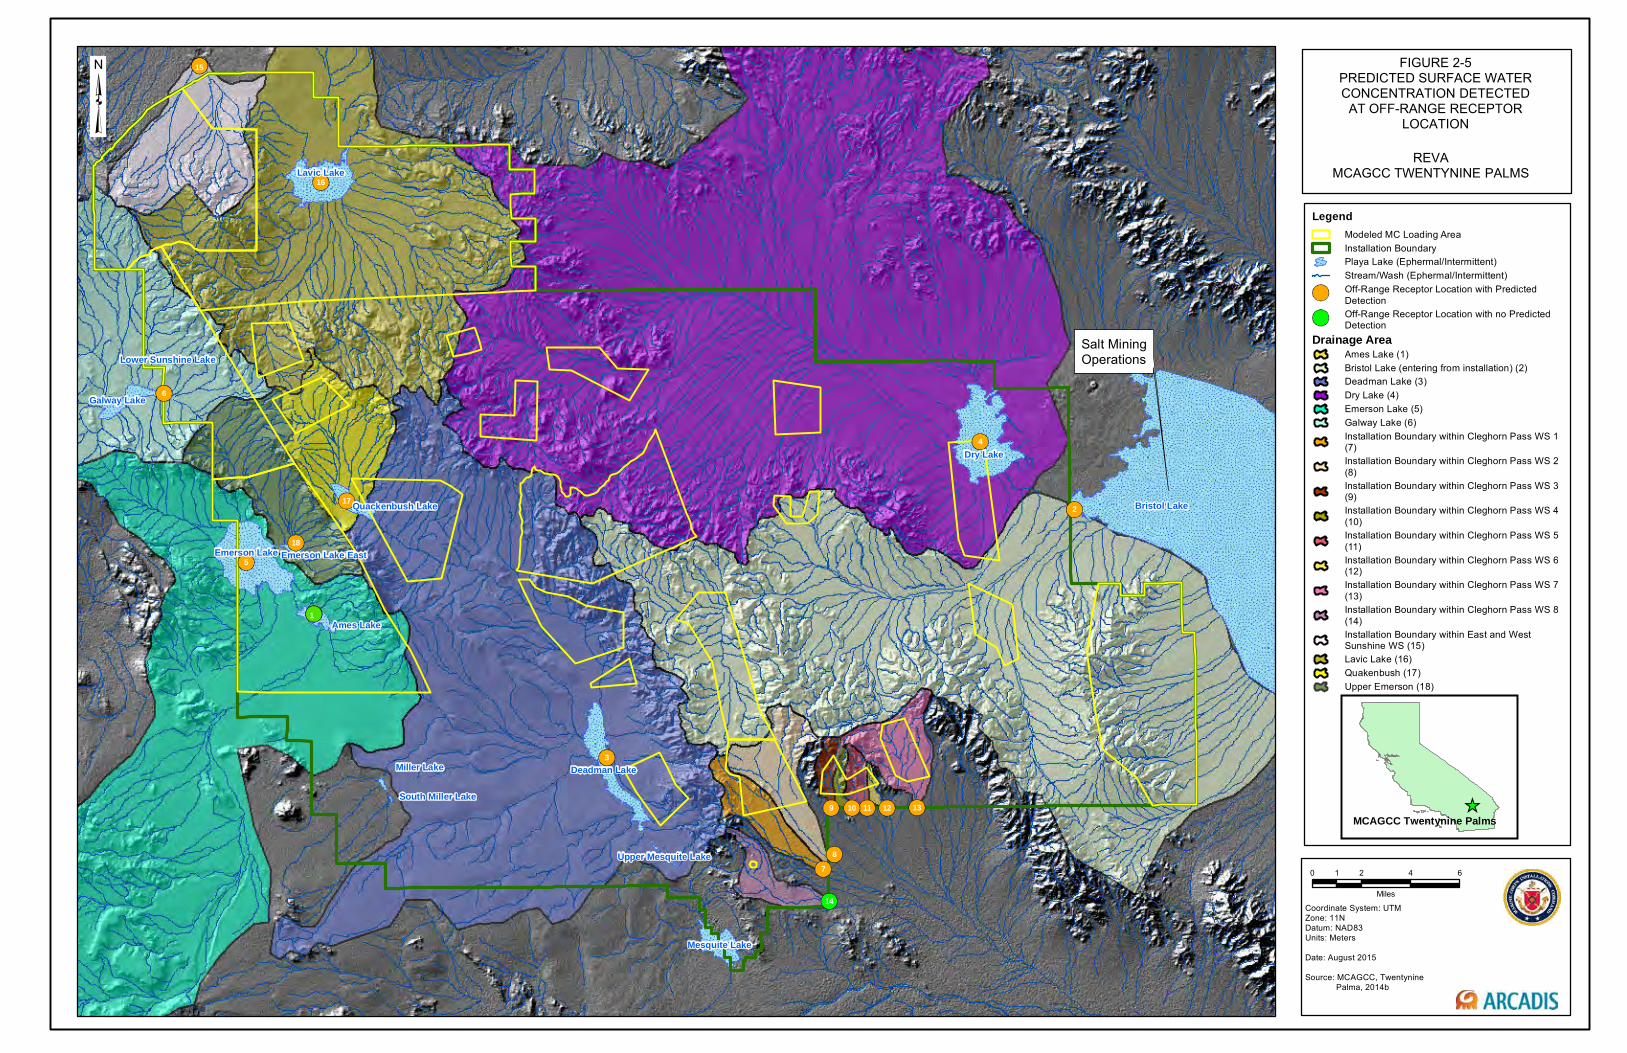
Table 2-4 presents the estimated annual average MC concentrations in surface water at the 18 downstream off-range receptor locations. The off-range receptor locations with a predicted detectable concentration are bolded in Table 2-4 and identified with an orange symbol on Figure 2-5. Results are summarized as follows:
• HMX concentrations were predicted to exceed the median MDL in streams draining within Cleghorn Pass watersheds 3 and 4 at the installation boundary, in Quackenbush Lake, and in Upper Emerson Lake.
• RDX concentrations were predicted to exceed the median MDL in streams draining within Cleghorn Pass watersheds 3, 4, 5, and 6 at the installation boundary, in Deadman Lake, and in Quackenbush Lake. Cleghorn Pass I MC loading area contributes 100% of the RDX mass to streams within Cleghorn Pass watersheds 3, 4, and 5 at the installation boundary.
• TNT concentrations were predicted to exceed the median MDL in streams draining within Cleghorn Pass watersheds 1, 2, 3, 4, 5, 6, 7, and East and West Sunshine watershed at the installation boundary, as well as entering Bristol Lake, Deadman Lake, Dry Lake, Emerson Lake, Galway Lake, Lavic Lake, Quackenbush Lake, and Upper Emerson Lake playas.
• Perchlorate concentrations were predicted to exceed the median MDL in streams draining within Cleghorn Pass watersheds 3, 4, 5, 6, and East and West Sunshine watershed at the installation boundary, in Dry Lake, in Lavic Lake, and in Upper Emerson Lake.
All MC concentrations predicted at the downstream off-range receptor locations were significantly lower than the DoD freshwater screening values used as comparison values. HMX and RDX concentrations are at least two orders of magnitude lower than their respective DoD screening values; TNT concentrations are at least one order of magnitude lower than its DoD screening value; and perchlorate concentrations are at least four orders of magnitude lower than its DoD screening value.
Given the MC concentrations in surface water at the downstream off-range receptor locations were predicted to be significantly lower than the DoD freshwater screening values, potential ecological receptors are unlikely to be adversely impacted by MC release to the waters. Therefore, the MC loading areas are not considered areas of concern for surface water transport at this time, and further surface water assessment is not conducted. However, expenditure data at the MC loading areas of concern will continue to be monitored in order to evaluate changes in continued MC loading through time. If the expenditure data indicate a significant increase in MC loading before the next periodic review assessment for
2-20 Marine Corps Installations Command REVA Periodic Review MCAGCC Twentynine Palms
Section 2 Assessment Methods and Results
MCAGCC Twentynine Palms, additional surface water screening assessment at the increased loading site and/or sampling will be conducted. Otherwise, the MC loading areas will be evaluated for surface water transport in the next periodic review.
Table 2-4: Screening-Level Estimates of Annual Average MC Concentrations in Surface Water at the Identified Downstream Off-Range Receptor Locations
Downstream Off-Range Receptor Locations Receiving Drainage from MC Loading Areas
Drainage Area
(acres)
Estimated MC Concentration (µg/L)
HMX RDX TNT Perchlorate
Ames Lake (1) 118,611 0.0128 6.62E-03 0.105 0.0131
Bristol Lake (entering from installation) (2) 151,723 0.0242 0.0741 1.01 0.0433
Deadman Lake (3) 136,200 0.0450 0.143 1.93 0.0403
Dry Lake (4) 251,000 0.0575 0.0576 1.29 0.0741
Emerson Lake (5) 153,206 0.0170 8.75E-03 0.139 0.0174
Galway Lake (6) 79,074 0.0229 8.85E-03 0.282 0.0188
Installation boundary within Cleghorn Pass WS 1 (7)a 4,226 8.30E-03 0.0338 0.306 0.0293
Installation boundary within Cleghorn Pass WS 2 (8)a 6,697 0.0171 0.0765 0.623 0.0566
Installation boundary within Cleghorn Pass WS 3 (9)a 1,203 0.0780 1.61 3.07 0.161
Installation boundary within Cleghorn Pass WS 4 (10)a 702 0.103 2.12 4.04 0.212
Installation boundary within Cleghorn Pass WS 5 (11)a 1,260 0.0757 1.56 2.97 0.156
Installation boundary within Cleghorn Pass WS 6 (12)a 437 0.0671 1.39 2.64 0.138
Installation boundary within Cleghorn Pass WS 7 (13)a 5,683 0.0274 0.0401 1.01 3.53E-03
Installation boundary within Cleghorn Pass WS 8 (14)a 3,262 0.0125 0.0481 3.82E-03 8.22E-04
Installation boundary within East and West Sunshine WS (15)a
15,815 6.92E-03 9.86E-03 0.281 0.0636
Lavic Lake (16) 88,400 0.0439 0.0302 0.843 0.170
Quackenbush Lake (17) 12,800 0.185 0.111 1.80 0.0496
Upper Emerson Lake (18) 15,321 0.121 0.0538 1.21 0.107
REVA median MDL for water 0.077 0.097 0.108 0.06
DoD Freshwater Screening Value 150 360 100 9,300
General Notes: 1. Numbers in parentheses beside receptor locations correspond to circled numbers in Figure 2-4 and Figure 2-5. 2. Bold indicates concentration exceeds the median MDL.
Footnotes: a Stream location
Acronyms and Abbreviations: µg/L = micrograms per liter WS = watershed
Marine Corps Installations Command REVA Periodic Review MCAGCC Twentynine Palms
2-21
Section 2
Assessment Methods and Results
This page intentionally left blank
2-22 Marine Corps Installations Command REVA Periodic Review MCAGCC Twentynine Palms
Salt MiningOperations
Ames Lake
Miller Lake
South Miller Lake
1
3
2
4
5
6
7
9
8
10 11 12 13
14
16
17
18
Dry Lake
Emerson Lake
Lavic Lake
Deadman Lake
Galway Lake
Quackenbush Lake
Mesquite Lake
Emerson Lake East
Upper Mesquite Lake
Lower Sunshine Lake
FIGURE 2-4DRAINAGE AREAS OF
DOWNSTREAM OFF-RANGE SURFACE WATER RECEPTOR
LOCATIONS
Coordinate System: UTM Zone: 11NDatum: NAD83Units: Meters
Date: August 2015
Source: MCAGCC Twentynine Palms, 2014b
MCAGCC Twentynine Palms
0 1.5 3 4.50.75
Miles
REVAMCAGCC TWENTYNINE PALMS
LegendInstallation BoundaryModeled MC Loading AreaPlaya Lake (Ephermal/Intermittent)Stream/Wash (Ephermal/Intermittent)
Off-Range SW Receptor Location
Drainage AreaAmes Lake (1)Bristol Lake (entering from installation) (2)Deadman Lake (3)Dry Lake (4)Emerson Lake (5)Galway Lake (6)Installation Boundary within Cleghorn Pass WS 1(7)Installation Boundary within Cleghorn Pass WS 2(8)Installation Boundary within Cleghorn Pass WS 3(9)Installation Boundary within Cleghorn Pass WS 4(10)Installation Boundary within Cleghorn Pass WS 5(11)Installation Boundary within Cleghorn Pass WS 6(12)Installation Boundary within Cleghorn Pass WS 7(13)Installation Boundary within Cleghorn Pass WS 8(14)Installation Boundary within East and WestSunshine WS (15)Lavic Lake (16)Quakenbush (17)Upper Emerson (18)

Salt MiningOperations
1
15
Bristol Lake
Ames Lake
Miller Lake
South Miller Lake
3
2
4
5
6
7
9
8
10 11 12 13
14
16
17
18
Dry Lake
Emerson Lake
Lavic Lake
Deadman Lake
Mesquite Lake
Galway Lake
Quackenbush Lake
Emerson Lake East
Upper Mesquite Lake
Lower Sunshine Lake
FIGURE 2-5PREDICTED SURFACE WATER CONCENTRATION DETECTED
AT OFF-RANGE RECEPTOR LOCATION
Coordinate System: UTM Zone: 11NDatum: NAD83Units: Meters
Date: August 2015
Source: MCAGCC, Twentynine Palma, 2014b
MCAGCC Twentynine Palms
0 2 4 61
Miles
REVAMCAGCC TWENTYNINE PALMS
LegendModeled MC Loading AreaInstallation BoundaryPlaya Lake (Ephermal/Intermittent)Stream/Wash (Ephermal/Intermittent)Off-Range Receptor Location with PredictedDetectionOff-Range Receptor Location with no PredictedDetection
Drainage AreaAmes Lake (1)Bristol Lake (entering from installation) (2)Deadman Lake (3)Dry Lake (4)Emerson Lake (5)Galway Lake (6)Installation Boundary within Cleghorn Pass WS 1(7)Installation Boundary within Cleghorn Pass WS 2(8)Installation Boundary within Cleghorn Pass WS 3(9)Installation Boundary within Cleghorn Pass WS 4(10)Installation Boundary within Cleghorn Pass WS 5(11)Installation Boundary within Cleghorn Pass WS 6(12)Installation Boundary within Cleghorn Pass WS 7(13)Installation Boundary within Cleghorn Pass WS 8(14)Installation Boundary within East and WestSunshine WS (15)Lavic Lake (16)Quakenbush (17)Upper Emerson (18)
Section 2 Assessment Methods and Results
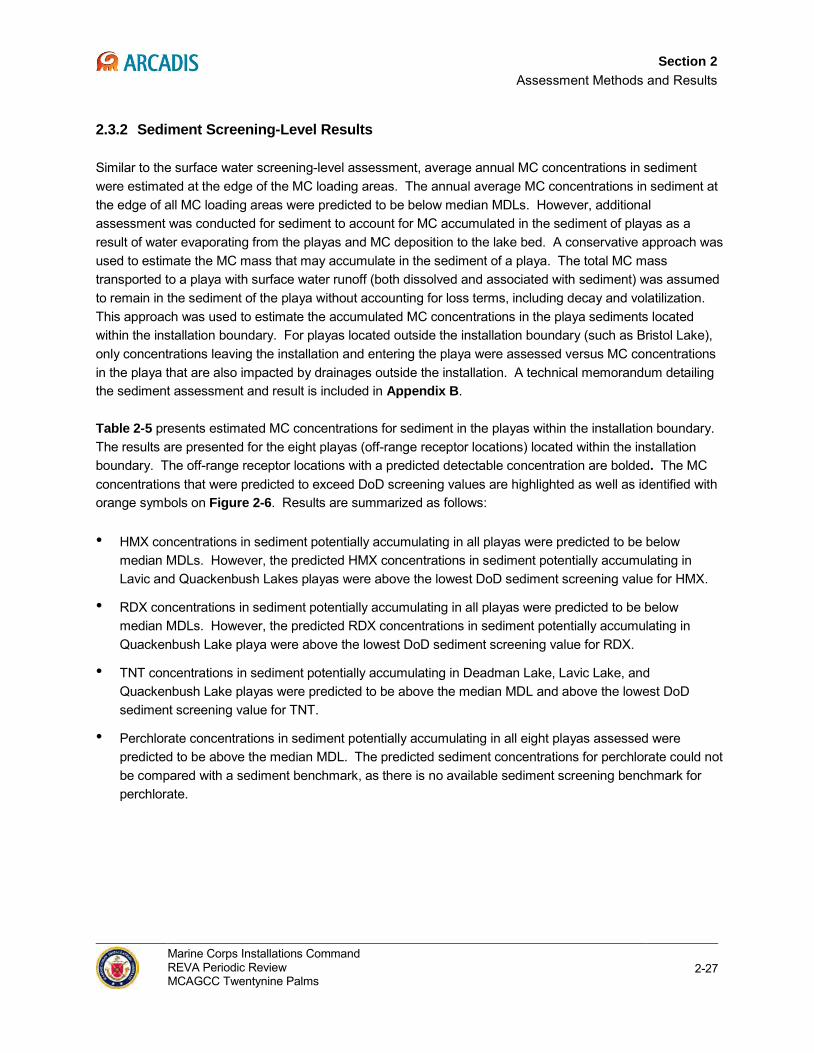
2.3.2 Sediment Screening-Level Results
Similar to the surface water screening-level assessment, average annual MC concentrations in sediment were estimated at the edge of the MC loading areas. The annual average MC concentrations in sediment at the edge of all MC loading areas were predicted to be below median MDLs. However, additional assessment was conducted for sediment to account for MC accumulated in the sediment of playas as a result of water evaporating from the playas and MC deposition to the lake bed. A conservative approach was used to estimate the MC mass that may accumulate in the sediment of a playa. The total MC mass transported to a playa with surface water runoff (both dissolved and associated with sediment) was assumed to remain in the sediment of the playa without accounting for loss terms, including decay and volatilization. This approach was used to estimate the accumulated MC concentrations in the playa sediments located within the installation boundary. For playas located outside the installation boundary (such as Bristol Lake), only concentrations leaving the installation and entering the playa were assessed versus MC concentrations in the playa that are also impacted by drainages outside the installation. A technical memorandum detailing the sediment assessment and result is included in Appendix B.
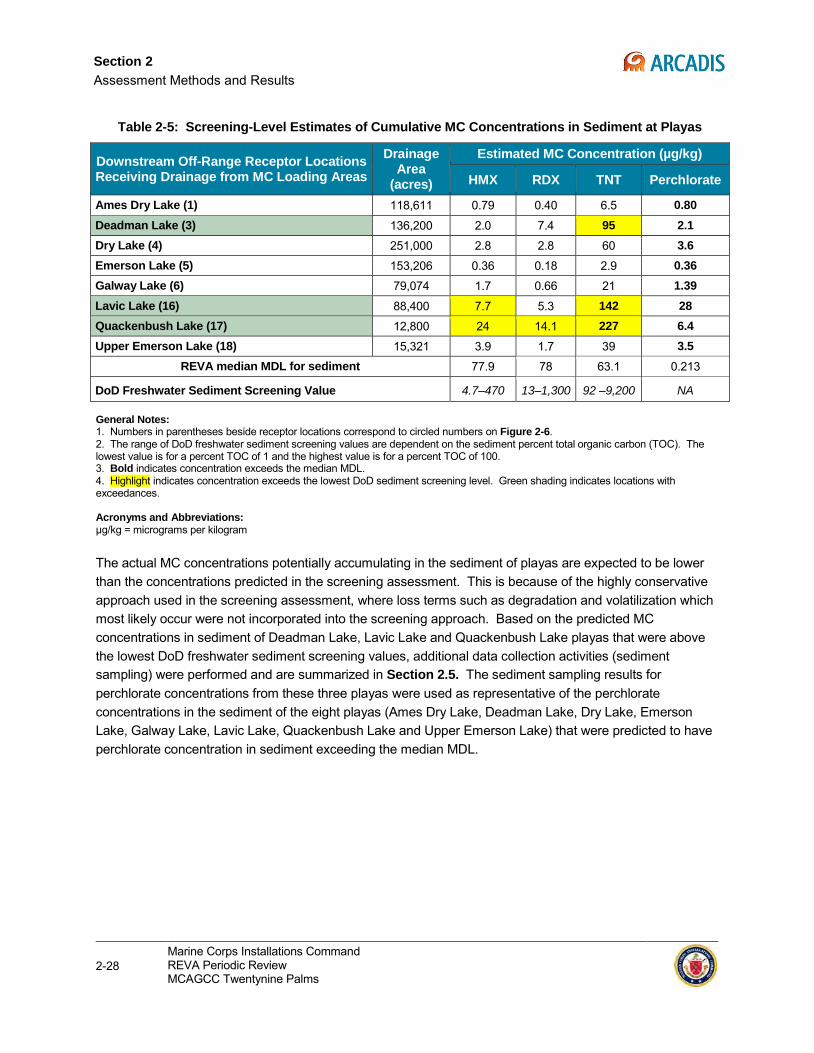
Table 2-5 presents estimated MC concentrations for sediment in the playas within the installation boundary. The results are presented for the eight playas (off-range receptor locations) located within the installation boundary. The off-range receptor locations with a predicted detectable concentration are bolded. The MC concentrations that were predicted to exceed DoD screening values are highlighted as well as identified with orange symbols on Figure 2-6. Results are summarized as follows:
• HMX concentrations in sediment potentially accumulating in all playas were predicted to be below median MDLs. However, the predicted HMX concentrations in sediment potentially accumulating in Lavic and Quackenbush Lakes playas were above the lowest DoD sediment screening value for HMX.
• RDX concentrations in sediment potentially accumulating in all playas were predicted to be below median MDLs. However, the predicted RDX concentrations in sediment potentially accumulating in Quackenbush Lake playa were above the lowest DoD sediment screening value for RDX.
• TNT concentrations in sediment potentially accumulating in Deadman Lake, Lavic Lake, and Quackenbush Lake playas were predicted to be above the median MDL and above the lowest DoD sediment screening value for TNT.
• Perchlorate concentrations in sediment potentially accumulating in all eight playas assessed were predicted to be above the median MDL. The predicted sediment concentrations for perchlorate could not be compared with a sediment benchmark, as there is no available sediment screening benchmark for perchlorate.
Marine Corps Installations Command REVA Periodic Review MCAGCC Twentynine Palms
2-27
Section 2
Assessment Methods and Results
Table 2-5: Screening-Level Estimates of Cumulative MC Concentrations in Sediment at Playas
Downstream Off-Range Receptor Locations Receiving Drainage from MC Loading Areas
Drainage Area
(acres)
Estimated MC Concentration (µg/kg)
HMX RDX TNT Perchlorate
Ames Dry Lake (1) 118,611 0.79 0.40 6.5 0.80 Deadman Lake (3) 136,200 2.0 7.4 95 2.1 Dry Lake (4) 251,000 2.8 2.8 60 3.6 Emerson Lake (5) 153,206 0.36 0.18 2.9 0.36 Galway Lake (6) 79,074 1.7 0.66 21 1.39 Lavic Lake (16) 88,400 7.7 5.3 142 28 Quackenbush Lake (17) 12,800 24 14.1 227 6.4 Upper Emerson Lake (18) 15,321 3.9 1.7 39 3.5
REVA median MDL for sediment 77.9 78 63.1 0.213
DoD Freshwater Sediment Screening Value 4.7–470 13–1,300 92 –9,200 NA
General Notes: 1. Numbers in parentheses beside receptor locations correspond to circled numbers on Figure 2-6. 2. The range of DoD freshwater sediment screening values are dependent on the sediment percent total organic carbon (TOC). The lowest value is for a percent TOC of 1 and the highest value is for a percent TOC of 100. 3. Bold indicates concentration exceeds the median MDL. 4. Highlight indicates concentration exceeds the lowest DoD sediment screening level. Green shading indicates locations with exceedances. Acronyms and Abbreviations: µg/kg = micrograms per kilogram
The actual MC concentrations potentially accumulating in the sediment of playas are expected to be lower than the concentrations predicted in the screening assessment. This is because of the highly conservative approach used in the screening assessment, where loss terms such as degradation and volatilization which most likely occur were not incorporated into the screening approach. Based on the predicted MC concentrations in sediment of Deadman Lake, Lavic Lake and Quackenbush Lake playas that were above the lowest DoD freshwater sediment screening values, additional data collection activities (sediment sampling) were performed and are summarized in Section 2.5. The sediment sampling results for perchlorate concentrations from these three playas were used as representative of the perchlorate concentrations in the sediment of the eight playas (Ames Dry Lake, Deadman Lake, Dry Lake, Emerson Lake, Galway Lake, Lavic Lake, Quackenbush Lake and Upper Emerson Lake) that were predicted to have perchlorate concentration in sediment exceeding the median MDL.
2-28 Marine Corps Installations Command REVA Periodic Review MCAGCC Twentynine Palms
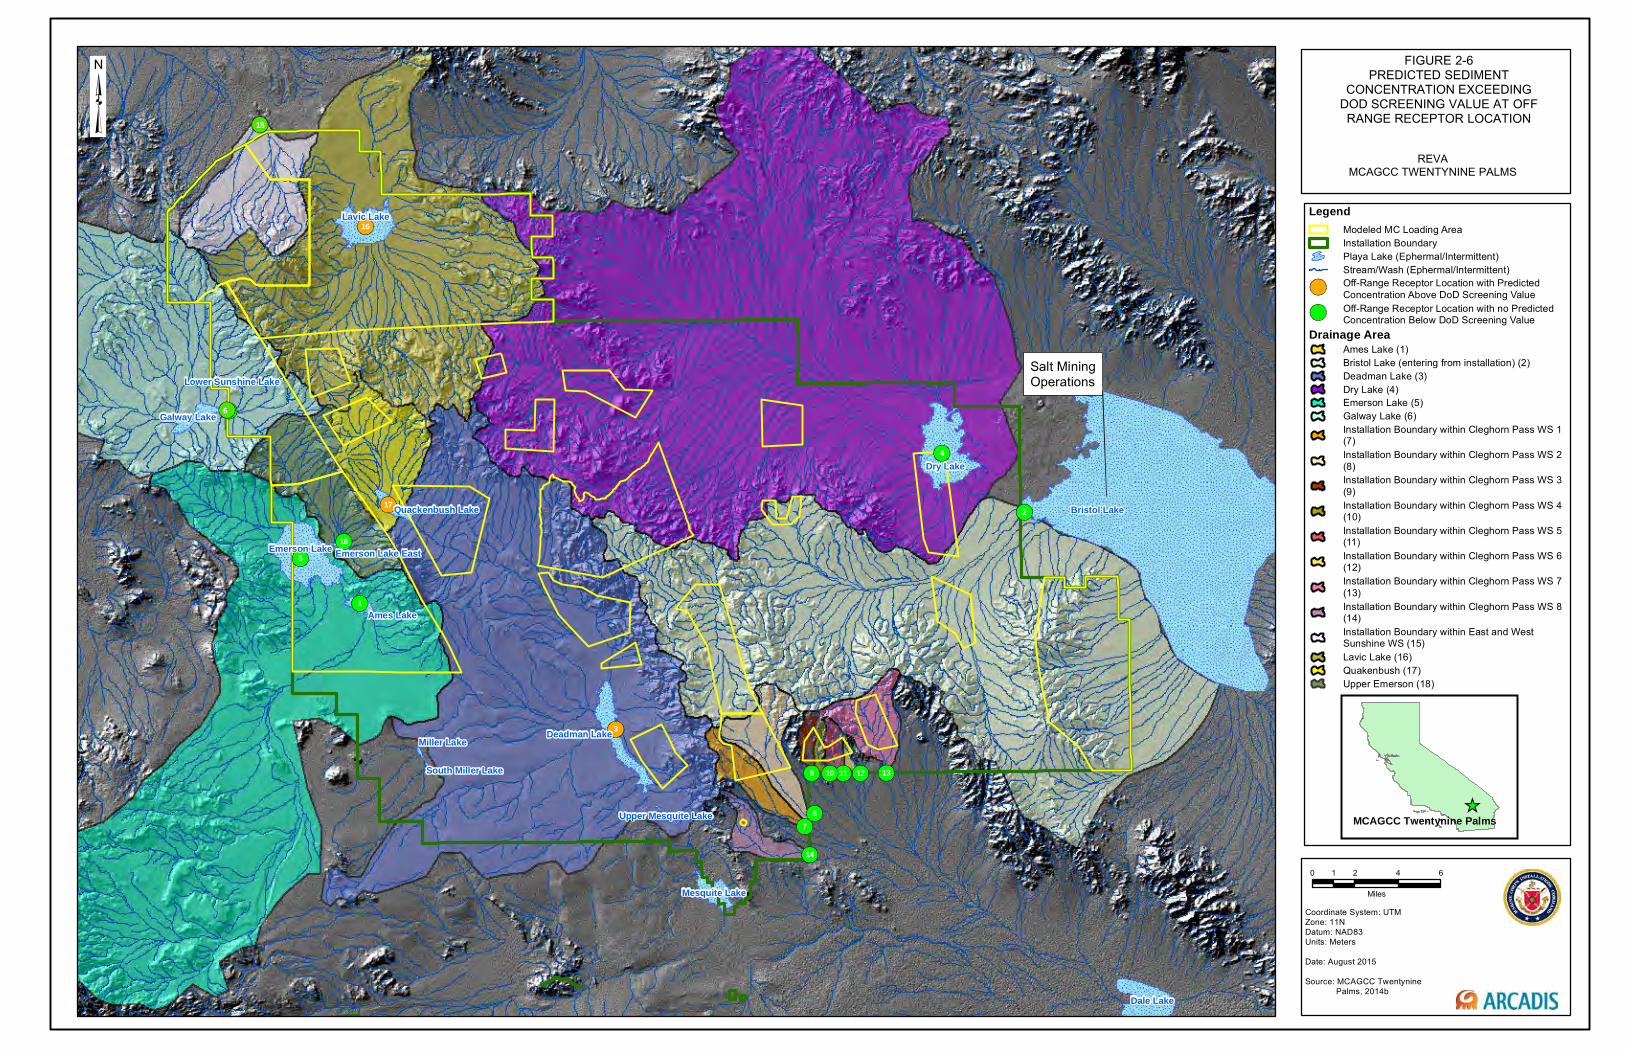
Salt MiningOperations
6
15
Bristol Lake
Ames Lake
Miller Lake
South Miller Lake
1
3
2
4
5
7
9
8
10 11 12 13
14
16
17
18
Dale Lake
Dry Lake
Emerson Lake
Lavic Lake
Deadman Lake
Mesquite Lake
Galway Lake
Quackenbush Lake
Emerson Lake East
Upper Mesquite Lake
Lower Sunshine Lake
FIGURE 2-6PREDICTED SEDIMENT
CONCENTRATION EXCEEDING DOD SCREENING VALUE AT OFF RANGE RECEPTOR LOCATION
Coordinate System: UTM Zone: 11NDatum: NAD83Units: Meters
Date: August 2015
Source: MCAGCC Twentynine Palms, 2014b
MCAGCC Twentynine Palms
0 2 4 61
Miles
REVAMCAGCC TWENTYNINE PALMS
LegendModeled MC Loading AreaInstallation BoundaryPlaya Lake (Ephermal/Intermittent)Stream/Wash (Ephermal/Intermittent)Off-Range Receptor Location with PredictedConcentration Above DoD Screening ValueOff-Range Receptor Location with no PredictedConcentration Below DoD Screening Value
Drainage AreaAmes Lake (1)Bristol Lake (entering from installation) (2)Deadman Lake (3)Dry Lake (4)Emerson Lake (5)Galway Lake (6)Installation Boundary within Cleghorn Pass WS 1(7)Installation Boundary within Cleghorn Pass WS 2(8)Installation Boundary within Cleghorn Pass WS 3(9)Installation Boundary within Cleghorn Pass WS 4(10)Installation Boundary within Cleghorn Pass WS 5(11)Installation Boundary within Cleghorn Pass WS 6(12)Installation Boundary within Cleghorn Pass WS 7(13)Installation Boundary within Cleghorn Pass WS 8(14)Installation Boundary within East and WestSunshine WS (15)Lavic Lake (16)Quakenbush (17)Upper Emerson (18)
Section 2 Assessment Methods and Results
2.3.3 Groundwater Screening-Level Results
The groundwater screening-level assessment was conducted for seven MC loading areas located within the Deadman Lake and the Surprise Spring groundwater sub-basins that are future and existing drinking water sources. The REVA screening-level groundwater assessment at MCAGCC Twentynine Palms was a two-step process: 1) determine maximum MC concentrations in infiltrating water at each MC loading area assessed and 2) model the potential for MC to migrate from the MC loading areas vertically through the vadose zone to groundwater in the water-bearing units of the Deadman Lake and Surprise Spring sub-basins. This two-step process was applied to two different scenarios in order to address recharge that potentially occurs at the MC loading areas. The scenarios include 1) direct recharge from the portion of precipitation that falls on the MC loading areas and 2) preferential recharge in and around stream beds and local depressions, where runoff and standing water are concentrated.
At each step of the screening assessment process, the predicted MC concentrations were compared to median MDL values. Only MC exceeding median MDLs from the first step of the screening assessment were carried forward to the next step of the assessment. In the second step of the assessment, only MC exceeding median MDLs within a 30-year timeframe required further assessment involving screening-level modeling in the saturated zone to evaluate the potential for MC in groundwater to reach the existing and future water supply wells from the MC loading areas. The screening-level modeling in the saturated zone to evaluate MC transport to water supply wells was not conducted because MC were not predicted to reach the groundwater at concentrations exceeding median MDLs within a 30-year timeframe (from step 2 of the screening assessment process. The assessment methods of the two-step process are described in detail in the REVA Five-Year Review Manual (HQMC 2010). A technical memorandum detailing the groundwater assessment and results is provided in Appendix B.
Scenario 1 of the assessment, which accounts for direct recharge from the portion of precipitation that falls on the MC loading areas, leads to lower recharge (slower movement) and higher MC concentration. Scenario 2, which accounts for preferential recharge that constitutes a smaller proportion of the MC loading areas, leads to higher recharge (more rapid movement) and lower MC concentrations. Based on step 1 of the screening assessment, the results indicated the following:
• All MC (HMX, RDX, TNT, and perchlorate), with the exception of HMX at Range IV MC loading area, were estimated to have concentrations in recharge water above their respective median MDLs at MC loading areas assessed in Scenario 1.
• All MC, with the exception of HMX at Range IV MC loading area and perchlorate at Range I MC loading area, were estimated to have concentrations in recharge water above their respective median MDLs at MC loading areas assessed in Scenario 2.
As a result, all MC at the loading areas (except HMX at Range IV MC loading area for Scenario 1 and Scenario 2 and perchlorate at Range I MC loading area for Scenario 2) were modeled for migration through the vadose zone in step 2 of the screening assessment.
Based on the vadose zone modeling conducted in step 2 of the screening assessment, concentrations of HMX, RDX, and TNT were predicted to degrade to below their respective median MDL values before
Marine Corps Installations Command REVA Periodic Review MCAGCC Twentynine Palms
2-31
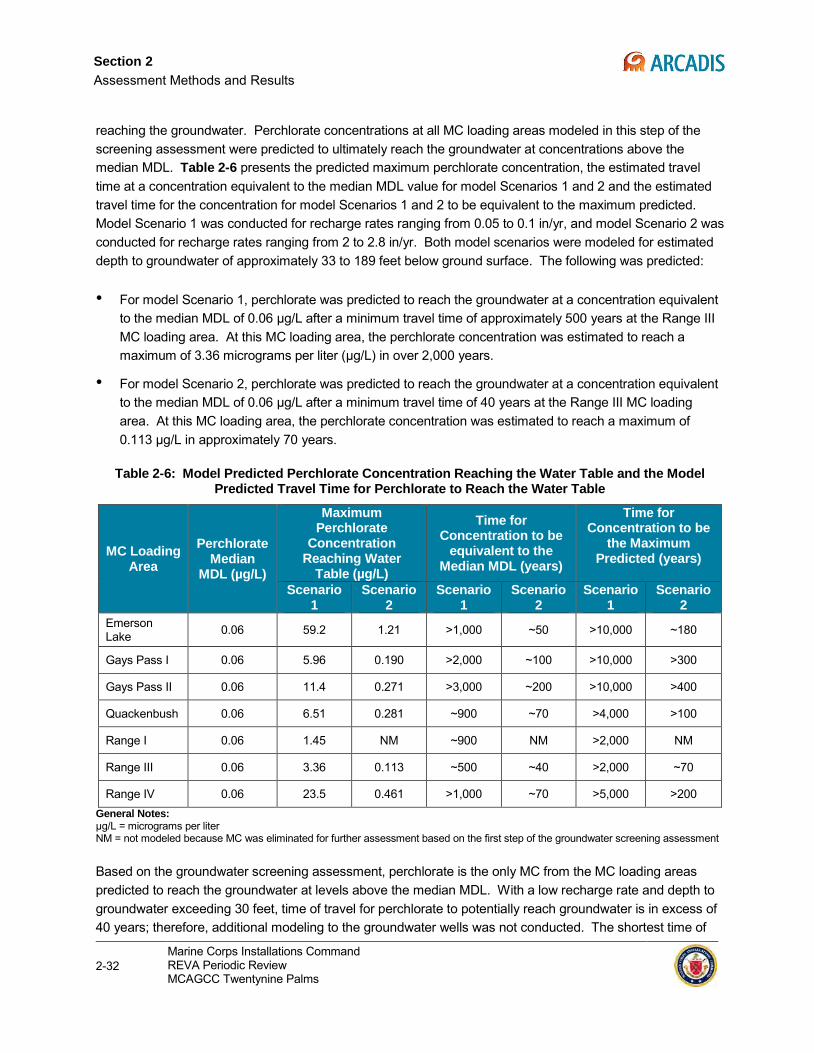
Section 2
Assessment Methods and Results
reaching the groundwater. Perchlorate concentrations at all MC loading areas modeled in this step of the screening assessment were predicted to ultimately reach the groundwater at concentrations above the median MDL. Table 2-6 presents the predicted maximum perchlorate concentration, the estimated travel time at a concentration equivalent to the median MDL value for model Scenarios 1 and 2 and the estimated travel time for the concentration for model Scenarios 1 and 2 to be equivalent to the maximum predicted. Model Scenario 1 was conducted for recharge rates ranging from 0.05 to 0.1 in/yr, and model Scenario 2 was conducted for recharge rates ranging from 2 to 2.8 in/yr. Both model scenarios were modeled for estimated depth to groundwater of approximately 33 to 189 feet below ground surface. The following was predicted:
• For model Scenario 1, perchlorate was predicted to reach the groundwater at a concentration equivalent to the median MDL of 0.06 µg/L after a minimum travel time of approximately 500 years at the Range III MC loading area. At this MC loading area, the perchlorate concentration was estimated to reach a maximum of 3.36 micrograms per liter (µg/L) in over 2,000 years.
• For model Scenario 2, perchlorate was predicted to reach the groundwater at a concentration equivalent to the median MDL of 0.06 µg/L after a minimum travel time of 40 years at the Range III MC loading area. At this MC loading area, the perchlorate concentration was estimated to reach a maximum of 0.113 µg/L in approximately 70 years.
Table 2-6: Model Predicted Perchlorate Concentration Reaching the Water Table and the Model Predicted Travel Time for Perchlorate to Reach the Water Table
MC Loading Area
Perchlorate Median
MDL (µg/L)
Maximum Perchlorate
Concentration Reaching Water
Table (µg/L)
Time for Concentration to be
equivalent to the Median MDL (years)
Time for Concentration to be
the Maximum Predicted (years)
Scenario 1
Scenario 2
Scenario 1
Scenario 2
Scenario 1
Scenario 2
Emerson Lake 0.06 59.2 1.21 >1,000 ~50 >10,000 ~180
Gays Pass I 0.06 5.96 0.190 >2,000 ~100 >10,000 >300
Gays Pass II 0.06 11.4 0.271 >3,000 ~200 >10,000 >400
Quackenbush 0.06 6.51 0.281 ~900 ~70 >4,000 >100
Range I 0.06 1.45 NM ~900 NM >2,000 NM
Range III 0.06 3.36 0.113 ~500 ~40 >2,000 ~70
Range IV 0.06 23.5 0.461 >1,000 ~70 >5,000 >200 General Notes: µg/L = micrograms per liter NM = not modeled because MC was eliminated for further assessment based on the first step of the groundwater screening assessment
Based on the groundwater screening assessment, perchlorate is the only MC from the MC loading areas predicted to reach the groundwater at levels above the median MDL. With a low recharge rate and depth to groundwater exceeding 30 feet, time of travel for perchlorate to potentially reach groundwater is in excess of 40 years; therefore, additional modeling to the groundwater wells was not conducted. The shortest time of
2-32 Marine Corps Installations Command REVA Periodic Review MCAGCC Twentynine Palms
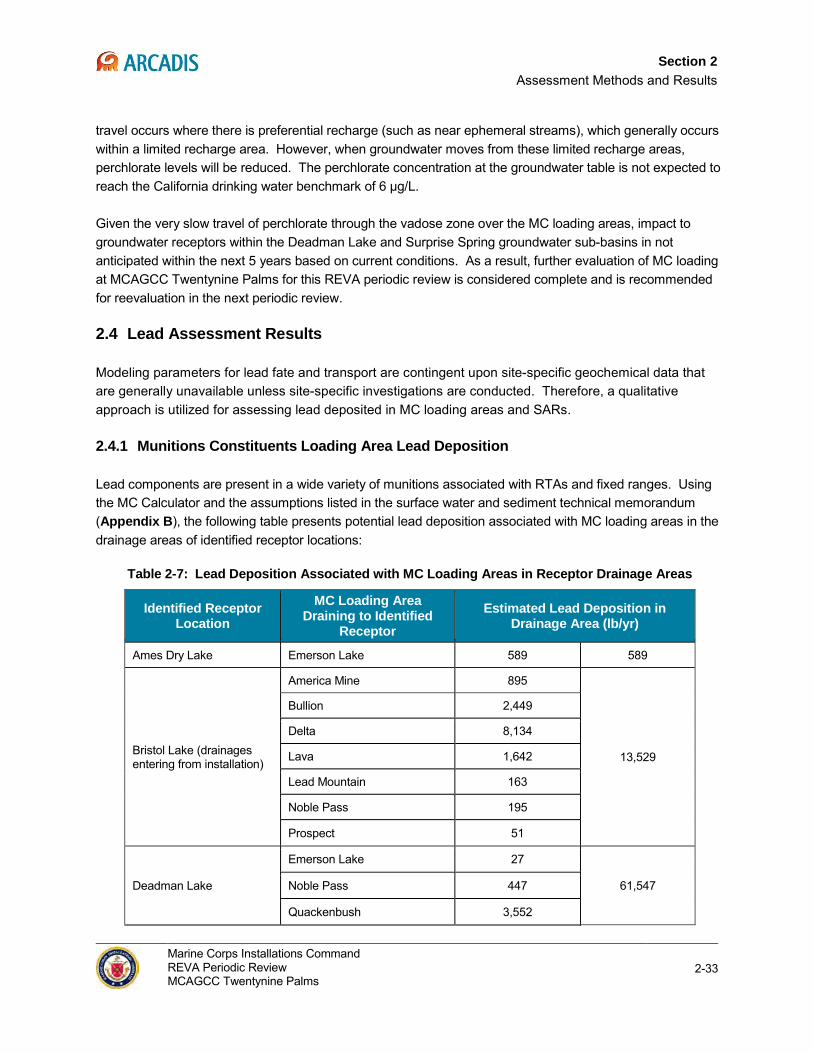
Section 2 Assessment Methods and Results
travel occurs where there is preferential recharge (such as near ephemeral streams), which generally occurs within a limited recharge area. However, when groundwater moves from these limited recharge areas, perchlorate levels will be reduced. The perchlorate concentration at the groundwater table is not expected to reach the California drinking water benchmark of 6 µg/L.
Given the very slow travel of perchlorate through the vadose zone over the MC loading areas, impact to groundwater receptors within the Deadman Lake and Surprise Spring groundwater sub-basins in not anticipated within the next 5 years based on current conditions. As a result, further evaluation of MC loading at MCAGCC Twentynine Palms for this REVA periodic review is considered complete and is recommended for reevaluation in the next periodic review.
2.4 Lead Assessment Results
Modeling parameters for lead fate and transport are contingent upon site-specific geochemical data that are generally unavailable unless site-specific investigations are conducted. Therefore, a qualitative approach is utilized for assessing lead deposited in MC loading areas and SARs.
2.4.1 Munitions Constituents Loading Area Lead Deposition
Lead components are present in a wide variety of munitions associated with RTAs and fixed ranges. Using the MC Calculator and the assumptions listed in the surface water and sediment technical memorandum (Appendix B), the following table presents potential lead deposition associated with MC loading areas in the drainage areas of identified receptor locations:
Table 2-7: Lead Deposition Associated with MC Loading Areas in Receptor Drainage Areas
Identified Receptor Location
MC Loading Area Draining to Identified
Receptor Estimated Lead Deposition in
Drainage Area (lb/yr)
Ames Dry Lake Emerson Lake 589 589
Bristol Lake (drainages entering from installation)
America Mine 895
13,529
Bullion 2,449
Delta 8,134
Lava 1,642
Lead Mountain 163
Noble Pass 195
Prospect 51
Deadman Lake
Emerson Lake 27
61,547 Noble Pass 447
Quackenbush 3,552
Marine Corps Installations Command REVA Periodic Review MCAGCC Twentynine Palms
2-33
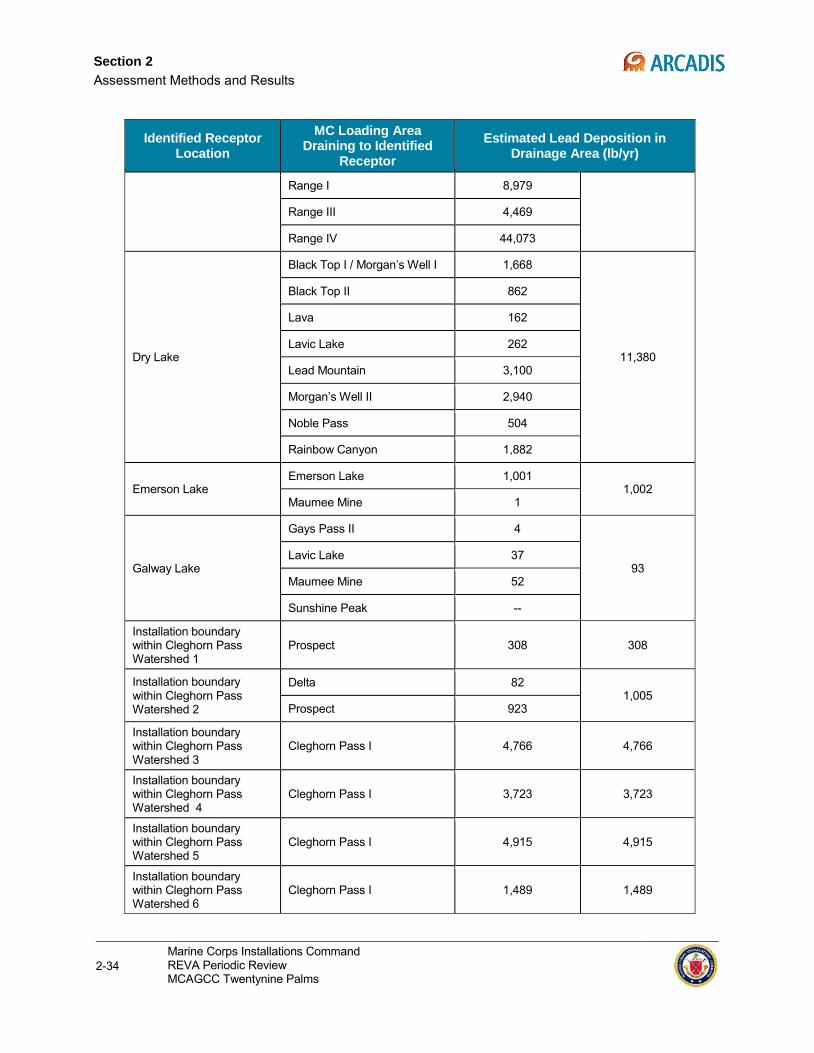
Section 2
Assessment Methods and Results
Identified Receptor Location
MC Loading Area Draining to Identified
Receptor Estimated Lead Deposition in
Drainage Area (lb/yr)
Range I 8,979
Range III 4,469
Range IV 44,073
Dry Lake
Black Top I / Morgan’s Well I 1,668
11,380
Black Top II 862
Lava 162
Lavic Lake 262
Lead Mountain 3,100
Morgan’s Well II 2,940
Noble Pass 504
Rainbow Canyon 1,882
Emerson Lake Emerson Lake 1,001
1,002 Maumee Mine 1
Galway Lake
Gays Pass II 4
93 Lavic Lake 37
Maumee Mine 52
Sunshine Peak --
Installation boundary within Cleghorn Pass Watershed 1
Prospect 308 308
Installation boundary within Cleghorn Pass Watershed 2
Delta 82 1,005
Prospect 923
Installation boundary within Cleghorn Pass Watershed 3
Cleghorn Pass I 4,766 4,766
Installation boundary within Cleghorn Pass Watershed 4
Cleghorn Pass I 3,723 3,723
Installation boundary within Cleghorn Pass Watershed 5
Cleghorn Pass I 4,915 4,915
Installation boundary within Cleghorn Pass Watershed 6
Cleghorn Pass I 1,489 1,489
2-34 Marine Corps Installations Command REVA Periodic Review MCAGCC Twentynine Palms
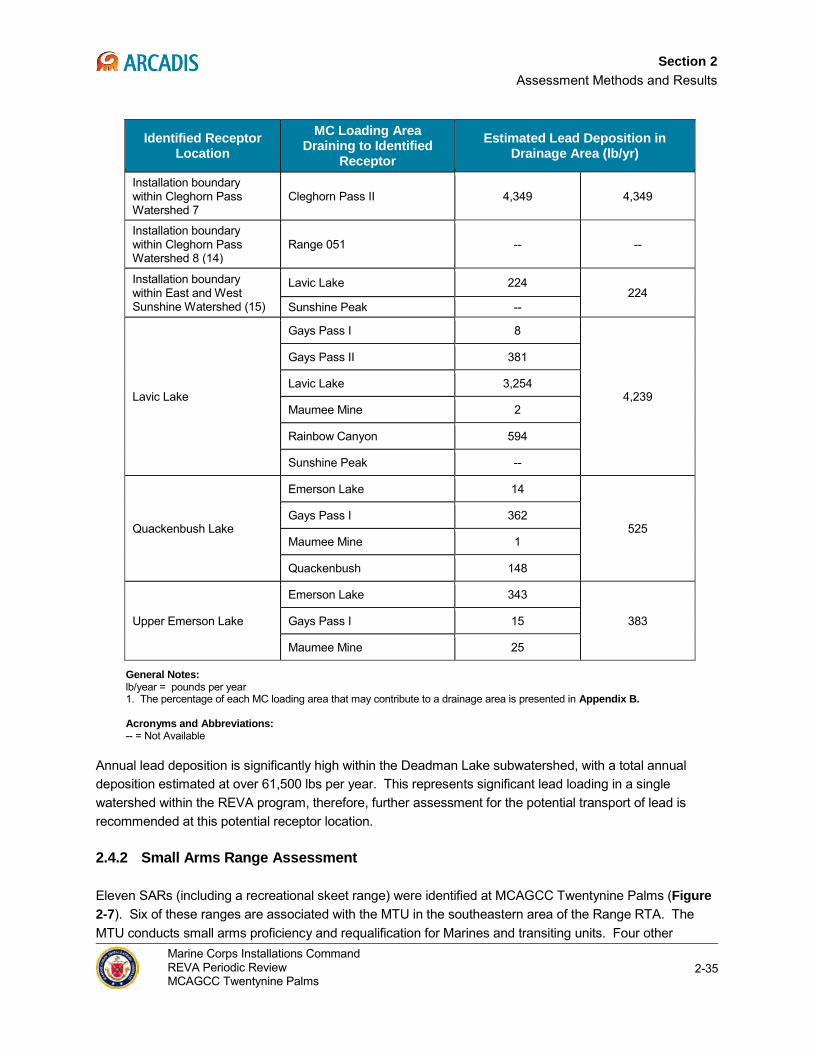
Section 2 Assessment Methods and Results
Identified Receptor Location
MC Loading Area Draining to Identified
Receptor Estimated Lead Deposition in
Drainage Area (lb/yr)
Installation boundary within Cleghorn Pass Watershed 7
Cleghorn Pass II 4,349 4,349
Installation boundary within Cleghorn Pass Watershed 8 (14)
Range 051 -- --
Installation boundary within East and West Sunshine Watershed (15)
Lavic Lake 224 224
Sunshine Peak --
Lavic Lake
Gays Pass I 8
4,239
Gays Pass II 381
Lavic Lake 3,254
Maumee Mine 2
Rainbow Canyon 594
Sunshine Peak --
Quackenbush Lake
Emerson Lake 14
525 Gays Pass I 362
Maumee Mine 1
Quackenbush 148
Upper Emerson Lake
Emerson Lake 343
383 Gays Pass I 15
Maumee Mine 25
General Notes: lb/year = pounds per year 1. The percentage of each MC loading area that may contribute to a drainage area is presented in Appendix B. Acronyms and Abbreviations: -- = Not Available
Annual lead deposition is significantly high within the Deadman Lake subwatershed, with a total annual deposition estimated at over 61,500 lbs per year. This represents significant lead loading in a single watershed within the REVA program, therefore, further assessment for the potential transport of lead is recommended at this potential receptor location.
2.4.2 Small Arms Range Assessment
Eleven SARs (including a recreational skeet range) were identified at MCAGCC Twentynine Palms (Figure 2-7). Six of these ranges are associated with the MTU in the southeastern area of the Range RTA. The MTU conducts small arms proficiency and requalification for Marines and transiting units. Four other
Marine Corps Installations Command REVA Periodic Review MCAGCC Twentynine Palms
2-35
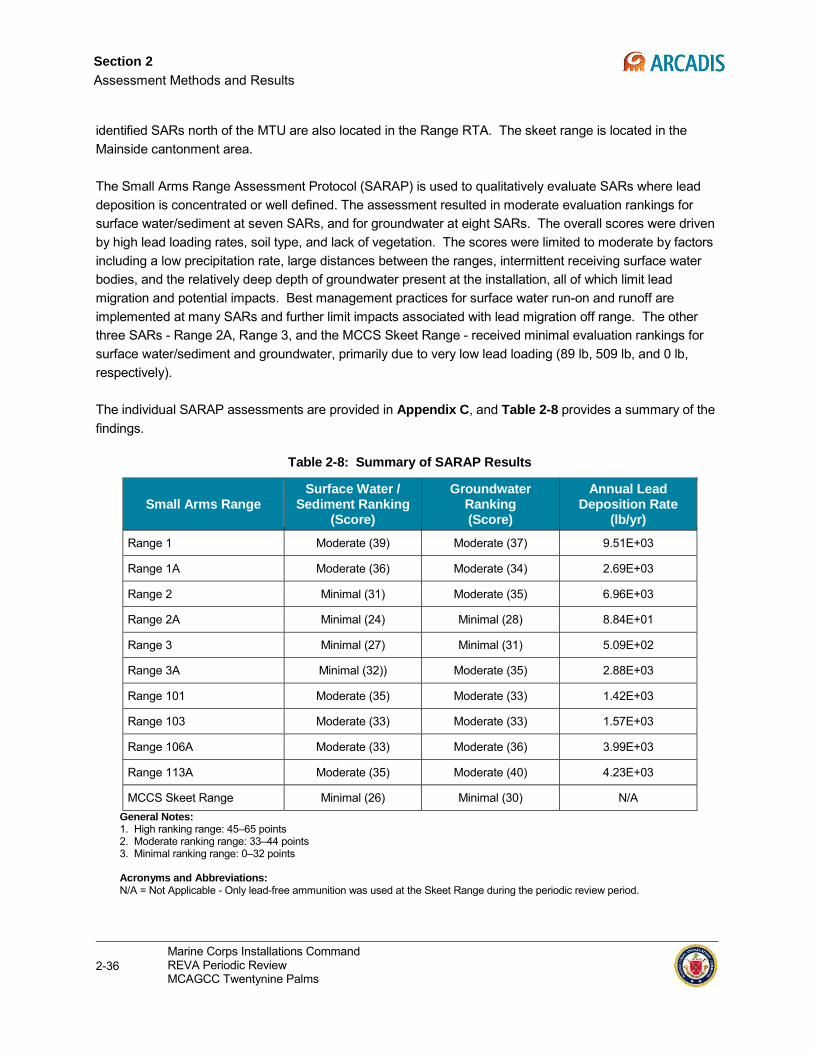
Section 2
Assessment Methods and Results
identified SARs north of the MTU are also located in the Range RTA. The skeet range is located in the Mainside cantonment area.
The Small Arms Range Assessment Protocol (SARAP) is used to qualitatively evaluate SARs where lead deposition is concentrated or well defined. The assessment resulted in moderate evaluation rankings for surface water/sediment at seven SARs, and for groundwater at eight SARs. The overall scores were driven by high lead loading rates, soil type, and lack of vegetation. The scores were limited to moderate by factors including a low precipitation rate, large distances between the ranges, intermittent receiving surface water bodies, and the relatively deep depth of groundwater present at the installation, all of which limit lead migration and potential impacts. Best management practices for surface water run-on and runoff are implemented at many SARs and further limit impacts associated with lead migration off range. The other three SARs - Range 2A, Range 3, and the MCCS Skeet Range - received minimal evaluation rankings for surface water/sediment and groundwater, primarily due to very low lead loading (89 lb, 509 lb, and 0 lb, respectively).
The individual SARAP assessments are provided in Appendix C, and Table 2-8 provides a summary of the findings.
Table 2-8: Summary of SARAP Results
Small Arms Range Surface Water /
Sediment Ranking (Score)
Groundwater Ranking (Score)
Annual Lead Deposition Rate
(lb/yr)
Range 1 Moderate (39) Moderate (37) 9.51E+03
Range 1A Moderate (36) Moderate (34) 2.69E+03
Range 2 Minimal (31) Moderate (35) 6.96E+03
Range 2A Minimal (24) Minimal (28) 8.84E+01
Range 3 Minimal (27) Minimal (31) 5.09E+02
Range 3A Minimal (32)) Moderate (35) 2.88E+03
Range 101 Moderate (35) Moderate (33) 1.42E+03
Range 103 Moderate (33) Moderate (33) 1.57E+03
Range 106A Moderate (33) Moderate (36) 3.99E+03
Range 113A Moderate (35) Moderate (40) 4.23E+03
MCCS Skeet Range Minimal (26) Minimal (30) N/A General Notes: 1. High ranking range: 45–65 points 2. Moderate ranking range: 33–44 points 3. Minimal ranking range: 0–32 points Acronyms and Abbreviations: N/A = Not Applicable - Only lead-free ammunition was used at the Skeet Range during the periodic review period.
2-36 Marine Corps Installations Command REVA Periodic Review MCAGCC Twentynine Palms
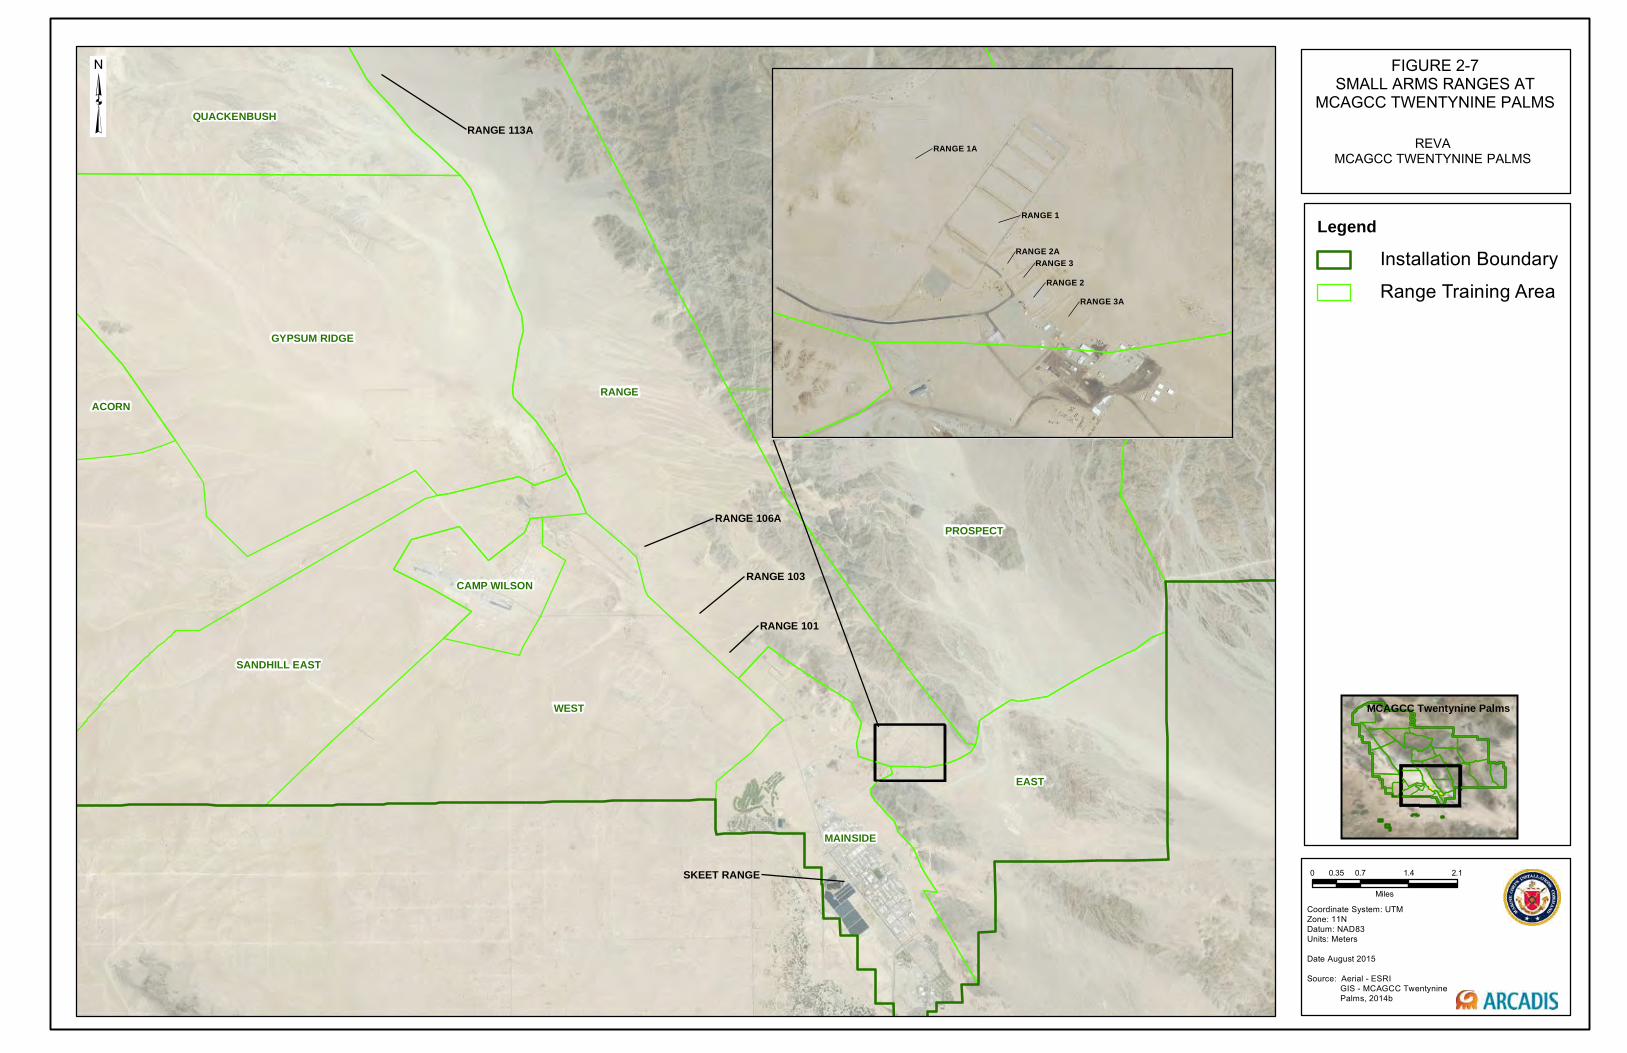
RANGE 106A
SKEET RANGE
RANGE 103
RANGE 101
RANGE 113A
DELTA
RANGE
WEST
PROSPECT
GYPSUM RIDGE
EAST
CLEGHORN PASS
SANDHILL EAST
MAINSIDE
QUACKENBUSH
ACORN
CAMP WILSON
FIGURE 2-7SMALL ARMS RANGES AT
MCAGCC TWENTYNINE PALMS
Coordinate System: UTM Zone: 11NDatum: NAD83Units: Meters
Date August 2015
Source: Aerial - ESRI GIS - MCAGCC Twentynine Palms, 2014b
MCAGCC Twentynine Palms
0 0.7 1.4 2.10.35
Miles
REVA MCAGCC TWENTYNINE PALMS
LegendInstallation Boundary
Range Training Area
RANGE 1
RANGE 1A
RANGE 3ARANGE 2
RANGE 3RANGE 2A
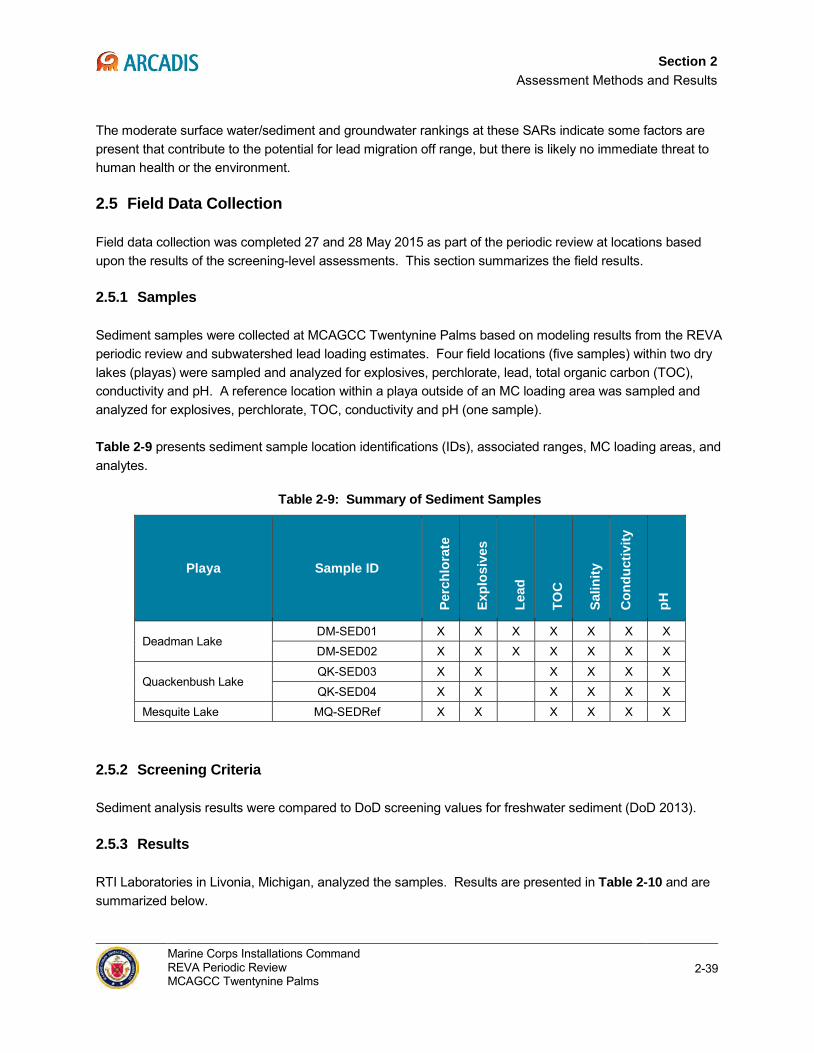
Section 2 Assessment Methods and Results
The moderate surface water/sediment and groundwater rankings at these SARs indicate some factors are present that contribute to the potential for lead migration off range, but there is likely no immediate threat to human health or the environment.
2.5 Field Data Collection
Field data collection was completed 27 and 28 May 2015 as part of the periodic review at locations based upon the results of the screening-level assessments. This section summarizes the field results.
2.5.1 Samples
Sediment samples were collected at MCAGCC Twentynine Palms based on modeling results from the REVA periodic review and subwatershed lead loading estimates. Four field locations (five samples) within two dry lakes (playas) were sampled and analyzed for explosives, perchlorate, lead, total organic carbon (TOC), conductivity and pH. A reference location within a playa outside of an MC loading area was sampled and analyzed for explosives, perchlorate, TOC, conductivity and pH (one sample).
Table 2-9 presents sediment sample location identifications (IDs), associated ranges, MC loading areas, and analytes.
Table 2-9: Summary of Sediment Samples
Playa Sample ID
Perc
hlor
ate
Expl
osiv
es
Lead
TOC
Salin
ity
Con
duct
ivity
pH
Deadman Lake DM-SED01 X X X X X X X
DM-SED02 X X X X X X X
Quackenbush Lake QK-SED03 X X X X X X
QK-SED04 X X X X X X
Mesquite Lake MQ-SEDRef X X X X X X
2.5.2 Screening Criteria
Sediment analysis results were compared to DoD screening values for freshwater sediment (DoD 2013).
2.5.3 Results
RTI Laboratories in Livonia, Michigan, analyzed the samples. Results are presented in Table 2-10 and are summarized below.
Marine Corps Installations Command REVA Periodic Review MCAGCC Twentynine Palms
2-39
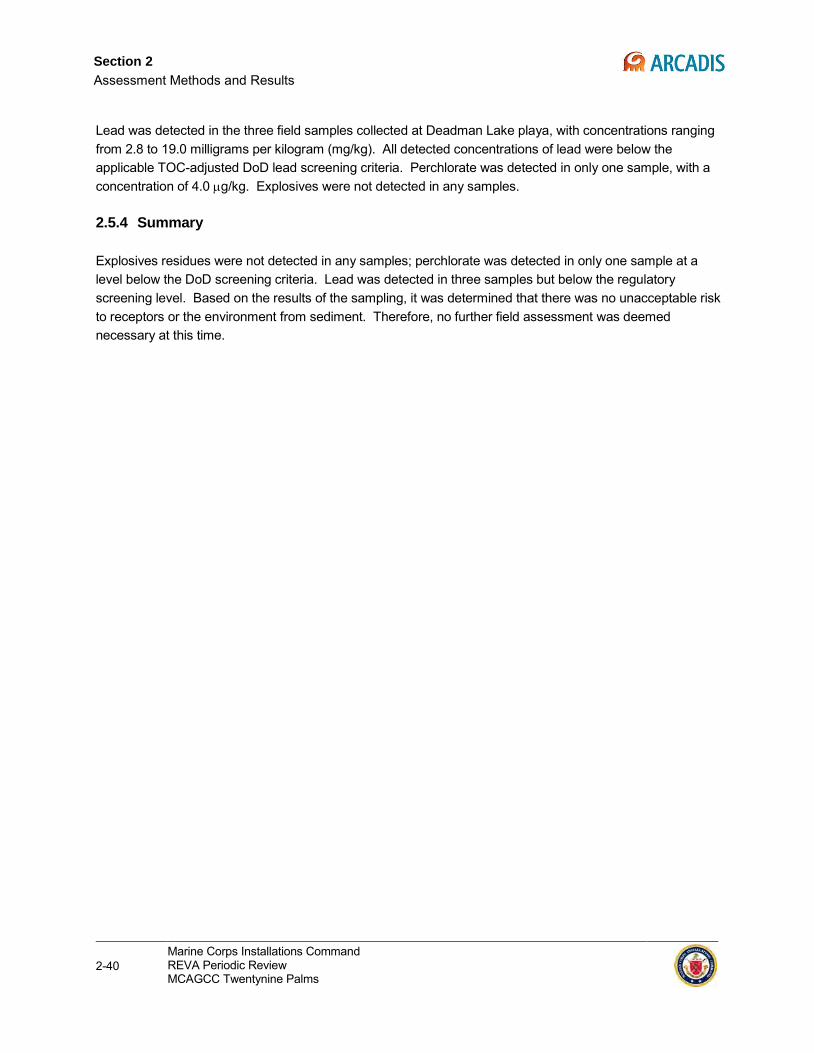
Section 2
Assessment Methods and Results
Lead was detected in the three field samples collected at Deadman Lake playa, with concentrations ranging from 2.8 to 19.0 milligrams per kilogram (mg/kg). All detected concentrations of lead were below the applicable TOC-adjusted DoD lead screening criteria. Perchlorate was detected in only one sample, with a concentration of 4.0 µg/kg. Explosives were not detected in any samples.
2.5.4 Summary
Explosives residues were not detected in any samples; perchlorate was detected in only one sample at a level below the DoD screening criteria. Lead was detected in three samples but below the regulatory screening level. Based on the results of the sampling, it was determined that there was no unacceptable risk to receptors or the environment from sediment. Therefore, no further field assessment was deemed necessary at this time.
2-40 Marine Corps Installations Command REVA Periodic Review MCAGCC Twentynine Palms
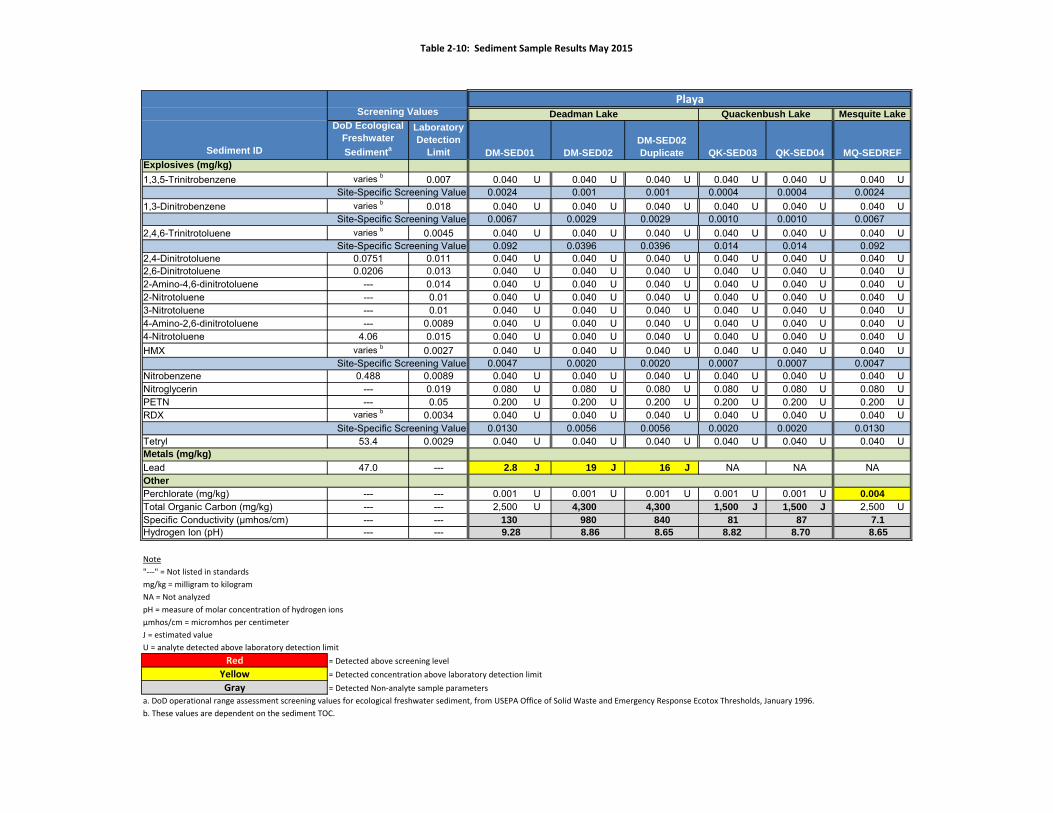
Table 2‐10: Sediment Sample Results May 2015
DoD Ecological Freshwater Sedimenta
LaboratoryDetection
LimitExplosives (mg/kg)1,3,5-Trinitrobenzene varies b 0.007 0.040 U 0.040 U 0.040 U 0.040 U 0.040 U 0.040 U
0.0024 0.001 0.001 0.0004 0.0004 0.0024 1,3-Dinitrobenzene varies b 0.018 0.040 U 0.040 U 0.040 U 0.040 U 0.040 U 0.040 U
0.0067 0.0029 0.0029 0.0010 0.0010 0.0067 2,4,6-Trinitrotoluene varies b 0.0045 0.040 U 0.040 U 0.040 U 0.040 U 0.040 U 0.040 U
0.092 0.0396 0.0396 0.014 0.014 0.092 2,4-Dinitrotoluene 0.0751 0.011 0.040 U 0.040 U 0.040 U 0.040 U 0.040 U 0.040 U2,6-Dinitrotoluene 0.0206 0.013 0.040 U 0.040 U 0.040 U 0.040 U 0.040 U 0.040 U2-Amino-4,6-dinitrotoluene --- 0.014 0.040 U 0.040 U 0.040 U 0.040 U 0.040 U 0.040 U2-Nitrotoluene --- 0.01 0.040 U 0.040 U 0.040 U 0.040 U 0.040 U 0.040 U3-Nitrotoluene --- 0.01 0.040 U 0.040 U 0.040 U 0.040 U 0.040 U 0.040 U4-Amino-2,6-dinitrotoluene --- 0.0089 0.040 U 0.040 U 0.040 U 0.040 U 0.040 U 0.040 U4-Nitrotoluene 4.06 0.015 0.040 U 0.040 U 0.040 U 0.040 U 0.040 U 0.040 UHMX varies b 0.0027 0.040 U 0.040 U 0.040 U 0.040 U 0.040 U 0.040 U
0.0047 0.0020 0.0020 0.0007 0.0007 0.0047 Nitrobenzene 0.488 0.0089 0.040 U 0.040 U 0.040 U 0.040 U 0.040 U 0.040 UNitroglycerin --- 0.019 0.080 U 0.080 U 0.080 U 0.080 U 0.080 U 0.080 UPETN --- 0.05 0.200 U 0.200 U 0.200 U 0.200 U 0.200 U 0.200 URDX varies b 0.0034 0.040 U 0.040 U 0.040 U 0.040 U 0.040 U 0.040 U
0.0130 0.0056 0.0056 0.0020 0.0020 0.0130 Tetryl 53.4 0.0029 0.040 U 0.040 U 0.040 U 0.040 U 0.040 U 0.040 UMetals (mg/kg)Lead 47.0 --- 2.8 J 19 J 16 JOtherPerchlorate (mg/kg) --- --- 0.001 U 0.001 U 0.001 U 0.001 U 0.001 U 0.004 Total Organic Carbon (mg/kg) --- --- 2,500 U 4,300 4,300 1,500 J 1,500 J 2,500 USpecific Conductivity (µmhos/cm) --- --- 130 980 840 81 87 7.1 Hydrogen Ion (pH) --- --- 9.28 8.86 8.65 8.82 8.70 8.65
ppm 2,500 4,300 4,300 1,500 1,500 2,500 Note Percent 0.25 0.43 0.43 0.15 0.15 0.25 "‐‐‐" = Not listed in standardsmg/kg = milligram to kilogramNA = Not analyzedpH = measure of molar concentration of hydrogen ionsµmhos/cm = micromhos per centimeterJ = estimated valueU = analyte detected above laboratory detection limit
Red = Detected above screening levelYellow = Detected concentration above laboratory detection limitGray = Detected Non‐analyte sample parameters
a. DoD operational range assessment screening values for ecological freshwater sediment, from USEPA Office of Solid Waste and Emergency Response Ecotox Thresholds, January 1996.b. These values are dependent on the sediment TOC.
Sediment ID
Site-Specific Screening Value
Site-Specific Screening Value
NA NA NA
Site-Specific Screening Value
PlayaDeadman Lake Quackenbush Lake Mesquite Lake
DM-SED01 DM-SED02DM-SED02 Duplicate QK-SED03 QK-SED04 MQ-SEDREF
Site-Specific Screening Value
Site-Specific Screening Value
Screening Values

3. Findings and Conclusions Table 3-1: Summary of Results and Conclusions of the Hydrologic Subwatershed Areas where
MC Loading Areas are Located
Ames Lake Watershed
Analysis Findings/Results MC Loading Areas (% area in the drainage area)
Acorn (51%; MC loading area not modeled), Emerson Lake (43%)
Identified receptors • Surface Water / Sediment: Ecological (special status species include Agassiz’s desert tortoise and MFTL).
• Groundwater: Human (drinking water production wells).
Surface water screening-level modeling
• Surface water MC concentrations in Ames Lake were predicted to be below detectable concentrations.
• No additional surface water assessment is recommended at this time.
Sediment screening-level modeling
• Perchlorate concentration in sediment potentially accumulating in Ames Lake playa as a result of water evaporating from the playa was predicted to be above detectable concentration. There is no established DoD sediment screening benchmark for perchlorate to compare with the predicted concentration.
• Additional sediment assessment is not recommended at this time.
Groundwater screening-level modeling
• Perchlorate at Emerson Lake MC loading area was predicted to reach the groundwater at detectable concentration, but it was predicted to take in excess of 50 years to reach the groundwater at a detectable concentration (approximately 50 years where there is preferential recharge and over 1,000 years where there is direct recharge).
• Additional groundwater assessment in not recommended at this time.
Lead deposition • Total lead deposition associated with the MC loading areas in this watershed is low (approximately 589 lb/yr). No additional assessment is recommended at this time.
SARs None.
Sampling Sediment sampling results from Deadman and Quackenbush Lake playas, which show perchlorate concentrations are below detectable levels, are considered representative of the perchlorate concentrations in the sediment of Ames Lake playa.
Conclusion The screening-level and qualitative assessment results do not indicate a current release of HE, perchlorate, or lead to surface water, sediment, or groundwater at levels of concern for the environment from the MC loading areas identified within the Ames Lake watershed.
Marine Corps Installations Command REVA Periodic Review MCAGCC Twentynine Palms
3-1
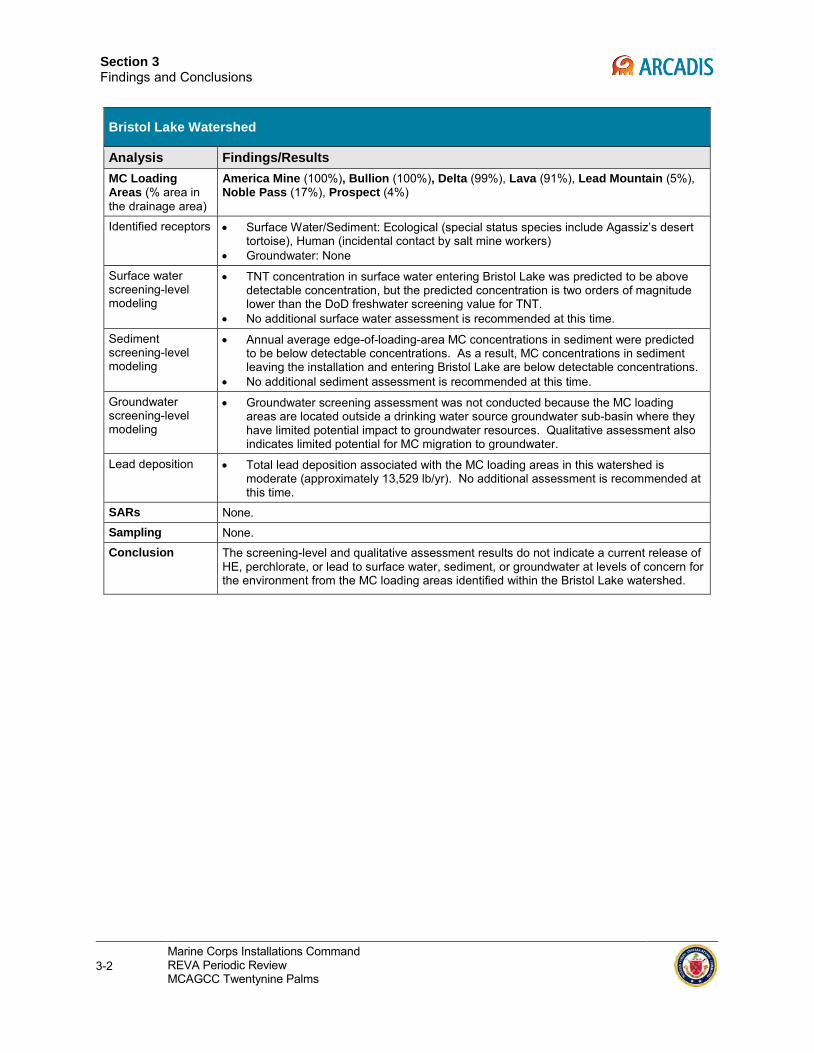
Section 3 Findings and Conclusions
Bristol Lake Watershed
Analysis Findings/Results MC Loading Areas (% area in the drainage area)
America Mine (100%), Bullion (100%), Delta (99%), Lava (91%), Lead Mountain (5%), Noble Pass (17%), Prospect (4%)
Identified receptors • Surface Water/Sediment: Ecological (special status species include Agassiz’s desert tortoise), Human (incidental contact by salt mine workers)
• Groundwater: None
Surface water screening-level modeling
• TNT concentration in surface water entering Bristol Lake was predicted to be above detectable concentration, but the predicted concentration is two orders of magnitude lower than the DoD freshwater screening value for TNT.
• No additional surface water assessment is recommended at this time.
Sediment screening-level modeling
• Annual average edge-of-loading-area MC concentrations in sediment were predicted to be below detectable concentrations. As a result, MC concentrations in sediment leaving the installation and entering Bristol Lake are below detectable concentrations.
• No additional sediment assessment is recommended at this time.
Groundwater screening-level modeling
• Groundwater screening assessment was not conducted because the MC loading areas are located outside a drinking water source groundwater sub-basin where they have limited potential impact to groundwater resources. Qualitative assessment also indicates limited potential for MC migration to groundwater.
Lead deposition • Total lead deposition associated with the MC loading areas in this watershed is moderate (approximately 13,529 lb/yr). No additional assessment is recommended at this time.
SARs None. Sampling None. Conclusion The screening-level and qualitative assessment results do not indicate a current release of
HE, perchlorate, or lead to surface water, sediment, or groundwater at levels of concern for the environment from the MC loading areas identified within the Bristol Lake watershed.
3-2 Marine Corps Installations Command REVA Periodic Review MCAGCC Twentynine Palms
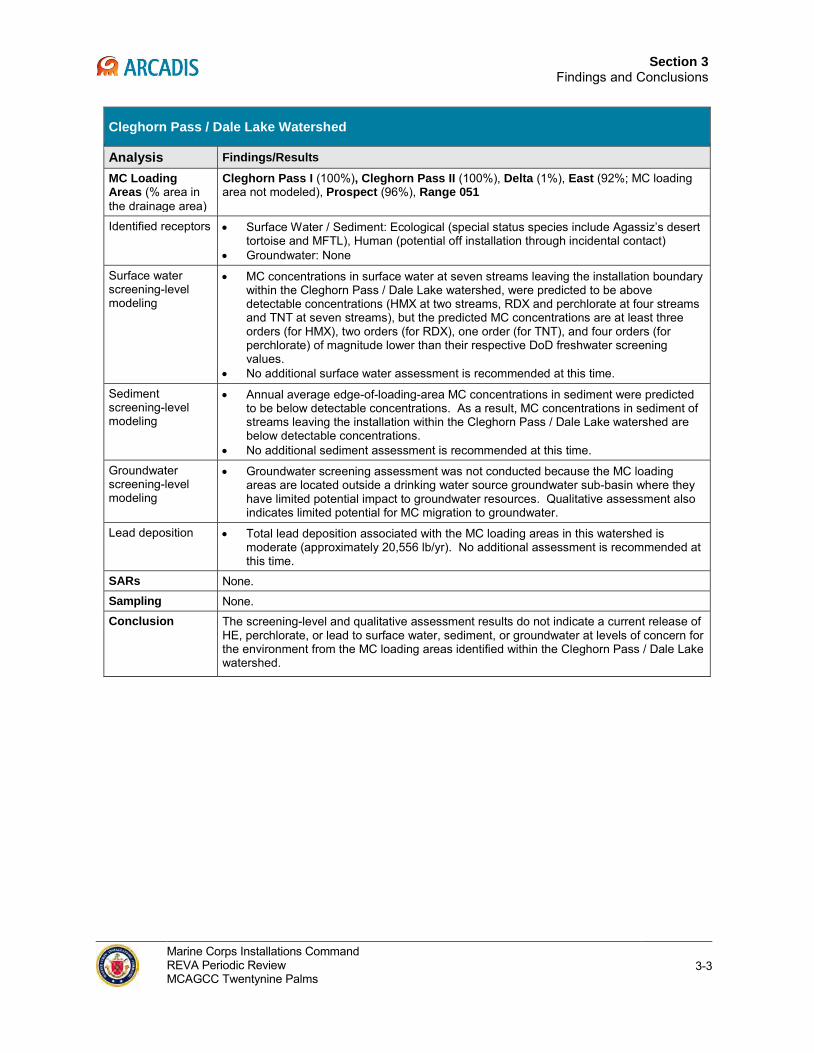
Section 3
Findings and Conclusions
Cleghorn Pass / Dale Lake Watershed
Analysis Findings/Results
MC Loading Areas (% area in the drainage area)
Cleghorn Pass I (100%), Cleghorn Pass II (100%), Delta (1%), East (92%; MC loading area not modeled), Prospect (96%), Range 051
Identified receptors • Surface Water / Sediment: Ecological (special status species include Agassiz’s desert tortoise and MFTL), Human (potential off installation through incidental contact)
• Groundwater: None
Surface water screening-level modeling
• MC concentrations in surface water at seven streams leaving the installation boundary within the Cleghorn Pass / Dale Lake watershed, were predicted to be above detectable concentrations (HMX at two streams, RDX and perchlorate at four streams and TNT at seven streams), but the predicted MC concentrations are at least three orders (for HMX), two orders (for RDX), one order (for TNT), and four orders (for perchlorate) of magnitude lower than their respective DoD freshwater screening values.
• No additional surface water assessment is recommended at this time.
Sediment screening-level modeling
• Annual average edge-of-loading-area MC concentrations in sediment were predicted to be below detectable concentrations. As a result, MC concentrations in sediment of streams leaving the installation within the Cleghorn Pass / Dale Lake watershed are below detectable concentrations.
• No additional sediment assessment is recommended at this time.
Groundwater screening-level modeling
• Groundwater screening assessment was not conducted because the MC loading areas are located outside a drinking water source groundwater sub-basin where they have limited potential impact to groundwater resources. Qualitative assessment also indicates limited potential for MC migration to groundwater.
Lead deposition • Total lead deposition associated with the MC loading areas in this watershed is moderate (approximately 20,556 lb/yr). No additional assessment is recommended at this time.
SARs None. Sampling None. Conclusion The screening-level and qualitative assessment results do not indicate a current release of
HE, perchlorate, or lead to surface water, sediment, or groundwater at levels of concern for the environment from the MC loading areas identified within the Cleghorn Pass / Dale Lake watershed.
Marine Corps Installations Command REVA Periodic Review MCAGCC Twentynine Palms
3-3
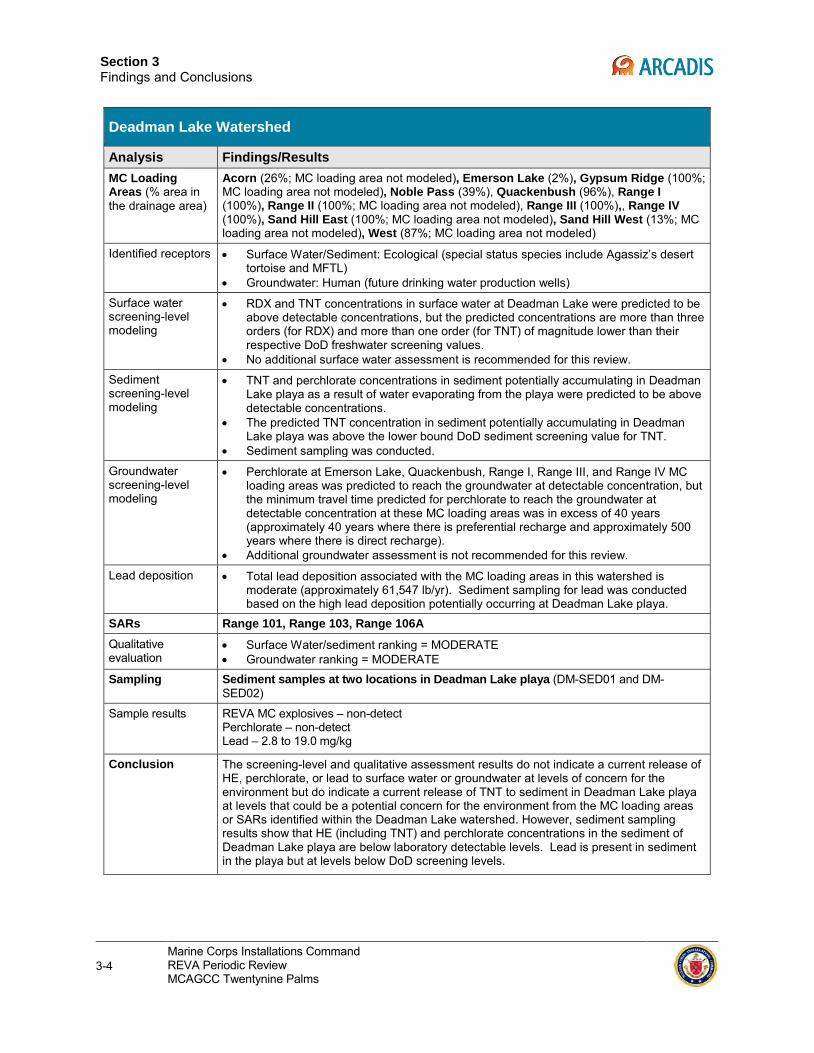
Section 3 Findings and Conclusions
Deadman Lake Watershed
Analysis Findings/Results MC Loading Areas (% area in the drainage area)
Acorn (26%; MC loading area not modeled), Emerson Lake (2%), Gypsum Ridge (100%; MC loading area not modeled), Noble Pass (39%), Quackenbush (96%), Range I (100%), Range II (100%; MC loading area not modeled), Range III (100%),, Range IV (100%), Sand Hill East (100%; MC loading area not modeled), Sand Hill West (13%; MC loading area not modeled), West (87%; MC loading area not modeled)
Identified receptors • Surface Water/Sediment: Ecological (special status species include Agassiz’s desert tortoise and MFTL)
• Groundwater: Human (future drinking water production wells)
Surface water screening-level modeling
• RDX and TNT concentrations in surface water at Deadman Lake were predicted to be above detectable concentrations, but the predicted concentrations are more than three orders (for RDX) and more than one order (for TNT) of magnitude lower than their respective DoD freshwater screening values.
• No additional surface water assessment is recommended for this review.
Sediment screening-level modeling
• TNT and perchlorate concentrations in sediment potentially accumulating in Deadman Lake playa as a result of water evaporating from the playa were predicted to be above detectable concentrations.
• The predicted TNT concentration in sediment potentially accumulating in Deadman Lake playa was above the lower bound DoD sediment screening value for TNT.
• Sediment sampling was conducted.
Groundwater screening-level modeling
• Perchlorate at Emerson Lake, Quackenbush, Range I, Range III, and Range IV MC loading areas was predicted to reach the groundwater at detectable concentration, but the minimum travel time predicted for perchlorate to reach the groundwater at detectable concentration at these MC loading areas was in excess of 40 years (approximately 40 years where there is preferential recharge and approximately 500 years where there is direct recharge).
• Additional groundwater assessment is not recommended for this review.
Lead deposition • Total lead deposition associated with the MC loading areas in this watershed is moderate (approximately 61,547 lb/yr). Sediment sampling for lead was conducted based on the high lead deposition potentially occurring at Deadman Lake playa.
SARs Range 101, Range 103, Range 106A Qualitative evaluation
• Surface Water/sediment ranking = MODERATE • Groundwater ranking = MODERATE
Sampling Sediment samples at two locations in Deadman Lake playa (DM-SED01 and DM-SED02)
Sample results REVA MC explosives – non-detect Perchlorate – non-detect Lead – 2.8 to 19.0 mg/kg
Conclusion The screening-level and qualitative assessment results do not indicate a current release of HE, perchlorate, or lead to surface water or groundwater at levels of concern for the environment but do indicate a current release of TNT to sediment in Deadman Lake playa at levels that could be a potential concern for the environment from the MC loading areas or SARs identified within the Deadman Lake watershed. However, sediment sampling results show that HE (including TNT) and perchlorate concentrations in the sediment of Deadman Lake playa are below laboratory detectable levels. Lead is present in sediment in the playa but at levels below DoD screening levels.
3-4 Marine Corps Installations Command REVA Periodic Review MCAGCC Twentynine Palms
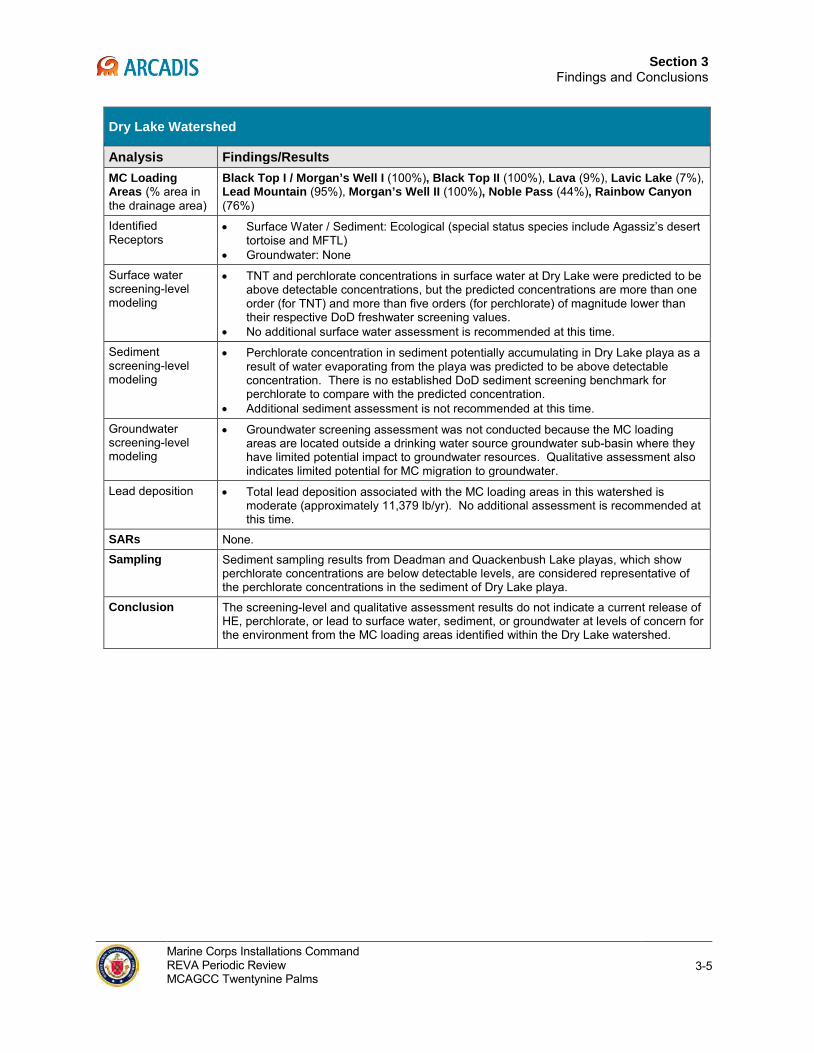
Section 3
Findings and Conclusions
Dry Lake Watershed
Analysis Findings/Results MC Loading Areas (% area in the drainage area)
Black Top I / Morgan’s Well I (100%), Black Top II (100%), Lava (9%), Lavic Lake (7%), Lead Mountain (95%), Morgan’s Well II (100%), Noble Pass (44%), Rainbow Canyon (76%)
Identified Receptors
• Surface Water / Sediment: Ecological (special status species include Agassiz’s desert tortoise and MFTL)
• Groundwater: None
Surface water screening-level modeling
• TNT and perchlorate concentrations in surface water at Dry Lake were predicted to be above detectable concentrations, but the predicted concentrations are more than one order (for TNT) and more than five orders (for perchlorate) of magnitude lower than their respective DoD freshwater screening values.
• No additional surface water assessment is recommended at this time.
Sediment screening-level modeling
• Perchlorate concentration in sediment potentially accumulating in Dry Lake playa as a result of water evaporating from the playa was predicted to be above detectable concentration. There is no established DoD sediment screening benchmark for perchlorate to compare with the predicted concentration.
• Additional sediment assessment is not recommended at this time.
Groundwater screening-level modeling
• Groundwater screening assessment was not conducted because the MC loading areas are located outside a drinking water source groundwater sub-basin where they have limited potential impact to groundwater resources. Qualitative assessment also indicates limited potential for MC migration to groundwater.
Lead deposition • Total lead deposition associated with the MC loading areas in this watershed is moderate (approximately 11,379 lb/yr). No additional assessment is recommended at this time.
SARs None. Sampling Sediment sampling results from Deadman and Quackenbush Lake playas, which show
perchlorate concentrations are below detectable levels, are considered representative of the perchlorate concentrations in the sediment of Dry Lake playa.
Conclusion The screening-level and qualitative assessment results do not indicate a current release of HE, perchlorate, or lead to surface water, sediment, or groundwater at levels of concern for the environment from the MC loading areas identified within the Dry Lake watershed.
Marine Corps Installations Command REVA Periodic Review MCAGCC Twentynine Palms
3-5
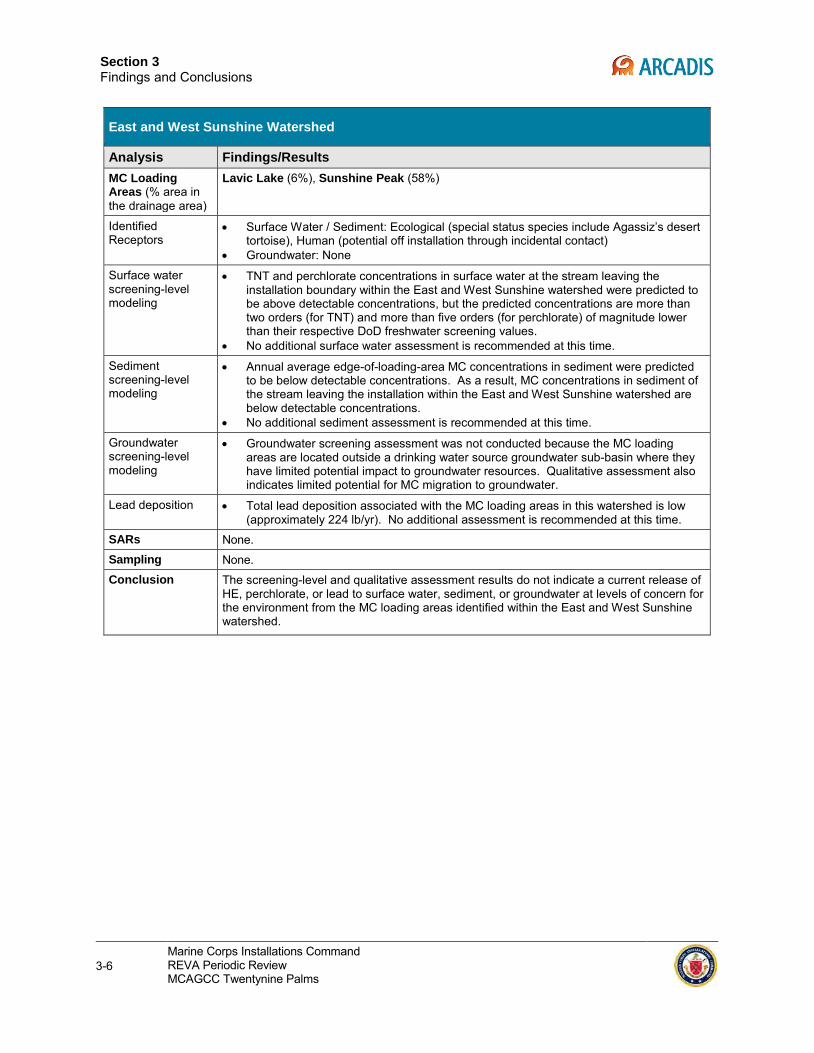
Section 3 Findings and Conclusions
East and West Sunshine Watershed
Analysis Findings/Results MC Loading Areas (% area in the drainage area)
Lavic Lake (6%), Sunshine Peak (58%)
Identified Receptors
• Surface Water / Sediment: Ecological (special status species include Agassiz’s desert tortoise), Human (potential off installation through incidental contact)
• Groundwater: None
Surface water screening-level modeling
• TNT and perchlorate concentrations in surface water at the stream leaving the installation boundary within the East and West Sunshine watershed were predicted to be above detectable concentrations, but the predicted concentrations are more than two orders (for TNT) and more than five orders (for perchlorate) of magnitude lower than their respective DoD freshwater screening values.
• No additional surface water assessment is recommended at this time.
Sediment screening-level modeling
• Annual average edge-of-loading-area MC concentrations in sediment were predicted to be below detectable concentrations. As a result, MC concentrations in sediment of the stream leaving the installation within the East and West Sunshine watershed are below detectable concentrations.
• No additional sediment assessment is recommended at this time.
Groundwater screening-level modeling
• Groundwater screening assessment was not conducted because the MC loading areas are located outside a drinking water source groundwater sub-basin where they have limited potential impact to groundwater resources. Qualitative assessment also indicates limited potential for MC migration to groundwater.
Lead deposition • Total lead deposition associated with the MC loading areas in this watershed is low (approximately 224 lb/yr). No additional assessment is recommended at this time.
SARs None. Sampling None. Conclusion The screening-level and qualitative assessment results do not indicate a current release of
HE, perchlorate, or lead to surface water, sediment, or groundwater at levels of concern for the environment from the MC loading areas identified within the East and West Sunshine watershed.
3-6 Marine Corps Installations Command REVA Periodic Review MCAGCC Twentynine Palms
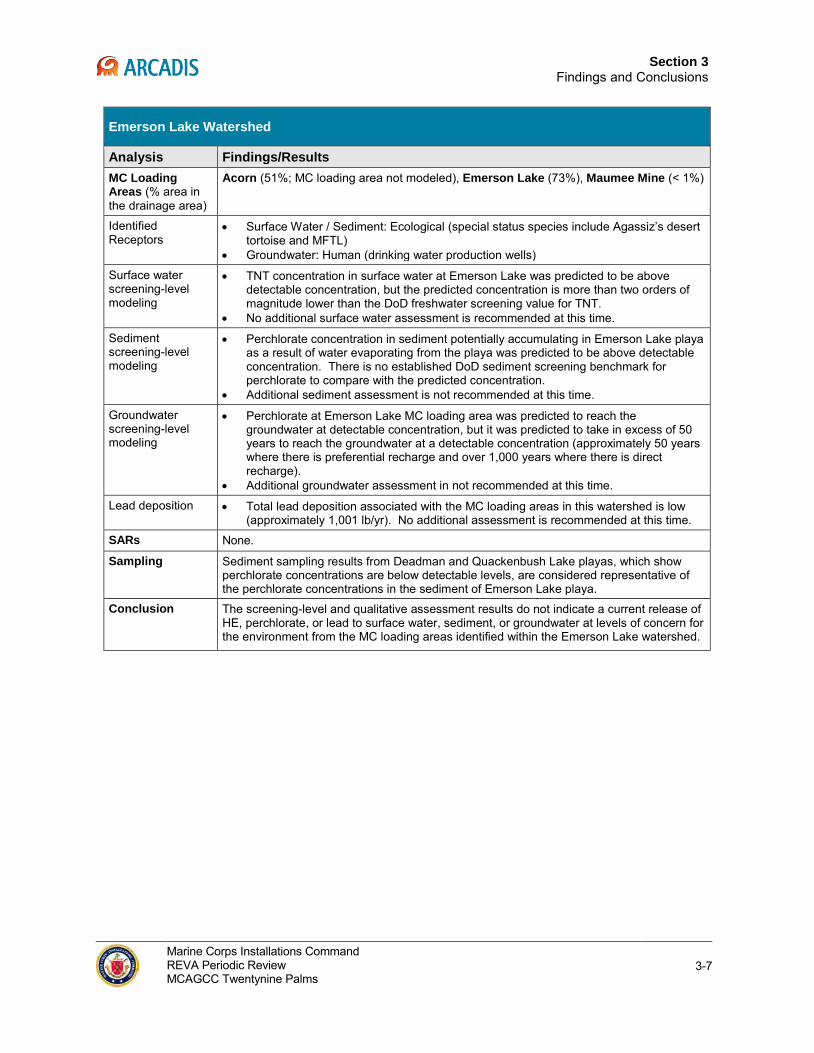
Section 3
Findings and Conclusions
Emerson Lake Watershed
Analysis Findings/Results MC Loading Areas (% area in the drainage area)
Acorn (51%; MC loading area not modeled), Emerson Lake (73%), Maumee Mine (< 1%)
Identified Receptors
• Surface Water / Sediment: Ecological (special status species include Agassiz’s desert tortoise and MFTL)
• Groundwater: Human (drinking water production wells)
Surface water screening-level modeling
• TNT concentration in surface water at Emerson Lake was predicted to be above detectable concentration, but the predicted concentration is more than two orders of magnitude lower than the DoD freshwater screening value for TNT.
• No additional surface water assessment is recommended at this time.
Sediment screening-level modeling
• Perchlorate concentration in sediment potentially accumulating in Emerson Lake playa as a result of water evaporating from the playa was predicted to be above detectable concentration. There is no established DoD sediment screening benchmark for perchlorate to compare with the predicted concentration.
• Additional sediment assessment is not recommended at this time.
Groundwater screening-level modeling
• Perchlorate at Emerson Lake MC loading area was predicted to reach the groundwater at detectable concentration, but it was predicted to take in excess of 50 years to reach the groundwater at a detectable concentration (approximately 50 years where there is preferential recharge and over 1,000 years where there is direct recharge).
• Additional groundwater assessment in not recommended at this time.
Lead deposition • Total lead deposition associated with the MC loading areas in this watershed is low (approximately 1,001 lb/yr). No additional assessment is recommended at this time.
SARs None.
Sampling Sediment sampling results from Deadman and Quackenbush Lake playas, which show perchlorate concentrations are below detectable levels, are considered representative of the perchlorate concentrations in the sediment of Emerson Lake playa.
Conclusion The screening-level and qualitative assessment results do not indicate a current release of HE, perchlorate, or lead to surface water, sediment, or groundwater at levels of concern for the environment from the MC loading areas identified within the Emerson Lake watershed.
Marine Corps Installations Command REVA Periodic Review MCAGCC Twentynine Palms
3-7
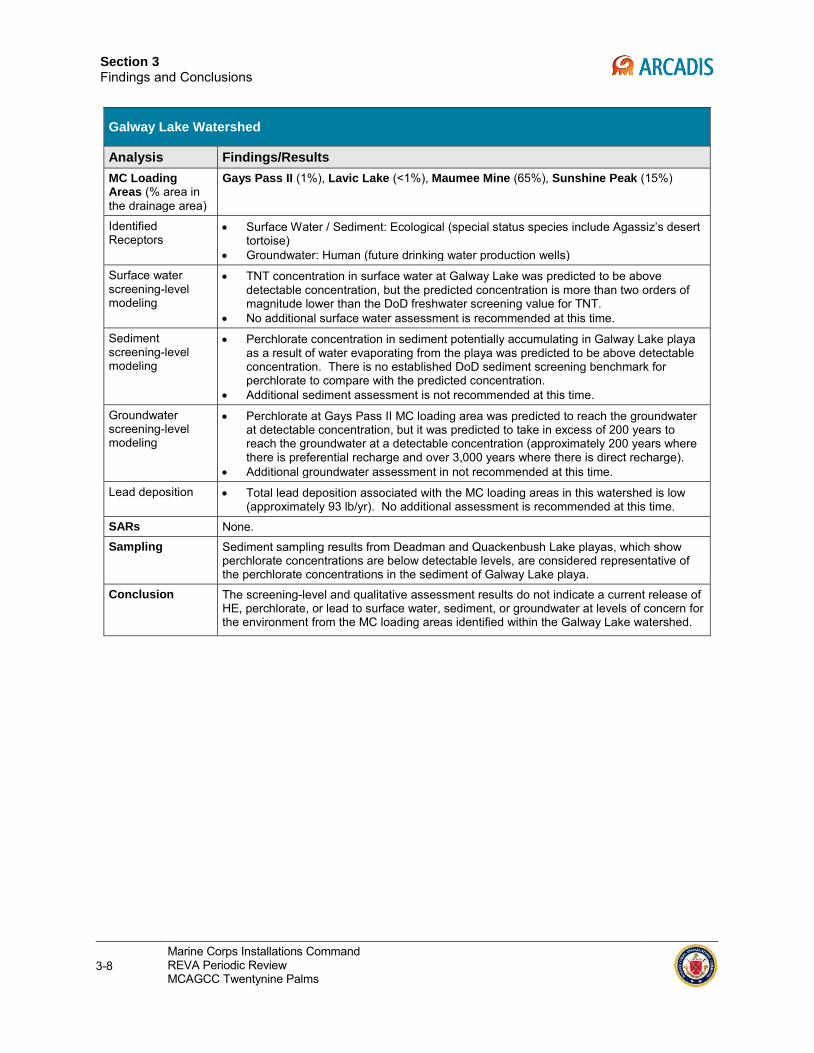
Section 3 Findings and Conclusions
Galway Lake Watershed
Analysis Findings/Results MC Loading Areas (% area in the drainage area)
Gays Pass II (1%), Lavic Lake (<1%), Maumee Mine (65%), Sunshine Peak (15%)
Identified Receptors
• Surface Water / Sediment: Ecological (special status species include Agassiz’s desert tortoise)
• Groundwater: Human (future drinking water production wells)
Surface water screening-level modeling
• TNT concentration in surface water at Galway Lake was predicted to be above detectable concentration, but the predicted concentration is more than two orders of magnitude lower than the DoD freshwater screening value for TNT.
• No additional surface water assessment is recommended at this time.
Sediment screening-level modeling
• Perchlorate concentration in sediment potentially accumulating in Galway Lake playa as a result of water evaporating from the playa was predicted to be above detectable concentration. There is no established DoD sediment screening benchmark for perchlorate to compare with the predicted concentration.
• Additional sediment assessment is not recommended at this time.
Groundwater screening-level modeling
• Perchlorate at Gays Pass II MC loading area was predicted to reach the groundwater at detectable concentration, but it was predicted to take in excess of 200 years to reach the groundwater at a detectable concentration (approximately 200 years where there is preferential recharge and over 3,000 years where there is direct recharge).
• Additional groundwater assessment in not recommended at this time.
Lead deposition • Total lead deposition associated with the MC loading areas in this watershed is low (approximately 93 lb/yr). No additional assessment is recommended at this time.
SARs None. Sampling Sediment sampling results from Deadman and Quackenbush Lake playas, which show
perchlorate concentrations are below detectable levels, are considered representative of the perchlorate concentrations in the sediment of Galway Lake playa.
Conclusion The screening-level and qualitative assessment results do not indicate a current release of HE, perchlorate, or lead to surface water, sediment, or groundwater at levels of concern for the environment from the MC loading areas identified within the Galway Lake watershed.
3-8 Marine Corps Installations Command REVA Periodic Review MCAGCC Twentynine Palms
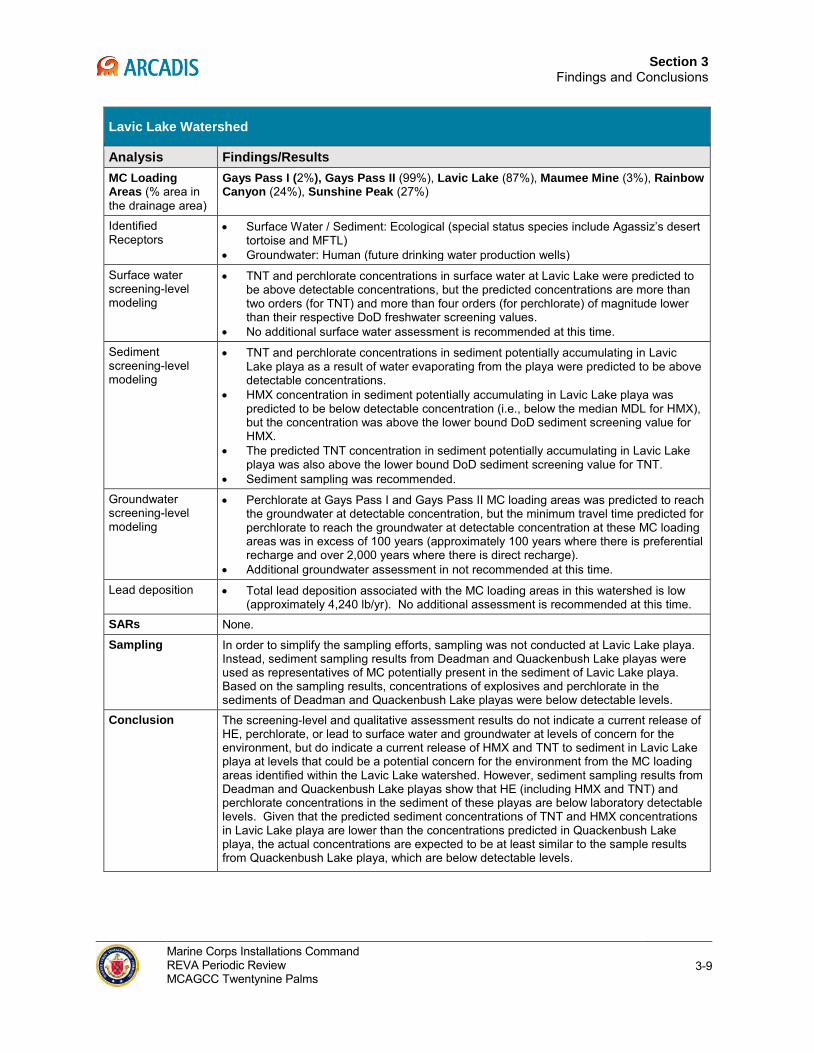
Section 3
Findings and Conclusions
Lavic Lake Watershed
Analysis Findings/Results MC Loading Areas (% area in the drainage area)
Gays Pass I (2%), Gays Pass II (99%), Lavic Lake (87%), Maumee Mine (3%), Rainbow Canyon (24%), Sunshine Peak (27%)
Identified Receptors
• Surface Water / Sediment: Ecological (special status species include Agassiz’s desert tortoise and MFTL)
• Groundwater: Human (future drinking water production wells)
Surface water screening-level modeling
• TNT and perchlorate concentrations in surface water at Lavic Lake were predicted to be above detectable concentrations, but the predicted concentrations are more than two orders (for TNT) and more than four orders (for perchlorate) of magnitude lower than their respective DoD freshwater screening values.
• No additional surface water assessment is recommended at this time.
Sediment screening-level modeling
• TNT and perchlorate concentrations in sediment potentially accumulating in Lavic Lake playa as a result of water evaporating from the playa were predicted to be above detectable concentrations.
• HMX concentration in sediment potentially accumulating in Lavic Lake playa was predicted to be below detectable concentration (i.e., below the median MDL for HMX), but the concentration was above the lower bound DoD sediment screening value for HMX.
• The predicted TNT concentration in sediment potentially accumulating in Lavic Lake playa was also above the lower bound DoD sediment screening value for TNT.
• Sediment sampling was recommended.
Groundwater screening-level modeling
• Perchlorate at Gays Pass I and Gays Pass II MC loading areas was predicted to reach the groundwater at detectable concentration, but the minimum travel time predicted for perchlorate to reach the groundwater at detectable concentration at these MC loading areas was in excess of 100 years (approximately 100 years where there is preferential recharge and over 2,000 years where there is direct recharge).
• Additional groundwater assessment in not recommended at this time.
Lead deposition • Total lead deposition associated with the MC loading areas in this watershed is low (approximately 4,240 lb/yr). No additional assessment is recommended at this time.
SARs None.
Sampling In order to simplify the sampling efforts, sampling was not conducted at Lavic Lake playa. Instead, sediment sampling results from Deadman and Quackenbush Lake playas were used as representatives of MC potentially present in the sediment of Lavic Lake playa. Based on the sampling results, concentrations of explosives and perchlorate in the sediments of Deadman and Quackenbush Lake playas were below detectable levels.
Conclusion The screening-level and qualitative assessment results do not indicate a current release of HE, perchlorate, or lead to surface water and groundwater at levels of concern for the environment, but do indicate a current release of HMX and TNT to sediment in Lavic Lake playa at levels that could be a potential concern for the environment from the MC loading areas identified within the Lavic Lake watershed. However, sediment sampling results from Deadman and Quackenbush Lake playas show that HE (including HMX and TNT) and perchlorate concentrations in the sediment of these playas are below laboratory detectable levels. Given that the predicted sediment concentrations of TNT and HMX concentrations in Lavic Lake playa are lower than the concentrations predicted in Quackenbush Lake playa, the actual concentrations are expected to be at least similar to the sample results from Quackenbush Lake playa, which are below detectable levels.
Marine Corps Installations Command REVA Periodic Review MCAGCC Twentynine Palms
3-9
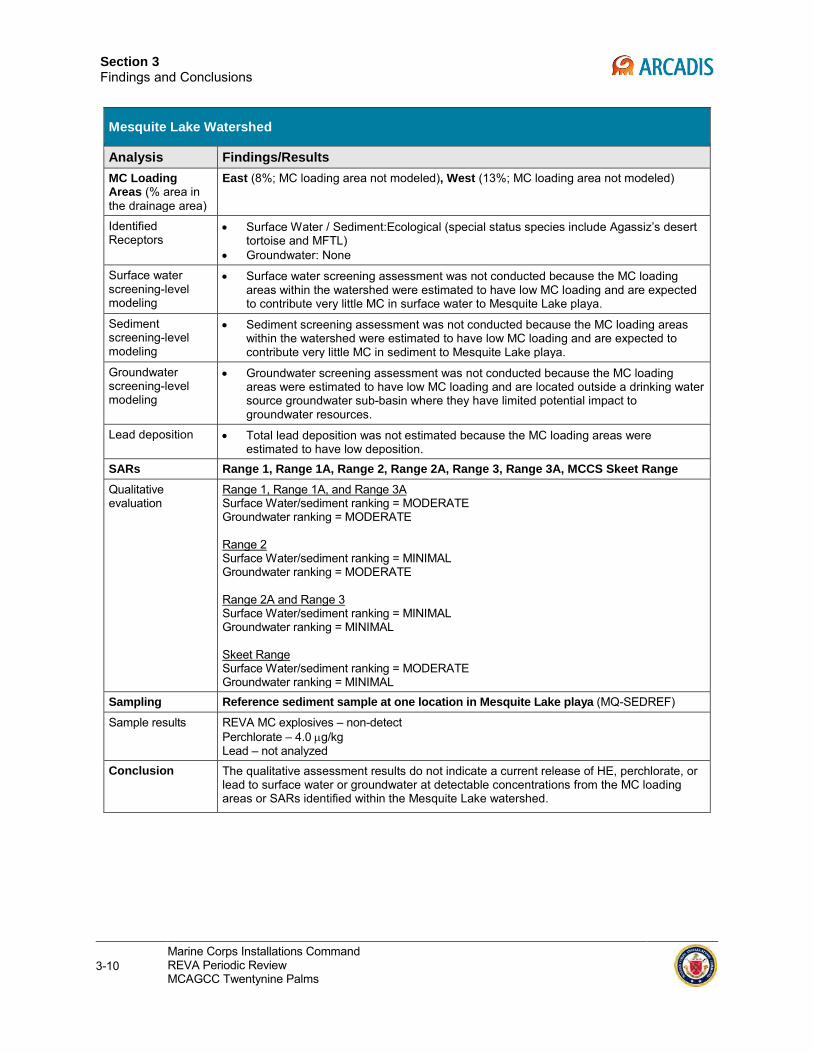
Section 3 Findings and Conclusions
Mesquite Lake Watershed
Analysis Findings/Results MC Loading Areas (% area in the drainage area)
East (8%; MC loading area not modeled), West (13%; MC loading area not modeled)
Identified Receptors
• Surface Water / Sediment:Ecological (special status species include Agassiz’s desert tortoise and MFTL)
• Groundwater: None
Surface water screening-level modeling
• Surface water screening assessment was not conducted because the MC loading areas within the watershed were estimated to have low MC loading and are expected to contribute very little MC in surface water to Mesquite Lake playa.
Sediment screening-level modeling
• Sediment screening assessment was not conducted because the MC loading areas within the watershed were estimated to have low MC loading and are expected to contribute very little MC in sediment to Mesquite Lake playa.
Groundwater screening-level modeling
• Groundwater screening assessment was not conducted because the MC loading areas were estimated to have low MC loading and are located outside a drinking water source groundwater sub-basin where they have limited potential impact to groundwater resources.
Lead deposition • Total lead deposition was not estimated because the MC loading areas were estimated to have low deposition.
SARs Range 1, Range 1A, Range 2, Range 2A, Range 3, Range 3A, MCCS Skeet Range Qualitative evaluation
Range 1, Range 1A, and Range 3A Surface Water/sediment ranking = MODERATE Groundwater ranking = MODERATE Range 2 Surface Water/sediment ranking = MINIMAL Groundwater ranking = MODERATE Range 2A and Range 3 Surface Water/sediment ranking = MINIMAL Groundwater ranking = MINIMAL Skeet Range Surface Water/sediment ranking = MODERATE Groundwater ranking = MINIMAL
Sampling Reference sediment sample at one location in Mesquite Lake playa (MQ-SEDREF)
Sample results REVA MC explosives – non-detect Perchlorate – 4.0 µg/kg Lead – not analyzed
Conclusion The qualitative assessment results do not indicate a current release of HE, perchlorate, or lead to surface water or groundwater at detectable concentrations from the MC loading areas or SARs identified within the Mesquite Lake watershed.
3-10 Marine Corps Installations Command REVA Periodic Review MCAGCC Twentynine Palms
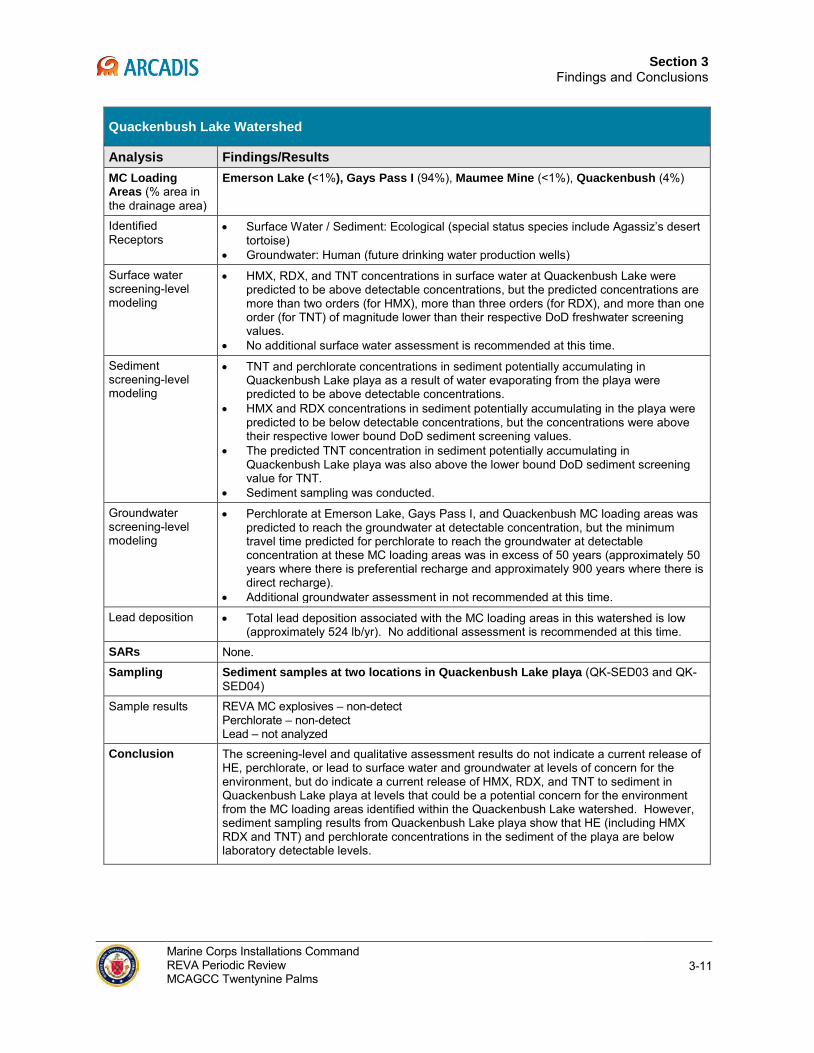
Section 3
Findings and Conclusions
Quackenbush Lake Watershed
Analysis Findings/Results MC Loading Areas (% area in the drainage area)
Emerson Lake (<1%), Gays Pass I (94%), Maumee Mine (<1%), Quackenbush (4%)
Identified Receptors
• Surface Water / Sediment: Ecological (special status species include Agassiz’s desert tortoise)
• Groundwater: Human (future drinking water production wells)
Surface water screening-level modeling
• HMX, RDX, and TNT concentrations in surface water at Quackenbush Lake were predicted to be above detectable concentrations, but the predicted concentrations are more than two orders (for HMX), more than three orders (for RDX), and more than one order (for TNT) of magnitude lower than their respective DoD freshwater screening values.
• No additional surface water assessment is recommended at this time.
Sediment screening-level modeling
• TNT and perchlorate concentrations in sediment potentially accumulating in Quackenbush Lake playa as a result of water evaporating from the playa were predicted to be above detectable concentrations.
• HMX and RDX concentrations in sediment potentially accumulating in the playa were predicted to be below detectable concentrations, but the concentrations were above their respective lower bound DoD sediment screening values.
• The predicted TNT concentration in sediment potentially accumulating in Quackenbush Lake playa was also above the lower bound DoD sediment screening value for TNT.
• Sediment sampling was conducted.
Groundwater screening-level modeling
• Perchlorate at Emerson Lake, Gays Pass I, and Quackenbush MC loading areas was predicted to reach the groundwater at detectable concentration, but the minimum travel time predicted for perchlorate to reach the groundwater at detectable concentration at these MC loading areas was in excess of 50 years (approximately 50 years where there is preferential recharge and approximately 900 years where there is direct recharge).
• Additional groundwater assessment in not recommended at this time.
Lead deposition • Total lead deposition associated with the MC loading areas in this watershed is low (approximately 524 lb/yr). No additional assessment is recommended at this time.
SARs None.
Sampling Sediment samples at two locations in Quackenbush Lake playa (QK-SED03 and QK-SED04)
Sample results REVA MC explosives – non-detect Perchlorate – non-detect Lead – not analyzed
Conclusion The screening-level and qualitative assessment results do not indicate a current release of HE, perchlorate, or lead to surface water and groundwater at levels of concern for the environment, but do indicate a current release of HMX, RDX, and TNT to sediment in Quackenbush Lake playa at levels that could be a potential concern for the environment from the MC loading areas identified within the Quackenbush Lake watershed. However, sediment sampling results from Quackenbush Lake playa show that HE (including HMX RDX and TNT) and perchlorate concentrations in the sediment of the playa are below laboratory detectable levels.
Marine Corps Installations Command REVA Periodic Review MCAGCC Twentynine Palms
3-11
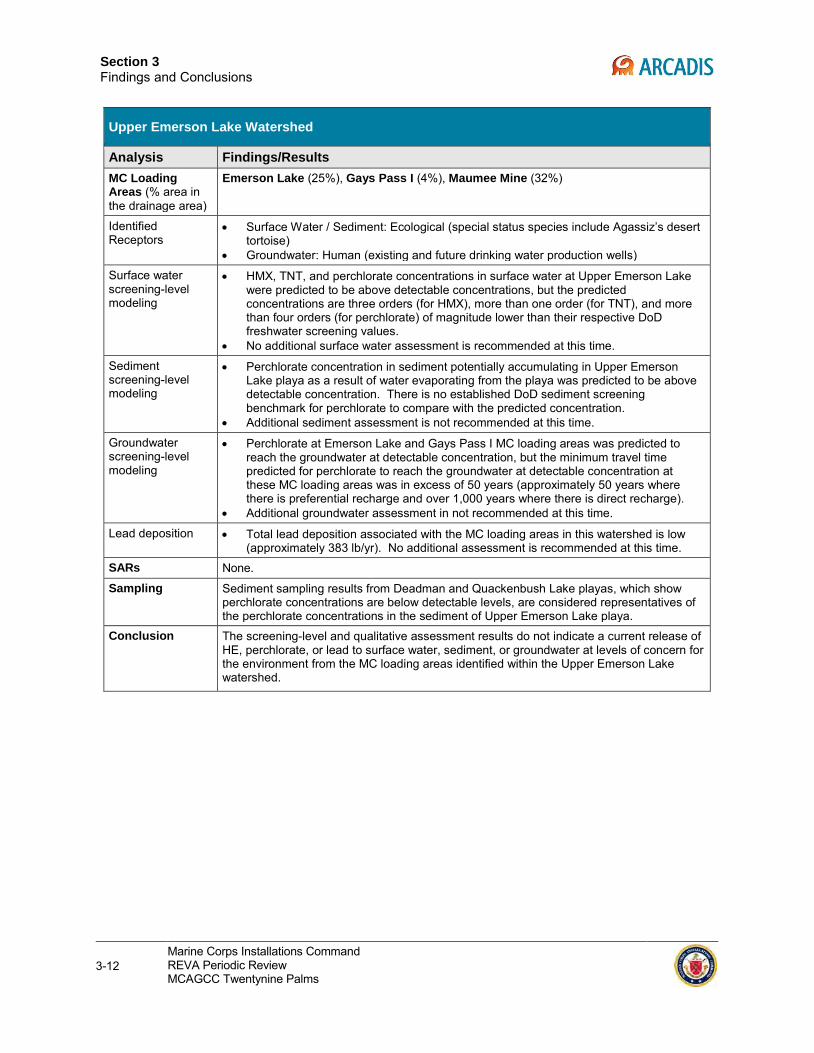
Section 3 Findings and Conclusions
Upper Emerson Lake Watershed
Analysis Findings/Results MC Loading Areas (% area in the drainage area)
Emerson Lake (25%), Gays Pass I (4%), Maumee Mine (32%)
Identified Receptors
• Surface Water / Sediment: Ecological (special status species include Agassiz’s desert tortoise)
• Groundwater: Human (existing and future drinking water production wells)
Surface water screening-level modeling
• HMX, TNT, and perchlorate concentrations in surface water at Upper Emerson Lake were predicted to be above detectable concentrations, but the predicted concentrations are three orders (for HMX), more than one order (for TNT), and more than four orders (for perchlorate) of magnitude lower than their respective DoD freshwater screening values.
• No additional surface water assessment is recommended at this time.
Sediment screening-level modeling
• Perchlorate concentration in sediment potentially accumulating in Upper Emerson Lake playa as a result of water evaporating from the playa was predicted to be above detectable concentration. There is no established DoD sediment screening benchmark for perchlorate to compare with the predicted concentration.
• Additional sediment assessment is not recommended at this time.
Groundwater screening-level modeling
• Perchlorate at Emerson Lake and Gays Pass I MC loading areas was predicted to reach the groundwater at detectable concentration, but the minimum travel time predicted for perchlorate to reach the groundwater at detectable concentration at these MC loading areas was in excess of 50 years (approximately 50 years where there is preferential recharge and over 1,000 years where there is direct recharge).
• Additional groundwater assessment in not recommended at this time.
Lead deposition • Total lead deposition associated with the MC loading areas in this watershed is low (approximately 383 lb/yr). No additional assessment is recommended at this time.
SARs None.
Sampling Sediment sampling results from Deadman and Quackenbush Lake playas, which show perchlorate concentrations are below detectable levels, are considered representatives of the perchlorate concentrations in the sediment of Upper Emerson Lake playa.
Conclusion The screening-level and qualitative assessment results do not indicate a current release of HE, perchlorate, or lead to surface water, sediment, or groundwater at levels of concern for the environment from the MC loading areas identified within the Upper Emerson Lake watershed.
3-12 Marine Corps Installations Command REVA Periodic Review MCAGCC Twentynine Palms
4. References
10 United States Code (U.S.C.) § 101(e) (3). 2006.
ARCADIS. 2014. Range Environmental Vulnerability Assessment Conceptual Site Model Update Marine Corps Air Ground Combat Center (MCAGCC) Twentynine Palms
ARCADIS/Malcolm Pirnie. 2012. Internal Working Draft Range Environmental Vulnerability Assessment Five-Year Review Report, Marine Corps Air Ground Combat Center Twentynine Palms.
DoD. 2004. Department of Defense Directive 4715.11 Environmental and Explosives Safety Management on Operational Ranges within the United States.
------. 2005. Department of Defense Instruction 4715.14 Operational Range Assessments.
------. 2013. Department of Defense Screening Values. Updated 2013.
DoN. 2012. Final Environmental Impact Statement, Land Acquisition and Airspace Establishment to Support Large-Scale Marine Air Ground Task Force Live Fire and Maneuver Training, Marine Corps Air Ground Combat Center Twentynine Palms, CA July 2012
------. 2013. Record of Decision for Land Acquisition and Airspace Establishment To Support Large-Scale Marine Air Ground Task Force Live-Fire and Maneuver Training at the Marine Corps Air Ground Combat Center, Twentynine Palms, CA. Federal Register Volume 78, Issue 33 (February 19, 2013).
Headquarters Marine Corps. 2009. Range Environmental Vulnerability Assessment Reference Manual.
------. 2010. Final Range Environmental Vulnerability Assessment Five-Year Review Manual.
Li and Martin. 2008. Geohydrology, Simulation of Regional Groundwater Flow, and Assessment of Water-Management Strategies, Twentynine Palms Area, California. United States Geological Survey Scientific Investigation Report.
Malcolm Pirnie, Inc. 2007. Final Range Environmental Vulnerability Assessment, Marine Corps Air Ground Combat Center Twentynine Palms.
MCAGCC Twentynine Palms. 2012a. Final Environmental Impact Statement – Land Acquisition and Airspace Establishment to Support Large-Scale Marine Air Ground Task Force Live Fire and Maneuver Training.
Marine Corps Installations Command REVA Periodic Review MCAGCC Twentynine Palms
4-1
Section 4 References
------. 2012b. Marine Air Ground Task Force Training Command Twentynine Palms, California, Integrated Natural Resources Management Plan and Environmental Assessment, Fiscal Years 2012-2017.
------. 2014a. Combat Center Order 3500.4K Marine Air Ground Task Force Training Command (MAGTFTC) Marine Corps Air Ground Combat Center (MCAGCC) Range, Training Area and Airspace (RTAA) Program Standard Operation Procedures for Range/Training Areas and Airspace.
------. 2014b. GIS files.
USFWS. 1994. Desert tortoise (Mojave population) recovery plan. U.S. Fish and Wildlife Service, Portland, Oregon.
4-2 Marine Corps Installations Command REVA Periodic Review MCAGCC Twentynine Palms

Appendix A Operational Range Summary
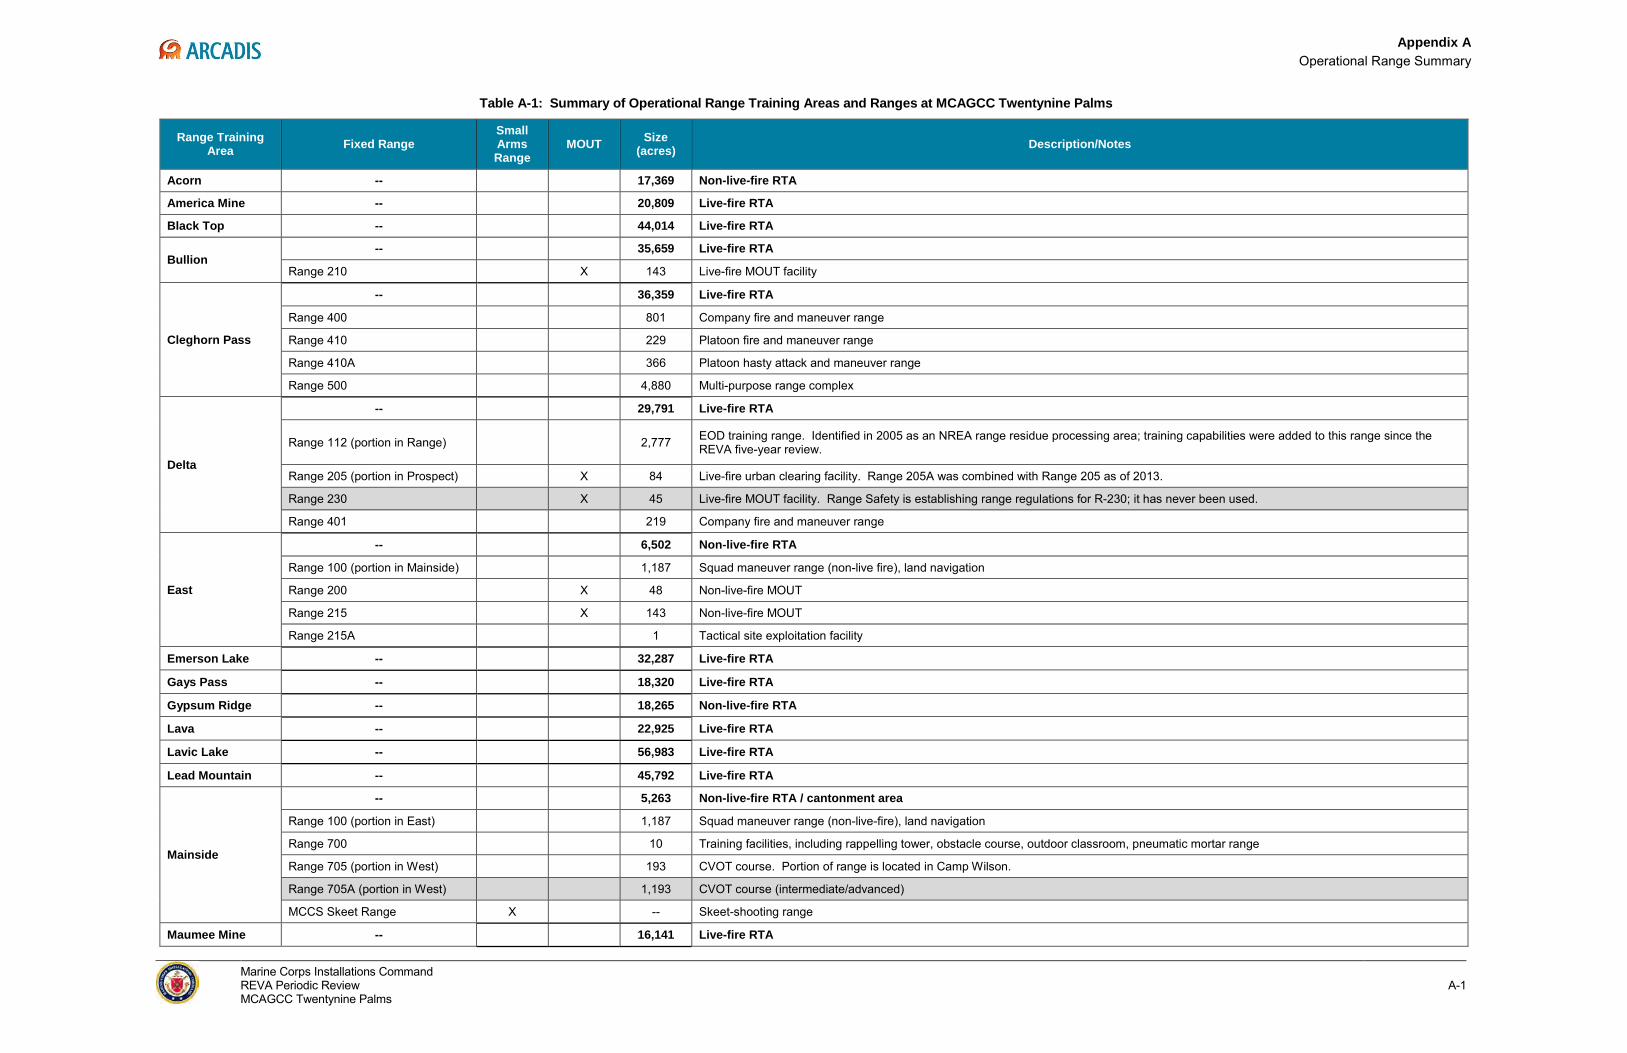
Appendix A
Operational Range Summary
Table A-1: Summary of Operational Range Training Areas and Ranges at MCAGCC Twentynine Palms
Range Training Area Fixed Range
Small Arms Range
MOUT Size (acres) Description/Notes
Acorn -- 17,369 Non-live-fire RTA
America Mine -- 20,809 Live-fire RTA
Black Top -- 44,014 Live-fire RTA
Bullion -- 35,659 Live-fire RTA
Range 210 X 143 Live-fire MOUT facility
Cleghorn Pass
-- 36,359 Live-fire RTA
Range 400 801 Company fire and maneuver range
Range 410 229 Platoon fire and maneuver range
Range 410A 366 Platoon hasty attack and maneuver range
Range 500 4,880 Multi-purpose range complex
Delta
-- 29,791 Live-fire RTA
Range 112 (portion in Range) 2,777 EOD training range. Identified in 2005 as an NREA range residue processing area; training capabilities were added to this range since the REVA five-year review.
Range 205 (portion in Prospect) X 84 Live-fire urban clearing facility. Range 205A was combined with Range 205 as of 2013.
Range 230 X 45 Live-fire MOUT facility. Range Safety is establishing range regulations for R-230; it has never been used.
Range 401 219 Company fire and maneuver range
East
-- 6,502 Non-live-fire RTA
Range 100 (portion in Mainside) 1,187 Squad maneuver range (non-live fire), land navigation
Range 200 X 48 Non-live-fire MOUT
Range 215 X 143 Non-live-fire MOUT
Range 215A 1 Tactical site exploitation facility
Emerson Lake -- 32,287 Live-fire RTA
Gays Pass -- 18,320 Live-fire RTA
Gypsum Ridge -- 18,265 Non-live-fire RTA
Lava -- 22,925 Live-fire RTA
Lavic Lake -- 56,983 Live-fire RTA
Lead Mountain -- 45,792 Live-fire RTA
Mainside
-- 5,263 Non-live-fire RTA / cantonment area
Range 100 (portion in East) 1,187 Squad maneuver range (non-live-fire), land navigation
Range 700 10 Training facilities, including rappelling tower, obstacle course, outdoor classroom, pneumatic mortar range
Range 705 (portion in West) 193 CVOT course. Portion of range is located in Camp Wilson.
Range 705A (portion in West) 1,193 CVOT course (intermediate/advanced)
MCCS Skeet Range X -- Skeet-shooting range
Maumee Mine -- 16,141 Live-fire RTA
Marine Corps Installations Command REVA Periodic Review MCAGCC Twentynine Palms
A-1
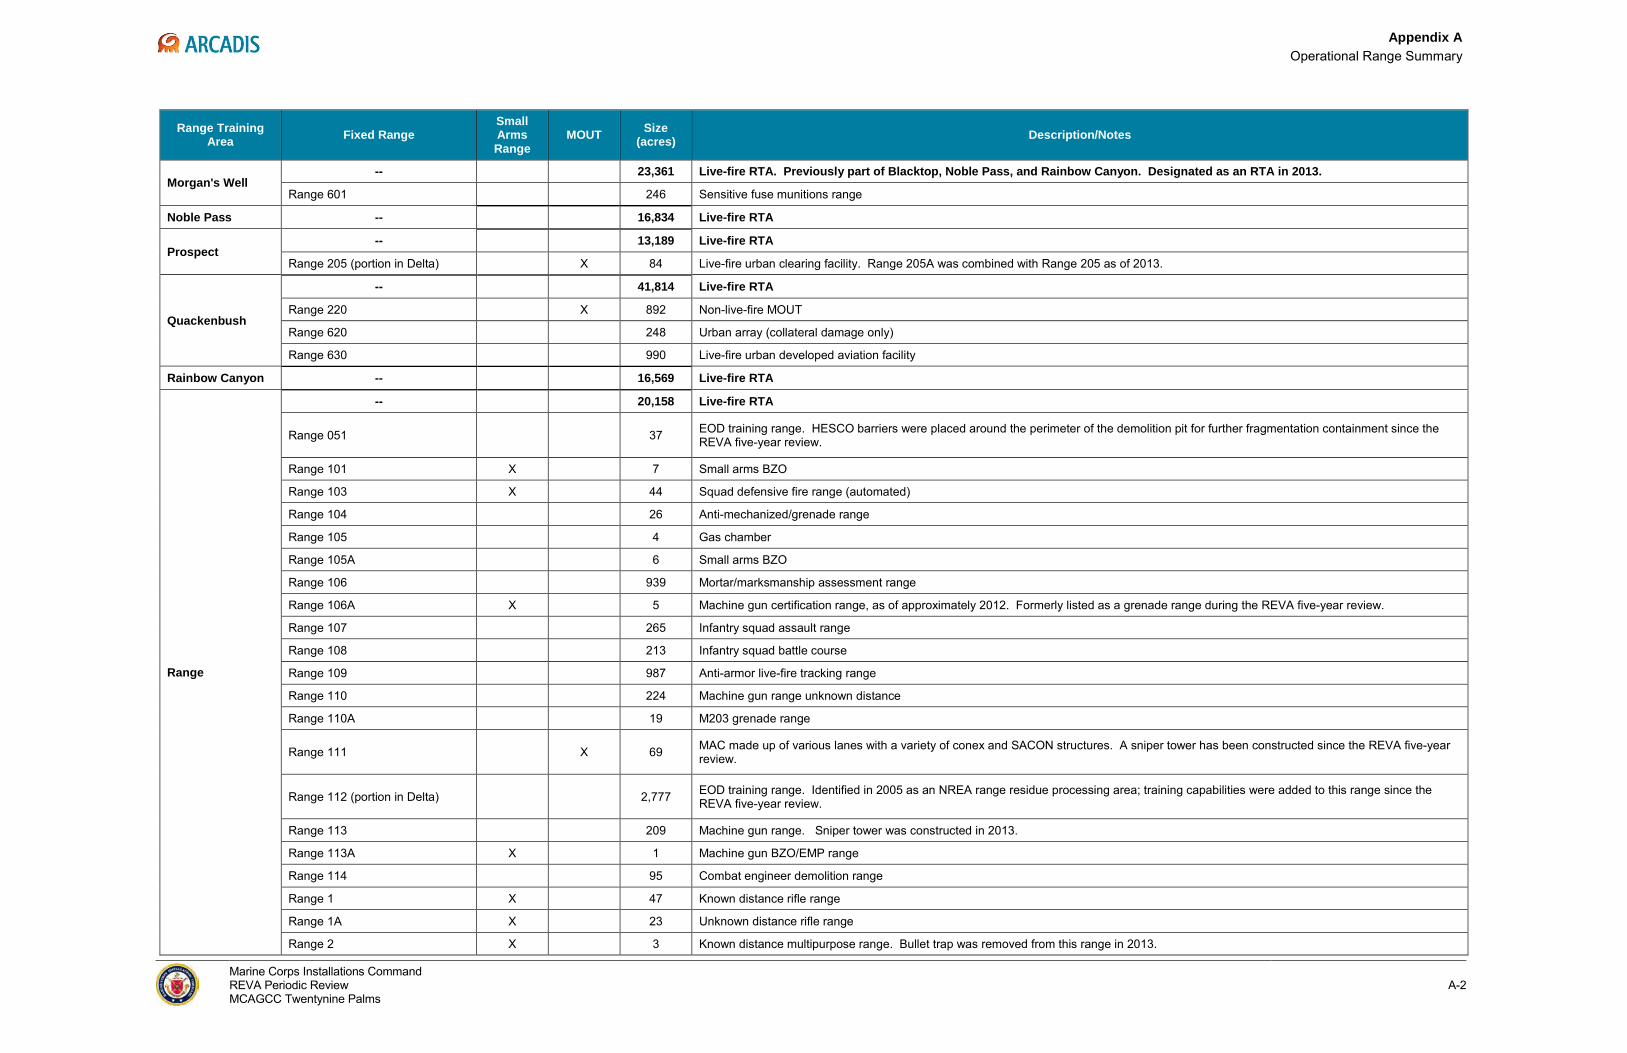
Appendix A Operational Range Summary
Range Training Area Fixed Range
Small Arms Range
MOUT Size (acres) Description/Notes
Morgan's Well -- 23,361 Live-fire RTA. Previously part of Blacktop, Noble Pass, and Rainbow Canyon. Designated as an RTA in 2013.
Range 601 246 Sensitive fuse munitions range
Noble Pass -- 16,834 Live-fire RTA
Prospect -- 13,189 Live-fire RTA
Range 205 (portion in Delta) X 84 Live-fire urban clearing facility. Range 205A was combined with Range 205 as of 2013.
Quackenbush
-- 41,814 Live-fire RTA
Range 220 X 892 Non-live-fire MOUT
Range 620 248 Urban array (collateral damage only)
Range 630 990 Live-fire urban developed aviation facility
Rainbow Canyon -- 16,569 Live-fire RTA
Range
-- 20,158 Live-fire RTA
Range 051 37 EOD training range. HESCO barriers were placed around the perimeter of the demolition pit for further fragmentation containment since the REVA five-year review.
Range 101 X 7 Small arms BZO
Range 103 X 44 Squad defensive fire range (automated)
Range 104 26 Anti-mechanized/grenade range
Range 105 4 Gas chamber
Range 105A 6 Small arms BZO
Range 106 939 Mortar/marksmanship assessment range
Range 106A X 5 Machine gun certification range, as of approximately 2012. Formerly listed as a grenade range during the REVA five-year review.
Range 107 265 Infantry squad assault range
Range 108 213 Infantry squad battle course
Range 109 987 Anti-armor live-fire tracking range
Range 110 224 Machine gun range unknown distance
Range 110A 19 M203 grenade range
Range 111 X 69 MAC made up of various lanes with a variety of conex and SACON structures. A sniper tower has been constructed since the REVA five-year review.
Range 112 (portion in Delta) 2,777 EOD training range. Identified in 2005 as an NREA range residue processing area; training capabilities were added to this range since the REVA five-year review.
Range 113 209 Machine gun range. Sniper tower was constructed in 2013.
Range 113A X 1 Machine gun BZO/EMP range
Range 114 95 Combat engineer demolition range
Range 1 X 47 Known distance rifle range
Range 1A X 23 Unknown distance rifle range
Range 2 X 3 Known distance multipurpose range. Bullet trap was removed from this range in 2013.
Marine Corps Installations Command REVA Periodic Review MCAGCC Twentynine Palms
A-2
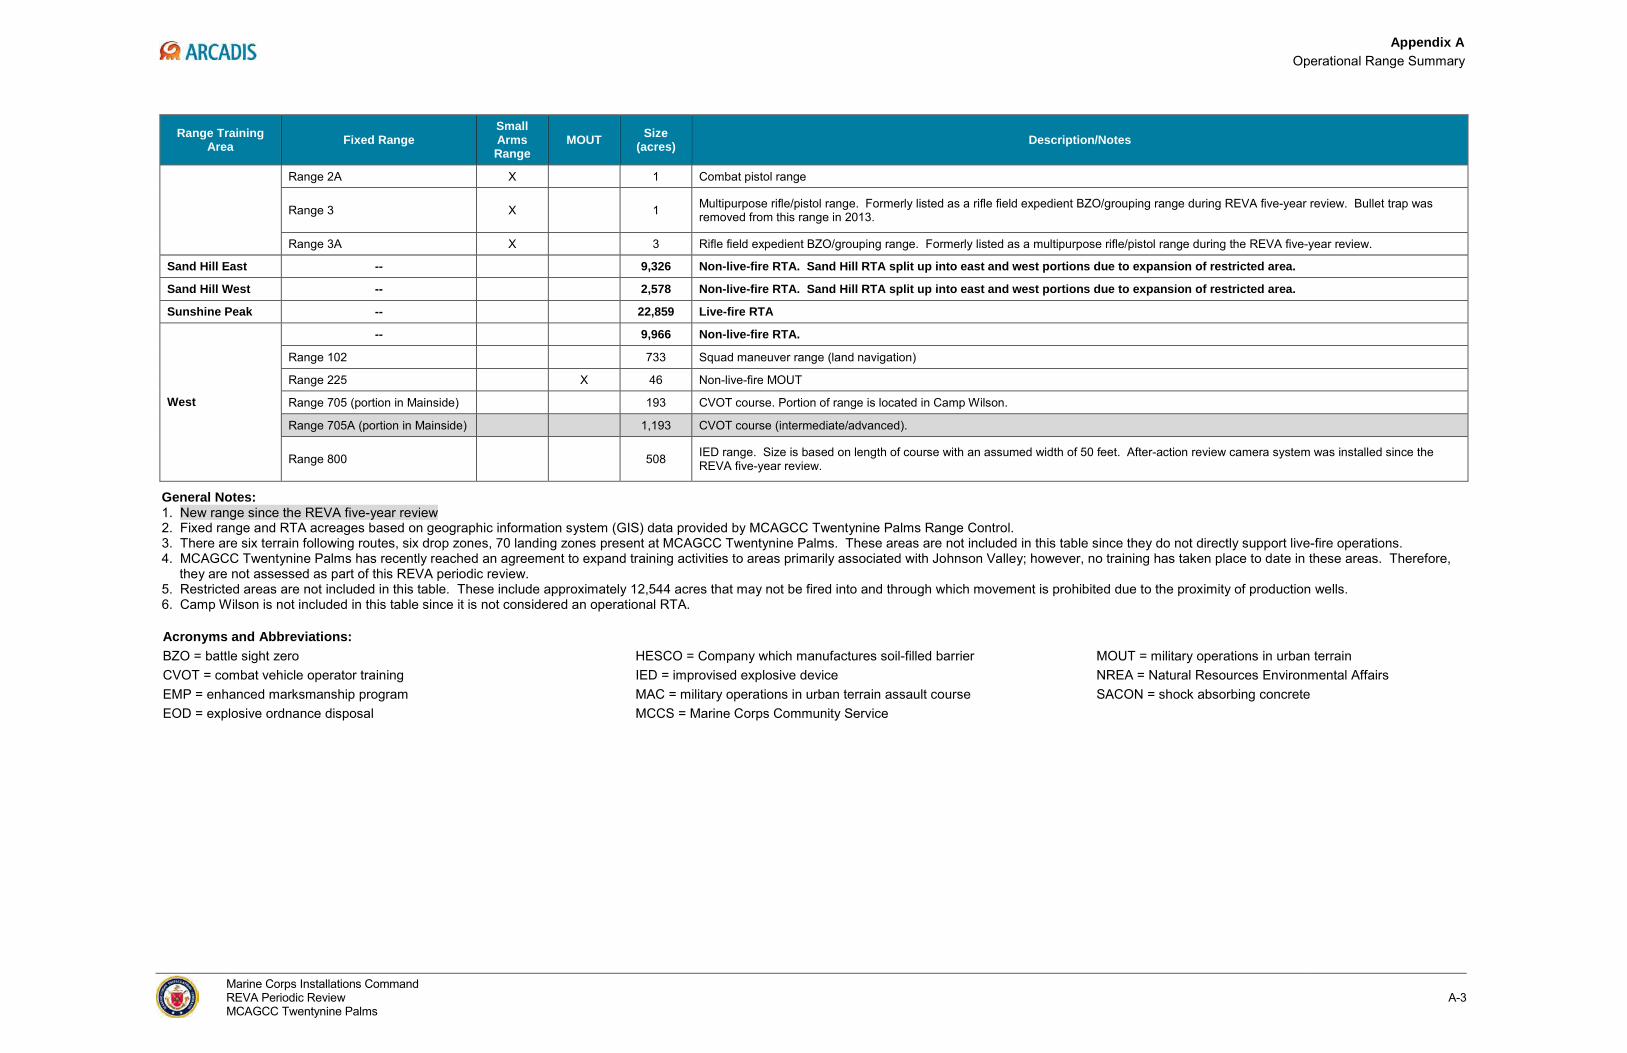
Appendix A Operational Range Summary
Range Training Area Fixed Range
Small Arms Range
MOUT Size (acres) Description/Notes
Range 2A X 1 Combat pistol range
Range 3 X 1 Multipurpose rifle/pistol range. Formerly listed as a rifle field expedient BZO/grouping range during REVA five-year review. Bullet trap was removed from this range in 2013.
Range 3A X 3 Rifle field expedient BZO/grouping range. Formerly listed as a multipurpose rifle/pistol range during the REVA five-year review.
Sand Hill East -- 9,326 Non-live-fire RTA. Sand Hill RTA split up into east and west portions due to expansion of restricted area.
Sand Hill West -- 2,578 Non-live-fire RTA. Sand Hill RTA split up into east and west portions due to expansion of restricted area.
Sunshine Peak -- 22,859 Live-fire RTA
West
-- 9,966 Non-live-fire RTA.
Range 102 733 Squad maneuver range (land navigation)
Range 225 X 46 Non-live-fire MOUT
Range 705 (portion in Mainside) 193 CVOT course. Portion of range is located in Camp Wilson.
Range 705A (portion in Mainside) 1,193 CVOT course (intermediate/advanced).
Range 800 508 IED range. Size is based on length of course with an assumed width of 50 feet. After-action review camera system was installed since the REVA five-year review.
General Notes: 1. New range since the REVA five-year review 2. Fixed range and RTA acreages based on geographic information system (GIS) data provided by MCAGCC Twentynine Palms Range Control. 3. There are six terrain following routes, six drop zones, 70 landing zones present at MCAGCC Twentynine Palms. These areas are not included in this table since they do not directly support live-fire operations. 4. MCAGCC Twentynine Palms has recently reached an agreement to expand training activities to areas primarily associated with Johnson Valley; however, no training has taken place to date in these areas. Therefore,
they are not assessed as part of this REVA periodic review. 5. Restricted areas are not included in this table. These include approximately 12,544 acres that may not be fired into and through which movement is prohibited due to the proximity of production wells. 6. Camp Wilson is not included in this table since it is not considered an operational RTA.
Acronyms and Abbreviations:
BZO = battle sight zero
HESCO = Company which manufactures soil-filled barriers MOUT = military operations in urban terrain CVOT = combat vehicle operator training IED = improvised explosive device NREA = Natural Resources Environmental Affairs EMP = enhanced marksmanship program
MAC = military operations in urban terrain assault course SACON = shock absorbing concrete
EOD = explosive ordnance disposal
MCCS = Marine Corps Community Service
Marine Corps Installations Command REVA Periodic Review MCAGCC Twentynine Palms
A-3

Appendix B Screening-Level Analysis Parameters and Methodology

Technical Memorandum
Surface Water Screening-Level Assessment

Technical Memorandum
Date: 26 January 2014
To: Jennifer Wilber, Marine Corps Installations Command
Copy: Chris Elliot, Andy Chatlin (Marine Corps Air Ground Combat Center [MCAGCC] Twentynine Palms) Michael Asakawa, Susan Herbert, Julie Dobschuetz, Ben Latham (ARCADIS)
From: Edidia Nefso (ARCADIS)
Re: Assessment of Munitions Constituent (MC) Concentrations in Surface Water and Sediment from MC Loading Areas at MCAGCC Twentynine Palms.
Project No.: 06285043.0000
INTRODUCTION This memorandum documents the results and recommended path forward based on a screening-level assessment of potential munitions constituent (MC) concentrations in surface water and sediment at Marine Corps Air Ground Combat Center (MCAGCC) Twentynine Palms. The Range Environmental Vulnerability Assessment (REVA) screening-level assessment evaluated the potential for MC to migrate from operational range areas via surface water and sediment to potential off-range human and ecological receptor locations. Recommendations are presented for identified off-range receptor locations that require investigation based on the screening-level assessment. The procedures used to conduct this screening-level assessment are presented in the REVA 5-Year Review Manual (HQMC, 2010). MC loading areas were selected for screening-level assessment based on range use and presence of surface drainage to potential receptor locations. A separate technical memorandum has been prepared to address MC transport in groundwater from the MC loading areas (ARCADIS, 2015). Twenty-four MC loading areas were assessed (Figure 1):
§ America Mine § Lead Mountain § Black Top I/Morgan’s Well I § Maumee Mine § Black Top II § Morgan’s Well II § Bullion § Noble Pass § Cleghorn Pass I § Prospect § Cleghorn Pass II § Quackenbush § Delta § Rainbow Canyon § Emerson Lake § Range 051
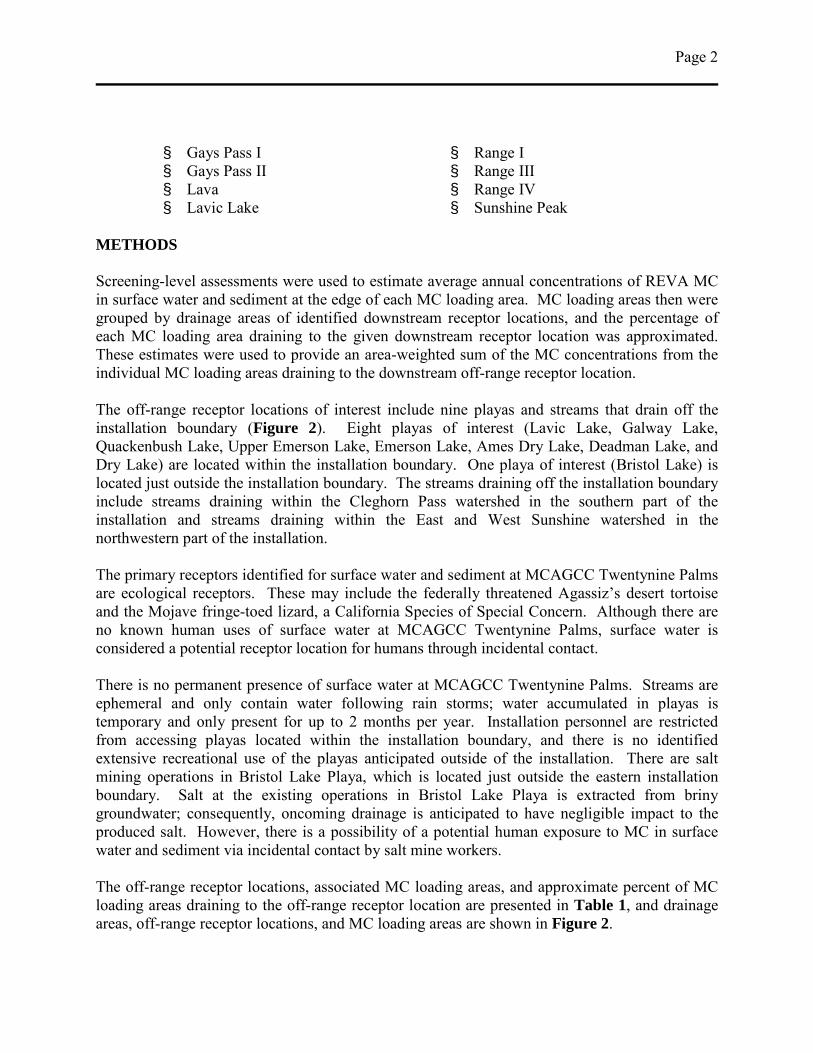
Page 2
§ Gays Pass I § Range I § Gays Pass II § Range III § Lava § Range IV § Lavic Lake § Sunshine Peak
METHODS Screening-level assessments were used to estimate average annual concentrations of REVA MC in surface water and sediment at the edge of each MC loading area. MC loading areas then were grouped by drainage areas of identified downstream receptor locations, and the percentage of each MC loading area draining to the given downstream receptor location was approximated. These estimates were used to provide an area-weighted sum of the MC concentrations from the individual MC loading areas draining to the downstream off-range receptor location. The off-range receptor locations of interest include nine playas and streams that drain off the installation boundary (Figure 2). Eight playas of interest (Lavic Lake, Galway Lake, Quackenbush Lake, Upper Emerson Lake, Emerson Lake, Ames Dry Lake, Deadman Lake, and Dry Lake) are located within the installation boundary. One playa of interest (Bristol Lake) is located just outside the installation boundary. The streams draining off the installation boundary include streams draining within the Cleghorn Pass watershed in the southern part of the installation and streams draining within the East and West Sunshine watershed in the northwestern part of the installation. The primary receptors identified for surface water and sediment at MCAGCC Twentynine Palms are ecological receptors. These may include the federally threatened Agassiz’s desert tortoise and the Mojave fringe-toed lizard, a California Species of Special Concern. Although there are no known human uses of surface water at MCAGCC Twentynine Palms, surface water is considered a potential receptor location for humans through incidental contact. There is no permanent presence of surface water at MCAGCC Twentynine Palms. Streams are ephemeral and only contain water following rain storms; water accumulated in playas is temporary and only present for up to 2 months per year. Installation personnel are restricted from accessing playas located within the installation boundary, and there is no identified extensive recreational use of the playas anticipated outside of the installation. There are salt mining operations in Bristol Lake Playa, which is located just outside the eastern installation boundary. Salt at the existing operations in Bristol Lake Playa is extracted from briny groundwater; consequently, oncoming drainage is anticipated to have negligible impact to the produced salt. However, there is a possibility of a potential human exposure to MC in surface water and sediment via incidental contact by salt mine workers. The off-range receptor locations, associated MC loading areas, and approximate percent of MC loading areas draining to the off-range receptor location are presented in Table 1, and drainage areas, off-range receptor locations, and MC loading areas are shown in Figure 2.
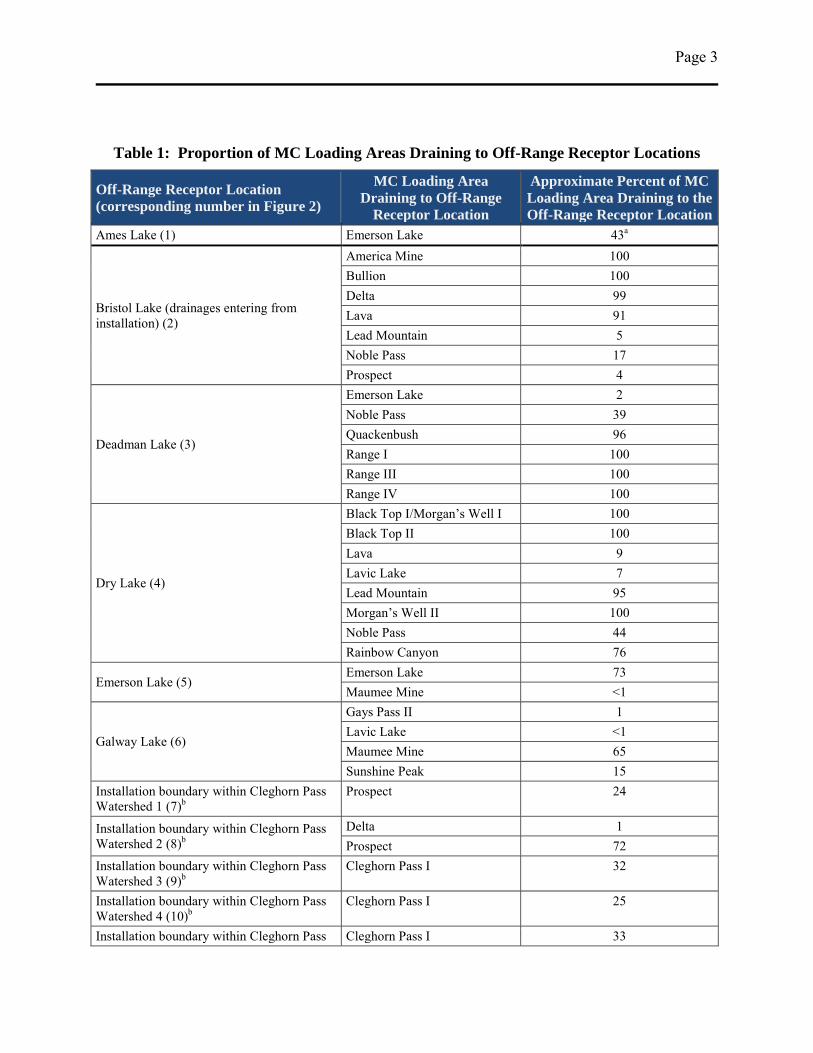
Page 3
Table 1: Proportion of MC Loading Areas Draining to Off-Range Receptor Locations
Off-Range Receptor Location (corresponding number in Figure 2)
MC Loading Area Draining to Off-Range
Receptor Location
Approximate Percent of MC Loading Area Draining to the Off-Range Receptor Location
Ames Lake (1) Emerson Lake 43a
Bristol Lake (drainages entering from installation) (2)
America Mine 100 Bullion 100 Delta 99 Lava 91 Lead Mountain 5 Noble Pass 17 Prospect 4
Deadman Lake (3)
Emerson Lake 2 Noble Pass 39 Quackenbush 96 Range I 100 Range III 100 Range IV 100
Dry Lake (4)
Black Top I/Morgan’s Well I 100 Black Top II 100 Lava 9 Lavic Lake 7 Lead Mountain 95 Morgan’s Well II 100 Noble Pass 44 Rainbow Canyon 76
Emerson Lake (5) Emerson Lake 73 Maumee Mine <1
Galway Lake (6)
Gays Pass II 1 Lavic Lake <1 Maumee Mine 65 Sunshine Peak 15
Installation boundary within Cleghorn Pass Watershed 1 (7)b
Prospect 24
Installation boundary within Cleghorn Pass Watershed 2 (8)b
Delta 1 Prospect 72
Installation boundary within Cleghorn Pass Watershed 3 (9)b
Cleghorn Pass I 32
Installation boundary within Cleghorn Pass Watershed 4 (10)b
Cleghorn Pass I 25
Installation boundary within Cleghorn Pass Cleghorn Pass I 33
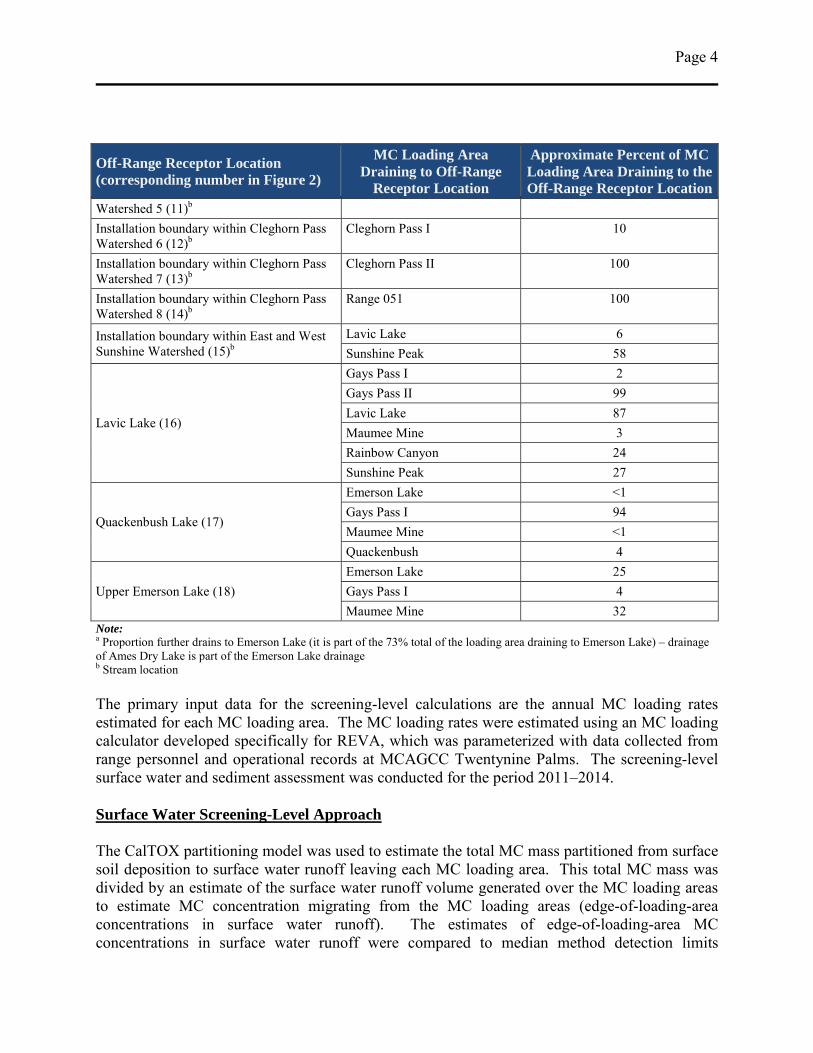
Page 4
Off-Range Receptor Location (corresponding number in Figure 2)
MC Loading Area Draining to Off-Range
Receptor Location
Approximate Percent of MC Loading Area Draining to the Off-Range Receptor Location
Watershed 5 (11)b Installation boundary within Cleghorn Pass Watershed 6 (12)b
Cleghorn Pass I 10
Installation boundary within Cleghorn Pass Watershed 7 (13)b
Cleghorn Pass II 100
Installation boundary within Cleghorn Pass Watershed 8 (14)b
Range 051 100
Installation boundary within East and West Sunshine Watershed (15)b
Lavic Lake 6 Sunshine Peak 58
Lavic Lake (16)
Gays Pass I 2 Gays Pass II 99 Lavic Lake 87 Maumee Mine 3 Rainbow Canyon 24 Sunshine Peak 27
Quackenbush Lake (17)
Emerson Lake <1 Gays Pass I 94 Maumee Mine <1 Quackenbush 4
Upper Emerson Lake (18) Emerson Lake 25 Gays Pass I 4 Maumee Mine 32
Note: a Proportion further drains to Emerson Lake (it is part of the 73% total of the loading area draining to Emerson Lake) – drainage of Ames Dry Lake is part of the Emerson Lake drainage b Stream location The primary input data for the screening-level calculations are the annual MC loading rates estimated for each MC loading area. The MC loading rates were estimated using an MC loading calculator developed specifically for REVA, which was parameterized with data collected from range personnel and operational records at MCAGCC Twentynine Palms. The screening-level surface water and sediment assessment was conducted for the period 2011–2014.
Surface Water Screening-Level Approach The CalTOX partitioning model was used to estimate the total MC mass partitioned from surface soil deposition to surface water runoff leaving each MC loading area. This total MC mass was divided by an estimate of the surface water runoff volume generated over the MC loading areas to estimate MC concentration migrating from the MC loading areas (edge-of-loading-area concentrations in surface water runoff). The estimates of edge-of-loading-area MC concentrations in surface water runoff were compared to median method detection limits
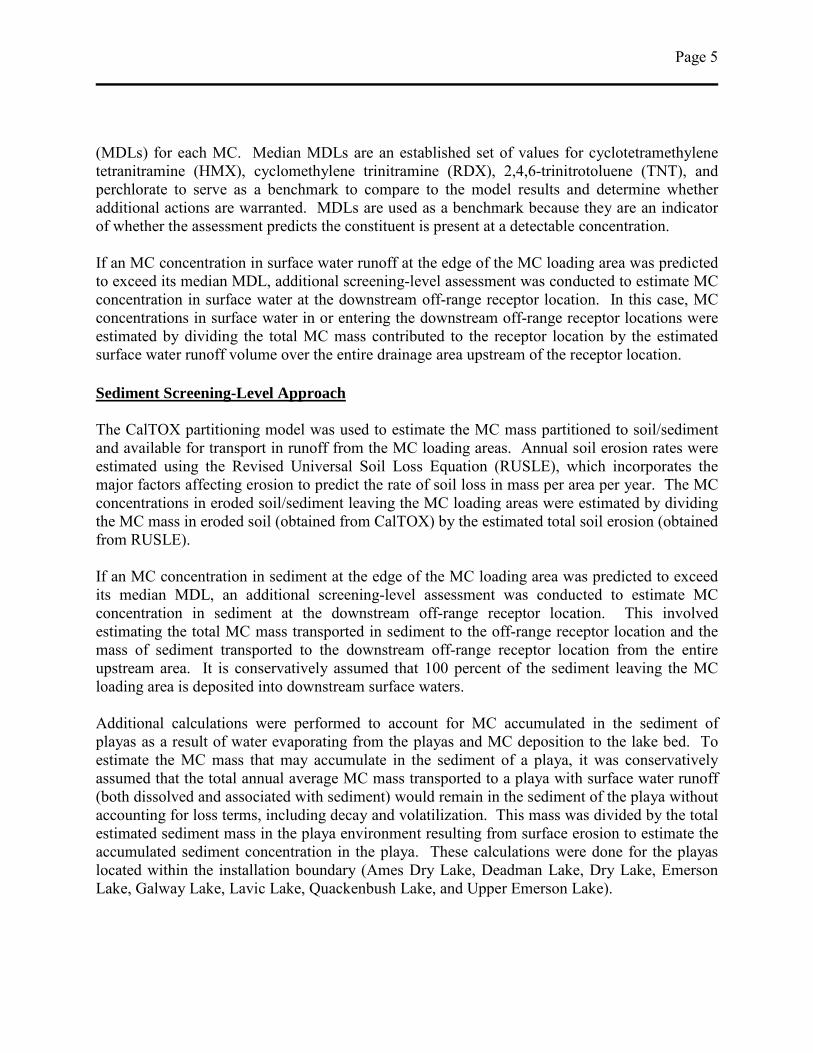
Page 5
(MDLs) for each MC. Median MDLs are an established set of values for cyclotetramethylene tetranitramine (HMX), cyclomethylene trinitramine (RDX), 2,4,6-trinitrotoluene (TNT), and perchlorate to serve as a benchmark to compare to the model results and determine whether additional actions are warranted. MDLs are used as a benchmark because they are an indicator of whether the assessment predicts the constituent is present at a detectable concentration. If an MC concentration in surface water runoff at the edge of the MC loading area was predicted to exceed its median MDL, additional screening-level assessment was conducted to estimate MC concentration in surface water at the downstream off-range receptor location. In this case, MC concentrations in surface water in or entering the downstream off-range receptor locations were estimated by dividing the total MC mass contributed to the receptor location by the estimated surface water runoff volume over the entire drainage area upstream of the receptor location. Sediment Screening-Level Approach The CalTOX partitioning model was used to estimate the MC mass partitioned to soil/sediment and available for transport in runoff from the MC loading areas. Annual soil erosion rates were estimated using the Revised Universal Soil Loss Equation (RUSLE), which incorporates the major factors affecting erosion to predict the rate of soil loss in mass per area per year. The MC concentrations in eroded soil/sediment leaving the MC loading areas were estimated by dividing the MC mass in eroded soil (obtained from CalTOX) by the estimated total soil erosion (obtained from RUSLE). If an MC concentration in sediment at the edge of the MC loading area was predicted to exceed its median MDL, an additional screening-level assessment was conducted to estimate MC concentration in sediment at the downstream off-range receptor location. This involved estimating the total MC mass transported in sediment to the off-range receptor location and the mass of sediment transported to the downstream off-range receptor location from the entire upstream area. It is conservatively assumed that 100 percent of the sediment leaving the MC loading area is deposited into downstream surface waters. Additional calculations were performed to account for MC accumulated in the sediment of playas as a result of water evaporating from the playas and MC deposition to the lake bed. To estimate the MC mass that may accumulate in the sediment of a playa, it was conservatively assumed that the total annual average MC mass transported to a playa with surface water runoff (both dissolved and associated with sediment) would remain in the sediment of the playa without accounting for loss terms, including decay and volatilization. This mass was divided by the total estimated sediment mass in the playa environment resulting from surface erosion to estimate the accumulated sediment concentration in the playa. These calculations were done for the playas located within the installation boundary (Ames Dry Lake, Deadman Lake, Dry Lake, Emerson Lake, Galway Lake, Lavic Lake, Quackenbush Lake, and Upper Emerson Lake).
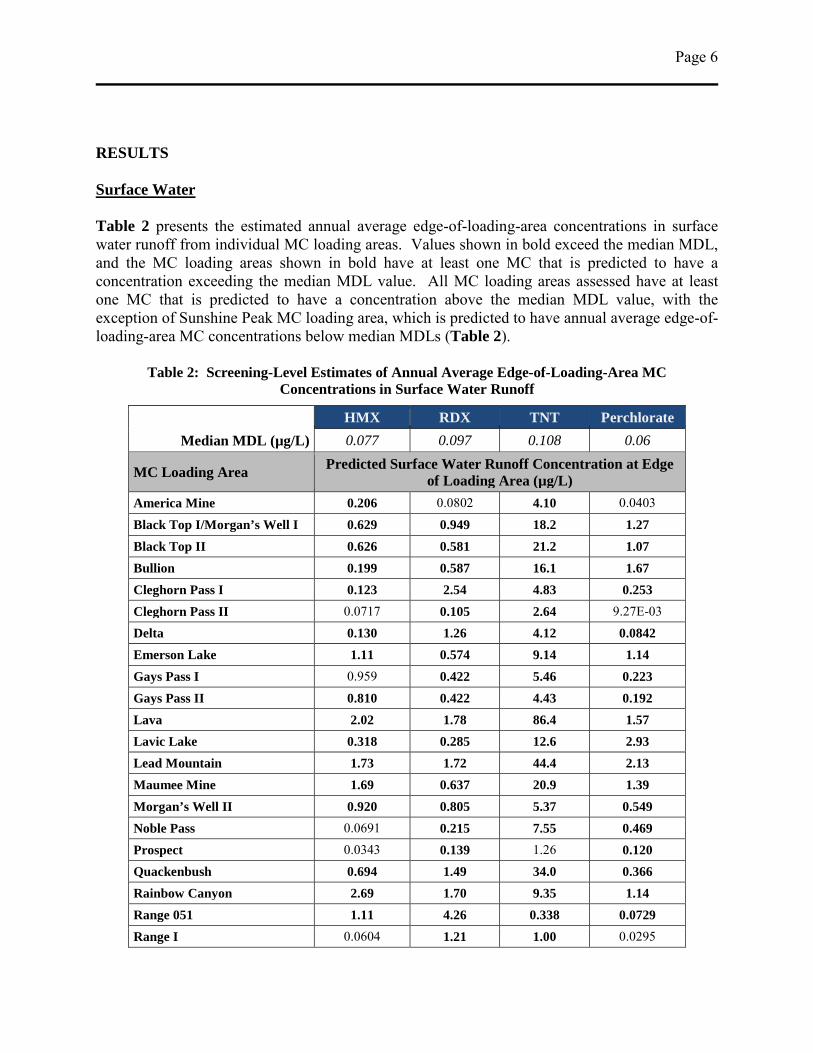
Page 6
RESULTS Surface Water Table 2 presents the estimated annual average edge-of-loading-area concentrations in surface water runoff from individual MC loading areas. Values shown in bold exceed the median MDL, and the MC loading areas shown in bold have at least one MC that is predicted to have a concentration exceeding the median MDL value. All MC loading areas assessed have at least one MC that is predicted to have a concentration above the median MDL value, with the exception of Sunshine Peak MC loading area, which is predicted to have annual average edge-of-loading-area MC concentrations below median MDLs (Table 2).
Table 2: Screening-Level Estimates of Annual Average Edge-of-Loading-Area MC Concentrations in Surface Water Runoff
Median MDL (µg/L) HMX RDX TNT Perchlorate 0.077 0.097 0.108 0.06
MC Loading Area Predicted Surface Water Runoff Concentration at Edge of Loading Area (µg/L)
America Mine 0.206 0.0802 4.10 0.0403
Black Top I/Morgan’s Well I 0.629 0.949 18.2 1.27 Black Top II 0.626 0.581 21.2 1.07 Bullion 0.199 0.587 16.1 1.67 Cleghorn Pass I 0.123 2.54 4.83 0.253 Cleghorn Pass II 0.0717 0.105 2.64 9.27E-03
Delta 0.130 1.26 4.12 0.0842 Emerson Lake 1.11 0.574 9.14 1.14 Gays Pass I 0.959 0.422 5.46 0.223 Gays Pass II 0.810 0.422 4.43 0.192 Lava 2.02 1.78 86.4 1.57 Lavic Lake 0.318 0.285 12.6 2.93 Lead Mountain 1.73 1.72 44.4 2.13 Maumee Mine 1.69 0.637 20.9 1.39 Morgan’s Well II 0.920 0.805 5.37 0.549 Noble Pass 0.0691 0.215 7.55 0.469 Prospect 0.0343 0.139 1.26 0.120 Quackenbush 0.694 1.49 34.0 0.366 Rainbow Canyon 2.69 1.70 9.35 1.14 Range 051 1.11 4.26 0.338 0.0729 Range I 0.0604 1.21 1.00 0.0295
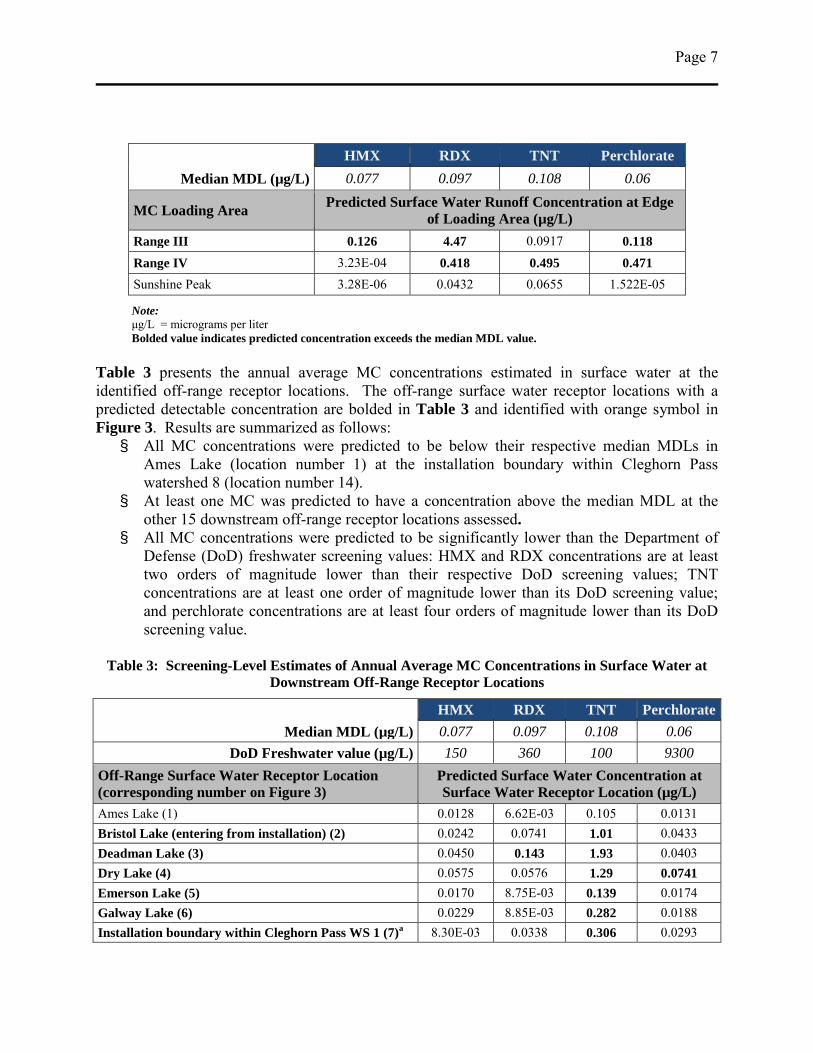
Page 7
Median MDL (µg/L) HMX RDX TNT Perchlorate 0.077 0.097 0.108 0.06
MC Loading Area Predicted Surface Water Runoff Concentration at Edge of Loading Area (µg/L)
Range III 0.126 4.47 0.0917 0.118 Range IV 3.23E-04 0.418 0.495 0.471 Sunshine Peak 3.28E-06 0.0432 0.0655 1.522E-05
Note: μg/L = micrograms per liter Bolded value indicates predicted concentration exceeds the median MDL value.
Table 3 presents the annual average MC concentrations estimated in surface water at the identified off-range receptor locations. The off-range surface water receptor locations with a predicted detectable concentration are bolded in Table 3 and identified with orange symbol in Figure 3. Results are summarized as follows: § All MC concentrations were predicted to be below their respective median MDLs in
Ames Lake (location number 1) at the installation boundary within Cleghorn Pass watershed 8 (location number 14).
§ At least one MC was predicted to have a concentration above the median MDL at the other 15 downstream off-range receptor locations assessed.
§ All MC concentrations were predicted to be significantly lower than the Department of Defense (DoD) freshwater screening values: HMX and RDX concentrations are at least two orders of magnitude lower than their respective DoD screening values; TNT concentrations are at least one order of magnitude lower than its DoD screening value; and perchlorate concentrations are at least four orders of magnitude lower than its DoD screening value.
Table 3: Screening-Level Estimates of Annual Average MC Concentrations in Surface Water at
Downstream Off-Range Receptor Locations
Median MDL (µg/L) HMX RDX TNT Perchlorate 0.077 0.097 0.108 0.06
DoD Freshwater value (µg/L) 150 360 100 9300 Off-Range Surface Water Receptor Location (corresponding number on Figure 3)
Predicted Surface Water Concentration at Surface Water Receptor Location (µg/L)
Ames Lake (1) 0.0128 6.62E-03 0.105 0.0131 Bristol Lake (entering from installation) (2) 0.0242 0.0741 1.01 0.0433 Deadman Lake (3) 0.0450 0.143 1.93 0.0403 Dry Lake (4) 0.0575 0.0576 1.29 0.0741 Emerson Lake (5) 0.0170 8.75E-03 0.139 0.0174 Galway Lake (6) 0.0229 8.85E-03 0.282 0.0188 Installation boundary within Cleghorn Pass WS 1 (7)a 8.30E-03 0.0338 0.306 0.0293
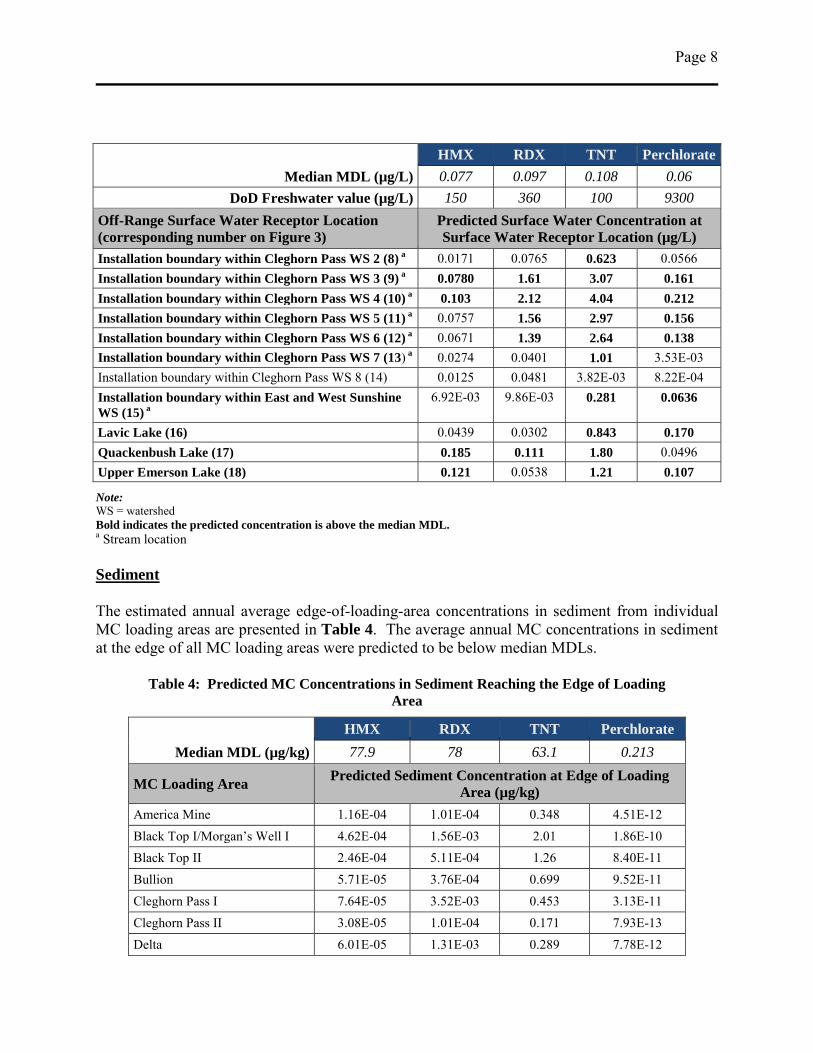
Page 8
Median MDL (µg/L) HMX RDX TNT Perchlorate 0.077 0.097 0.108 0.06
DoD Freshwater value (µg/L) 150 360 100 9300 Off-Range Surface Water Receptor Location (corresponding number on Figure 3)
Predicted Surface Water Concentration at Surface Water Receptor Location (µg/L)
Installation boundary within Cleghorn Pass WS 2 (8) a 0.0171 0.0765 0.623 0.0566 Installation boundary within Cleghorn Pass WS 3 (9) a 0.0780 1.61 3.07 0.161 Installation boundary within Cleghorn Pass WS 4 (10) a 0.103 2.12 4.04 0.212 Installation boundary within Cleghorn Pass WS 5 (11) a 0.0757 1.56 2.97 0.156 Installation boundary within Cleghorn Pass WS 6 (12) a 0.0671 1.39 2.64 0.138 Installation boundary within Cleghorn Pass WS 7 (13) a 0.0274 0.0401 1.01 3.53E-03 Installation boundary within Cleghorn Pass WS 8 (14) 0.0125 0.0481 3.82E-03 8.22E-04 Installation boundary within East and West Sunshine WS (15) a
6.92E-03 9.86E-03 0.281 0.0636
Lavic Lake (16) 0.0439 0.0302 0.843 0.170 Quackenbush Lake (17) 0.185 0.111 1.80 0.0496 Upper Emerson Lake (18) 0.121 0.0538 1.21 0.107
Note: WS = watershed Bold indicates the predicted concentration is above the median MDL. a Stream location
Sediment The estimated annual average edge-of-loading-area concentrations in sediment from individual MC loading areas are presented in Table 4. The average annual MC concentrations in sediment at the edge of all MC loading areas were predicted to be below median MDLs.
Table 4: Predicted MC Concentrations in Sediment Reaching the Edge of Loading Area
Median MDL (µg/kg) HMX RDX TNT Perchlorate 77.9 78 63.1 0.213
MC Loading Area Predicted Sediment Concentration at Edge of Loading Area (µg/kg)
America Mine 1.16E-04 1.01E-04 0.348 4.51E-12 Black Top I/Morgan’s Well I 4.62E-04 1.56E-03 2.01 1.86E-10 Black Top II 2.46E-04 5.11E-04 1.26 8.40E-11 Bullion 5.71E-05 3.76E-04 0.699 9.52E-11 Cleghorn Pass I 7.64E-05 3.52E-03 0.453 3.13E-11 Cleghorn Pass II 3.08E-05 1.01E-04 0.171 7.93E-13 Delta 6.01E-05 1.31E-03 0.289 7.78E-12
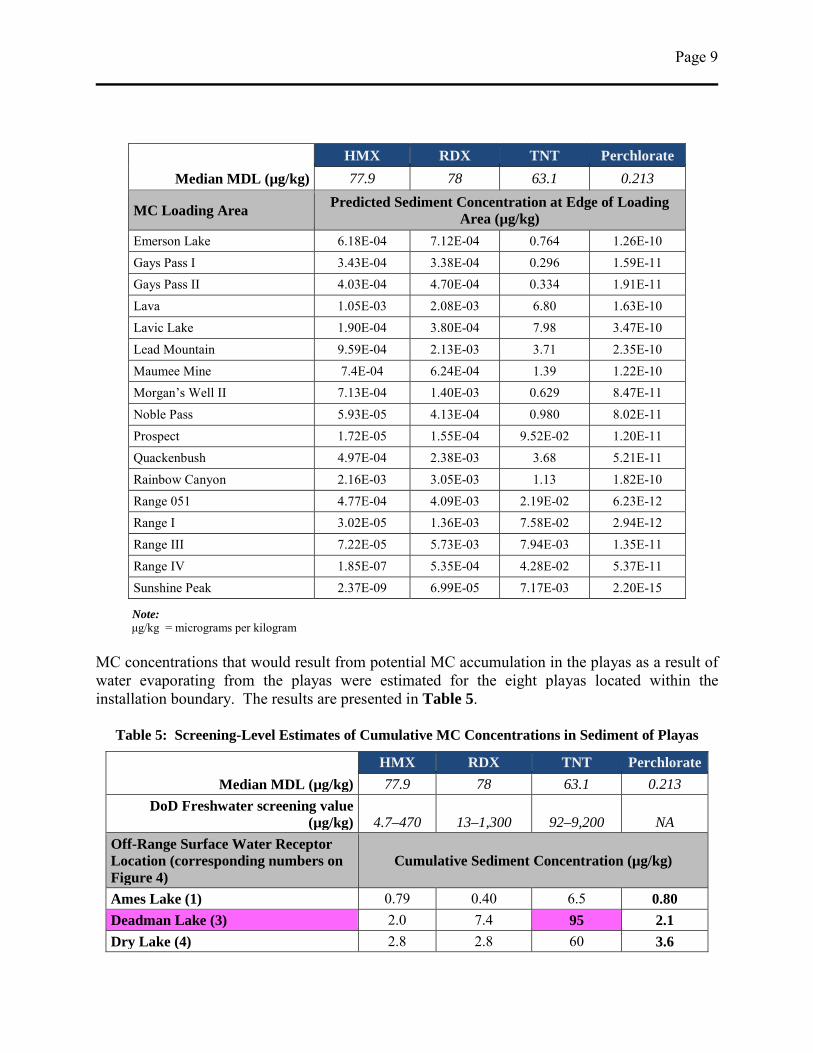
Page 9
Median MDL (µg/kg) HMX RDX TNT Perchlorate 77.9 78 63.1 0.213
MC Loading Area Predicted Sediment Concentration at Edge of Loading Area (µg/kg)
Emerson Lake 6.18E-04 7.12E-04 0.764 1.26E-10 Gays Pass I 3.43E-04 3.38E-04 0.296 1.59E-11 Gays Pass II 4.03E-04 4.70E-04 0.334 1.91E-11 Lava 1.05E-03 2.08E-03 6.80 1.63E-10 Lavic Lake 1.90E-04 3.80E-04 7.98 3.47E-10 Lead Mountain 9.59E-04 2.13E-03 3.71 2.35E-10 Maumee Mine 7.4E-04 6.24E-04 1.39 1.22E-10 Morgan’s Well II 7.13E-04 1.40E-03 0.629 8.47E-11 Noble Pass 5.93E-05 4.13E-04 0.980 8.02E-11 Prospect 1.72E-05 1.55E-04 9.52E-02 1.20E-11 Quackenbush 4.97E-04 2.38E-03 3.68 5.21E-11 Rainbow Canyon 2.16E-03 3.05E-03 1.13 1.82E-10 Range 051 4.77E-04 4.09E-03 2.19E-02 6.23E-12 Range I 3.02E-05 1.36E-03 7.58E-02 2.94E-12 Range III 7.22E-05 5.73E-03 7.94E-03 1.35E-11 Range IV 1.85E-07 5.35E-04 4.28E-02 5.37E-11 Sunshine Peak 2.37E-09 6.99E-05 7.17E-03 2.20E-15
Note: μg/kg = micrograms per kilogram
MC concentrations that would result from potential MC accumulation in the playas as a result of water evaporating from the playas were estimated for the eight playas located within the installation boundary. The results are presented in Table 5.
Table 5: Screening-Level Estimates of Cumulative MC Concentrations in Sediment of Playas
Median MDL (µg/kg) HMX RDX TNT Perchlorate 77.9 78 63.1 0.213
DoD Freshwater screening value (µg/kg) 4.7–470 13–1,300 92–9,200 NA
Off-Range Surface Water Receptor Location (corresponding numbers on Figure 4)
Cumulative Sediment Concentration (µg/kg)
Ames Lake (1) 0.79 0.40 6.5 0.80 Deadman Lake (3) 2.0 7.4 95 2.1 Dry Lake (4) 2.8 2.8 60 3.6
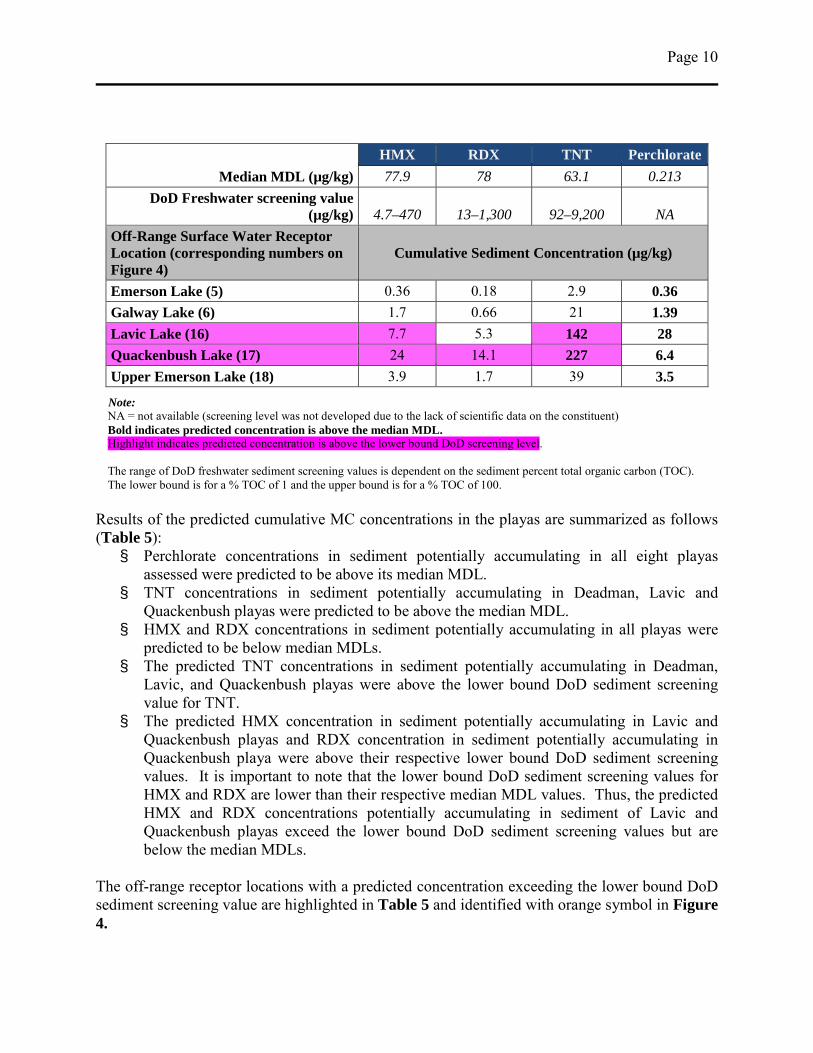
Page 10
Median MDL (µg/kg) HMX RDX TNT Perchlorate 77.9 78 63.1 0.213
DoD Freshwater screening value (µg/kg) 4.7–470 13–1,300 92–9,200 NA
Off-Range Surface Water Receptor Location (corresponding numbers on Figure 4)
Cumulative Sediment Concentration (µg/kg)
Emerson Lake (5) 0.36 0.18 2.9 0.36 Galway Lake (6) 1.7 0.66 21 1.39 Lavic Lake (16) 7.7 5.3 142 28 Quackenbush Lake (17) 24 14.1 227 6.4 Upper Emerson Lake (18) 3.9 1.7 39 3.5
Note: NA = not available (screening level was not developed due to the lack of scientific data on the constituent) Bold indicates predicted concentration is above the median MDL. Highlight indicates predicted concentration is above the lower bound DoD screening level. The range of DoD freshwater sediment screening values is dependent on the sediment percent total organic carbon (TOC). The lower bound is for a % TOC of 1 and the upper bound is for a % TOC of 100.
Results of the predicted cumulative MC concentrations in the playas are summarized as follows (Table 5): § Perchlorate concentrations in sediment potentially accumulating in all eight playas
assessed were predicted to be above its median MDL. § TNT concentrations in sediment potentially accumulating in Deadman, Lavic and
Quackenbush playas were predicted to be above the median MDL. § HMX and RDX concentrations in sediment potentially accumulating in all playas were
predicted to be below median MDLs. § The predicted TNT concentrations in sediment potentially accumulating in Deadman,
Lavic, and Quackenbush playas were above the lower bound DoD sediment screening value for TNT.
§ The predicted HMX concentration in sediment potentially accumulating in Lavic and Quackenbush playas and RDX concentration in sediment potentially accumulating in Quackenbush playa were above their respective lower bound DoD sediment screening values. It is important to note that the lower bound DoD sediment screening values for HMX and RDX are lower than their respective median MDL values. Thus, the predicted HMX and RDX concentrations potentially accumulating in sediment of Lavic and Quackenbush playas exceed the lower bound DoD sediment screening values but are below the median MDLs.
The off-range receptor locations with a predicted concentration exceeding the lower bound DoD sediment screening value are highlighted in Table 5 and identified with orange symbol in Figure 4.
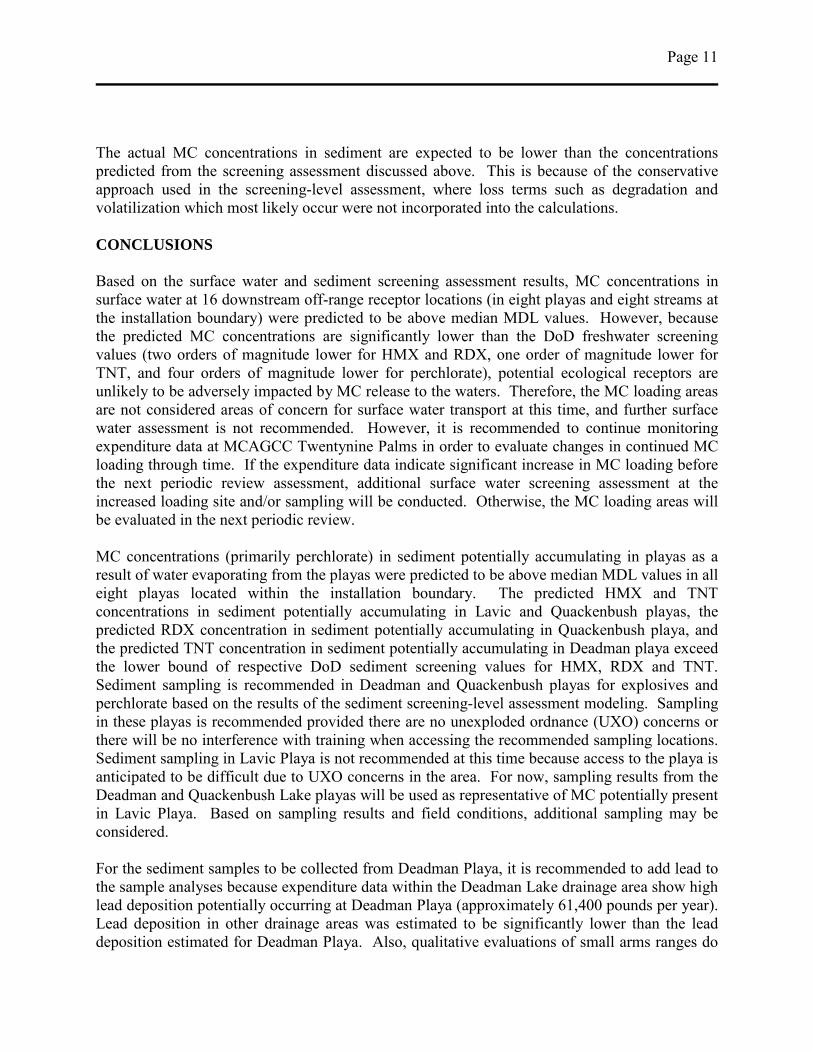
Page 11
The actual MC concentrations in sediment are expected to be lower than the concentrations predicted from the screening assessment discussed above. This is because of the conservative approach used in the screening-level assessment, where loss terms such as degradation and volatilization which most likely occur were not incorporated into the calculations. CONCLUSIONS Based on the surface water and sediment screening assessment results, MC concentrations in surface water at 16 downstream off-range receptor locations (in eight playas and eight streams at the installation boundary) were predicted to be above median MDL values. However, because the predicted MC concentrations are significantly lower than the DoD freshwater screening values (two orders of magnitude lower for HMX and RDX, one order of magnitude lower for TNT, and four orders of magnitude lower for perchlorate), potential ecological receptors are unlikely to be adversely impacted by MC release to the waters. Therefore, the MC loading areas are not considered areas of concern for surface water transport at this time, and further surface water assessment is not recommended. However, it is recommended to continue monitoring expenditure data at MCAGCC Twentynine Palms in order to evaluate changes in continued MC loading through time. If the expenditure data indicate significant increase in MC loading before the next periodic review assessment, additional surface water screening assessment at the increased loading site and/or sampling will be conducted. Otherwise, the MC loading areas will be evaluated in the next periodic review. MC concentrations (primarily perchlorate) in sediment potentially accumulating in playas as a result of water evaporating from the playas were predicted to be above median MDL values in all eight playas located within the installation boundary. The predicted HMX and TNT concentrations in sediment potentially accumulating in Lavic and Quackenbush playas, the predicted RDX concentration in sediment potentially accumulating in Quackenbush playa, and the predicted TNT concentration in sediment potentially accumulating in Deadman playa exceed the lower bound of respective DoD sediment screening values for HMX, RDX and TNT. Sediment sampling is recommended in Deadman and Quackenbush playas for explosives and perchlorate based on the results of the sediment screening-level assessment modeling. Sampling in these playas is recommended provided there are no unexploded ordnance (UXO) concerns or there will be no interference with training when accessing the recommended sampling locations. Sediment sampling in Lavic Playa is not recommended at this time because access to the playa is anticipated to be difficult due to UXO concerns in the area. For now, sampling results from the Deadman and Quackenbush Lake playas will be used as representative of MC potentially present in Lavic Playa. Based on sampling results and field conditions, additional sampling may be considered. For the sediment samples to be collected from Deadman Playa, it is recommended to add lead to the sample analyses because expenditure data within the Deadman Lake drainage area show high lead deposition potentially occurring at Deadman Playa (approximately 61,400 pounds per year). Lead deposition in other drainage areas was estimated to be significantly lower than the lead deposition estimated for Deadman Playa. Also, qualitative evaluations of small arms ranges do
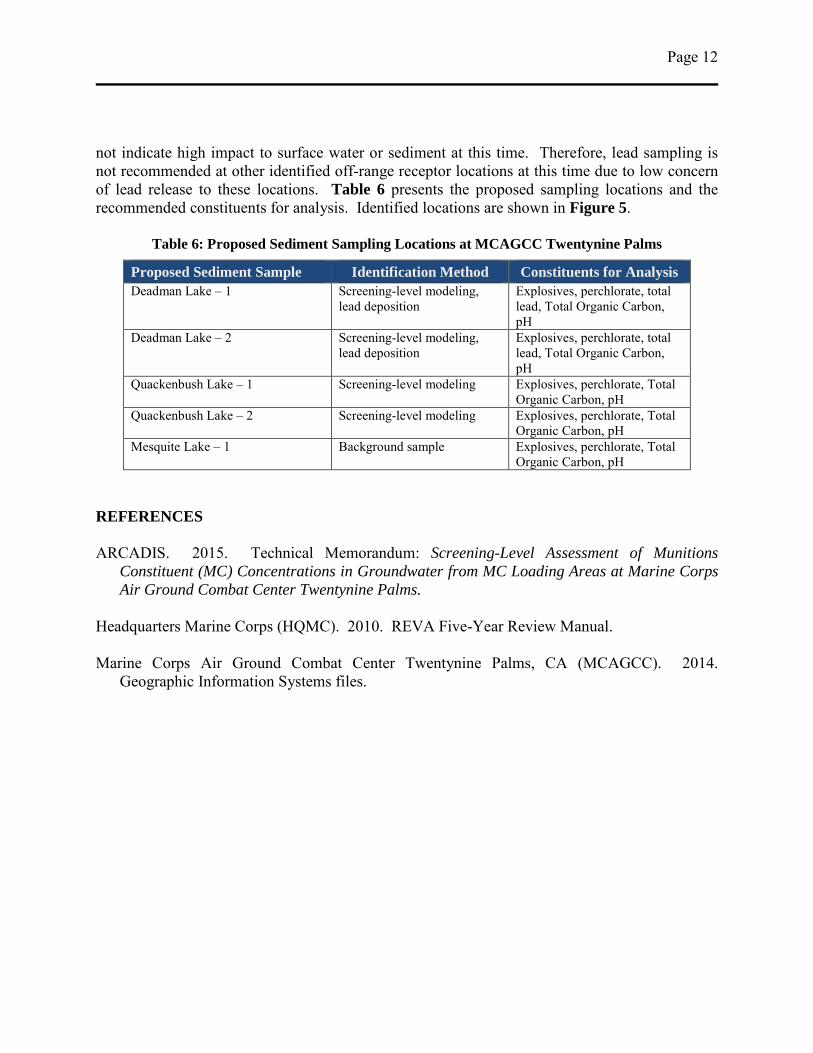
Page 12
not indicate high impact to surface water or sediment at this time. Therefore, lead sampling is not recommended at other identified off-range receptor locations at this time due to low concern of lead release to these locations. Table 6 presents the proposed sampling locations and the recommended constituents for analysis. Identified locations are shown in Figure 5.
Table 6: Proposed Sediment Sampling Locations at MCAGCC Twentynine Palms
Proposed Sediment Sample Identification Method Constituents for Analysis Deadman Lake – 1 Screening-level modeling,
lead deposition Explosives, perchlorate, total lead, Total Organic Carbon, pH
Deadman Lake – 2 Screening-level modeling, lead deposition
Explosives, perchlorate, total lead, Total Organic Carbon, pH
Quackenbush Lake – 1 Screening-level modeling Explosives, perchlorate, Total Organic Carbon, pH
Quackenbush Lake – 2 Screening-level modeling Explosives, perchlorate, Total Organic Carbon, pH
Mesquite Lake – 1 Background sample Explosives, perchlorate, Total Organic Carbon, pH
REFERENCES ARCADIS. 2015. Technical Memorandum: Screening-Level Assessment of Munitions
Constituent (MC) Concentrations in Groundwater from MC Loading Areas at Marine Corps Air Ground Combat Center Twentynine Palms.
Headquarters Marine Corps (HQMC). 2010. REVA Five-Year Review Manual. Marine Corps Air Ground Combat Center Twentynine Palms, CA (MCAGCC). 2014.
Geographic Information Systems files.

FIGURES
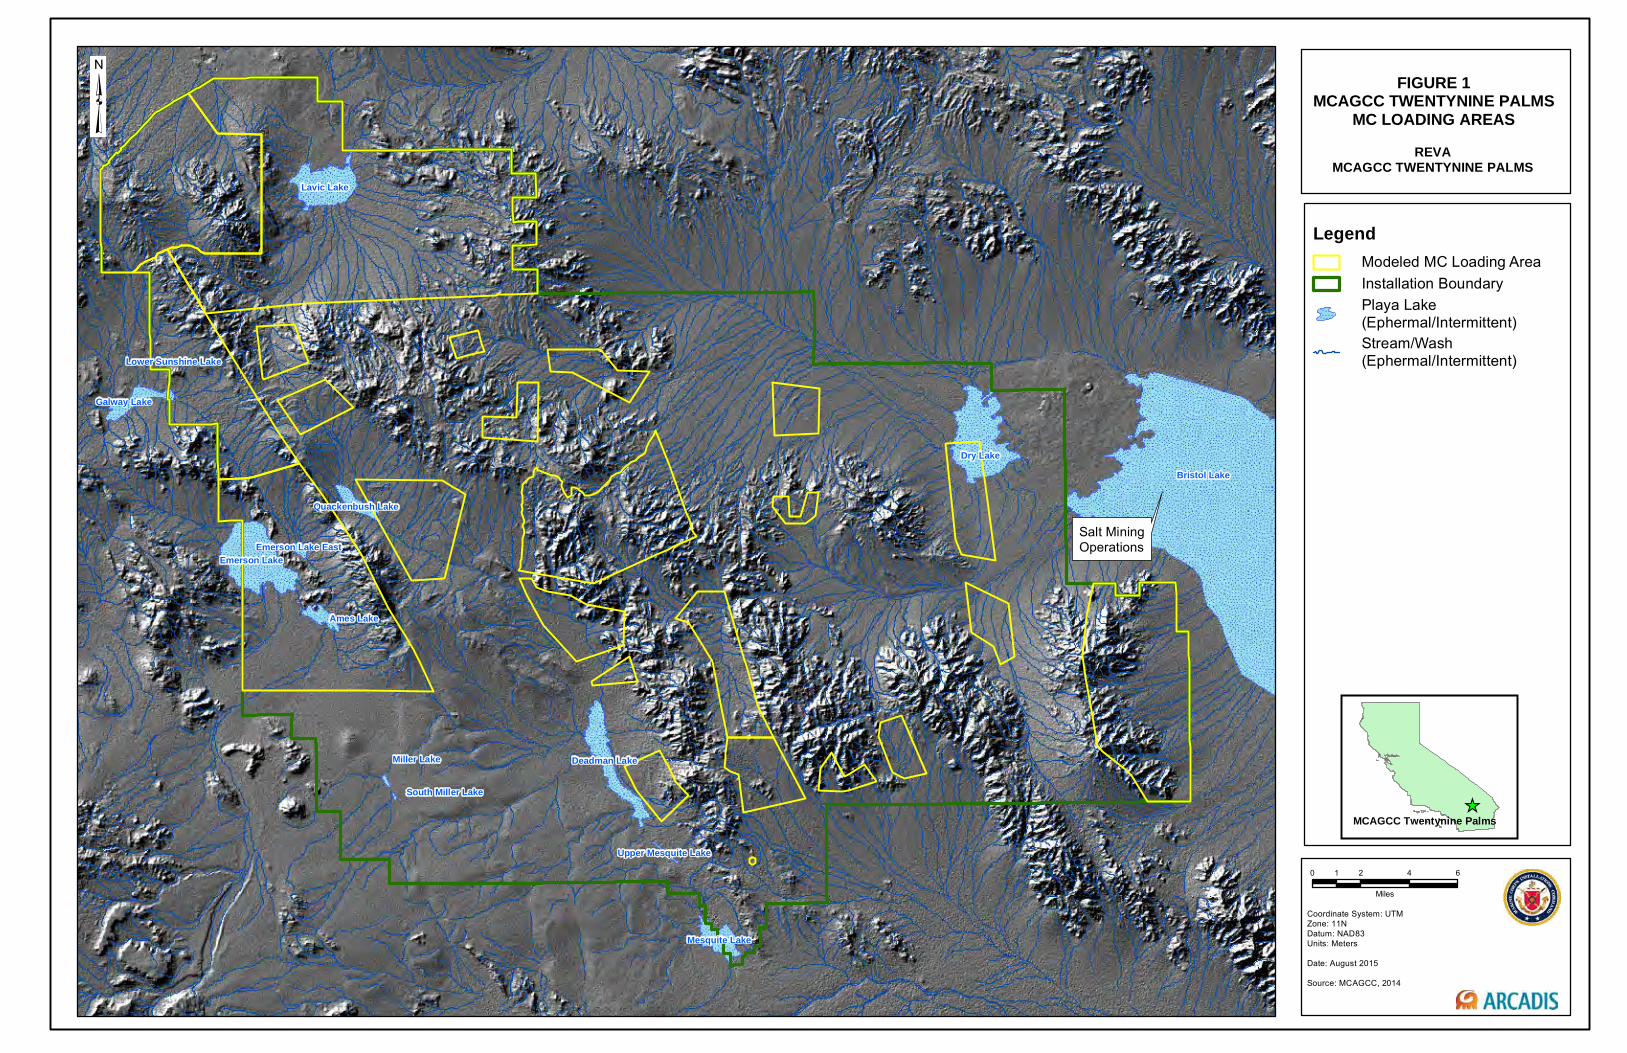
Salt MiningOperations
Bristol Lake
Ames Lake
Miller Lake
South Miller Lake
Dry Lake
Lavic Lake
Emerson Lake
Deadman Lake
Mesquite Lake
Galway Lake
Quackenbush Lake
Emerson Lake East
Upper Mesquite Lake
Lower Sunshine Lake
FIGURE 1MCAGCC TWENTYNINE PALMS
MC LOADING AREAS
Coordinate System: UTM Zone: 11NDatum: NAD83Units: Meters
Date: August 2015
Source: MCAGCC, 2014
MCAGCC Twentynine Palms
0 2 4 61
Miles
REVAMCAGCC TWENTYNINE PALMS
LegendModeled MC Loading AreaInstallation BoundaryPlaya Lake(Ephermal/Intermittent)Stream/Wash(Ephermal/Intermittent)
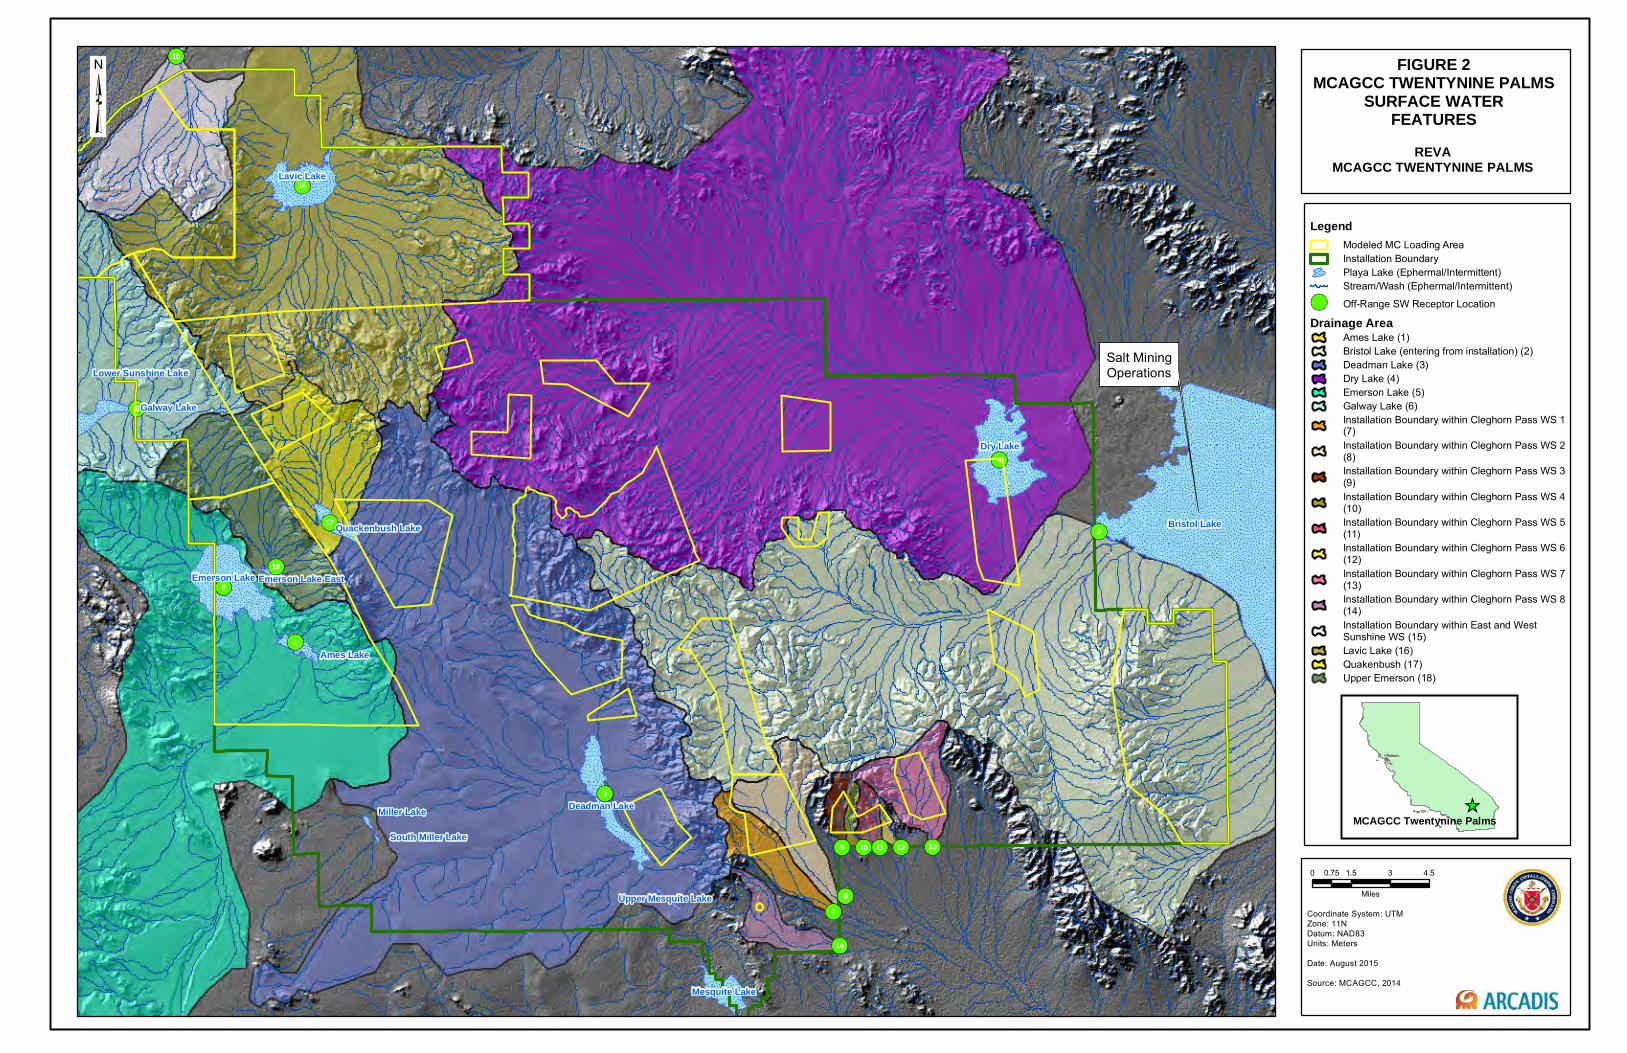
Salt MiningOperations
Bristol Lake
Ames Lake
Miller Lake
South Miller Lake
1
3
2
4
5
6
7
9
8
15
10 11 12 13
14
16
17
18
Dry Lake
Emerson Lake
Lavic Lake
Deadman Lake
Mesquite Lake
Galway Lake
Quackenbush Lake
Emerson Lake East
Upper Mesquite Lake
Lower Sunshine Lake
FIGURE 2MCAGCC TWENTYNINE PALMS
SURFACE WATERFEATURES
Coordinate System: UTM Zone: 11NDatum: NAD83Units: Meters
Date: August 2015
Source: MCAGCC, 2014
MCAGCC Twentynine Palms
0 1.5 3 4.50.75
Miles
REVAMCAGCC TWENTYNINE PALMS
LegendModeled MC Loading AreaInstallation BoundaryPlaya Lake (Ephermal/Intermittent)Stream/Wash (Ephermal/Intermittent)
Off-Range SW Receptor Location
Drainage AreaAmes Lake (1)Bristol Lake (entering from installation) (2)Deadman Lake (3)Dry Lake (4)Emerson Lake (5)Galway Lake (6)Installation Boundary within Cleghorn Pass WS 1(7)Installation Boundary within Cleghorn Pass WS 2(8)Installation Boundary within Cleghorn Pass WS 3(9)Installation Boundary within Cleghorn Pass WS 4(10)Installation Boundary within Cleghorn Pass WS 5(11)Installation Boundary within Cleghorn Pass WS 6(12)Installation Boundary within Cleghorn Pass WS 7(13)Installation Boundary within Cleghorn Pass WS 8(14)Installation Boundary within East and WestSunshine WS (15)Lavic Lake (16)Quakenbush (17)Upper Emerson (18)

Salt MiningOperations
Bristol Lake
Miller Lake
South Miller Lake
Ames Lake1
3
2
4
5
6
7
9
8
15
10 11 12 13
14
16
17
18
Dry Lake
Emerson Lake
Lavic Lake
Deadman Lake
Mesquite Lake
Galway Lake
Quackenbush Lake
Emerson Lake East
Upper Mesquite Lake
Lower Sunshine Lake
FIGURE 3MCAGCC TWENTYNINE PALMSPRDICTED SURFACE WATER
CONCENTRATION DETECTED AT OFF-RANGE RECEPTOR
LOCATION
Coordinate System: UTM Zone: 11NDatum: NAD83Units: Meters
Date: August 2015
Source: MCAGCC, 2014
MCAGCC Twentynine Palms
0 2 4 61
Miles
REVAMCAGCC TWENTYNINE PALMS
LegendModeled MC Loading AreaInstallation BoundaryPlaya Lake (Ephermal/Intermittent)Stream/Wash (Ephermal/Intermittent)Off-Range Receptor Location with PredictedDetectionOff-Range Receptor Location with no PredictedDetection
Drainage AreaAmes Lake (1)Bristol Lake (entering from installation) (2)Deadman Lake (3)Dry Lake (4)Emerson Lake (5)Galway Lake (6)Installation Boundary within Cleghorn Pass WS 1(7)Installation Boundary within Cleghorn Pass WS 2(8)Installation Boundary within Cleghorn Pass WS 3(9)Installation Boundary within Cleghorn Pass WS 4(10)Installation Boundary within Cleghorn Pass WS 5(11)Installation Boundary within Cleghorn Pass WS 6(12)Installation Boundary within Cleghorn Pass WS 7(13)Installation Boundary within Cleghorn Pass WS 8(14)Installation Boundary within East and WestSunshine WS (15)Lavic Lake (16)Quakenbush (17)Upper Emerson (18)

Salt MiningOperations
Bristol Lake
Ames Lake
Miller Lake
South Miller Lake
1
3
2
4
5
6
7
9
8
15
10 11 12 13
14
16
17
18
Dale Lake
Dry Lake
Emerson Lake
Lavic Lake
Deadman Lake
Mesquite Lake
Galway Lake
Quackenbush Lake
Emerson Lake East
Upper Mesquite Lake
Lower Sunshine Lake
FIGURE 4MCAGCC TWENTYNINE PALMS
PREDICTED SEDIMENT CONCENTRATION EXCEEDING
DOD SCREENING VALUE AT OFFRANGE RECEPTOR LOCATION
Coordinate System: UTM Zone: 11NDatum: NAD83Units: Meters
Date: August 2015
Source: MCAGCC, 2014
MCAGCC Twentynine Palms
0 2 4 61
Miles
REVAMCAGCC TWENTYNINE PALMS
LegendModeled MC Loading AreaInstallation BoundaryPlaya Lake (Ephermal/Intermittent)Stream/Wash (Ephermal/Intermittent)Off-Range Receptor Location with PredictedConcentration Above DoD Screening ValueOff-Range Receptor Location with no PredictedConcentration Below DoD Screening Value
Drainage AreaAmes Lake (1)Bristol Lake (entering from installation) (2)Deadman Lake (3)Dry Lake (4)Emerson Lake (5)Galway Lake (6)Installation Boundary within Cleghorn Pass WS 1(7)Installation Boundary within Cleghorn Pass WS 2(8)Installation Boundary within Cleghorn Pass WS 3(9)Installation Boundary within Cleghorn Pass WS 4(10)Installation Boundary within Cleghorn Pass WS 5(11)Installation Boundary within Cleghorn Pass WS 6(12)Installation Boundary within Cleghorn Pass WS 7(13)Installation Boundary within Cleghorn Pass WS 8(14)Installation Boundary within East and WestSunshine WS (15)Lavic Lake (16)Quakenbush (17)Upper Emerson (18)

Additional Tables Surface Water Screening-Level Assessment
Table B-1: Percent MC Mass Contributed by MC Loading Areas Tables B-2 through B-9: Modeling Parameters

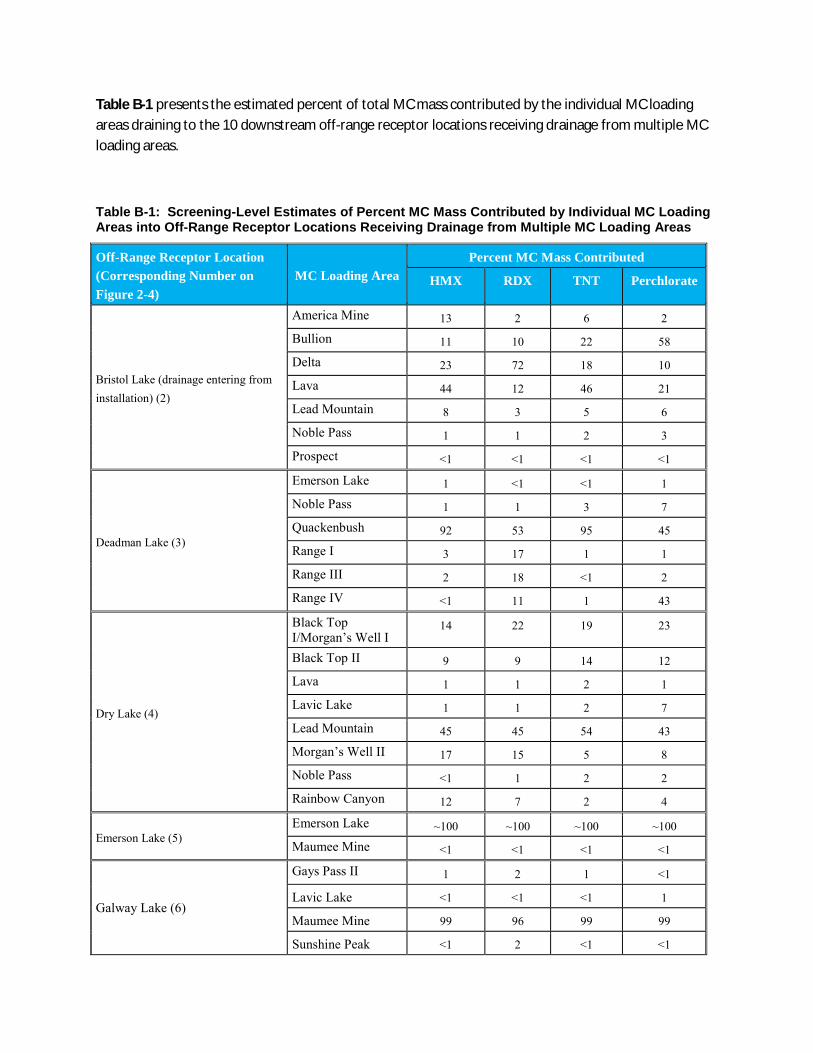
Table B-1 presents the estimated percent of total MC mass contributed by the individual MC loading areas draining to the 10 downstream off-range receptor locations receiving drainage from multiple MC loading areas.
Table B-1: Screening-Level Estimates of Percent MC Mass Contributed by Individual MC Loading Areas into Off-Range Receptor Locations Receiving Drainage from Multiple MC Loading Areas
Off-Range Receptor Location (Corresponding Number on Figure 2-4)
MC Loading Area Percent MC Mass Contributed
HMX RDX TNT Perchlorate
Bristol Lake (drainage entering from installation) (2)
America Mine 13 2 6 2
Bullion 11 10 22 58
Delta 23 72 18 10
Lava 44 12 46 21
Lead Mountain 8 3 5 6
Noble Pass 1 1 2 3
Prospect <1 <1 <1 <1
Deadman Lake (3)
Emerson Lake 1 <1 <1 1
Noble Pass 1 1 3 7
Quackenbush 92 53 95 45
Range I 3 17 1 1
Range III 2 18 <1 2
Range IV <1 11 1 43
Dry Lake (4)
Black Top I/Morgan’s Well I
14 22 19 23
Black Top II 9 9 14 12
Lava 1 1 2 1
Lavic Lake 1 1 2 7
Lead Mountain 45 45 54 43
Morgan’s Well II 17 15 5 8
Noble Pass <1 1 2 2
Rainbow Canyon 12 7 2 4
Emerson Lake (5) Emerson Lake ~100 ~100 ~100 ~100
Maumee Mine <1 <1 <1 <1
Galway Lake (6)
Gays Pass II 1 2 1 <1
Lavic Lake <1 <1 <1 1
Maumee Mine 99 96 99 99
Sunshine Peak <1 2 <1 <1
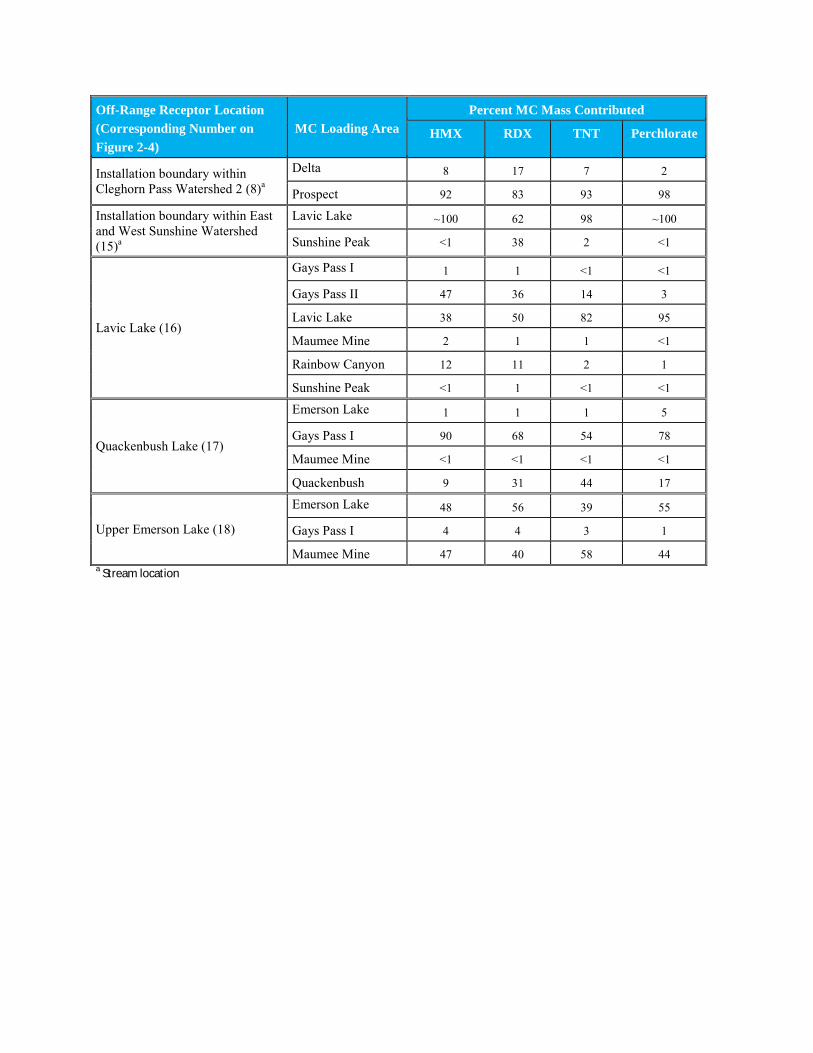
Off-Range Receptor Location (Corresponding Number on Figure 2-4)
MC Loading Area Percent MC Mass Contributed
HMX RDX TNT Perchlorate
Installation boundary within Cleghorn Pass Watershed 2 (8)a
Delta 8 17 7 2
Prospect 92 83 93 98
Installation boundary within East and West Sunshine Watershed (15)a
Lavic Lake ~100 62 98 ~100
Sunshine Peak <1 38 2 <1
Lavic Lake (16)
Gays Pass I 1 1 <1 <1
Gays Pass II 47 36 14 3
Lavic Lake 38 50 82 95
Maumee Mine 2 1 1 <1
Rainbow Canyon 12 11 2 1
Sunshine Peak <1 1 <1 <1
Quackenbush Lake (17)
Emerson Lake 1 1 1 5
Gays Pass I 90 68 54 78
Maumee Mine <1 <1 <1 <1
Quackenbush 9 31 44 17
Upper Emerson Lake (18)
Emerson Lake 48 56 39 55
Gays Pass I 4 4 3 1
Maumee Mine 47 40 58 44 a Stream location
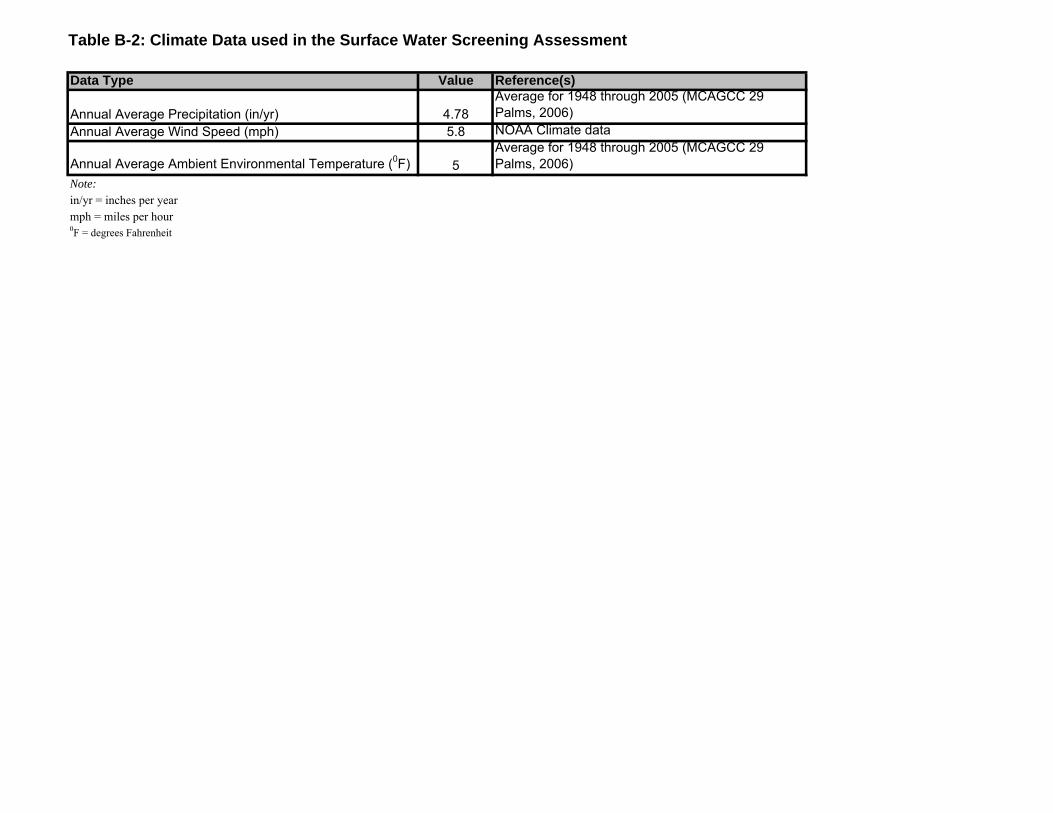
Table B-2: Climate Data used in the Surface Water Screening Assessment
Data Type Value Reference(s)
Annual Average Precipitation (in/yr) 4.78Average for 1948 through 2005 (MCAGCC 29 Palms, 2006)
Annual Average Wind Speed (mph) 5.8 NOAA Climate data
Annual Average Ambient Environmental Temperature (0F) 5Average for 1948 through 2005 (MCAGCC 29 Palms, 2006)
Note:in/yr = inches per yearmph = miles per hour0F = degrees Fahrenheit
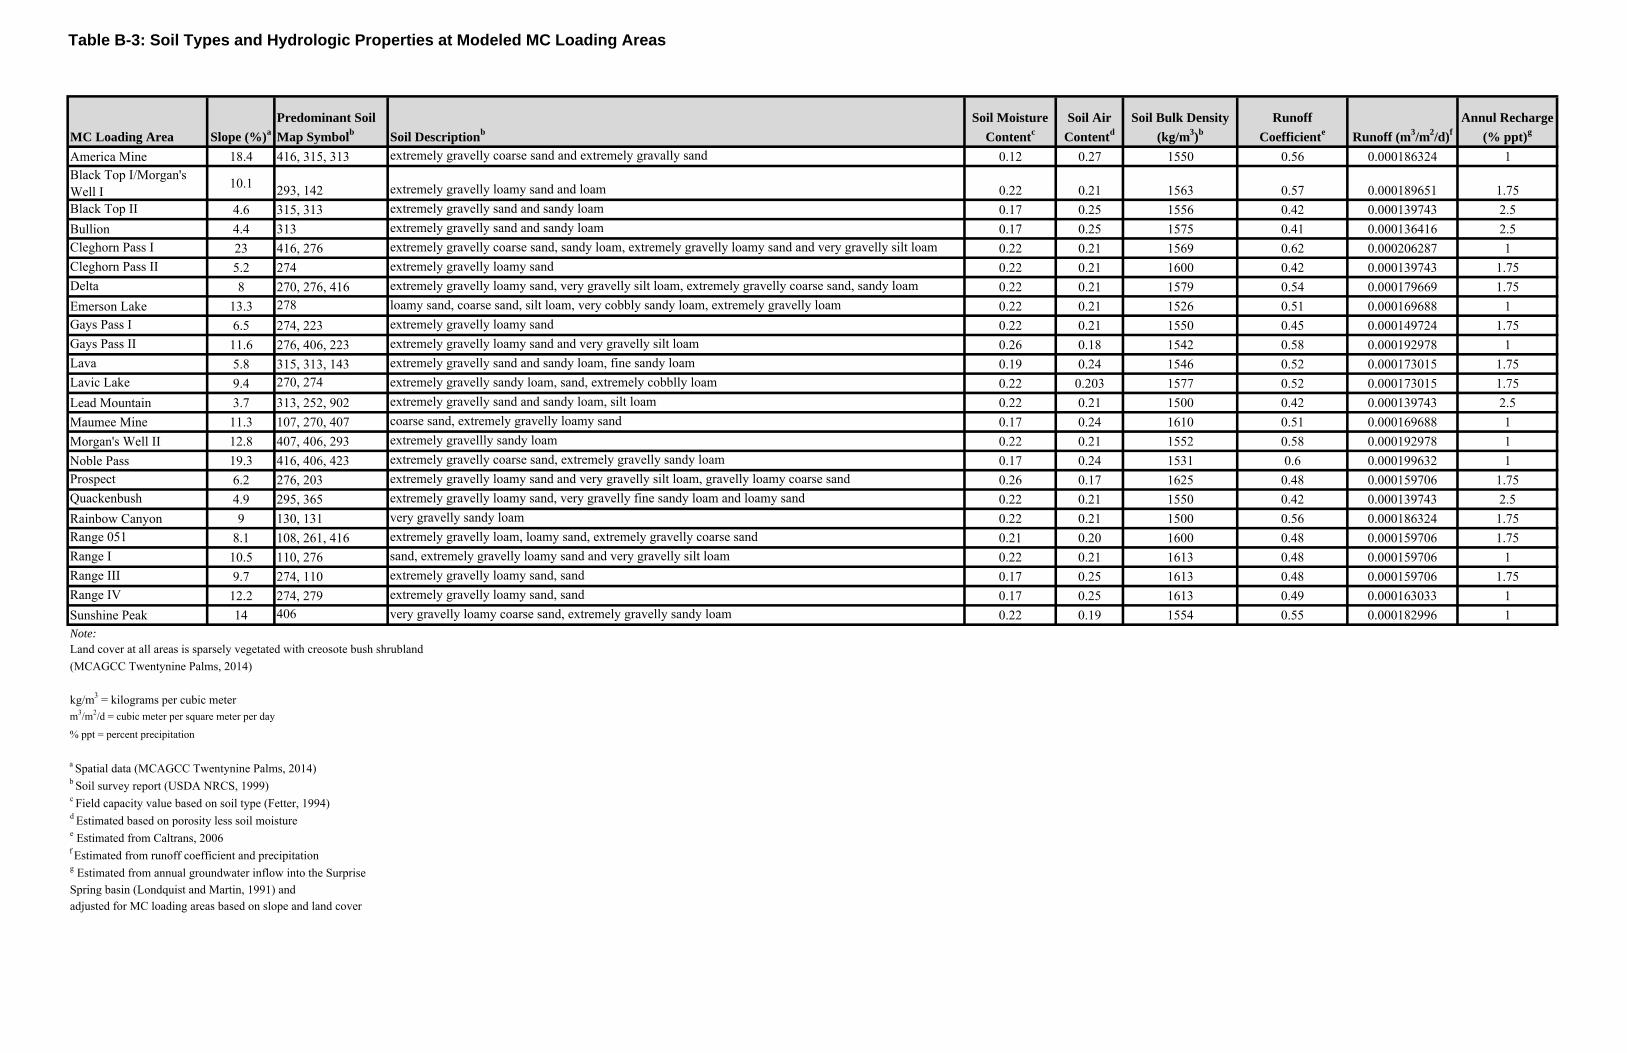
Table B-3: Soil Types and Hydrologic Properties at Modeled MC Loading Areas
America Mine 18.4 416, 315, 313 extremely gravelly coarse sand and extremely gravally sand 0.12 0.27 1550 0.56 0.000186324 1Black Top I/Morgan's Well I 10.1 293, 142 extremely gravelly loamy sand and loam 0.22 0.21 1563 0.57 0.000189651 1.75Black Top II 4.6 315, 313 extremely gravelly sand and sandy loam 0.17 0.25 1556 0.42 0.000139743 2.5Bullion 4.4 313 extremely gravelly sand and sandy loam 0.17 0.25 1575 0.41 0.000136416 2.5Cleghorn Pass I 23 416, 276 extremely gravelly coarse sand, sandy loam, extremely gravelly loamy sand and very gravelly silt loam 0.22 0.21 1569 0.62 0.000206287 1Cleghorn Pass II 5.2 274 extremely gravelly loamy sand 0.22 0.21 1600 0.42 0.000139743 1.75Delta 8 270, 276, 416 extremely gravelly loamy sand, very gravelly silt loam, extremely gravelly coarse sand, sandy loam 0.22 0.21 1579 0.54 0.000179669 1.75Emerson Lake 13.3 278 loamy sand, coarse sand, silt loam, very cobbly sandy loam, extremely gravelly loam 0.22 0.21 1526 0.51 0.000169688 1Gays Pass I 6.5 274, 223 extremely gravelly loamy sand 0.22 0.21 1550 0.45 0.000149724 1.75Gays Pass II 11.6 276, 406, 223 extremely gravelly loamy sand and very gravelly silt loam 0.26 0.18 1542 0.58 0.000192978 1Lava 5.8 315, 313, 143 extremely gravelly sand and sandy loam, fine sandy loam 0.19 0.24 1546 0.52 0.000173015 1.75Lavic Lake 9.4 270, 274 extremely gravelly sandy loam, sand, extremely cobblly loam 0.22 0.203 1577 0.52 0.000173015 1.75Lead Mountain 3.7 313, 252, 902 extremely gravelly sand and sandy loam, silt loam 0.22 0.21 1500 0.42 0.000139743 2.5Maumee Mine 11.3 107, 270, 407 coarse sand, extremely gravelly loamy sand 0.17 0.24 1610 0.51 0.000169688 1Morgan's Well II 12.8 407, 406, 293 extremely gravellly sandy loam 0.22 0.21 1552 0.58 0.000192978 1Noble Pass 19.3 416, 406, 423 extremely gravelly coarse sand, extremely gravelly sandy loam 0.17 0.24 1531 0.6 0.000199632 1Prospect 6.2 276, 203 extremely gravelly loamy sand and very gravelly silt loam, gravelly loamy coarse sand 0.26 0.17 1625 0.48 0.000159706 1.75Quackenbush 4.9 295, 365 extremely gravelly loamy sand, very gravelly fine sandy loam and loamy sand 0.22 0.21 1550 0.42 0.000139743 2.5Rainbow Canyon 9 130, 131 very gravelly sandy loam 0.22 0.21 1500 0.56 0.000186324 1.75Range 051 8.1 108, 261, 416 extremely gravelly loam, loamy sand, extremely gravelly coarse sand 0.21 0.20 1600 0.48 0.000159706 1.75Range I 10.5 110, 276 sand, extremely gravelly loamy sand and very gravelly silt loam 0.22 0.21 1613 0.48 0.000159706 1Range III 9.7 274, 110 extremely gravelly loamy sand, sand 0.17 0.25 1613 0.48 0.000159706 1.75Range IV 12.2 274, 279 extremely gravelly loamy sand, sand 0.17 0.25 1613 0.49 0.000163033 1Sunshine Peak 14 406 very gravelly loamy coarse sand, extremely gravelly sandy loam 0.22 0.19 1554 0.55 0.000182996 1Note:Land cover at all areas is sparsely vegetated with creosote bush shrubland(MCAGCC Twentynine Palms, 2014)
kg/m3 = kilograms per cubic meterm3/m2/d = cubic meter per square meter per day
% ppt = percent precipitation
a Spatial data (MCAGCC Twentynine Palms, 2014)b Soil survey report (USDA NRCS, 1999)c Field capacity value based on soil type (Fetter, 1994)d Estimated based on porosity less soil moisturee Estimated from Caltrans, 2006f Estimated from runoff coefficient and precipitationg Estimated from annual groundwater inflow into the Surprise Spring basin (Londquist and Martin, 1991) andadjusted for MC loading areas based on slope and land cover
MC Loading Area Slope (%)aSoil Bulk Density
(kg/m3)bRunoff
CoefficienteSoil Moisture
ContentcSoil Air
ContentdAnnul Recharge
(% ppt)gPredominant Soil Map Symbolb Runoff (m3/m2/d)fSoil Descriptionb
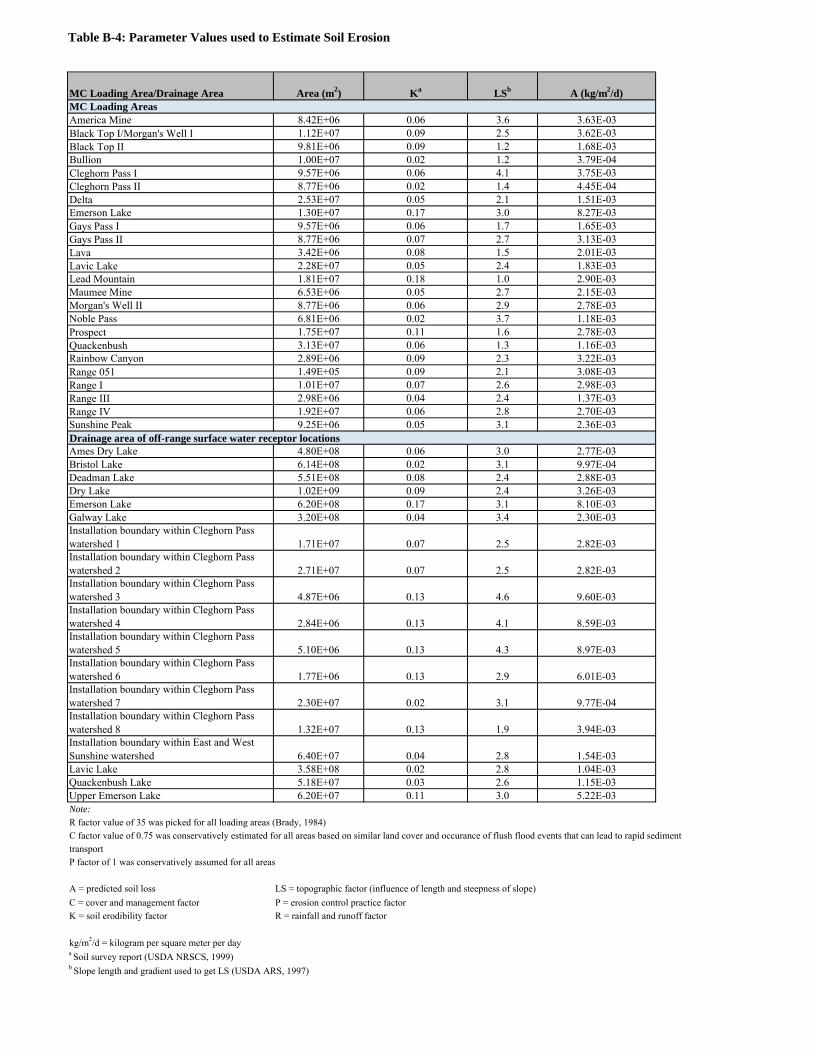
Table B-4: Parameter Values used to Estimate Soil Erosion
America Mine 8.42E+06 0.06 3.6 3.63E-03Black Top I/Morgan's Well I 1.12E+07 0.09 2.5 3.62E-03Black Top II 9.81E+06 0.09 1.2 1.68E-03Bullion 1.00E+07 0.02 1.2 3.79E-04Cleghorn Pass I 9.57E+06 0.06 4.1 3.75E-03Cleghorn Pass II 8.77E+06 0.02 1.4 4.45E-04Delta 2.53E+07 0.05 2.1 1.51E-03Emerson Lake 1.30E+07 0.17 3.0 8.27E-03Gays Pass I 9.57E+06 0.06 1.7 1.65E-03Gays Pass II 8.77E+06 0.07 2.7 3.13E-03Lava 3.42E+06 0.08 1.5 2.01E-03Lavic Lake 2.28E+07 0.05 2.4 1.83E-03Lead Mountain 1.81E+07 0.18 1.0 2.90E-03Maumee Mine 6.53E+06 0.05 2.7 2.15E-03Morgan's Well II 8.77E+06 0.06 2.9 2.78E-03Noble Pass 6.81E+06 0.02 3.7 1.18E-03Prospect 1.75E+07 0.11 1.6 2.78E-03Quackenbush 3.13E+07 0.06 1.3 1.16E-03Rainbow Canyon 2.89E+06 0.09 2.3 3.22E-03Range 051 1.49E+05 0.09 2.1 3.08E-03Range I 1.01E+07 0.07 2.6 2.98E-03Range III 2.98E+06 0.04 2.4 1.37E-03Range IV 1.92E+07 0.06 2.8 2.70E-03Sunshine Peak 9.25E+06 0.05 3.1 2.36E-03
Ames Dry Lake 4.80E+08 0.06 3.0 2.77E-03Bristol Lake 6.14E+08 0.02 3.1 9.97E-04Deadman Lake 5.51E+08 0.08 2.4 2.88E-03Dry Lake 1.02E+09 0.09 2.4 3.26E-03Emerson Lake 6.20E+08 0.17 3.1 8.10E-03Galway Lake 3.20E+08 0.04 3.4 2.30E-03Installation boundary within Cleghorn Pass watershed 1 1.71E+07 0.07 2.5 2.82E-03Installation boundary within Cleghorn Pass watershed 2 2.71E+07 0.07 2.5 2.82E-03Installation boundary within Cleghorn Pass watershed 3 4.87E+06 0.13 4.6 9.60E-03Installation boundary within Cleghorn Pass watershed 4 2.84E+06 0.13 4.1 8.59E-03Installation boundary within Cleghorn Pass watershed 5 5.10E+06 0.13 4.3 8.97E-03Installation boundary within Cleghorn Pass watershed 6 1.77E+06 0.13 2.9 6.01E-03Installation boundary within Cleghorn Pass watershed 7 2.30E+07 0.02 3.1 9.77E-04Installation boundary within Cleghorn Pass watershed 8 1.32E+07 0.13 1.9 3.94E-03Installation boundary within East and West Sunshine watershed 6.40E+07 0.04 2.8 1.54E-03Lavic Lake 3.58E+08 0.02 2.8 1.04E-03Quackenbush Lake 5.18E+07 0.03 2.6 1.15E-03Upper Emerson Lake 6.20E+07 0.11 3.0 5.22E-03Note:R factor value of 35 was picked for all loading areas (Brady, 1984)C factor value of 0.75 was conservatively estimated for all areas based on similar land cover and occurance of flush flood events that can lead to rapid sedimenttransportP factor of 1 was conservatively assumed for all areas
A = predicted soil lossC = cover and management factor P = erosion control practice factorK = soil erodibility factor R = rainfall and runoff factor
kg/m2/d = kilogram per square meter per daya Soil survey report (USDA NRSCS, 1999)b Slope length and gradient used to get LS (USDA ARS, 1997)
MC Loading Areas
Drainage area of off-range surface water receptor locations
LS = topographic factor (influence of length and steepness of slope)
A (kg/m2/d)MC Loading Area/Drainage Area Ka LSbArea (m2)
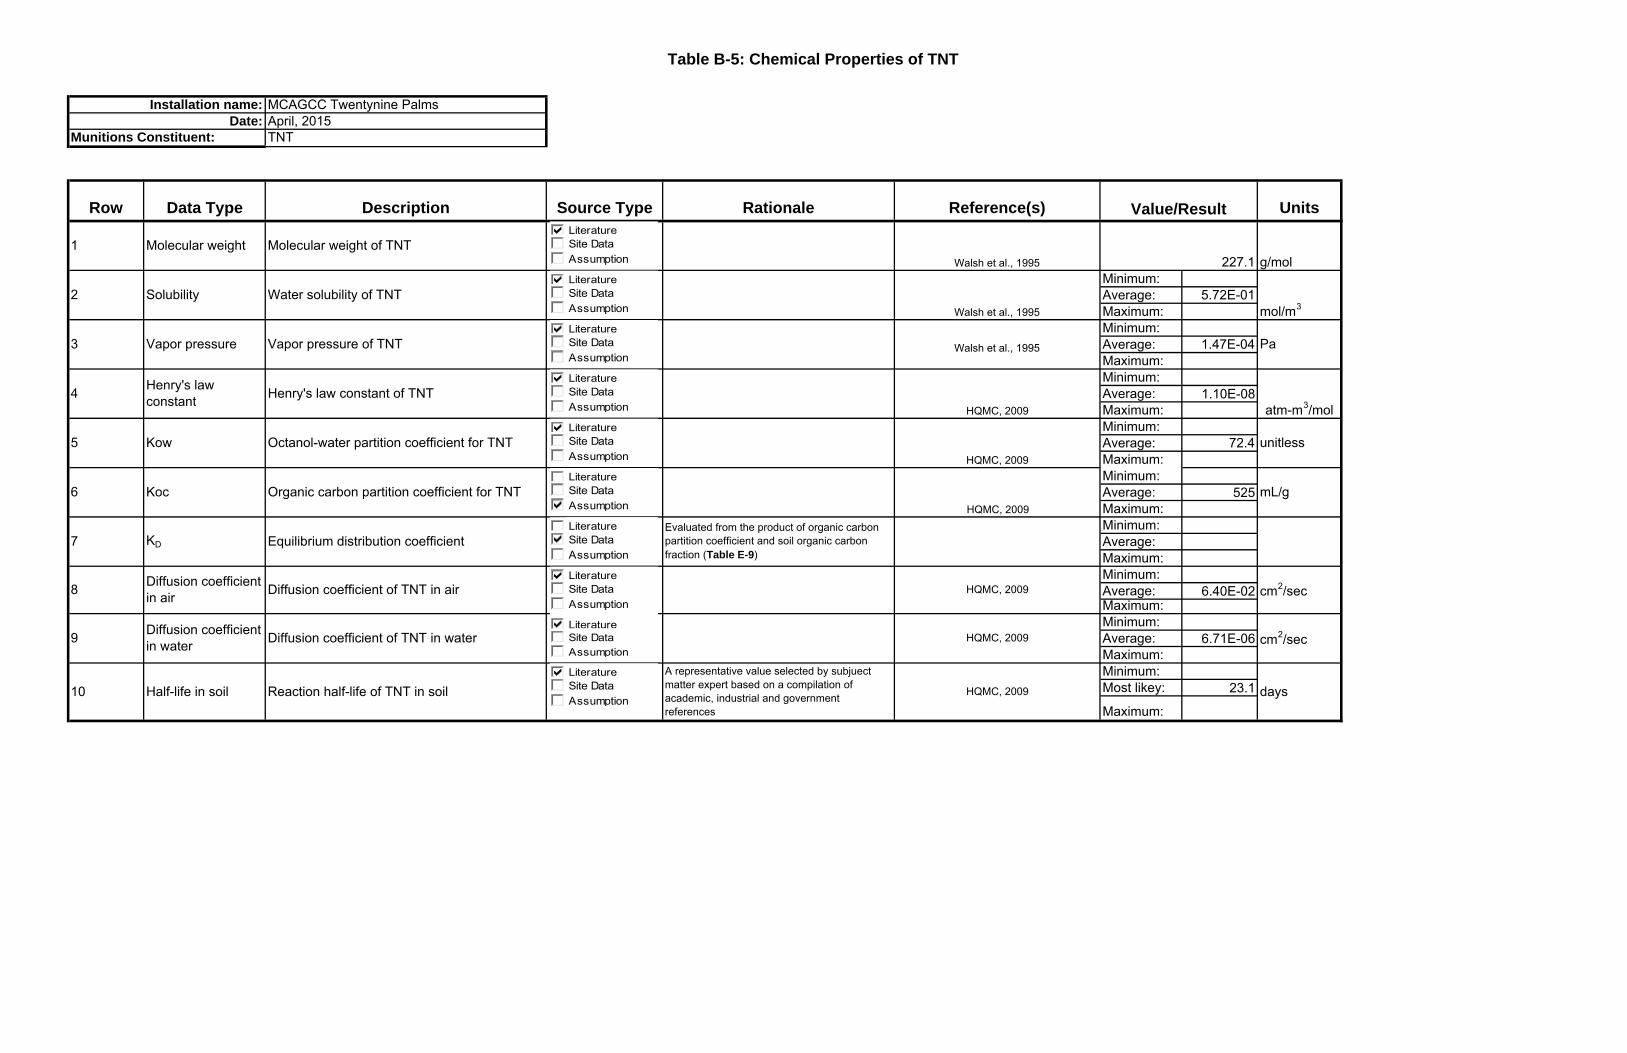
Table B-5: Chemical Properties of TNT
MCAGCC Twentynine PalmsApril, 2015TNT
Row Data Type Description Source Type Rationale Reference(s) Units
Minimum:Average: 5.72E-01Maximum:Minimum:Average: 1.47E-04Maximum:Minimum:Average: 1.10E-08Maximum:Minimum:Average: 72.4Maximum:Minimum:Average: 525Maximum:Minimum:Average:Maximum:Minimum:Average: 6.40E-02Maximum:Minimum:Average: 6.71E-06Maximum:Minimum:Most likey: 23.1
Maximum:
Installation name:Date:
Munitions Constituent:
Organic carbon partition coefficient for TNT
2 Solubility Water solubility of TNT
7 KD Equilibrium distribution coefficient
8 Diffusion coefficient in air Diffusion coefficient of TNT in air
Value/Result
1 Molecular weight Molecular weight of TNT
6 Koc
Evaluated from the product of organic carbon partition coefficient and soil organic carbon fraction (Table E-9)
HQMC, 2009
Walsh et al., 1995 g/mol227.1
mol/m3
mL/g
cm2/sec
Walsh et al., 1995
Pa
HQMC, 2009 atm-m3/mol
Walsh et al., 19953 Vapor pressure Vapor pressure of TNT
Henry's law constant of TNT
5 Kow Octanol-water partition coefficient for TNT
4 Henry's law constant
10 Half-life in soil Reaction half-life of TNT in soilA representative value selected by subjuect matter expert based on a compilation of academic, industrial and government references
9 Diffusion coefficient in water Diffusion coefficient of TNT in water HQMC, 2009
HQMC, 2009 days
HQMC, 2009
cm2/sec
unitless
HQMC, 2009
LiteratureSite DataAssumption
LiteratureSite DataAssumption
LiteratureSite DataAssumption
LiteratureSite DataAssumption
LiteratureSite DataAssumption
LiteratureSite DataAssumption
LiteratureSite DataAssumptionLiteratureSite DataAssumption
LiteratureSite DataAssumption
LiteratureSite DataAssumption
LiteratureSite DataAssumption
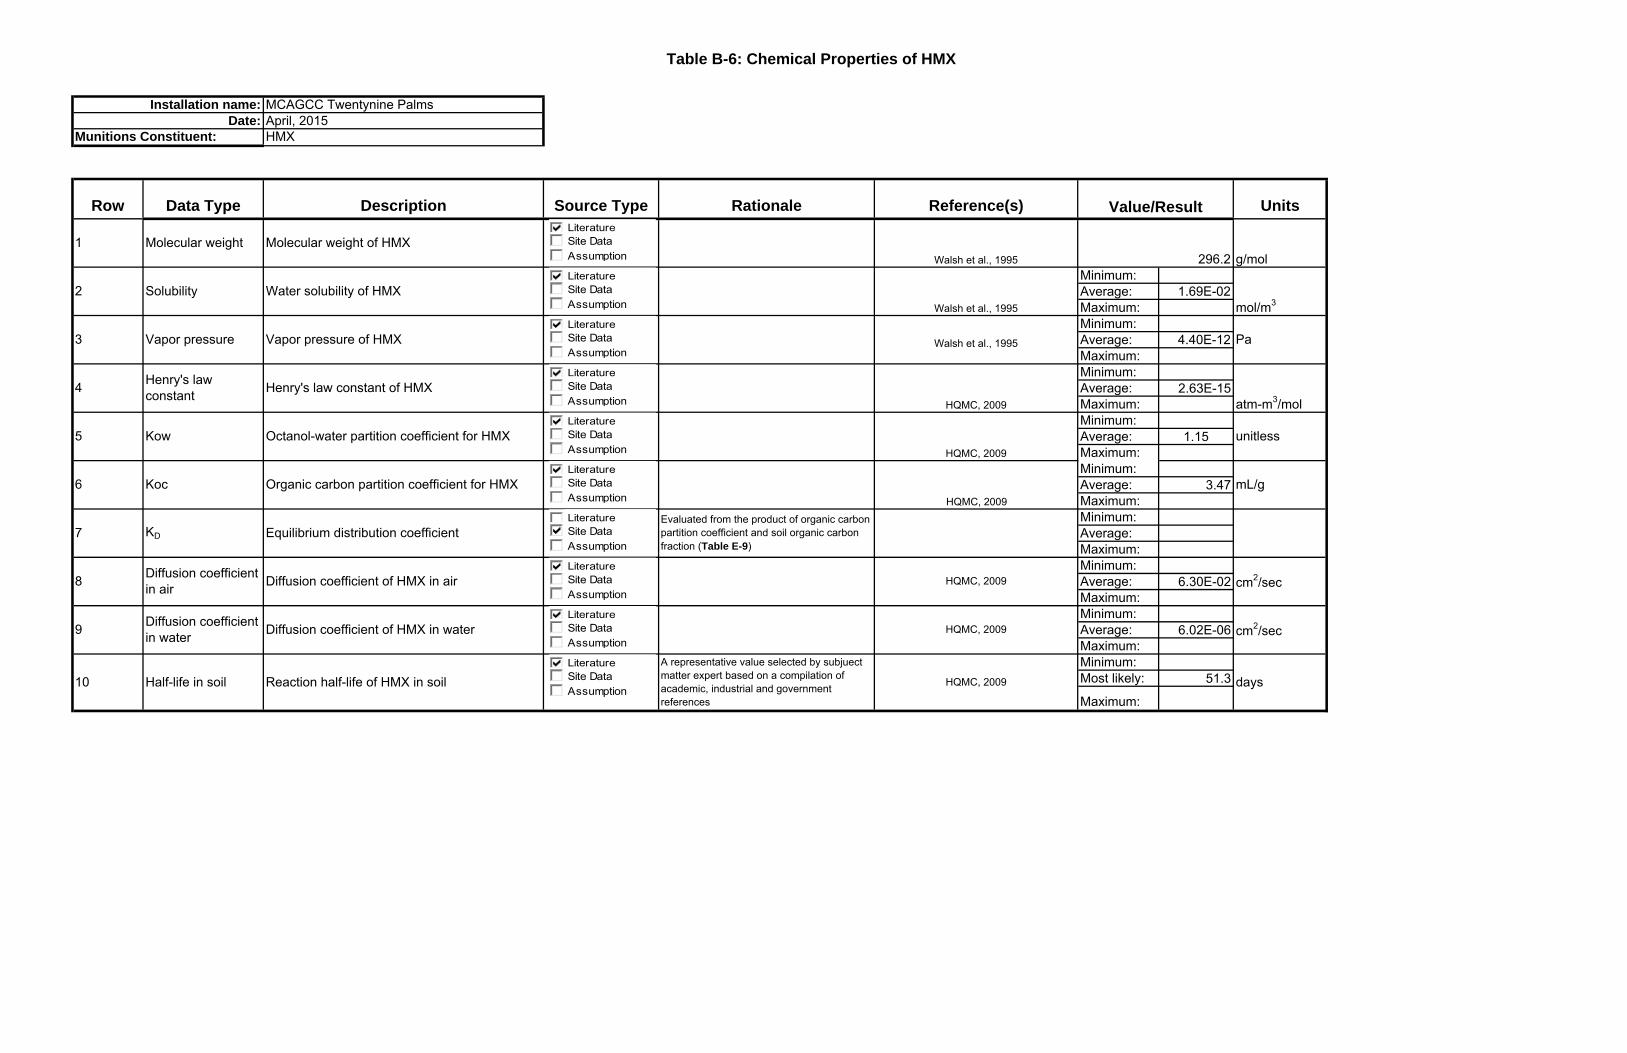
Table B-6: Chemical Properties of HMX
MCAGCC Twentynine PalmsApril, 2015HMX
Row Data Type Description Source Type Rationale Reference(s) Units
Minimum:Average: 1.69E-02Maximum:Minimum:Average: 4.40E-12Maximum:Minimum:Average: 2.63E-15Maximum:Minimum:Average: 1.15Maximum:Minimum:Average: 3.47Maximum:Minimum:Average:Maximum:Minimum:Average: 6.30E-02Maximum:Minimum:Average: 6.02E-06Maximum:Minimum:Most likely: 51.3
Maximum:
6 Koc Organic carbon partition coefficient for HMXHQMC, 2009
Installation name:Date:
Munitions Constituent:
1 Molecular weight Molecular weight of HMX
3
Walsh et al., 1995 296.2
Pa
g/mol
Value/Result
8 Diffusion coefficient in air Diffusion coefficient of HMX in air HQMC, 2009 cm2/sec
10 Half-life in soil Reaction half-life of HMX in soil
9 Diffusion coefficient in water Diffusion coefficient of HMX in water
mol/m3
A representative value selected by subjuect matter expert based on a compilation of academic, industrial and government references
HQMC, 2009 days
HQMC, 2009 cm2/sec
HQMC, 2009
mL/g
2 Solubility Water solubility of HMXWalsh et al., 1995
4 Henry's law constant Henry's law constant of HMX
atm-m3/mol
Walsh et al., 1995Vapor pressure Vapor pressure of HMX
HQMC, 2009unitless5 Kow Octanol-water partition coefficient for HMX
Evaluated from the product of organic carbon partition coefficient and soil organic carbon fraction (Table E-9)
7 KD Equilibrium distribution coefficient
LiteratureSite DataAssumption
LiteratureSite DataAssumption
LiteratureSite DataAssumption
LiteratureSite DataAssumption
LiteratureSite DataAssumption
LiteratureSite DataAssumption
LiteratureSite DataAssumption
LiteratureSite DataAssumption
LiteratureSite DataAssumption
LiteratureSite DataAssumption
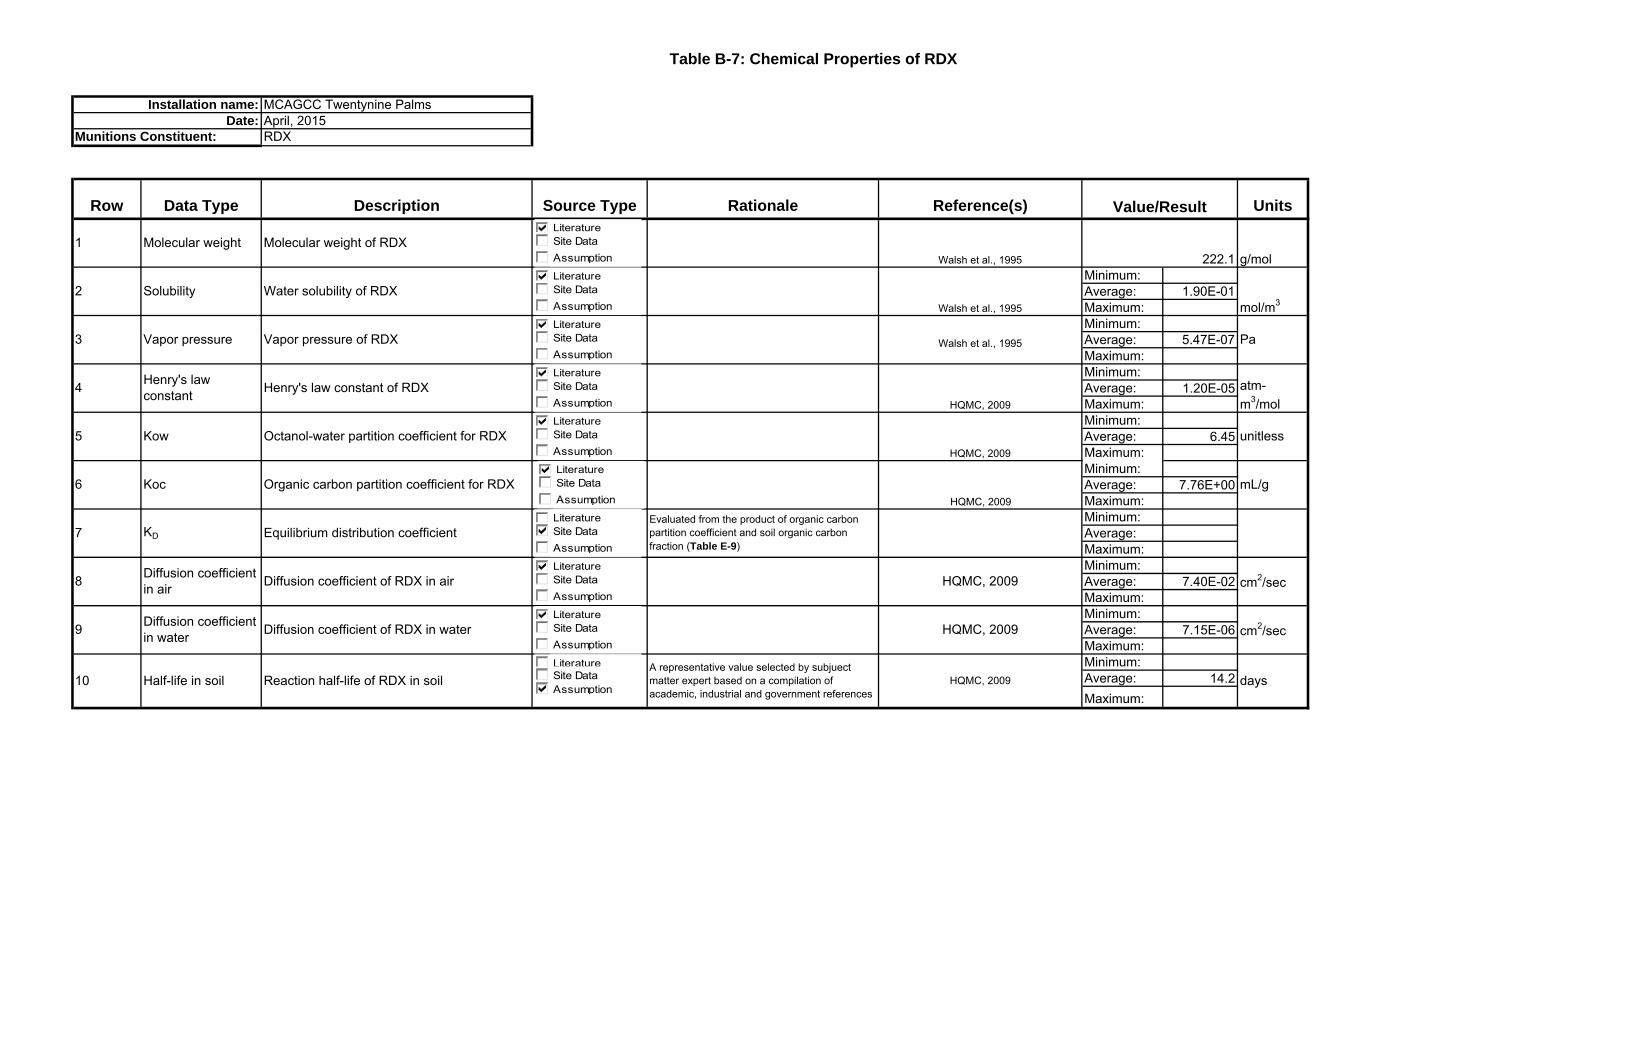
Table B-7: Chemical Properties of RDX
MCAGCC Twentynine PalmsApril, 2015RDX
Row Data Type Description Source Type Rationale Reference(s) Units
Minimum:Average: 1.90E-01Maximum:Minimum:Average: 5.47E-07Maximum:Minimum:Average: 1.20E-05Maximum:Minimum:Average: 6.45Maximum:Minimum:Average: 7.76E+00Maximum:Minimum:Average:Maximum:Minimum:Average: 7.40E-02Maximum:Minimum:Average: 7.15E-06Maximum:Minimum:Average: 14.2Maximum:
6 Koc Organic carbon partition coefficient for RDXHQMC, 2009
Installation name:Date:
Munitions Constituent:
1 Molecular weight Molecular weight of RDX
3
Walsh et al., 1995 222.1
Pa
g/mol
Value/Result
8 Diffusion coefficient in air Diffusion coefficient of RDX in air HQMC, 2009 cm2/sec
10 Half-life in soil Reaction half-life of RDX in soil
9 Diffusion coefficient in water Diffusion coefficient of RDX in water
mol/m3
A representative value selected by subjuect matter expert based on a compilation of academic, industrial and government references
HQMC, 2009 days
HQMC, 2009 cm2/sec
HQMC, 2009
mL/g
2 Solubility Water solubility of RDXWalsh et al., 1995
4 Henry's law constant Henry's law constant of RDX atm-
m3/mol
Walsh et al., 1995Vapor pressure Vapor pressure of RDX
HQMC, 2009unitless5 Kow Octanol-water partition coefficient for RDX
Evaluated from the product of organic carbon partition coefficient and soil organic carbon fraction (Table E-9)
7 KD Equilibrium distribution coefficient
LiteratureSite DataAssumption
LiteratureSite DataAssumption
LiteratureSite DataAssumption
LiteratureSite DataAssumption
LiteratureSite DataAssumption
LiteratureSite DataAssumption
LiteratureSite DataAssumption
LiteratureSite DataAssumption
LiteratureSite DataAssumption
LiteratureSite DataAssumption
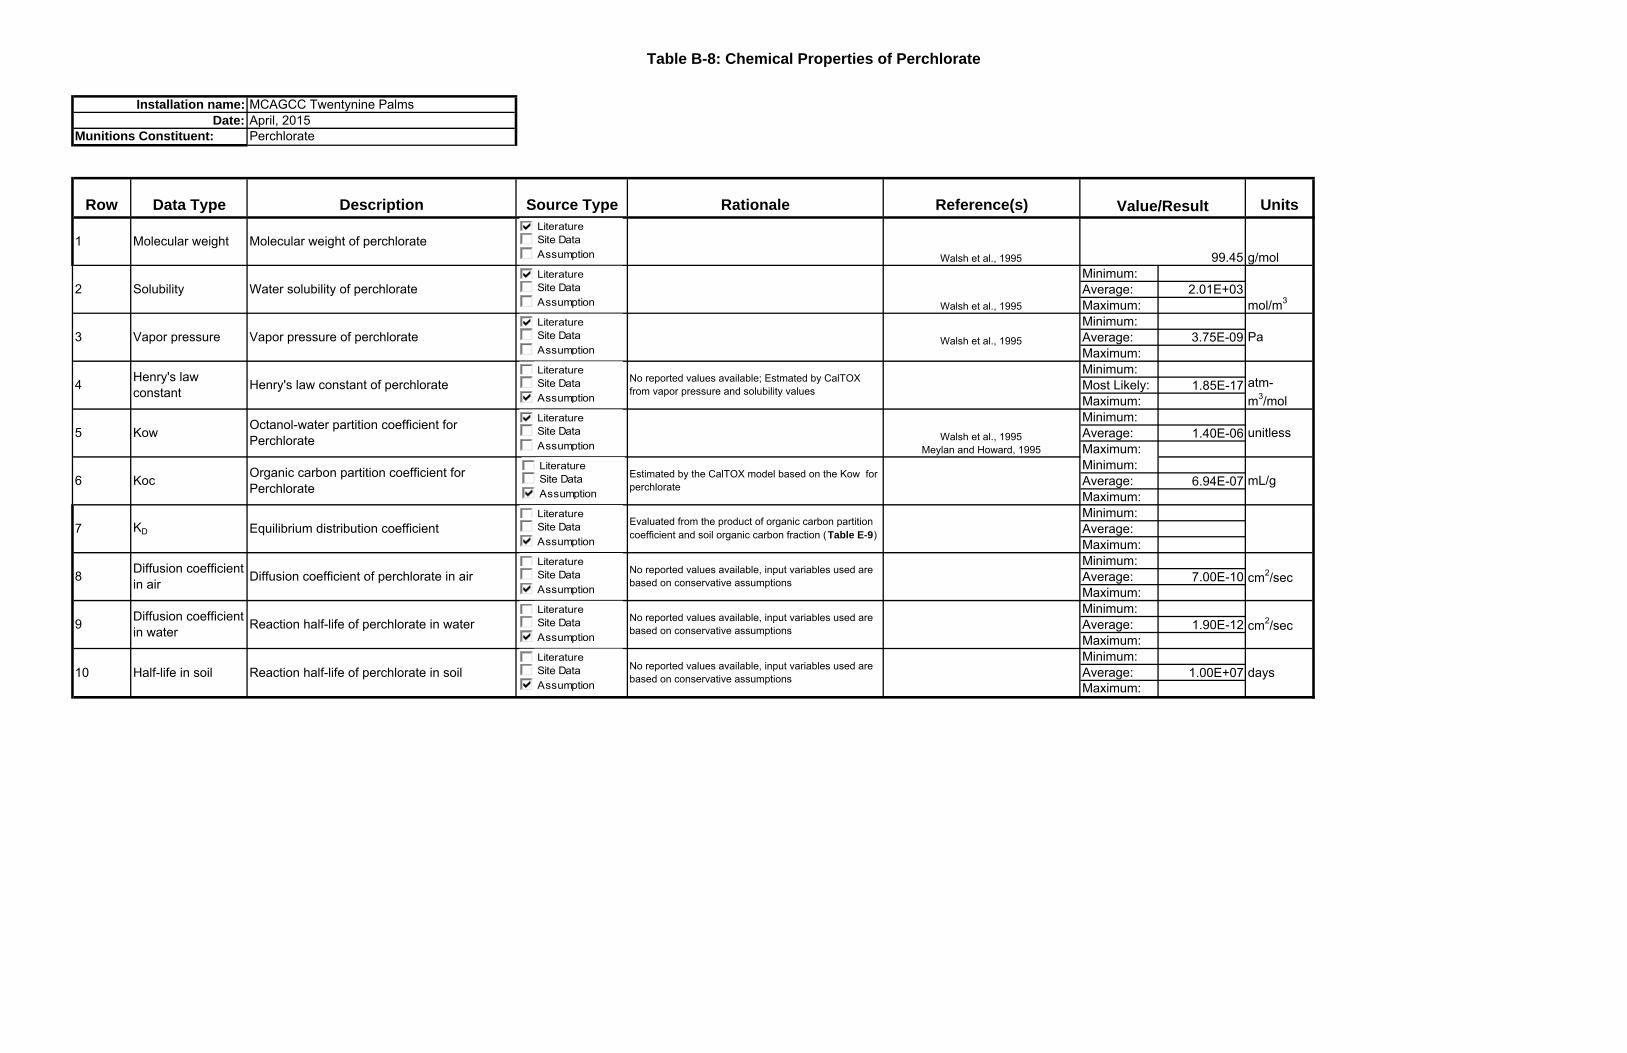
Table B-8: Chemical Properties of Perchlorate
MCAGCC Twentynine PalmsApril, 2015Perchlorate
Row Data Type Description Source Type Rationale Reference(s) Units
Minimum:Average: 2.01E+03Maximum:Minimum:Average: 3.75E-09Maximum:Minimum:Most Likely: 1.85E-17Maximum:Minimum:Average: 1.40E-06Maximum:Minimum:Average: 6.94E-07Maximum:Minimum:Average:Maximum:Minimum:Average: 7.00E-10Maximum:Minimum:Average: 1.90E-12Maximum:Minimum:Average: 1.00E+07Maximum:
6 Koc Organic carbon partition coefficient for Perchlorate
Estimated by the CalTOX model based on the Kow for perchlorate
Installation name:Date:
Munitions Constituent:
No reported values available; Estmated by CalTOX from vapor pressure and solubility values
1 Molecular weight Molecular weight of perchlorate
3
Walsh et al., 1995 99.45
Pa
g/mol
Value/Result
8 Diffusion coefficient in air Diffusion coefficient of perchlorate in air cm2/sec
No reported values available, input variables used are based on conservative assumptions
10 Half-life in soil Reaction half-life of perchlorate in soil
9 Diffusion coefficient in water Reaction half-life of perchlorate in water
mol/m3
No reported values available, input variables used are based on conservative assumptions days
No reported values available, input variables used are based on conservative assumptions cm2/sec
mL/g
2 Solubility Water solubility of perchlorateWalsh et al., 1995
4 Henry's law constant Henry's law constant of perchlorate atm-
m3/mol
Walsh et al., 1995Vapor pressure Vapor pressure of perchlorate
Walsh et al., 1995Meylan and Howard, 1995
unitless5 Kow Octanol-water partition coefficient for Perchlorate
Evaluated from the product of organic carbon partition coefficient and soil organic carbon fraction (Table E-9)7 KD Equilibrium distribution coefficient
LiteratureSite DataAssumption
LiteratureSite DataAssumption
LiteratureSite DataAssumption
LiteratureSite DataAssumption
LiteratureSite DataAssumption
LiteratureSite DataAssumption
LiteratureSite DataAssumption
LiteratureSite DataAssumption
LiteratureSite DataAssumption
LiteratureSite DataAssumption
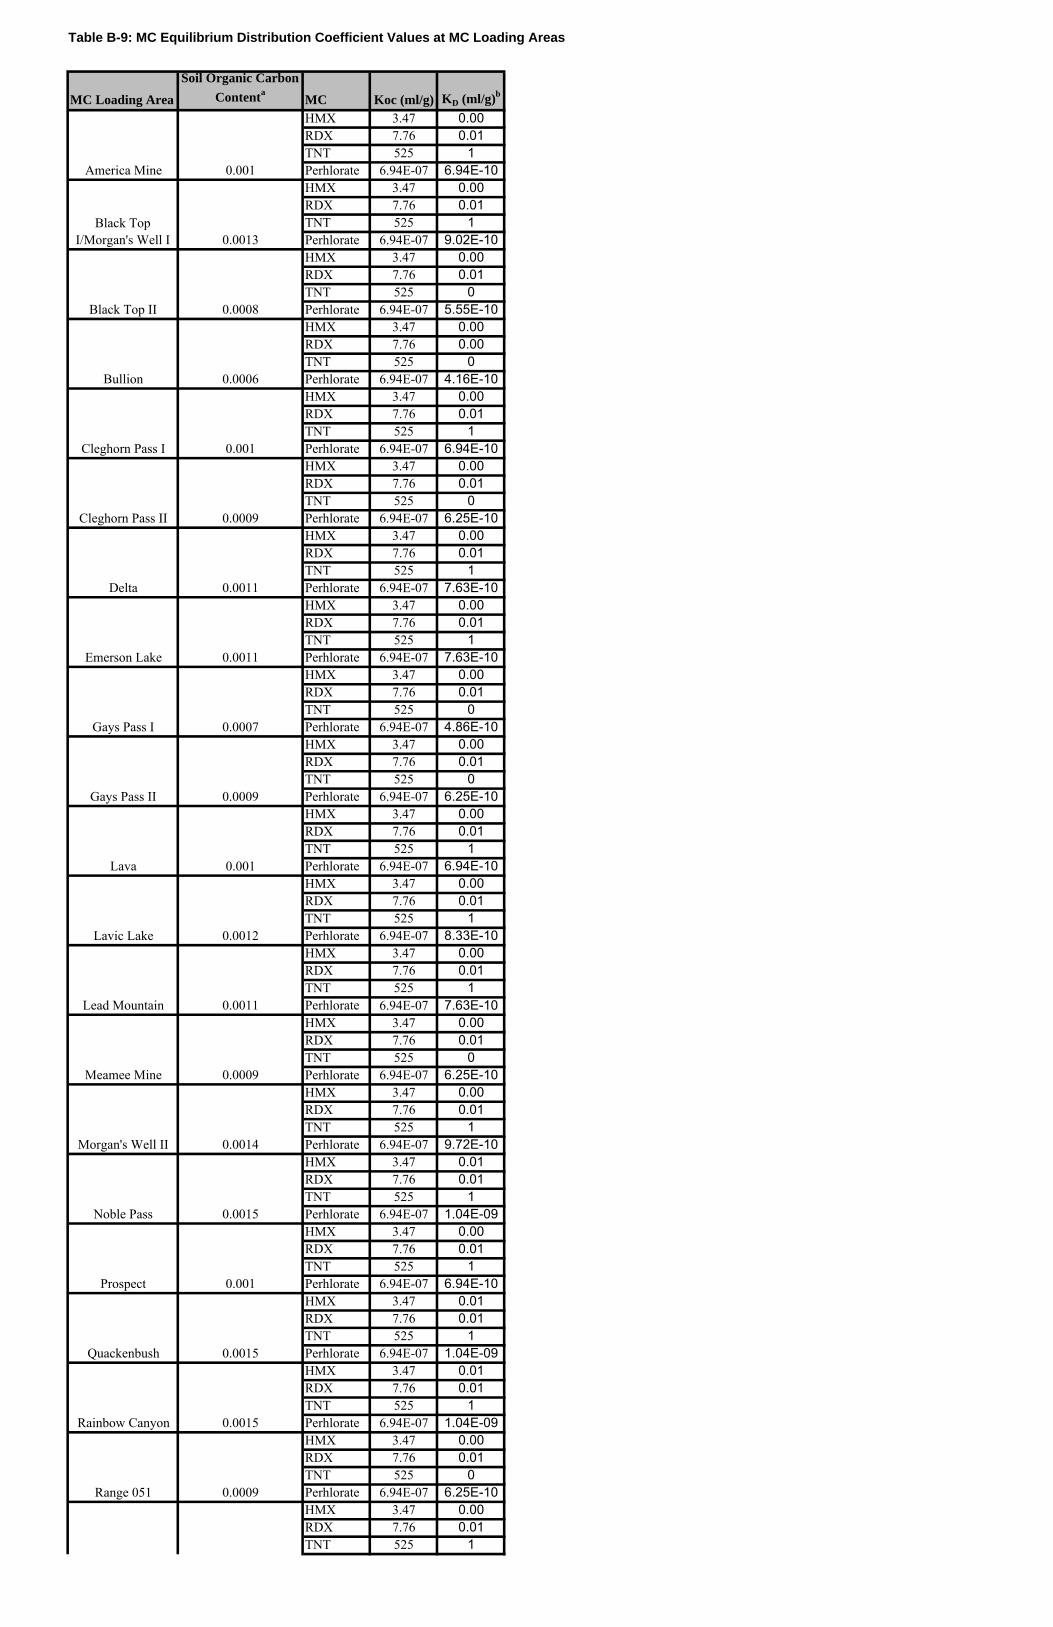
Table B-9: MC Equilibrium Distribution Coefficient Values at MC Loading Areas
MC Loading AreaSoil Organic Carbon
ContentaMC Koc (ml/g) KD (ml/g)b
HMX 3.47 0.00RDX 7.76 0.01TNT 525 1Perhlorate 6.94E-07 6.94E-10HMX 3.47 0.00RDX 7.76 0.01TNT 525 1Perhlorate 6.94E-07 9.02E-10HMX 3.47 0.00RDX 7.76 0.01TNT 525 0Perhlorate 6.94E-07 5.55E-10HMX 3.47 0.00RDX 7.76 0.00TNT 525 0Perhlorate 6.94E-07 4.16E-10HMX 3.47 0.00RDX 7.76 0.01TNT 525 1Perhlorate 6.94E-07 6.94E-10HMX 3.47 0.00RDX 7.76 0.01TNT 525 0Perhlorate 6.94E-07 6.25E-10HMX 3.47 0.00RDX 7.76 0.01TNT 525 1Perhlorate 6.94E-07 7.63E-10HMX 3.47 0.00RDX 7.76 0.01TNT 525 1Perhlorate 6.94E-07 7.63E-10HMX 3.47 0.00RDX 7.76 0.01TNT 525 0Perhlorate 6.94E-07 4.86E-10HMX 3.47 0.00RDX 7.76 0.01TNT 525 0Perhlorate 6.94E-07 6.25E-10HMX 3.47 0.00RDX 7.76 0.01TNT 525 1Perhlorate 6.94E-07 6.94E-10HMX 3.47 0.00RDX 7.76 0.01TNT 525 1Perhlorate 6.94E-07 8.33E-10HMX 3.47 0.00RDX 7.76 0.01TNT 525 1Perhlorate 6.94E-07 7.63E-10HMX 3.47 0.00RDX 7.76 0.01TNT 525 0Perhlorate 6.94E-07 6.25E-10HMX 3.47 0.00RDX 7.76 0.01TNT 525 1Perhlorate 6.94E-07 9.72E-10HMX 3.47 0.01RDX 7.76 0.01TNT 525 1Perhlorate 6.94E-07 1.04E-09HMX 3.47 0.00RDX 7.76 0.01TNT 525 1Perhlorate 6.94E-07 6.94E-10HMX 3.47 0.01RDX 7.76 0.01TNT 525 1Perhlorate 6.94E-07 1.04E-09HMX 3.47 0.01RDX 7.76 0.01TNT 525 1Perhlorate 6.94E-07 1.04E-09HMX 3.47 0.00RDX 7.76 0.01TNT 525 0Perhlorate 6.94E-07 6.25E-10HMX 3.47 0.00RDX 7.76 0.01TNT 525 1
America Mine 0.001
Black Top I/Morgan's Well I 0.0013
Black Top II 0.0008
Bullion 0.0006
Cleghorn Pass I 0.001
Cleghorn Pass II 0.0009
Delta 0.0011
Emerson Lake 0.0011
Gays Pass I 0.0007
Gays Pass II 0.0009
Lava 0.001
Lavic Lake 0.0012
Lead Mountain 0.0011
Meamee Mine 0.0009
Morgan's Well II 0.0014
Noble Pass 0.0015
Prospect 0.001
Quackenbush 0.0015
Rainbow Canyon 0.0015
Range 051 0.0009

Table B-9: MC Equilibrium Distribution Coefficient Values at MC Loading Areas
MC Loading AreaSoil Organic Carbon
ContentaMC Koc (ml/g) KD (ml/g)b
Perhlorate 6.94E-07 6.94E-10HMX 3.47 0.00RDX 7.76 0.01TNT 525 1Perhlorate 6.94E-07 8.33E-10HMX 3.47 0.00RDX 7.76 0.01TNT 525 1Perhlorate 6.94E-07 8.33E-10HMX 3.47 0.00RDX 7.76 0.01TNT 525 1Perhlorate 6.94E-07 9.02E-10
Note:a Estimated from the soil survey organic conent value (USDA NRCS, 1999)b Evaluated from the product of organic carbon partition coefficient and soil organic carbon fraction
Range I 0.001
Range III 0.0012
Range IV 0.0012
Sunshine Peak 0.0013

Technical Memorandum
Groundwater Screening-Level Assessment

Technical Memorandum
Date: 26 January 2015
To: Jennifer Wilber, Marine Corps Installations Command
Copy: Chris Elliot, Andy Chatlin (Marine Corps Air Ground Combat Center [MCAGCC] Twentynine Palms) Michael Asakawa, Susan Herbert, Julie Dobschuetz, Britt McMillan (ARCADIS)
From: Edidia Nefso (ARCADIS)
Re: Assessment of Munitions Constituent (MC) Concentrations in Groundwater from MC Loading Areas at MCAGCC Twentynine Palms.
Project No.: 06285043.0000
INTRODUCTION This memorandum documents the results and recommended path forward based on the Range Environmental Vulnerability Assessment (REVA) screening-level assessment of potential munitions constituent (MC) concentrations in groundwater at Marine Corps Air Ground Combat Center (MCAGCC) Twentynine Palms. The screening-level groundwater assessment was used to assess the potential for MC to migrate from operational range areas vertically through the vadose zone to groundwater within the water-bearing units of the Deadman Lake and the Surprise Spring groundwater sub-basins where they may potentially impact groundwater receptors (existing and future drinking water wells). The procedures used to conduct this screening-level assessment are presented in the REVA 5-Year Review Manual (HQMC, 2010). A separate technical memorandum has been prepared to address MC transport in surface water and sediment from the MC loading areas (ARCADIS, 2015). Seven MC loading areas were assessed (Figure 1). These MC loading areas were selected for screening-level modeling based on range use and presence of a groundwater pathway to potential receptor locations.
§ Emerson Lake § Range I § Gays Pass I § Range III § Gays Pass II § Range IV § Quackenbush

Page 2
METHODS Overall, MC migration to groundwater within the Deadman Lake and Surprise Spring groundwater sub-basins is very slow and limited due to 1) the infrequent nature of rainfall in the area, 2) high evaporation rate, and 3) deep depth to groundwater. Direct recharge can occur from the limited portion of precipitation that falls on the MC loading areas and infiltrates the underlying water-bearing units within the Deadman Lake and Surprise Spring groundwater sub-basins. Preferential recharge also can occur in and around ephemeral streambeds and local depressions, where runoff and standing water are concentrated. MCAGCC Twentynine Palms currently uses 11 production wells located within the Surprise Spring groundwater sub-basin for drinking water. In the near future, the installation is planning to install two or three production wells within the Deadman Lake groundwater sub-basin as additional sources of drinking water (Figure 1). The screening-level groundwater assessment assessed the potential for MC loading areas located within the Deadman Lake and Surprise Spring groundwater sub-basins to impact the groundwater within these sub-basins. A three-step process was followed to assess the potential for MC from the MC loading areas to migrate vertically from the ground surface through the vadose zone to groundwater in the water-bearing units then horizontally through the groundwater to potential receptor locations (existing and future installation drinking water wells). At each step of the process, estimated concentrations were compared to calculated median method detection limits (MDLs). Median MDLs are an established set of values for cyclotetramethylene tetranitramine (HMX), cyclomethylene trinitramine (RDX), 2,4,6-trinitrotoluene (TNT), and perchlorate to serve as a benchmark to compare to the model results and determine whether additional actions are warranted. MDLs are used as a benchmark because they are an indicator of whether the assessment predicts the constituent may be present at a detectable concentration. The screening-level groundwater assessment was conducted for the MC loading period 2011–2014 using the following three-step process:
Step 1: Initial Groundwater Screening-Level Assessment – MC concentrations were estimated in the portion of precipitation water that infiltrates to the groundwater and were assumed to arrive at the groundwater at that concentration. Two scenarios were assessed in order to evaluate two different types of infiltration: 1) direct recharge from the portion of precipitation that falls on the MC loading areas and 2) preferential recharge in and around stream beds and local depressions. The recharge rate for Scenario 1 was assumed to range from 1% to 2.5% of the precipitation for the MC loading areas assessed (0.05 to 0.1 inches/year) based on the estimated annual groundwater inflow into Surprise Spring sub-basin and adjusted for slope variations at MC loading areas. Scenario 1 led to lower recharge and higher MC concentration. The recharge rate for Scenario 2, which constitutes a smaller portion of the total MC loading areas, was assumed to be the annual precipitation rate less site runoff (2 to 2.8 inches/year). Scenario 2 led to higher recharge and lower MC concentrations. If the calculated MC concentration in recharge exceeded its median MDL, Step 2 was performed. If all calculated MC concentrations in the
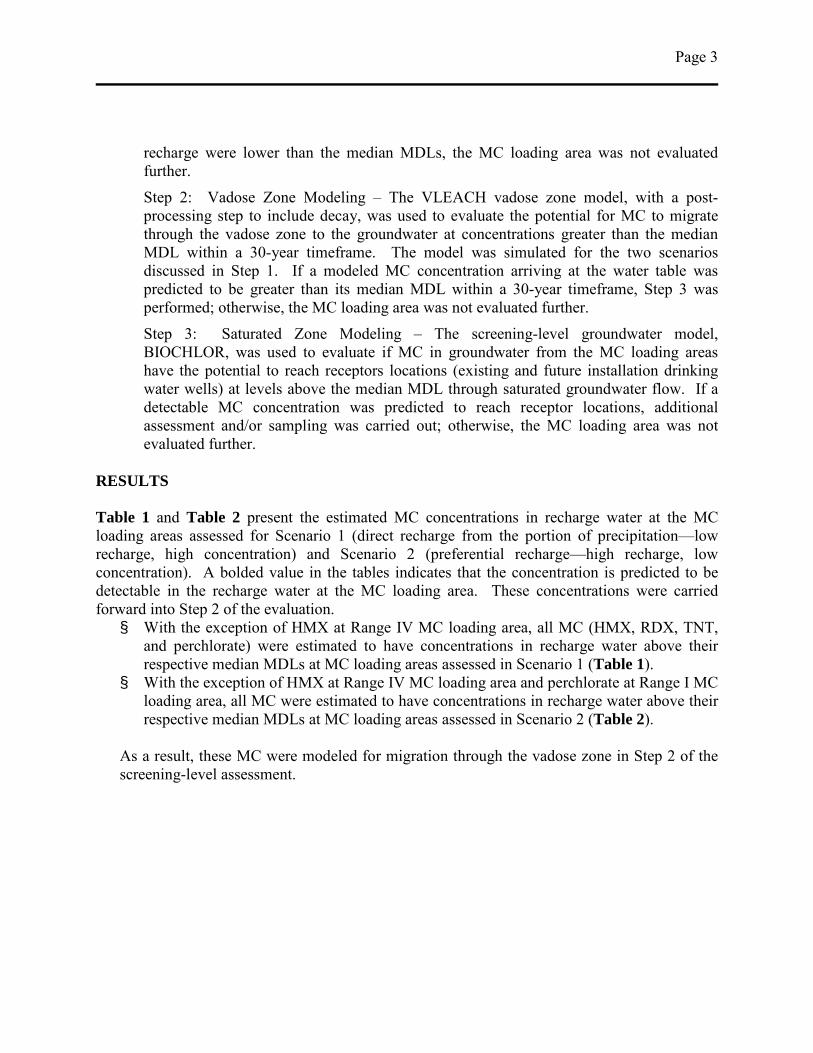
Page 3
recharge were lower than the median MDLs, the MC loading area was not evaluated further.
Step 2: Vadose Zone Modeling – The VLEACH vadose zone model, with a post-processing step to include decay, was used to evaluate the potential for MC to migrate through the vadose zone to the groundwater at concentrations greater than the median MDL within a 30-year timeframe. The model was simulated for the two scenarios discussed in Step 1. If a modeled MC concentration arriving at the water table was predicted to be greater than its median MDL within a 30-year timeframe, Step 3 was performed; otherwise, the MC loading area was not evaluated further.
Step 3: Saturated Zone Modeling – The screening-level groundwater model, BIOCHLOR, was used to evaluate if MC in groundwater from the MC loading areas have the potential to reach receptors locations (existing and future installation drinking water wells) at levels above the median MDL through saturated groundwater flow. If a detectable MC concentration was predicted to reach receptor locations, additional assessment and/or sampling was carried out; otherwise, the MC loading area was not evaluated further.
RESULTS Table 1 and Table 2 present the estimated MC concentrations in recharge water at the MC loading areas assessed for Scenario 1 (direct recharge from the portion of precipitation—low recharge, high concentration) and Scenario 2 (preferential recharge—high recharge, low concentration). A bolded value in the tables indicates that the concentration is predicted to be detectable in the recharge water at the MC loading area. These concentrations were carried forward into Step 2 of the evaluation. § With the exception of HMX at Range IV MC loading area, all MC (HMX, RDX, TNT,
and perchlorate) were estimated to have concentrations in recharge water above their respective median MDLs at MC loading areas assessed in Scenario 1 (Table 1).
§ With the exception of HMX at Range IV MC loading area and perchlorate at Range I MC loading area, all MC were estimated to have concentrations in recharge water above their respective median MDLs at MC loading areas assessed in Scenario 2 (Table 2).
As a result, these MC were modeled for migration through the vadose zone in Step 2 of the screening-level assessment.
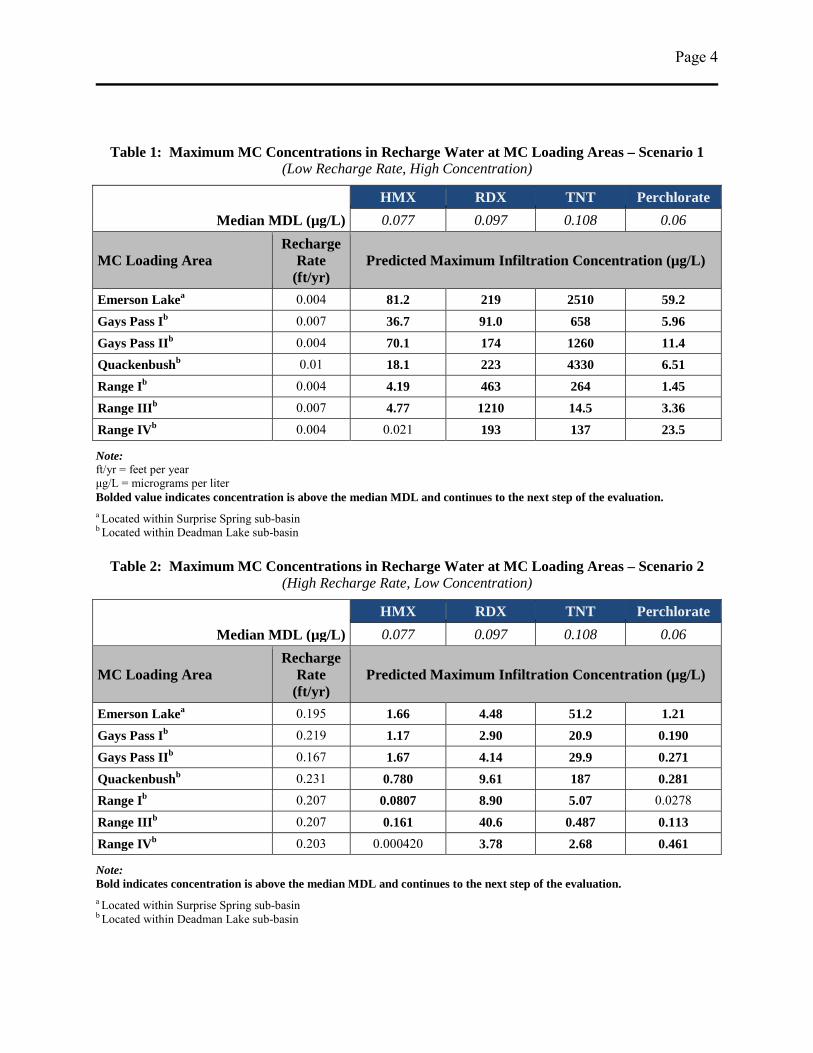
Page 4
Table 1: Maximum MC Concentrations in Recharge Water at MC Loading Areas – Scenario 1 (Low Recharge Rate, High Concentration)
Median MDL (µg/L) HMX RDX TNT Perchlorate 0.077 0.097 0.108 0.06
MC Loading Area Recharge
Rate (ft/yr)
Predicted Maximum Infiltration Concentration (µg/L)
Emerson Lakea 0.004 81.2 219 2510 59.2 Gays Pass Ib 0.007 36.7 91.0 658 5.96 Gays Pass IIb 0.004 70.1 174 1260 11.4 Quackenbushb 0.01 18.1 223 4330 6.51 Range Ib 0.004 4.19 463 264 1.45 Range IIIb 0.007 4.77 1210 14.5 3.36 Range IVb 0.004 0.021 193 137 23.5
Note: ft/yr = feet per year μg/L = micrograms per liter Bolded value indicates concentration is above the median MDL and continues to the next step of the evaluation. a Located within Surprise Spring sub-basin b Located within Deadman Lake sub-basin
Table 2: Maximum MC Concentrations in Recharge Water at MC Loading Areas – Scenario 2
(High Recharge Rate, Low Concentration)
Median MDL (µg/L) HMX RDX TNT Perchlorate 0.077 0.097 0.108 0.06
MC Loading Area Recharge
Rate (ft/yr)
Predicted Maximum Infiltration Concentration (µg/L)
Emerson Lakea 0.195 1.66 4.48 51.2 1.21 Gays Pass Ib 0.219 1.17 2.90 20.9 0.190 Gays Pass IIb 0.167 1.67 4.14 29.9 0.271 Quackenbushb 0.231 0.780 9.61 187 0.281 Range Ib 0.207 0.0807 8.90 5.07 0.0278
Range IIIb 0.207 0.161 40.6 0.487 0.113 Range IVb 0.203 0.000420 3.78 2.68 0.461
Note: Bold indicates concentration is above the median MDL and continues to the next step of the evaluation. a Located within Surprise Spring sub-basin b Located within Deadman Lake sub-basin
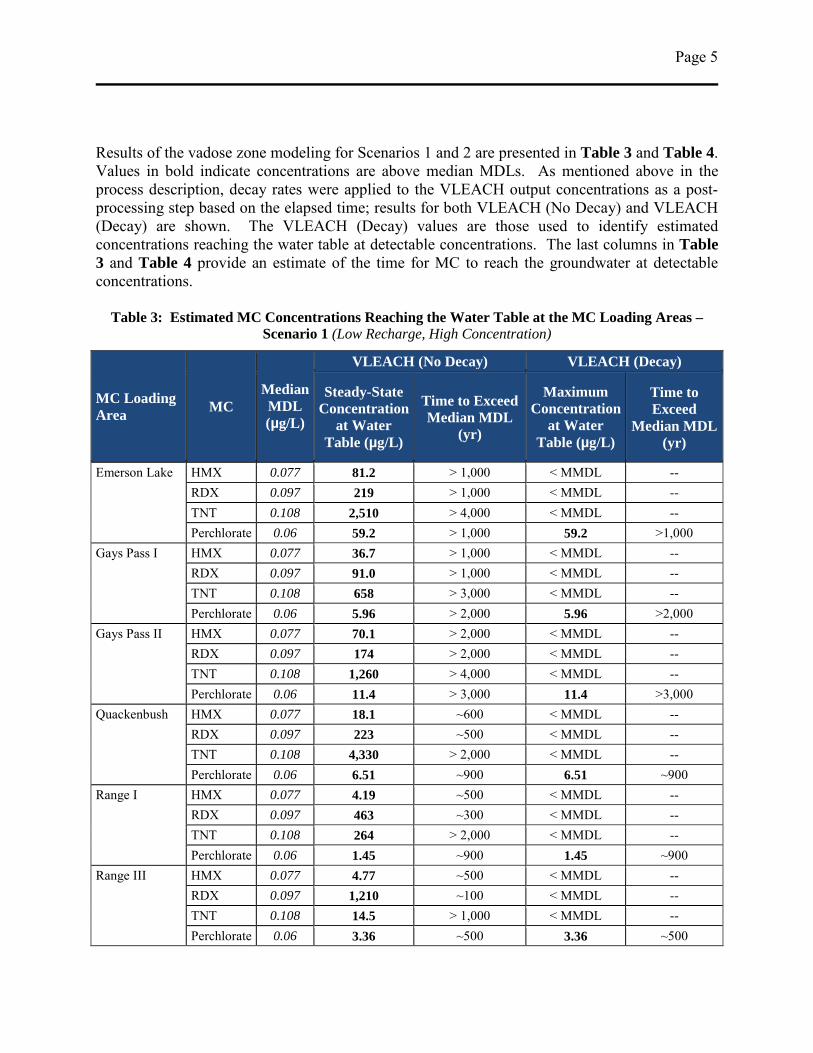
Page 5
Results of the vadose zone modeling for Scenarios 1 and 2 are presented in Table 3 and Table 4. Values in bold indicate concentrations are above median MDLs. As mentioned above in the process description, decay rates were applied to the VLEACH output concentrations as a post-processing step based on the elapsed time; results for both VLEACH (No Decay) and VLEACH (Decay) are shown. The VLEACH (Decay) values are those used to identify estimated concentrations reaching the water table at detectable concentrations. The last columns in Table 3 and Table 4 provide an estimate of the time for MC to reach the groundwater at detectable concentrations.
Table 3: Estimated MC Concentrations Reaching the Water Table at the MC Loading Areas – Scenario 1 (Low Recharge, High Concentration)
MC Loading Area MC
Median MDL (µg/L)
VLEACH (No Decay) VLEACH (Decay)
Steady-State Concentration
at Water Table (µg/L)
Time to Exceed Median MDL
(yr)
Maximum Concentration
at Water Table (µg/L)
Time to Exceed
Median MDL (yr)
Emerson Lake HMX 0.077 81.2 > 1,000 < MMDL -- RDX 0.097 219 > 1,000 < MMDL -- TNT 0.108 2,510 > 4,000 < MMDL -- Perchlorate 0.06 59.2 > 1,000 59.2 >1,000
Gays Pass I HMX 0.077 36.7 > 1,000 < MMDL -- RDX 0.097 91.0 > 1,000 < MMDL -- TNT 0.108 658 > 3,000 < MMDL -- Perchlorate 0.06 5.96 > 2,000 5.96 >2,000
Gays Pass II HMX 0.077 70.1 > 2,000 < MMDL -- RDX 0.097 174 > 2,000 < MMDL -- TNT 0.108 1,260 > 4,000 < MMDL -- Perchlorate 0.06 11.4 > 3,000 11.4 >3,000
Quackenbush HMX 0.077 18.1 ~600 < MMDL -- RDX 0.097 223 ~500 < MMDL -- TNT 0.108 4,330 > 2,000 < MMDL -- Perchlorate 0.06 6.51 ~900 6.51 ~900
Range I HMX 0.077 4.19 ~500 < MMDL -- RDX 0.097 463 ~300 < MMDL -- TNT 0.108 264 > 2,000 < MMDL -- Perchlorate 0.06 1.45 ~900 1.45 ~900
Range III HMX 0.077 4.77 ~500 < MMDL -- RDX 0.097 1,210 ~100 < MMDL -- TNT 0.108 14.5 > 1,000 < MMDL -- Perchlorate 0.06 3.36 ~500 3.36 ~500
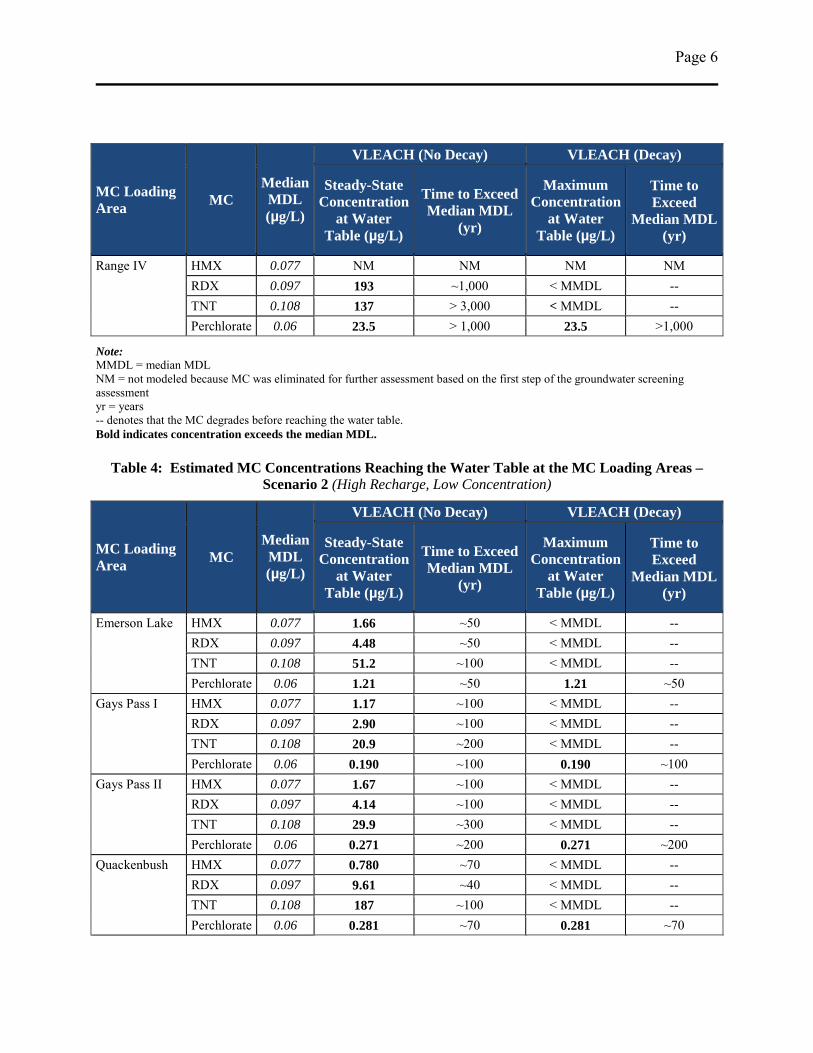
Page 6
MC Loading Area MC
Median MDL (µg/L)
VLEACH (No Decay) VLEACH (Decay)
Steady-State Concentration
at Water Table (µg/L)
Time to Exceed Median MDL
(yr)
Maximum Concentration
at Water Table (µg/L)
Time to Exceed
Median MDL (yr)
Range IV HMX 0.077 NM NM NM NM RDX 0.097 193 ~1,000 < MMDL -- TNT 0.108 137 > 3,000 < MMDL -- Perchlorate 0.06 23.5 > 1,000 23.5 >1,000
Note: MMDL = median MDL NM = not modeled because MC was eliminated for further assessment based on the first step of the groundwater screening assessment yr = years -- denotes that the MC degrades before reaching the water table. Bold indicates concentration exceeds the median MDL.
Table 4: Estimated MC Concentrations Reaching the Water Table at the MC Loading Areas – Scenario 2 (High Recharge, Low Concentration)
MC Loading Area MC
Median MDL (µg/L)
VLEACH (No Decay) VLEACH (Decay)
Steady-State Concentration
at Water Table (µg/L)
Time to Exceed Median MDL
(yr)
Maximum Concentration
at Water Table (µg/L)
Time to Exceed
Median MDL (yr)
Emerson Lake HMX 0.077 1.66 ~50 < MMDL -- RDX 0.097 4.48 ~50 < MMDL -- TNT 0.108 51.2 ~100 < MMDL -- Perchlorate 0.06 1.21 ~50 1.21 ~50
Gays Pass I HMX 0.077 1.17 ~100 < MMDL -- RDX 0.097 2.90 ~100 < MMDL -- TNT 0.108 20.9 ~200 < MMDL -- Perchlorate 0.06 0.190 ~100 0.190 ~100
Gays Pass II HMX 0.077 1.67 ~100 < MMDL -- RDX 0.097 4.14 ~100 < MMDL -- TNT 0.108 29.9 ~300 < MMDL -- Perchlorate 0.06 0.271 ~200 0.271 ~200
Quackenbush HMX 0.077 0.780 ~70 < MMDL -- RDX 0.097 9.61 ~40 < MMDL -- TNT 0.108 187 ~100 < MMDL -- Perchlorate 0.06 0.281 ~70 0.281 ~70
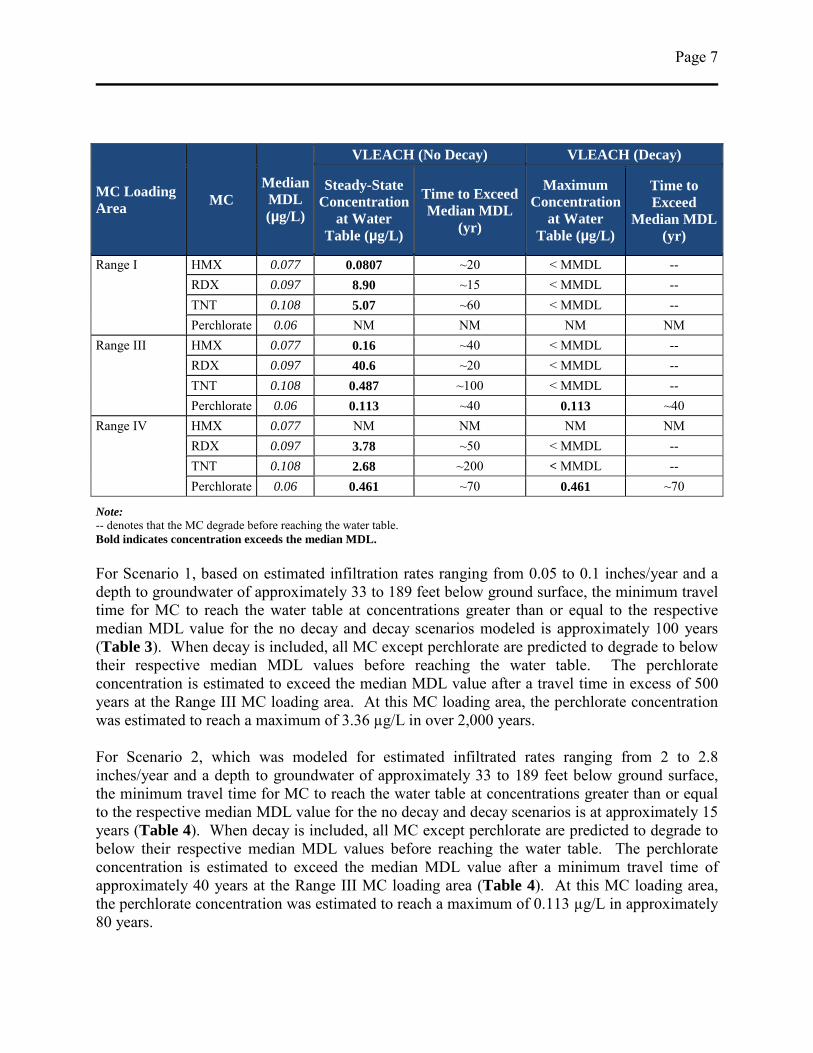
Page 7
MC Loading Area MC
Median MDL (µg/L)
VLEACH (No Decay) VLEACH (Decay)
Steady-State Concentration
at Water Table (µg/L)
Time to Exceed Median MDL
(yr)
Maximum Concentration
at Water Table (µg/L)
Time to Exceed
Median MDL (yr)
Range I HMX 0.077 0.0807 ~20 < MMDL -- RDX 0.097 8.90 ~15 < MMDL -- TNT 0.108 5.07 ~60 < MMDL -- Perchlorate 0.06 NM NM NM NM
Range III HMX 0.077 0.16 ~40 < MMDL -- RDX 0.097 40.6 ~20 < MMDL -- TNT 0.108 0.487 ~100 < MMDL -- Perchlorate 0.06 0.113 ~40 0.113 ~40
Range IV HMX 0.077 NM NM NM NM RDX 0.097 3.78 ~50 < MMDL -- TNT 0.108 2.68 ~200 < MMDL -- Perchlorate 0.06 0.461 ~70 0.461 ~70
Note: -- denotes that the MC degrade before reaching the water table. Bold indicates concentration exceeds the median MDL. For Scenario 1, based on estimated infiltration rates ranging from 0.05 to 0.1 inches/year and a depth to groundwater of approximately 33 to 189 feet below ground surface, the minimum travel time for MC to reach the water table at concentrations greater than or equal to the respective median MDL value for the no decay and decay scenarios modeled is approximately 100 years (Table 3). When decay is included, all MC except perchlorate are predicted to degrade to below their respective median MDL values before reaching the water table. The perchlorate concentration is estimated to exceed the median MDL value after a travel time in excess of 500 years at the Range III MC loading area. At this MC loading area, the perchlorate concentration was estimated to reach a maximum of 3.36 µg/L in over 2,000 years. For Scenario 2, which was modeled for estimated infiltrated rates ranging from 2 to 2.8 inches/year and a depth to groundwater of approximately 33 to 189 feet below ground surface, the minimum travel time for MC to reach the water table at concentrations greater than or equal to the respective median MDL value for the no decay and decay scenarios is at approximately 15 years (Table 4). When decay is included, all MC except perchlorate are predicted to degrade to below their respective median MDL values before reaching the water table. The perchlorate concentration is estimated to exceed the median MDL value after a minimum travel time of approximately 40 years at the Range III MC loading area (Table 4). At this MC loading area, the perchlorate concentration was estimated to reach a maximum of 0.113 µg/L in approximately 80 years.
Page 8
Although perchlorate was predicted to ultimately reach the water table at detectable levels, it takes a long time to reach the water table at detectable concentrations (over 500 years in Scenario 1 and approximately 40 years in Scenario 2). Consequently, impact to groundwater receptors within the Deadman Lake and Surprise Spring sub-basins is not anticipated at least within the next 5 years (until the next REVA periodic review for MCAGCC Twentynine Palms). As a result, further modeling for transport through the saturated zone (Step 3 of the screening assessment) is not warranted at this time. CONCLUSIONS The only MC from the MC loading areas predicted to reach the groundwater at levels above the median MDL is perchlorate. With low recharge rate and depth to groundwater exceeding 30 feet, time of travel for perchlorate to potentially reach groundwater is in excess of 40 years. The shortest time of travel occurs where there is preferential recharge (such as near ephemeral streams) that generally occurs within a limited recharge area. However, when groundwater moves from these limited recharge areas, perchlorate levels will be reduced. The perchlorate concentration at the groundwater is not expected to reach the California drinking water benchmark of 6 µg/L for perchlorate. Given the very slow travel of perchlorate through the vadose zone over the MC loading areas, impact to groundwater receptors within the Deadman Lake and Surprise Spring groundwater sub-basins is not anticipated within the next 5 years. As a result, further evaluation of MC loading at MCAGCC Twentynine Palms for this REVA Periodic Review is not recommended. REFERENCES ARCADIS. 2015. Technical Memorandum: Screening-Level Assessment of Munitions
Constituent (MC) Concentrations in Surface Water and Sediment from MC Loading Areas at Marine Corps Air Ground Combat Center Twentynine Palms.
Headquarters Marine Corps (HQMC). 2010. REVA Five-Year Review Manual. Marine Corps Air Ground Combat Center Twentynine Palms, CA (MCAGCC). 2014.
Geographic information systems files.

FIGURE 1
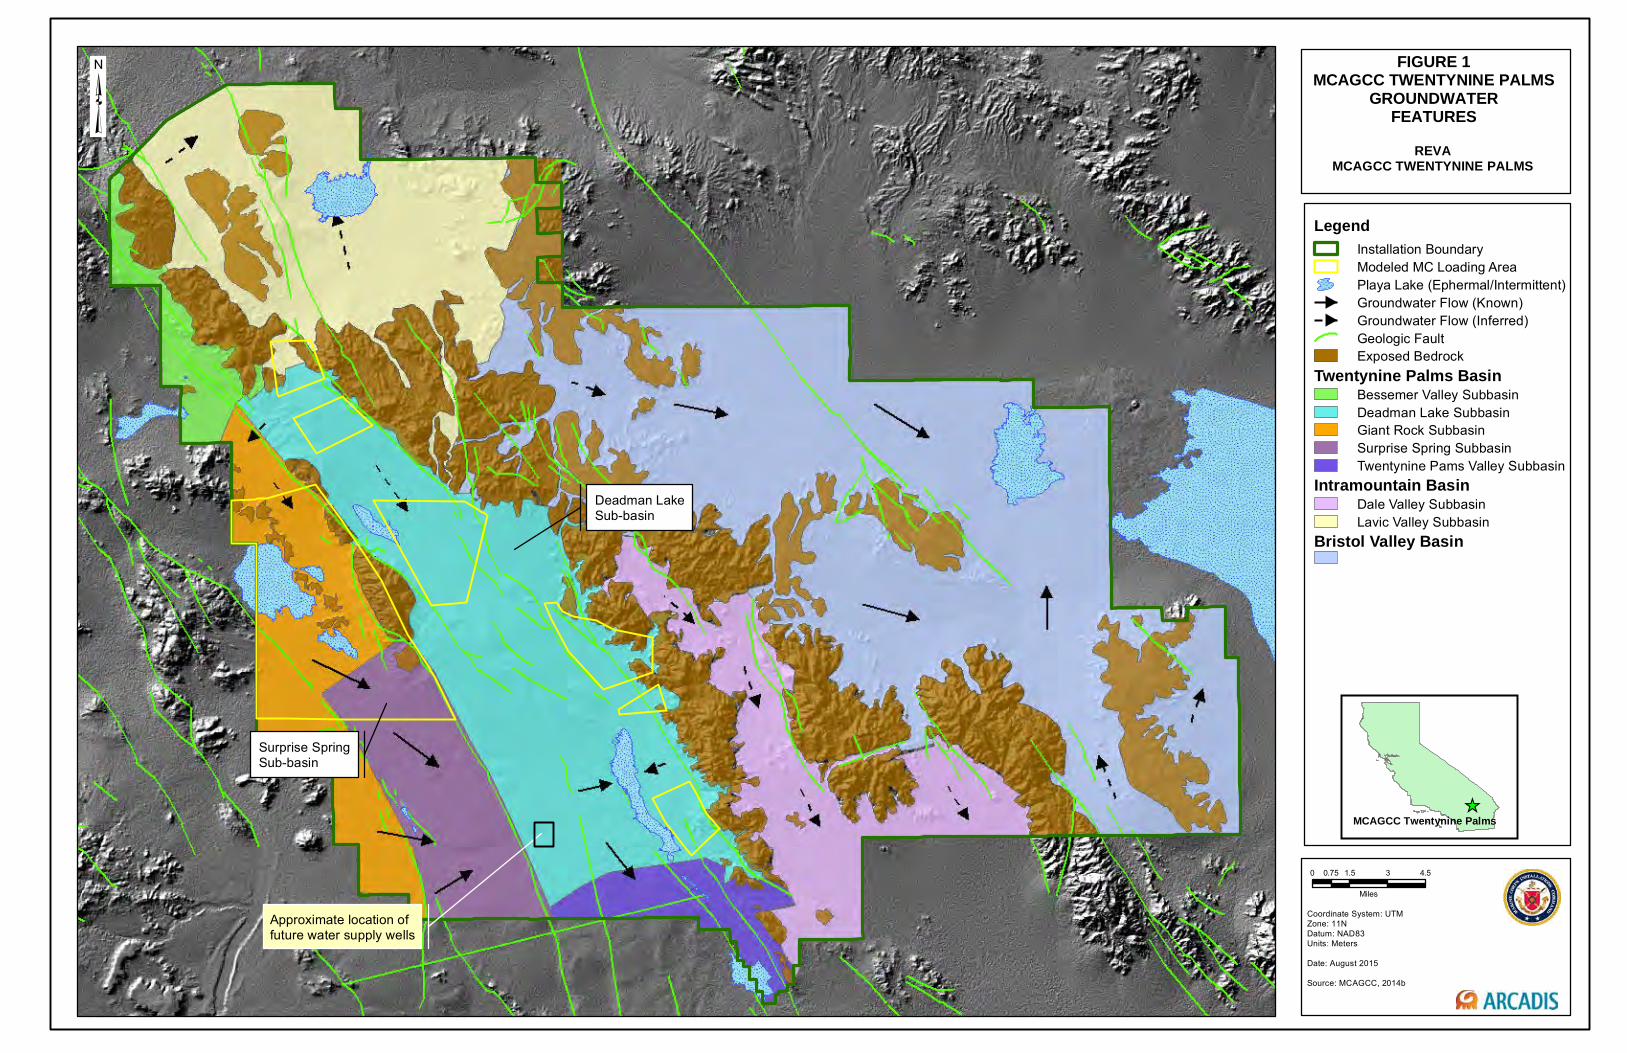
FIGURE 1MCAGCC TWENTYNINE PALMS
GROUNDWATERFEATURES
Coordinate System: UTM Zone: 11NDatum: NAD83Units: Meters
Date: August 2015
Source: MCAGCC, 2014b
MCAGCC Twentynine Palms
0 1.5 3 4.50.75
Miles
REVAMCAGCC TWENTYNINE PALMS
LegendInstallation BoundaryModeled MC Loading AreaPlaya Lake (Ephermal/Intermittent)Groundwater Flow (Known)Groundwater Flow (Inferred)Geologic FaultExposed Bedrock
Twentynine Palms BasinBessemer Valley SubbasinDeadman Lake SubbasinGiant Rock SubbasinSurprise Spring SubbasinTwentynine Pams Valley Subbasin
Intramountain BasinDale Valley SubbasinLavic Valley Subbasin
Bristol Valley Basin
Approximate location offuture water supply wells
Deadman LakeSub-basin
Surprise SpringSub-basin

Additional Tables Groundwater Screening-Level Assessment
Tables B-10 through B-11: Modeling Parameters
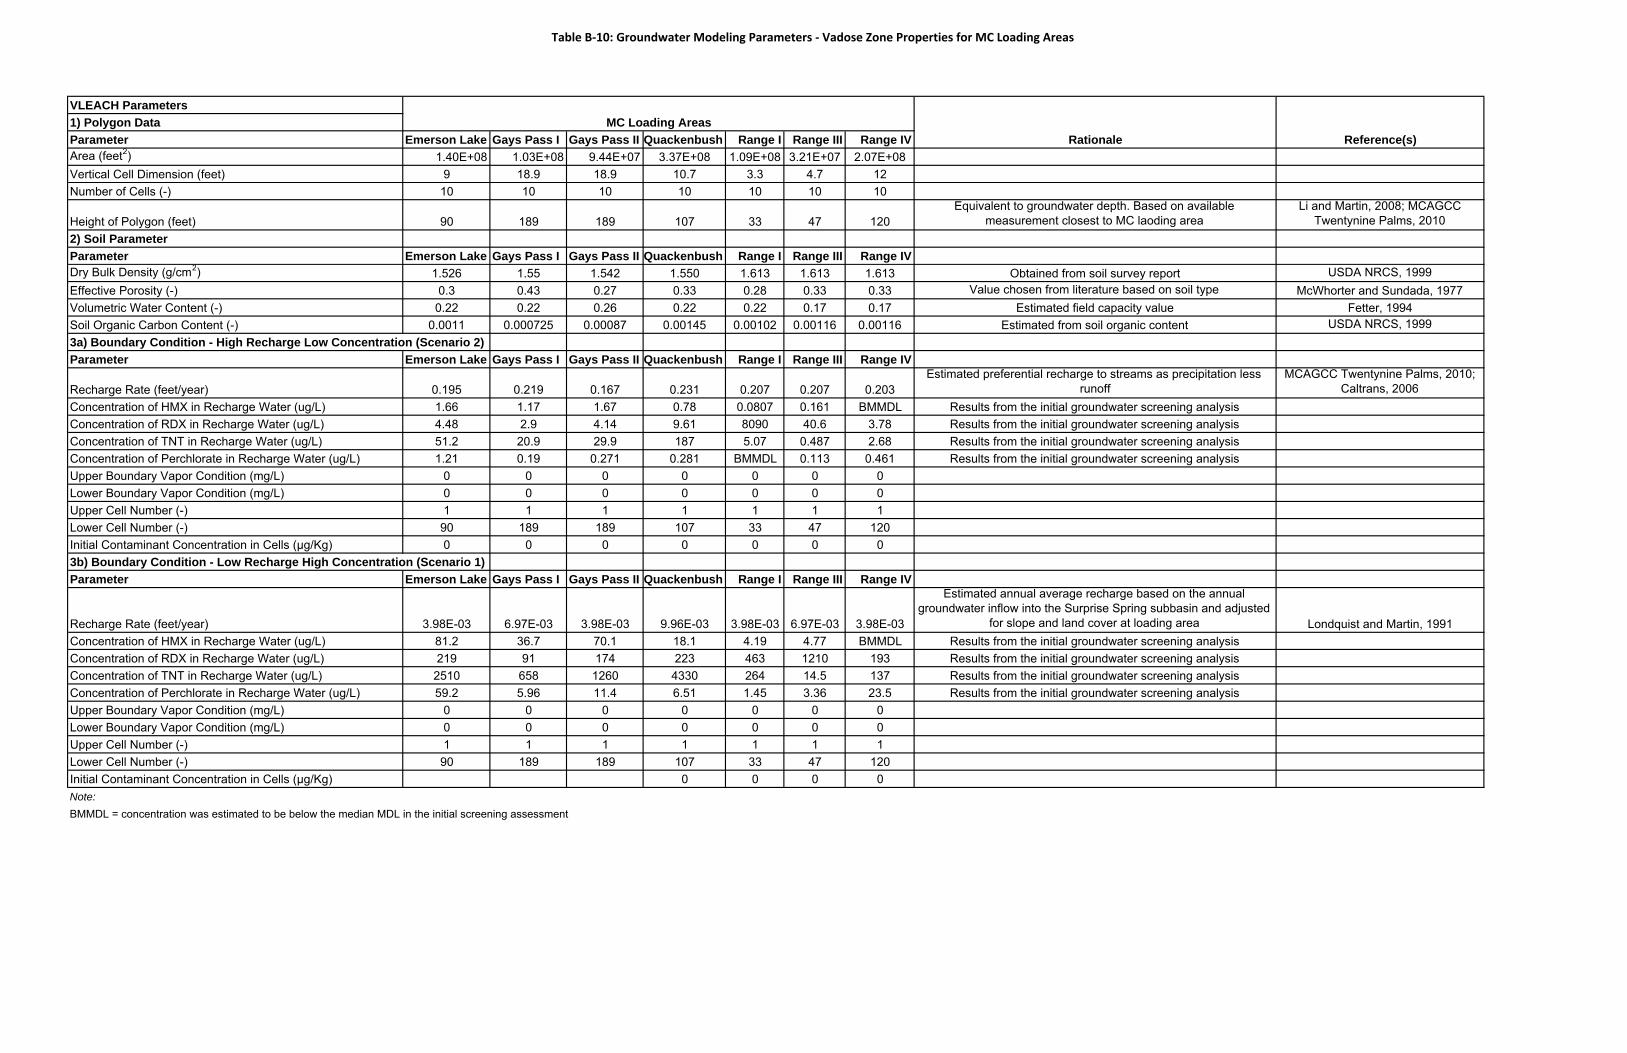
Table B‐10: Groundwater Modeling Parameters ‐ Vadose Zone Properties for MC Loading Areas
VLEACH Parameters1) Polygon DataParameter Emerson Lake Gays Pass I Gays Pass II Quackenbush Range I Range III Range IVArea (feet2) 1.40E+08 1.03E+08 9.44E+07 3.37E+08 1.09E+08 3.21E+07 2.07E+08Vertical Cell Dimension (feet) 9 18.9 18.9 10.7 3.3 4.7 12Number of Cells (-) 10 10 10 10 10 10 10
Height of Polygon (feet) 90 189 189 107 33 47 120Equivalent to groundwater depth. Based on available
measurement closest to MC laoding area Li and Martin, 2008; MCAGCC
Twentynine Palms, 20102) Soil ParameterParameter Emerson Lake Gays Pass I Gays Pass II Quackenbush Range I Range III Range IVDry Bulk Density (g/cm2) 1.526 1.55 1.542 1.550 1.613 1.613 1.613 Obtained from soil survey report USDA NRCS, 1999Effective Porosity (-) 0.3 0.43 0.27 0.33 0.28 0.33 0.33 Value chosen from literature based on soil type McWhorter and Sundada, 1977Volumetric Water Content (-) 0.22 0.22 0.26 0.22 0.22 0.17 0.17 Estimated field capacity value Fetter, 1994Soil Organic Carbon Content (-) 0.0011 0.000725 0.00087 0.00145 0.00102 0.00116 0.00116 Estimated from soil organic content USDA NRCS, 19993a) Boundary Condition - High Recharge Low Concentration (Scenario 2)Parameter Emerson Lake Gays Pass I Gays Pass II Quackenbush Range I Range III Range IV
Recharge Rate (feet/year) 0.195 0.219 0.167 0.231 0.207 0.207 0.203Estimated preferential recharge to streams as precipitation less
runoffMCAGCC Twentynine Palms, 2010;
Caltrans, 2006 Concentration of HMX in Recharge Water (ug/L) 1.66 1.17 1.67 0.78 0.0807 0.161 BMMDL Results from the initial groundwater screening analysisConcentration of RDX in Recharge Water (ug/L) 4.48 2.9 4.14 9.61 8090 40.6 3.78 Results from the initial groundwater screening analysisConcentration of TNT in Recharge Water (ug/L) 51.2 20.9 29.9 187 5.07 0.487 2.68 Results from the initial groundwater screening analysisConcentration of Perchlorate in Recharge Water (ug/L) 1.21 0.19 0.271 0.281 BMMDL 0.113 0.461 Results from the initial groundwater screening analysisUpper Boundary Vapor Condition (mg/L) 0 0 0 0 0 0 0Lower Boundary Vapor Condition (mg/L) 0 0 0 0 0 0 0Upper Cell Number (-) 1 1 1 1 1 1 1Lower Cell Number (-) 90 189 189 107 33 47 120Initial Contaminant Concentration in Cells (µg/Kg) 0 0 0 0 0 0 03b) Boundary Condition - Low Recharge High Concentration (Scenario 1)Parameter Emerson Lake Gays Pass I Gays Pass II Quackenbush Range I Range III Range IV
Recharge Rate (feet/year) 3.98E-03 6.97E-03 3.98E-03 9.96E-03 3.98E-03 6.97E-03 3.98E-03
Estimated annual average recharge based on the annual groundwater inflow into the Surprise Spring subbasin and adjusted
for slope and land cover at loading area Londquist and Martin, 1991Concentration of HMX in Recharge Water (ug/L) 81.2 36.7 70.1 18.1 4.19 4.77 BMMDL Results from the initial groundwater screening analysisConcentration of RDX in Recharge Water (ug/L) 219 91 174 223 463 1210 193 Results from the initial groundwater screening analysisConcentration of TNT in Recharge Water (ug/L) 2510 658 1260 4330 264 14.5 137 Results from the initial groundwater screening analysisConcentration of Perchlorate in Recharge Water (ug/L) 59.2 5.96 11.4 6.51 1.45 3.36 23.5 Results from the initial groundwater screening analysisUpper Boundary Vapor Condition (mg/L) 0 0 0 0 0 0 0Lower Boundary Vapor Condition (mg/L) 0 0 0 0 0 0 0Upper Cell Number (-) 1 1 1 1 1 1 1Lower Cell Number (-) 90 189 189 107 33 47 120Initial Contaminant Concentration in Cells (µg/Kg) 0 0 0 0Note:BMMDL = concentration was estimated to be below the median MDL in the initial screening assessment
Rationale Reference(s)MC Loading Areas
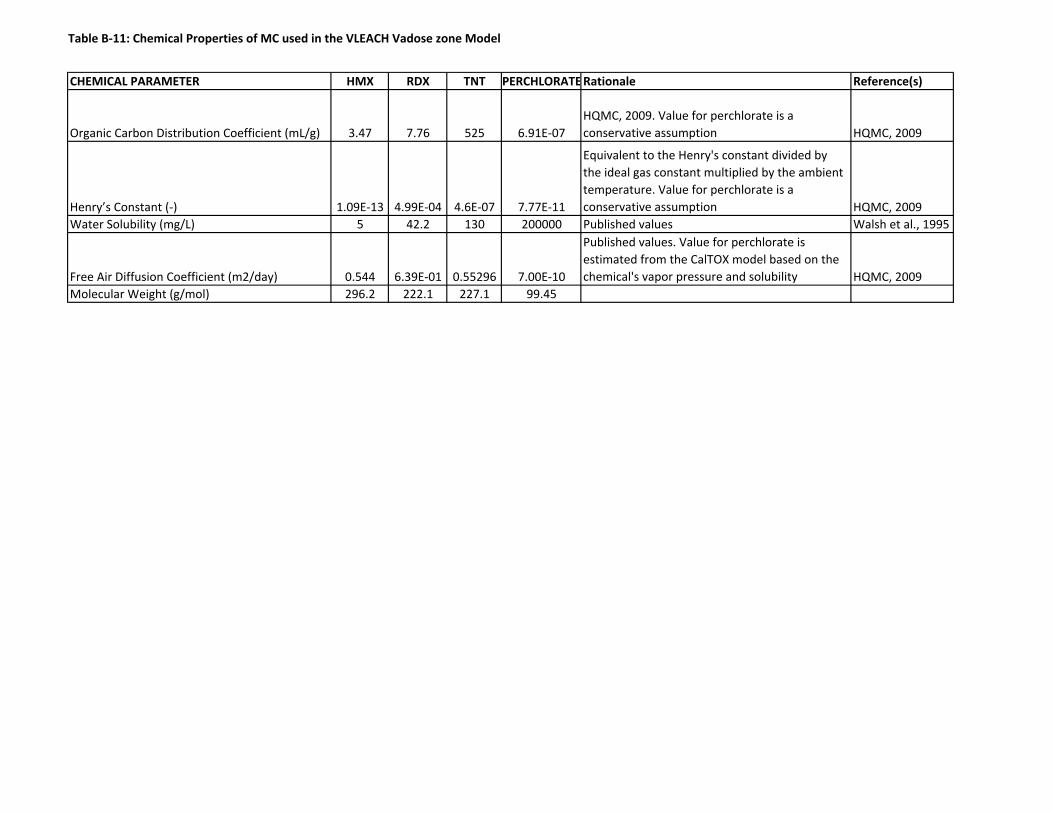
Table B‐11: Chemical Properties of MC used in the VLEACH Vadose zone Model
CHEMICAL PARAMETER HMX RDX TNT PERCHLORATERationale Reference(s)
Organic Carbon Distribution Coefficient (mL/g) 3.47 7.76 525 6.91E‐07HQMC, 2009. Value for perchlorate is a conservative assumption HQMC, 2009
Henry’s Constant (‐) 1.09E‐13 4.99E‐04 4.6E‐07 7.77E‐11
Equivalent to the Henry's constant divided by the ideal gas constant multiplied by the ambient temperature. Value for perchlorate is a conservative assumption HQMC, 2009
Water Solubility (mg/L) 5 42.2 130 200000 Published values Walsh et al., 1995
Free Air Diffusion Coefficient (m2/day) 0.544 6.39E‐01 0.55296 7.00E‐10
Published values. Value for perchlorate is estimated from the CalTOX model based on the chemical's vapor pressure and solubility HQMC, 2009
Molecular Weight (g/mol) 296.2 222.1 227.1 99.45

Appendix C Small Arms Range Assessment Protocol

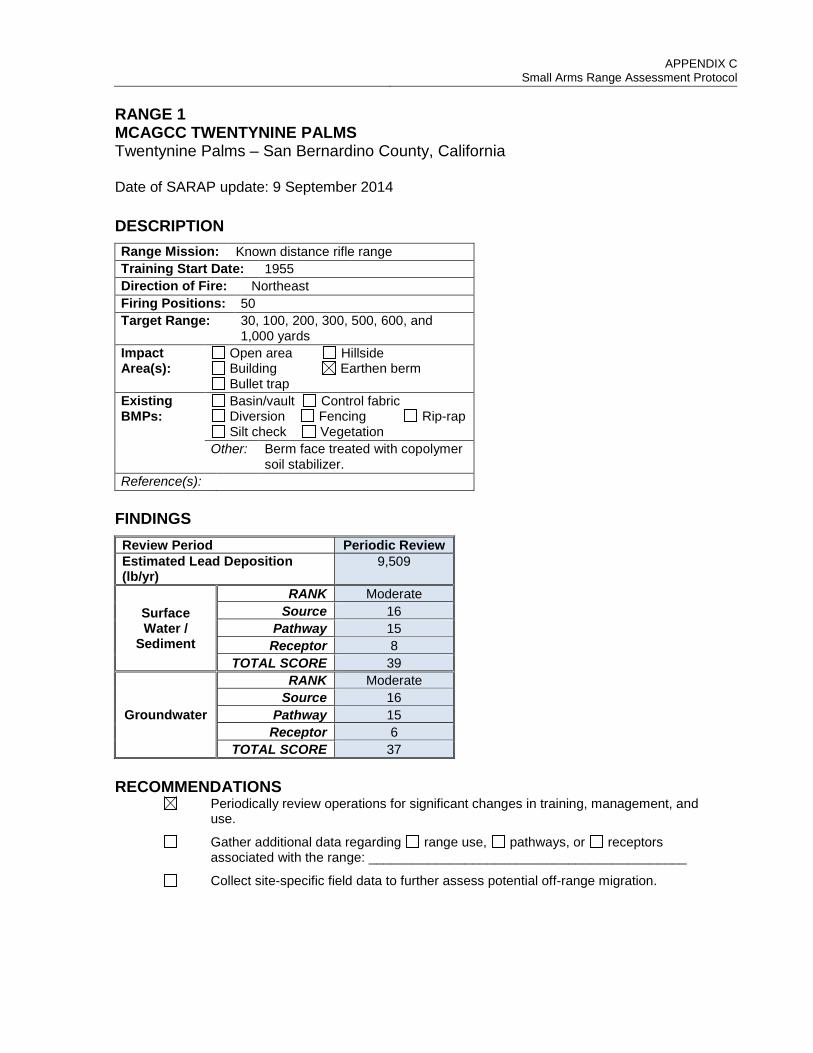
APPENDIX C
Small Arms Range Assessment Protocol RANGE 1 MCAGCC TWENTYNINE PALMS Twentynine Palms – San Bernardino County, California Date of SARAP update: 9 September 2014
DESCRIPTION Range Mission: Known distance rifle range Training Start Date: 1955 Direction of Fire: Northeast Firing Positions: 50 Target Range: 30, 100, 200, 300, 500, 600, and
1,000 yards Impact Area(s):
Open area Hillside Building Earthen berm Bullet trap
Existing BMPs:
Basin/vault Control fabric Diversion Fencing Rip-rap Silt check Vegetation
Other: Berm face treated with copolymer soil stabilizer.
Reference(s): FINDINGS Review Period Periodic Review Estimated Lead Deposition (lb/yr)
9,509
Surface Water /
Sediment
RANK Moderate Source 16
Pathway 15 Receptor 8
TOTAL SCORE 39
Groundwater
RANK Moderate Source 16
Pathway 15 Receptor 6
TOTAL SCORE 37 RECOMMENDATIONS
Periodically review operations for significant changes in training, management, and use.
Gather additional data regarding range use, pathways, or receptors associated with the range: ___________________________________________
Collect site-specific field data to further assess potential off-range migration.
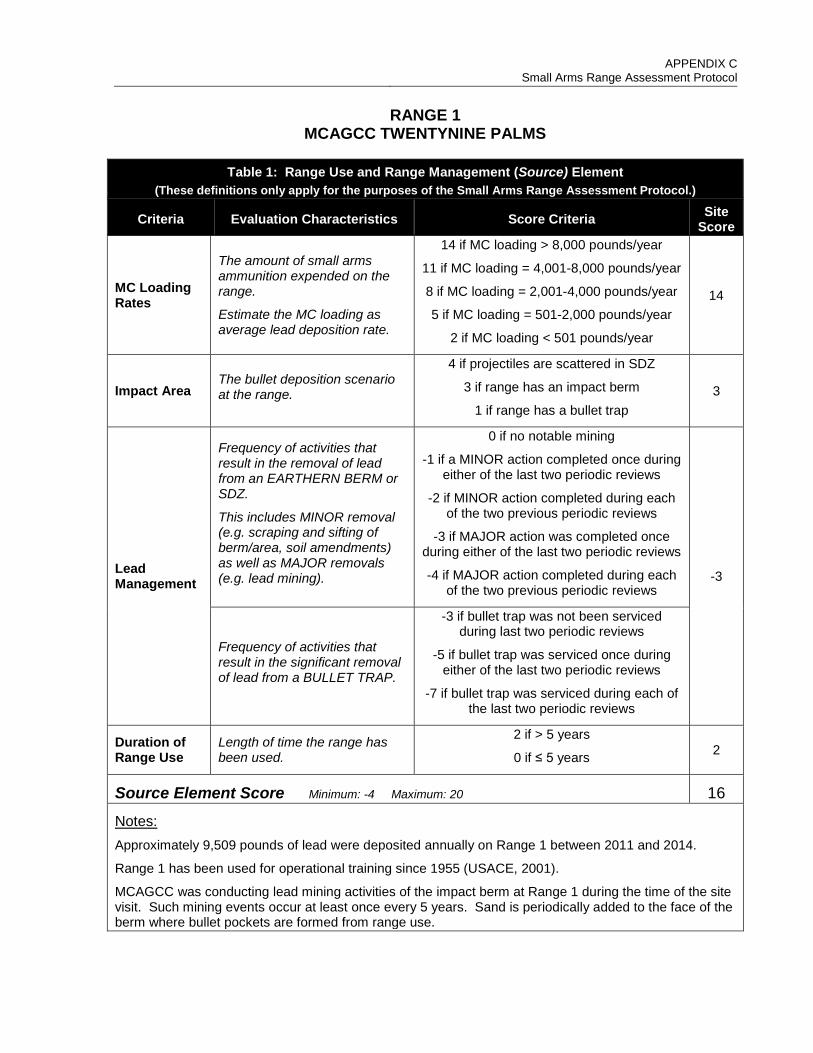
APPENDIX C
Small Arms Range Assessment Protocol
RANGE 1 MCAGCC TWENTYNINE PALMS
Table 1: Range Use and Range Management (Source) Element
(These definitions only apply for the purposes of the Small Arms Range Assessment Protocol.)
Criteria Evaluation Characteristics Score Criteria Site Score
MC Loading Rates
The amount of small arms ammunition expended on the range.
Estimate the MC loading as average lead deposition rate.
14 if MC loading > 8,000 pounds/year
11 if MC loading = 4,001-8,000 pounds/year
8 if MC loading = 2,001-4,000 pounds/year
5 if MC loading = 501-2,000 pounds/year
2 if MC loading < 501 pounds/year
14
Impact Area The bullet deposition scenario at the range.
4 if projectiles are scattered in SDZ
3 if range has an impact berm
1 if range has a bullet trap 3
Lead Management
Frequency of activities that result in the removal of lead from an EARTHERN BERM or SDZ.
This includes MINOR removal (e.g. scraping and sifting of berm/area, soil amendments) as well as MAJOR removals (e.g. lead mining).
0 if no notable mining
-1 if a MINOR action completed once during either of the last two periodic reviews
-2 if MINOR action completed during each of the two previous periodic reviews
-3 if MAJOR action was completed once during either of the last two periodic reviews
-4 if MAJOR action completed during each of the two previous periodic reviews
-3
Frequency of activities that result in the significant removal of lead from a BULLET TRAP.
-3 if bullet trap was not been serviced during last two periodic reviews
-5 if bullet trap was serviced once during either of the last two periodic reviews
-7 if bullet trap was serviced during each of the last two periodic reviews
Duration of Range Use
Length of time the range has been used.
2 if > 5 years
0 if ≤ 5 years 2
Source Element Score Minimum: -4 Maximum: 20 16
Notes: Approximately 9,509 pounds of lead were deposited annually on Range 1 between 2011 and 2014.
Range 1 has been used for operational training since 1955 (USACE, 2001).
MCAGCC was conducting lead mining activities of the impact berm at Range 1 during the time of the site visit. Such mining events occur at least once every 5 years. Sand is periodically added to the face of the berm where bullet pockets are formed from range use.

APPENDIX C
Small Arms Range Assessment Protocol
RANGE 1 MCAGCC TWENTYNINE PALMS
Table 2: Surface Water / Sediment Pathways Characteristics Element
(These definitions only apply for the purposes of the Small Arms Range Assessment Protocol.)
Criteria Evaluation Characteristics Score Criteria Site Score
Precipitation Rate of precipitation.
8 if precipitation > 40 inches/year
6 if precipitation = 20-40 inches/year
4 if precipitation < 20 inches/year 4
Vegetation Approximate vegetation cover within and directly downslope of the projectile deposition area.
6 if vegetation cover < 10%
4 if vegetation cover = 10% to 90%
2 if vegetation cover > 90% 6
Slope of Range
Average slope from deposition area along the overland pathway to the first defined channel.
5 if slope > 10% (5.71°)
3 if slope = 5% to 10%
2 if slope < 5% (2.86°) 2
pH of Soil pH below 6.5 and above 8.5 increases the rate of lead dissolution.
3 if pH < 4 or >10
2 if pH ≥ 4 < 6.5 or > 8.5 ≤ 10
1 if pH 6.5 ≤ pH ≤ 8.5 1
Soil Type/ Erosion
Erosion potential is greatest for fine sands and silt. Clay has the lowest erosion potential. The area where projectiles are deposited should be scored.
2 if soil type is fine sand / silt
1 if soil type is clayey sand or silt / coarse sands
0 if soil type is clay
2
Erosion observed at the projectile deposition area.
5 if there is visual evidence of eroded material being transported from the
projectile deposition area
3 if bullet pockets or other indicators of erosion were observed
1 if no erosion was observed
3
Engineering Controls
The presence of engineering controls or BMPs to modify or control surface water run-on.
Controls may include barriers or diversions that reduce run-on to the range.
0 if no engineering controls
-1 if partial engineering controls
-2 if effective engineering controls -1
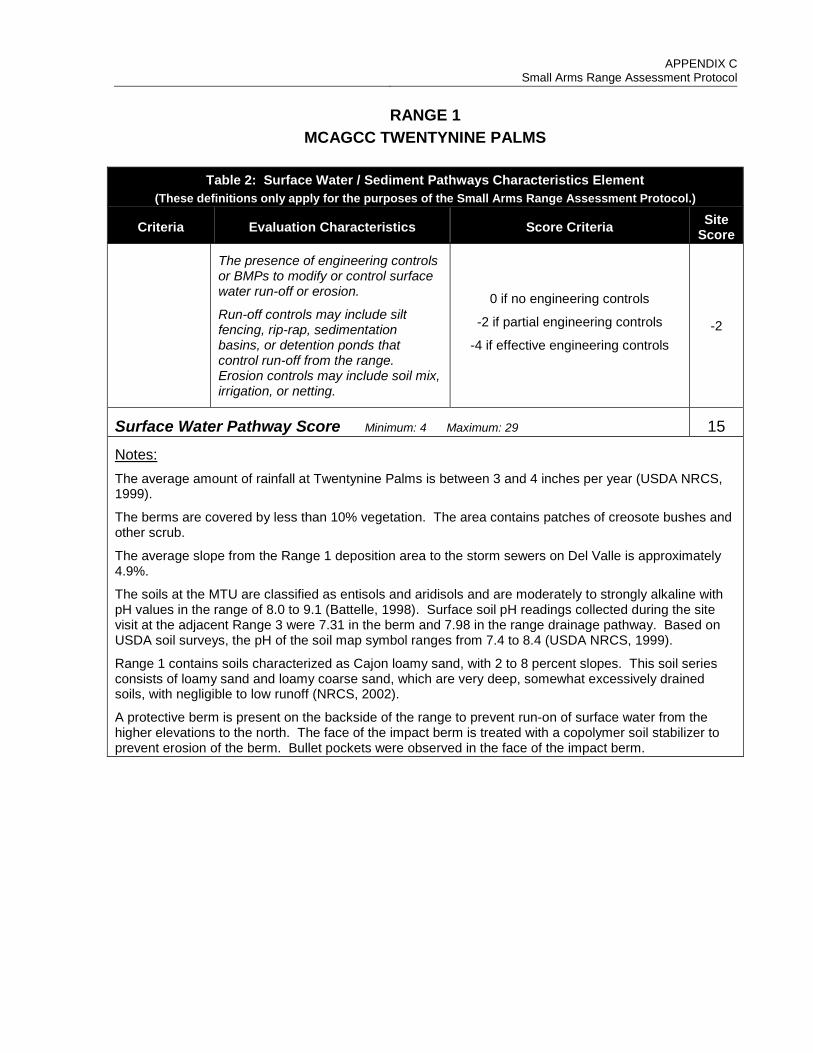
APPENDIX C
Small Arms Range Assessment Protocol
RANGE 1 MCAGCC TWENTYNINE PALMS
Table 2: Surface Water / Sediment Pathways Characteristics Element
(These definitions only apply for the purposes of the Small Arms Range Assessment Protocol.)
Criteria Evaluation Characteristics Score Criteria Site Score
The presence of engineering controls or BMPs to modify or control surface water run-off or erosion.
Run-off controls may include silt fencing, rip-rap, sedimentation basins, or detention ponds that control run-off from the range. Erosion controls may include soil mix, irrigation, or netting.
0 if no engineering controls
-2 if partial engineering controls
-4 if effective engineering controls -2
Surface Water Pathway Score Minimum: 4 Maximum: 29 15
Notes: The average amount of rainfall at Twentynine Palms is between 3 and 4 inches per year (USDA NRCS, 1999).
The berms are covered by less than 10% vegetation. The area contains patches of creosote bushes and other scrub.
The average slope from the Range 1 deposition area to the storm sewers on Del Valle is approximately 4.9%.
The soils at the MTU are classified as entisols and aridisols and are moderately to strongly alkaline with pH values in the range of 8.0 to 9.1 (Battelle, 1998). Surface soil pH readings collected during the site visit at the adjacent Range 3 were 7.31 in the berm and 7.98 in the range drainage pathway. Based on USDA soil surveys, the pH of the soil map symbol ranges from 7.4 to 8.4 (USDA NRCS, 1999).
Range 1 contains soils characterized as Cajon loamy sand, with 2 to 8 percent slopes. This soil series consists of loamy sand and loamy coarse sand, which are very deep, somewhat excessively drained soils, with negligible to low runoff (NRCS, 2002).
A protective berm is present on the backside of the range to prevent run-on of surface water from the higher elevations to the north. The face of the impact berm is treated with a copolymer soil stabilizer to prevent erosion of the berm. Bullet pockets were observed in the face of the impact berm.
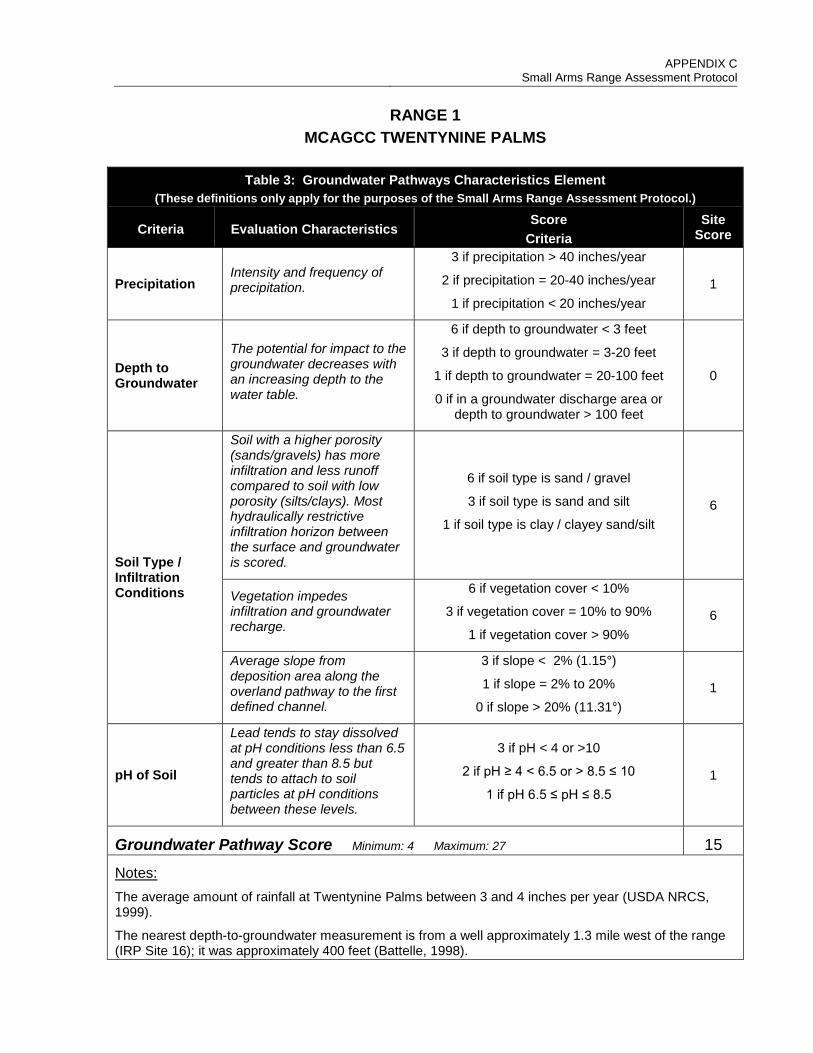
APPENDIX C
Small Arms Range Assessment Protocol
RANGE 1 MCAGCC TWENTYNINE PALMS
Table 3: Groundwater Pathways Characteristics Element
(These definitions only apply for the purposes of the Small Arms Range Assessment Protocol.)
Criteria Evaluation Characteristics Score
Criteria Site
Score
Precipitation Intensity and frequency of precipitation.
3 if precipitation > 40 inches/year
2 if precipitation = 20-40 inches/year
1 if precipitation < 20 inches/year 1
Depth to Groundwater
The potential for impact to the groundwater decreases with an increasing depth to the water table.
6 if depth to groundwater < 3 feet
3 if depth to groundwater = 3-20 feet
1 if depth to groundwater = 20-100 feet
0 if in a groundwater discharge area or depth to groundwater > 100 feet
0
Soil Type / Infiltration Conditions
Soil with a higher porosity (sands/gravels) has more infiltration and less runoff compared to soil with low porosity (silts/clays). Most hydraulically restrictive infiltration horizon between the surface and groundwater is scored.
6 if soil type is sand / gravel
3 if soil type is sand and silt
1 if soil type is clay / clayey sand/silt 6
Vegetation impedes infiltration and groundwater recharge.
6 if vegetation cover < 10%
3 if vegetation cover = 10% to 90%
1 if vegetation cover > 90% 6
Average slope from deposition area along the overland pathway to the first defined channel.
3 if slope < 2% (1.15°)
1 if slope = 2% to 20%
0 if slope > 20% (11.31°) 1
pH of Soil
Lead tends to stay dissolved at pH conditions less than 6.5 and greater than 8.5 but tends to attach to soil particles at pH conditions between these levels.
3 if pH < 4 or >10
2 if pH ≥ 4 < 6.5 or > 8.5 ≤ 10
1 if pH 6.5 ≤ pH ≤ 8.5 1
Groundwater Pathway Score Minimum: 4 Maximum: 27 15
Notes: The average amount of rainfall at Twentynine Palms between 3 and 4 inches per year (USDA NRCS, 1999).
The nearest depth-to-groundwater measurement is from a well approximately 1.3 mile west of the range (IRP Site 16); it was approximately 400 feet (Battelle, 1998).
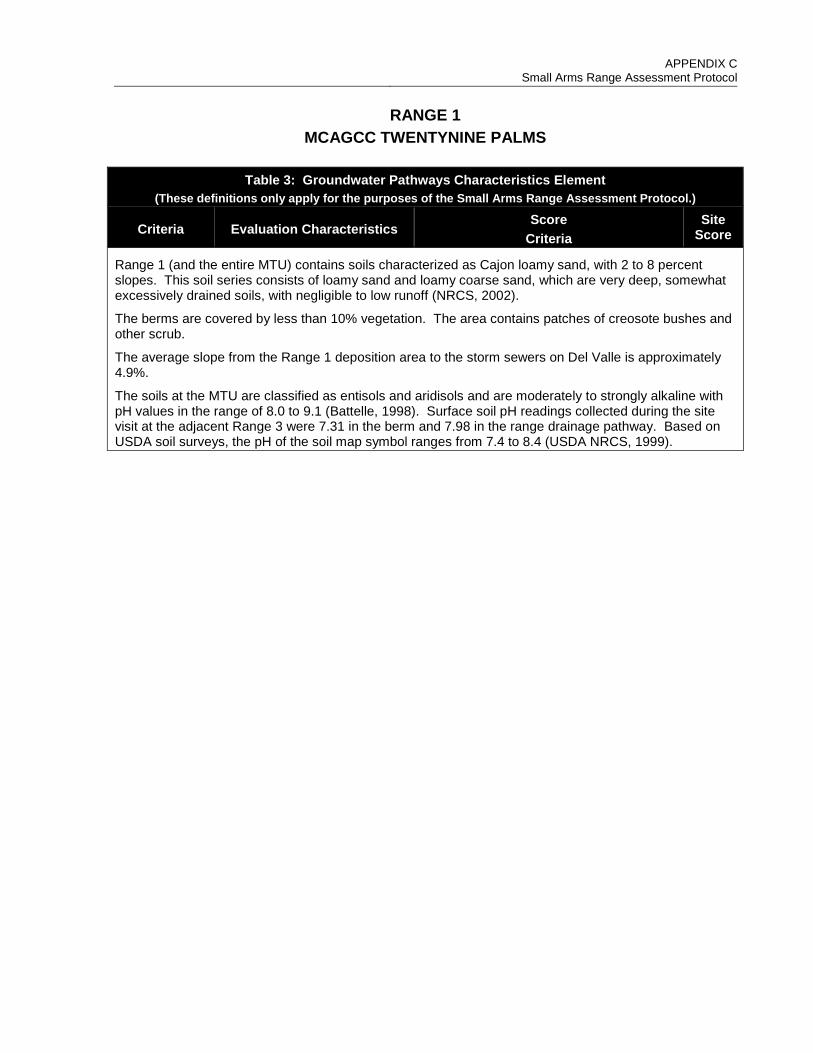
APPENDIX C
Small Arms Range Assessment Protocol
RANGE 1 MCAGCC TWENTYNINE PALMS
Table 3: Groundwater Pathways Characteristics Element
(These definitions only apply for the purposes of the Small Arms Range Assessment Protocol.)
Criteria Evaluation Characteristics Score
Criteria Site
Score
Range 1 (and the entire MTU) contains soils characterized as Cajon loamy sand, with 2 to 8 percent slopes. This soil series consists of loamy sand and loamy coarse sand, which are very deep, somewhat excessively drained soils, with negligible to low runoff (NRCS, 2002).
The berms are covered by less than 10% vegetation. The area contains patches of creosote bushes and other scrub.
The average slope from the Range 1 deposition area to the storm sewers on Del Valle is approximately 4.9%.
The soils at the MTU are classified as entisols and aridisols and are moderately to strongly alkaline with pH values in the range of 8.0 to 9.1 (Battelle, 1998). Surface soil pH readings collected during the site visit at the adjacent Range 3 were 7.31 in the berm and 7.98 in the range drainage pathway. Based on USDA soil surveys, the pH of the soil map symbol ranges from 7.4 to 8.4 (USDA NRCS, 1999).
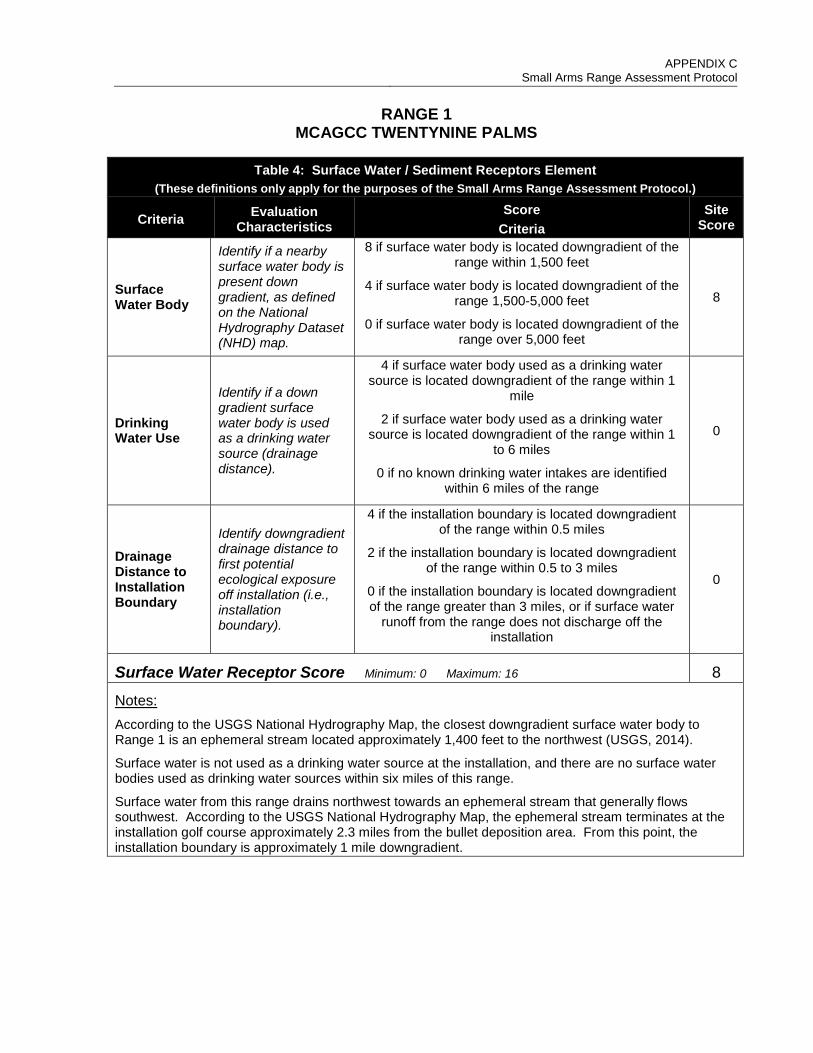
APPENDIX C
Small Arms Range Assessment Protocol
RANGE 1 MCAGCC TWENTYNINE PALMS
Table 4: Surface Water / Sediment Receptors Element
(These definitions only apply for the purposes of the Small Arms Range Assessment Protocol.)
Criteria Evaluation Characteristics
Score Criteria
Site Score
Surface Water Body
Identify if a nearby surface water body is present down gradient, as defined on the National Hydrography Dataset (NHD) map.
8 if surface water body is located downgradient of the range within 1,500 feet
4 if surface water body is located downgradient of the range 1,500-5,000 feet
0 if surface water body is located downgradient of the range over 5,000 feet
8
Drinking Water Use
Identify if a down gradient surface water body is used as a drinking water source (drainage distance).
4 if surface water body used as a drinking water source is located downgradient of the range within 1
mile
2 if surface water body used as a drinking water source is located downgradient of the range within 1
to 6 miles
0 if no known drinking water intakes are identified within 6 miles of the range
0
Drainage Distance to Installation Boundary
Identify downgradient drainage distance to first potential ecological exposure off installation (i.e., installation boundary).
4 if the installation boundary is located downgradient of the range within 0.5 miles
2 if the installation boundary is located downgradient of the range within 0.5 to 3 miles
0 if the installation boundary is located downgradient of the range greater than 3 miles, or if surface water
runoff from the range does not discharge off the installation
0
Surface Water Receptor Score Minimum: 0 Maximum: 16 8
Notes: According to the USGS National Hydrography Map, the closest downgradient surface water body to Range 1 is an ephemeral stream located approximately 1,400 feet to the northwest (USGS, 2014).
Surface water is not used as a drinking water source at the installation, and there are no surface water bodies used as drinking water sources within six miles of this range.
Surface water from this range drains northwest towards an ephemeral stream that generally flows southwest. According to the USGS National Hydrography Map, the ephemeral stream terminates at the installation golf course approximately 2.3 miles from the bullet deposition area. From this point, the installation boundary is approximately 1 mile downgradient.
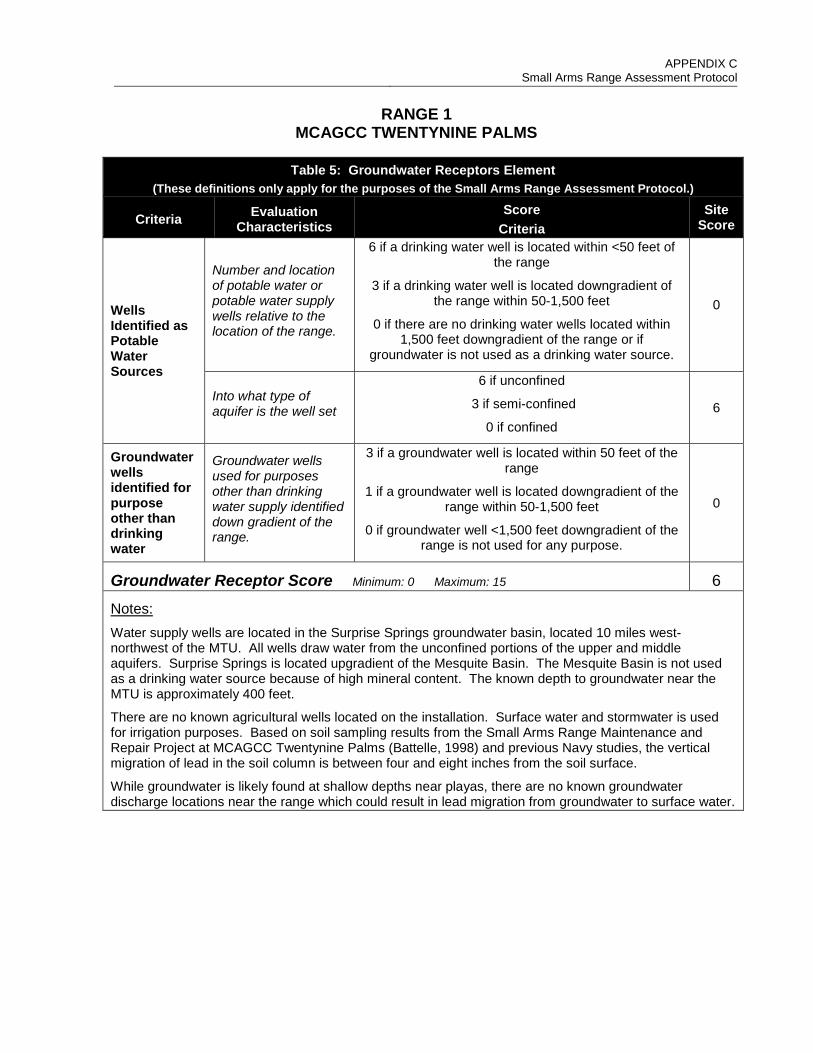
APPENDIX C
Small Arms Range Assessment Protocol
RANGE 1 MCAGCC TWENTYNINE PALMS
Table 5: Groundwater Receptors Element
(These definitions only apply for the purposes of the Small Arms Range Assessment Protocol.)
Criteria Evaluation Characteristics
Score Criteria
Site Score
Wells Identified as Potable Water Sources
Number and location of potable water or potable water supply wells relative to the location of the range.
6 if a drinking water well is located within <50 feet of the range
3 if a drinking water well is located downgradient of the range within 50-1,500 feet
0 if there are no drinking water wells located within 1,500 feet downgradient of the range or if
groundwater is not used as a drinking water source.
0
Into what type of aquifer is the well set
6 if unconfined
3 if semi-confined
0 if confined 6
Groundwater wells identified for purpose other than drinking water
Groundwater wells used for purposes other than drinking water supply identified down gradient of the range.
3 if a groundwater well is located within 50 feet of the range
1 if a groundwater well is located downgradient of the range within 50-1,500 feet
0 if groundwater well <1,500 feet downgradient of the range is not used for any purpose.
0
Groundwater Receptor Score Minimum: 0 Maximum: 15 6
Notes: Water supply wells are located in the Surprise Springs groundwater basin, located 10 miles west-northwest of the MTU. All wells draw water from the unconfined portions of the upper and middle aquifers. Surprise Springs is located upgradient of the Mesquite Basin. The Mesquite Basin is not used as a drinking water source because of high mineral content. The known depth to groundwater near the MTU is approximately 400 feet.
There are no known agricultural wells located on the installation. Surface water and stormwater is used for irrigation purposes. Based on soil sampling results from the Small Arms Range Maintenance and Repair Project at MCAGCC Twentynine Palms (Battelle, 1998) and previous Navy studies, the vertical migration of lead in the soil column is between four and eight inches from the soil surface.
While groundwater is likely found at shallow depths near playas, there are no known groundwater discharge locations near the range which could result in lead migration from groundwater to surface water.

APPENDIX C
Small Arms Range Assessment Protocol
RANGE 1 MCAGCC TWENTYNINE PALMS
Table 6: Evaluation Score (These definitions only apply for the purposes of the Small Arms Range Assessment Protocol.)
Surface Water / Sediment
Element Table Score
Range Use and Range Management (Source) 1 16
Surface Water / Sediment Pathways 2 15
Surface Water / Sediment Receptors 4 8
Sum of Surface Water / Sediment Element Scores Minimum: 0 Maximum: 65 39
Groundwater
Element Table Score
Range Use and Range Management (Source) 1 16
Groundwater Pathways 3 15
Groundwater Receptors 5 6
Sum of Groundwater Element Scores Minimum: 0 Maximum: 62 37
Field Sampling and Observed Releases
Surface Water / Sediment
Surface water sampling conducted Yes No Sediment sampling conducted Yes No Results exceed DoD screening value Yes No
Surface Water / Sediment
No Modification High
Groundwater No Modification High
Groundwater Groundwater sampling conducted Yes No Results exceed DoD screening value Yes No
The relative evaluation ranking for each media is determined by selecting the appropriate score based on the data elements for that media:
Evaluation Ranking* Score Range High 45-65 Moderate 33-44 Minimal 0-32
Surface Water Evaluation Ranking Moderate
Groundwater Evaluation Ranking Moderate
Notes:
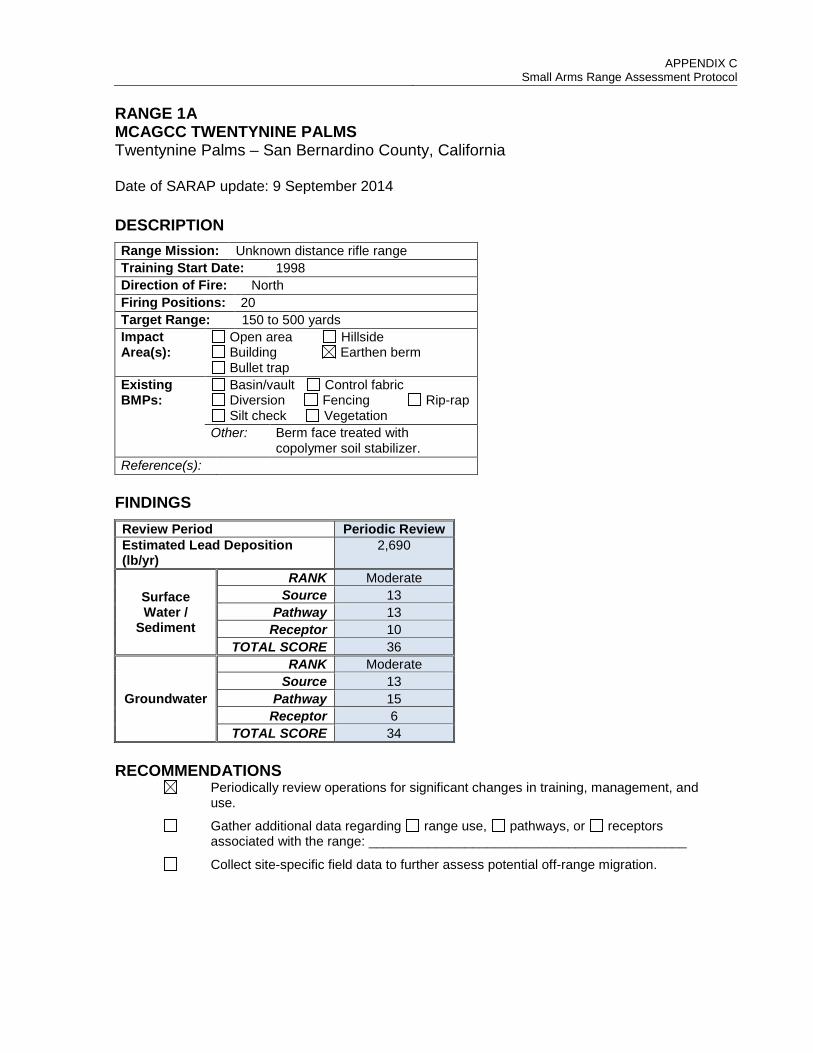
APPENDIX C
Small Arms Range Assessment Protocol RANGE 1A MCAGCC TWENTYNINE PALMS Twentynine Palms – San Bernardino County, California Date of SARAP update: 9 September 2014
DESCRIPTION Range Mission: Unknown distance rifle range Training Start Date: 1998 Direction of Fire: North Firing Positions: 20 Target Range: 150 to 500 yards Impact Area(s):
Open area Hillside Building Earthen berm Bullet trap
Existing BMPs:
Basin/vault Control fabric Diversion Fencing Rip-rap Silt check Vegetation
Other: Berm face treated with copolymer soil stabilizer.
Reference(s): FINDINGS Review Period Periodic Review Estimated Lead Deposition (lb/yr)
2,690
Surface Water /
Sediment
RANK Moderate Source 13
Pathway 13 Receptor 10
TOTAL SCORE 36
Groundwater
RANK Moderate Source 13
Pathway 15 Receptor 6
TOTAL SCORE 34 RECOMMENDATIONS
Periodically review operations for significant changes in training, management, and use.
Gather additional data regarding range use, pathways, or receptors associated with the range: ___________________________________________
Collect site-specific field data to further assess potential off-range migration.
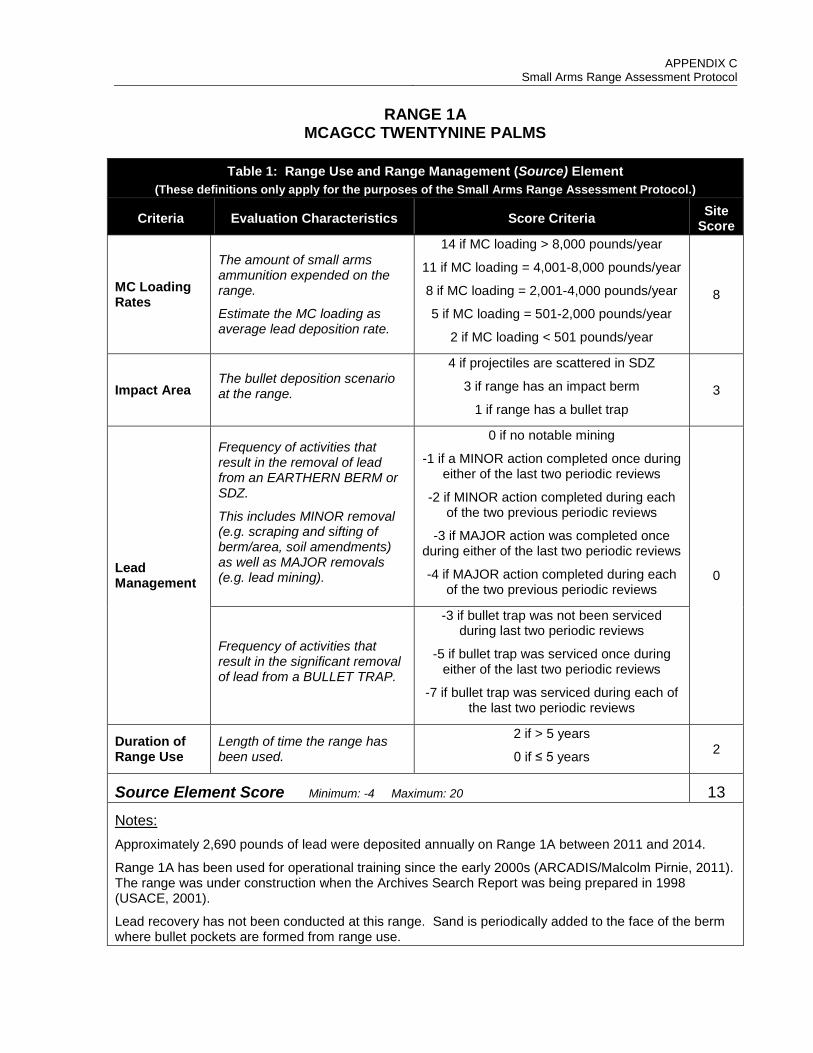
APPENDIX C
Small Arms Range Assessment Protocol
RANGE 1A MCAGCC TWENTYNINE PALMS
Table 1: Range Use and Range Management (Source) Element
(These definitions only apply for the purposes of the Small Arms Range Assessment Protocol.)
Criteria Evaluation Characteristics Score Criteria Site Score
MC Loading Rates
The amount of small arms ammunition expended on the range.
Estimate the MC loading as average lead deposition rate.
14 if MC loading > 8,000 pounds/year
11 if MC loading = 4,001-8,000 pounds/year
8 if MC loading = 2,001-4,000 pounds/year
5 if MC loading = 501-2,000 pounds/year
2 if MC loading < 501 pounds/year
8
Impact Area The bullet deposition scenario at the range.
4 if projectiles are scattered in SDZ
3 if range has an impact berm
1 if range has a bullet trap 3
Lead Management
Frequency of activities that result in the removal of lead from an EARTHERN BERM or SDZ.
This includes MINOR removal (e.g. scraping and sifting of berm/area, soil amendments) as well as MAJOR removals (e.g. lead mining).
0 if no notable mining
-1 if a MINOR action completed once during either of the last two periodic reviews
-2 if MINOR action completed during each of the two previous periodic reviews
-3 if MAJOR action was completed once during either of the last two periodic reviews
-4 if MAJOR action completed during each of the two previous periodic reviews
0
Frequency of activities that result in the significant removal of lead from a BULLET TRAP.
-3 if bullet trap was not been serviced during last two periodic reviews
-5 if bullet trap was serviced once during either of the last two periodic reviews
-7 if bullet trap was serviced during each of the last two periodic reviews
Duration of Range Use
Length of time the range has been used.
2 if > 5 years
0 if ≤ 5 years 2
Source Element Score Minimum: -4 Maximum: 20 13
Notes: Approximately 2,690 pounds of lead were deposited annually on Range 1A between 2011 and 2014.
Range 1A has been used for operational training since the early 2000s (ARCADIS/Malcolm Pirnie, 2011). The range was under construction when the Archives Search Report was being prepared in 1998 (USACE, 2001).
Lead recovery has not been conducted at this range. Sand is periodically added to the face of the berm where bullet pockets are formed from range use.

APPENDIX C
Small Arms Range Assessment Protocol
RANGE 1A MCAGCC TWENTYNINE PALMS
Table 2: Surface Water / Sediment Pathways Characteristics Element
(These definitions only apply for the purposes of the Small Arms Range Assessment Protocol.)
Criteria Evaluation Characteristics Score Criteria Site Score
Precipitation Rate of precipitation.
8 if precipitation > 40 inches/year
6 if precipitation = 20-40 inches/year
4 if precipitation < 20 inches/year 4
Vegetation Approximate vegetation cover within and directly downslope of the projectile deposition area.
6 if vegetation cover < 10%
4 if vegetation cover = 10% to 90%
2 if vegetation cover > 90% 6
Slope of Range
Average slope from deposition area along the overland pathway to the first defined channel.
5 if slope > 10% (5.71°)
3 if slope = 5% to 10%
2 if slope < 5% (2.86°) 2
pH of Soil pH below 6.5 and above 8.5 increases the rate of lead dissolution.
3 if pH < 4 or >10
2 if pH ≥ 4 < 6.5 or > 8.5 ≤ 10
1 if pH 6.5 ≤ pH ≤ 8.5 1
Soil Type/ Erosion
Erosion potential is greatest for fine sands and silt. Clay has the lowest erosion potential. The area where projectiles are deposited should be scored.
2 if soil type is fine sand / silt
1 if soil type is clayey sand or silt / coarse sands
0 if soil type is clay
2
Erosion observed at the projectile deposition area.
5 if there is visual evidence of eroded material being transported from the
projectile deposition area
3 if bullet pockets or other indicators of erosion were observed
1 if no erosion was observed
1
Engineering Controls
The presence of engineering controls or BMPs to modify or control surface water run-on.
Controls may include barriers or diversions that reduce run-on to the range.
0 if no engineering controls
-1 if partial engineering controls
-2 if effective engineering controls -1

APPENDIX C
Small Arms Range Assessment Protocol
RANGE 1A MCAGCC TWENTYNINE PALMS
Table 2: Surface Water / Sediment Pathways Characteristics Element
(These definitions only apply for the purposes of the Small Arms Range Assessment Protocol.)
Criteria Evaluation Characteristics Score Criteria Site Score
The presence of engineering controls or BMPs to modify or control surface water run-off or erosion.
Run-off controls may include silt fencing, rip-rap, sedimentation basins, or detention ponds that control run-off from the range. Erosion controls may include soil mix, irrigation, or netting.
0 if no engineering controls
-2 if partial engineering controls
-4 if effective engineering controls -2
Surface Water Pathway Score Minimum: 4 Maximum: 29 13
Notes: The average amount of rainfall at Twentynine Palms is between 3 and 4 inches per year (USDA NRCS, 1999).
The berms are covered by less than 10% vegetation. The area contains patches of creosote bushes and other scrub.
The average slope from the Range 1A deposition area to the storm sewers on Del Valle is approximately 3.9%.
The soils at the MTU are classified as entisols and aridisols and are moderately to strongly alkaline with pH values in the range of 8.0 to 9.1 (Battelle, 1998). A very small part of the range area also consists of the Dalvord–Goldroad-Rock outcrop association which consists of very gravelly loamy sand and extremely gravelly sandy loam soils. Based on USDA soil surveys, the pH of the soil map symbols range from 7.4 to 8.4 (USDA NRCS, 1999). Surface soil pH readings were collected during the 2014 site visit at the adjacent Range 3. pH readings taken on the berm were 7.31 and 7.98 in the range drainage pathway.
Range 1A (and the entire MTU) contains soils characterized as Cajon loamy sand, 2 to 8 percent slopes. This soil series consists of loamy sand and loamy coarse sand, that are very deep, somewhat excessively drained soils, with negligible to low runoff (NRCS, 2002).
A protective berm is present behind the rear impact berm of the range to prevent run-on of surface water from the higher elevations to the north. The face of the impact berm is treated with a copolymer soil stabilizer to prevent erosion of the berm.
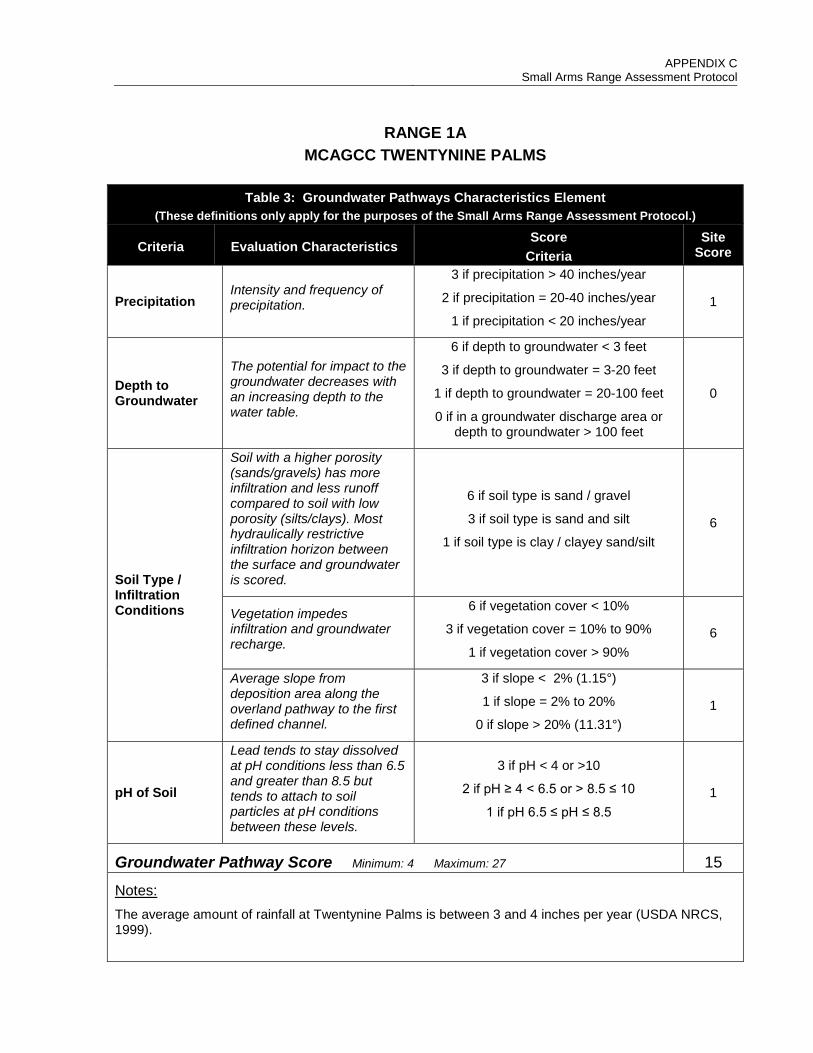
APPENDIX C
Small Arms Range Assessment Protocol
RANGE 1A MCAGCC TWENTYNINE PALMS
Table 3: Groundwater Pathways Characteristics Element
(These definitions only apply for the purposes of the Small Arms Range Assessment Protocol.)
Criteria Evaluation Characteristics Score
Criteria Site
Score
Precipitation Intensity and frequency of precipitation.
3 if precipitation > 40 inches/year
2 if precipitation = 20-40 inches/year
1 if precipitation < 20 inches/year 1
Depth to Groundwater
The potential for impact to the groundwater decreases with an increasing depth to the water table.
6 if depth to groundwater < 3 feet
3 if depth to groundwater = 3-20 feet
1 if depth to groundwater = 20-100 feet
0 if in a groundwater discharge area or depth to groundwater > 100 feet
0
Soil Type / Infiltration Conditions
Soil with a higher porosity (sands/gravels) has more infiltration and less runoff compared to soil with low porosity (silts/clays). Most hydraulically restrictive infiltration horizon between the surface and groundwater is scored.
6 if soil type is sand / gravel
3 if soil type is sand and silt
1 if soil type is clay / clayey sand/silt 6
Vegetation impedes infiltration and groundwater recharge.
6 if vegetation cover < 10%
3 if vegetation cover = 10% to 90%
1 if vegetation cover > 90% 6
Average slope from deposition area along the overland pathway to the first defined channel.
3 if slope < 2% (1.15°)
1 if slope = 2% to 20%
0 if slope > 20% (11.31°) 1
pH of Soil
Lead tends to stay dissolved at pH conditions less than 6.5 and greater than 8.5 but tends to attach to soil particles at pH conditions between these levels.
3 if pH < 4 or >10
2 if pH ≥ 4 < 6.5 or > 8.5 ≤ 10
1 if pH 6.5 ≤ pH ≤ 8.5 1
Groundwater Pathway Score Minimum: 4 Maximum: 27 15
Notes: The average amount of rainfall at Twentynine Palms is between 3 and 4 inches per year (USDA NRCS, 1999).

APPENDIX C
Small Arms Range Assessment Protocol
RANGE 1A MCAGCC TWENTYNINE PALMS
Table 3: Groundwater Pathways Characteristics Element
(These definitions only apply for the purposes of the Small Arms Range Assessment Protocol.)
Criteria Evaluation Characteristics Score
Criteria Site
Score
The nearest depth-to-groundwater measurement is from a well approximately 1.3 mile west of the range (IRP Site 16). Depth to groundwater at that point was approximately 400 feet (Battelle 1998).
Range 1A (and the entire MTU) contains soils characterized as Cajon loamy sand, 2 to 8 percent slopes. This soil series consists of loamy sand and loamy coarse sand, that are very deep, somewhat excessively drained soils with negligible to low runoff (NRCS, 2002).
The berms are covered by less than 10% vegetation. The area contains patches of creosote bushes and other scrub.
The average slope from the Range 1A deposition area to the storm sewers on Del Valle is approximately 3.9%.
The soils at the MTU are classified as entisols and aridisols and are moderately to strongly alkaline with pH values in the range of 8.0 to 9.1 (Battelle, 1998). A very small part of the range area also consists of the Dalvord–Goldroad-Rock outcrop association which consists of very gravelly loamy sand and extremely gravelly sandy loam soils. Based on USDA soil surveys, the pH of the soil map symbols range from 7.4 to 8.4 (USDA NRCS, 1999). Surface soil pH readings collected during the 2014 site visit at the adjacent Range 3 were 7.31 in the berm and 7.98 in the range drainage pathway.
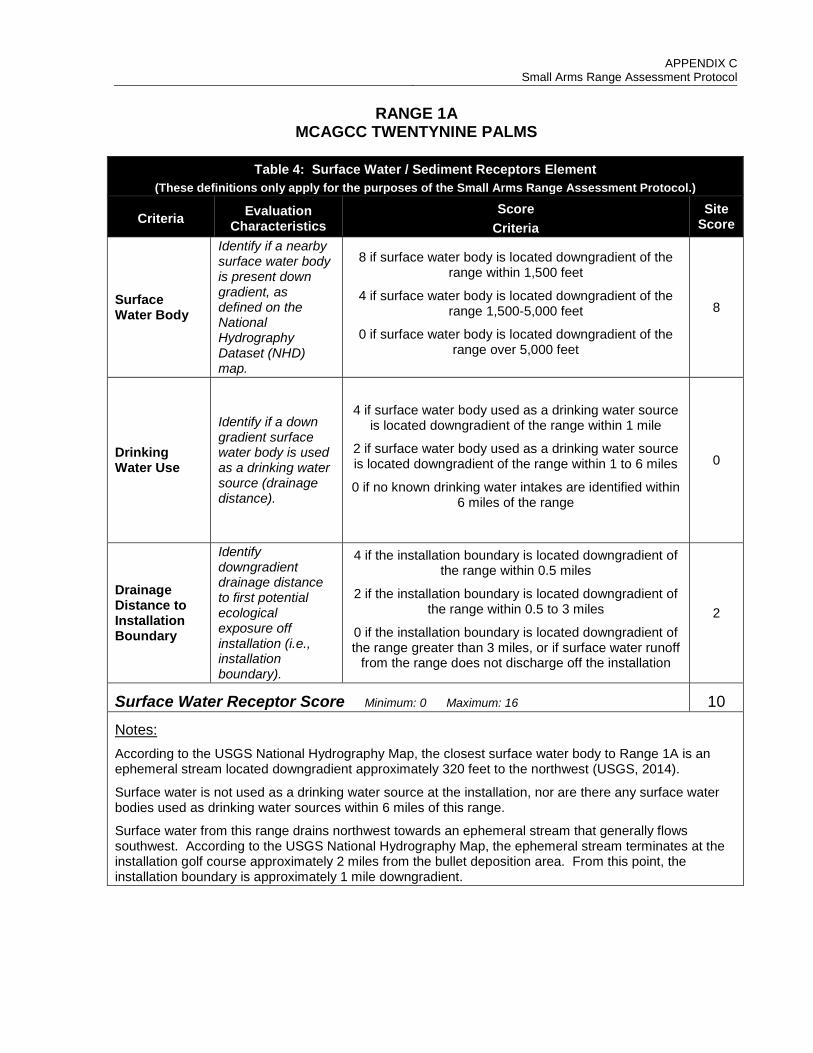
APPENDIX C
Small Arms Range Assessment Protocol
RANGE 1A MCAGCC TWENTYNINE PALMS
Table 4: Surface Water / Sediment Receptors Element
(These definitions only apply for the purposes of the Small Arms Range Assessment Protocol.)
Criteria Evaluation Characteristics
Score Criteria
Site Score
Surface Water Body
Identify if a nearby surface water body is present down gradient, as defined on the National Hydrography Dataset (NHD) map.
8 if surface water body is located downgradient of the range within 1,500 feet
4 if surface water body is located downgradient of the range 1,500-5,000 feet
0 if surface water body is located downgradient of the range over 5,000 feet
8
Drinking Water Use
Identify if a down gradient surface water body is used as a drinking water source (drainage distance).
4 if surface water body used as a drinking water source is located downgradient of the range within 1 mile
2 if surface water body used as a drinking water source is located downgradient of the range within 1 to 6 miles
0 if no known drinking water intakes are identified within 6 miles of the range
0
Drainage Distance to Installation Boundary
Identify downgradient drainage distance to first potential ecological exposure off installation (i.e., installation boundary).
4 if the installation boundary is located downgradient of the range within 0.5 miles
2 if the installation boundary is located downgradient of the range within 0.5 to 3 miles
0 if the installation boundary is located downgradient of the range greater than 3 miles, or if surface water runoff
from the range does not discharge off the installation
2
Surface Water Receptor Score Minimum: 0 Maximum: 16 10
Notes: According to the USGS National Hydrography Map, the closest surface water body to Range 1A is an ephemeral stream located downgradient approximately 320 feet to the northwest (USGS, 2014).
Surface water is not used as a drinking water source at the installation, nor are there any surface water bodies used as drinking water sources within 6 miles of this range.
Surface water from this range drains northwest towards an ephemeral stream that generally flows southwest. According to the USGS National Hydrography Map, the ephemeral stream terminates at the installation golf course approximately 2 miles from the bullet deposition area. From this point, the installation boundary is approximately 1 mile downgradient.
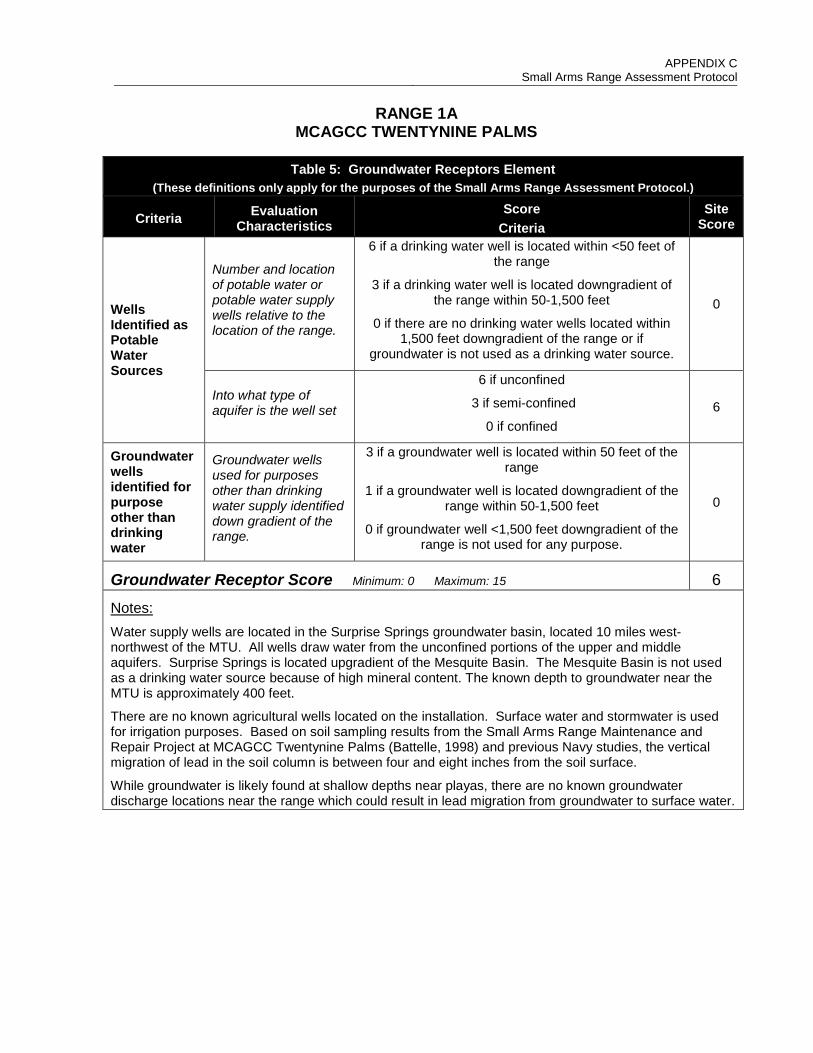
APPENDIX C
Small Arms Range Assessment Protocol
RANGE 1A MCAGCC TWENTYNINE PALMS
Table 5: Groundwater Receptors Element
(These definitions only apply for the purposes of the Small Arms Range Assessment Protocol.)
Criteria Evaluation Characteristics
Score Criteria
Site Score
Wells Identified as Potable Water Sources
Number and location of potable water or potable water supply wells relative to the location of the range.
6 if a drinking water well is located within <50 feet of the range
3 if a drinking water well is located downgradient of the range within 50-1,500 feet
0 if there are no drinking water wells located within 1,500 feet downgradient of the range or if
groundwater is not used as a drinking water source.
0
Into what type of aquifer is the well set
6 if unconfined
3 if semi-confined
0 if confined 6
Groundwater wells identified for purpose other than drinking water
Groundwater wells used for purposes other than drinking water supply identified down gradient of the range.
3 if a groundwater well is located within 50 feet of the range
1 if a groundwater well is located downgradient of the range within 50-1,500 feet
0 if groundwater well <1,500 feet downgradient of the range is not used for any purpose.
0
Groundwater Receptor Score Minimum: 0 Maximum: 15 6
Notes: Water supply wells are located in the Surprise Springs groundwater basin, located 10 miles west-northwest of the MTU. All wells draw water from the unconfined portions of the upper and middle aquifers. Surprise Springs is located upgradient of the Mesquite Basin. The Mesquite Basin is not used as a drinking water source because of high mineral content. The known depth to groundwater near the MTU is approximately 400 feet.
There are no known agricultural wells located on the installation. Surface water and stormwater is used for irrigation purposes. Based on soil sampling results from the Small Arms Range Maintenance and Repair Project at MCAGCC Twentynine Palms (Battelle, 1998) and previous Navy studies, the vertical migration of lead in the soil column is between four and eight inches from the soil surface.
While groundwater is likely found at shallow depths near playas, there are no known groundwater discharge locations near the range which could result in lead migration from groundwater to surface water.

APPENDIX C
Small Arms Range Assessment Protocol
RANGE 1A MCAGCC TWENTYNINE PALMS
Table 6: Evaluation Score (These definitions only apply for the purposes of the Small Arms Range Assessment Protocol.)
Surface Water / Sediment
Element Table Score
Range Use and Range Management (Source) 1 13
Surface Water / Sediment Pathways 2 13
Surface Water / Sediment Receptors 4 10
Sum of Surface Water / Sediment Element Scores Minimum: 0 Maximum: 65 36
Groundwater
Element Table Score
Range Use and Range Management (Source) 1 13
Groundwater Pathways 3 15
Groundwater Receptors 5 6
Sum of Groundwater Element Scores Minimum: 0 Maximum: 62 34
Field Sampling and Observed Releases
Surface Water / Sediment
Surface water sampling conducted Yes No Sediment sampling conducted Yes No Results exceed DoD screening value Yes No
Surface Water / Sediment
No Modification High
Groundwater No Modification High
Groundwater Groundwater sampling conducted Yes No Results exceed DoD screening value Yes No
The relative evaluation ranking for each media is determined by selecting the appropriate score based on the data elements for that media:
Evaluation Ranking* Score Range High 45-65 Moderate 33-44 Minimal 0-32
Surface Water Evaluation Ranking Moderate
Groundwater Evaluation Ranking Moderate
Notes:

APPENDIX C
Small Arms Range Assessment Protocol RANGE 2 MCAGCC TWENTYNINE PALMS Twentynine Palms – San Bernardino County, California Date of SARAP update: 9 September 2014
DESCRIPTION Range Mission: Known distance multi-purpose range Training Start Date: 1955 Direction of Fire: Northeast Firing Positions: 50 Target Range: 7, 15, 25, and 50 yards Impact Area(s):
Open area Hillside Building Earthen berm Bullet trap
Existing BMPs:
Basin/vault Control fabric Diversion Fencing Rip-rap Silt check Vegetation
Other: Berm face treated with copolymer soil stabilizer.
Reference(s): FINDINGS Review Period Periodic Review Estimated Lead Deposition (lb/yr)
6,964
Surface Water /
Sediment
RANK Minimal Source 13
Pathway 12 Receptor 6
TOTAL SCORE 31
Groundwater
RANK Moderate Source 13
Pathway 16 Receptor 6
TOTAL SCORE 35 RECOMMENDATIONS
Periodically review operations for significant changes in training, management, and use.
Gather additional data regarding range use, pathways, or receptors associated with the range: ___________________________________________
Collect site-specific field data to further assess potential off-range migration.
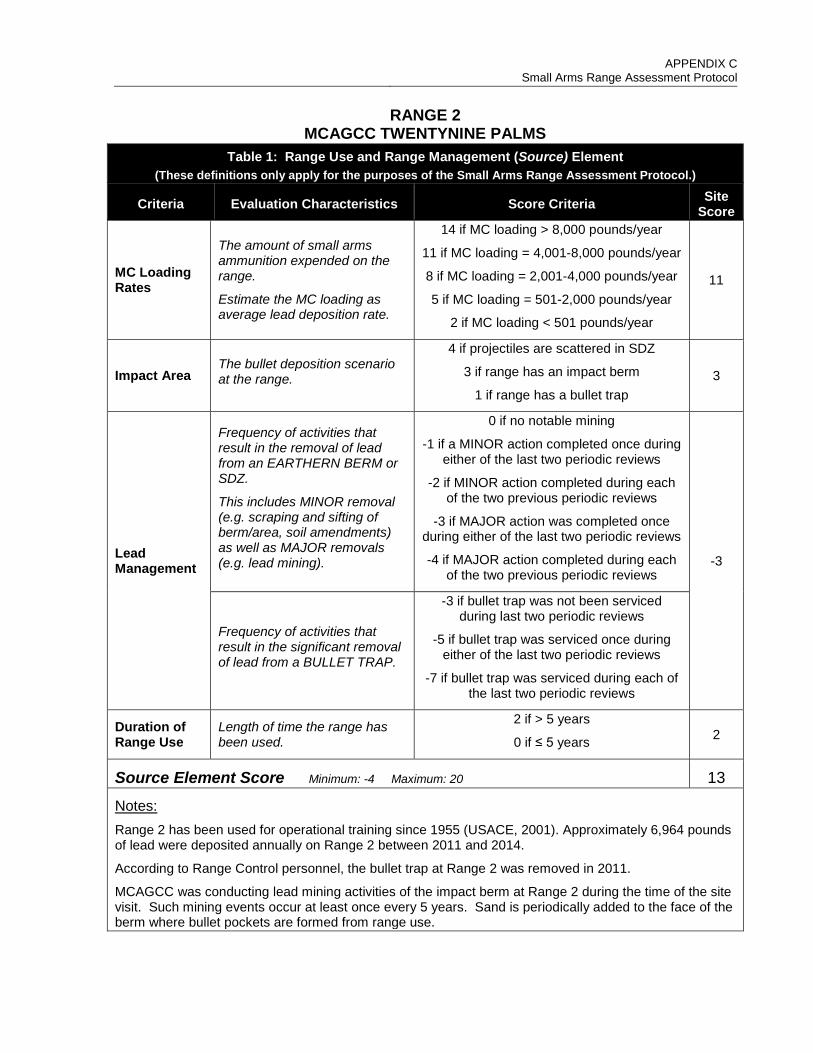
APPENDIX C
Small Arms Range Assessment Protocol
RANGE 2 MCAGCC TWENTYNINE PALMS
Table 1: Range Use and Range Management (Source) Element (These definitions only apply for the purposes of the Small Arms Range Assessment Protocol.)
Criteria Evaluation Characteristics Score Criteria Site Score
MC Loading Rates
The amount of small arms ammunition expended on the range.
Estimate the MC loading as average lead deposition rate.
14 if MC loading > 8,000 pounds/year
11 if MC loading = 4,001-8,000 pounds/year
8 if MC loading = 2,001-4,000 pounds/year
5 if MC loading = 501-2,000 pounds/year
2 if MC loading < 501 pounds/year
11
Impact Area The bullet deposition scenario at the range.
4 if projectiles are scattered in SDZ
3 if range has an impact berm
1 if range has a bullet trap 3
Lead Management
Frequency of activities that result in the removal of lead from an EARTHERN BERM or SDZ.
This includes MINOR removal (e.g. scraping and sifting of berm/area, soil amendments) as well as MAJOR removals (e.g. lead mining).
0 if no notable mining
-1 if a MINOR action completed once during either of the last two periodic reviews
-2 if MINOR action completed during each of the two previous periodic reviews
-3 if MAJOR action was completed once during either of the last two periodic reviews
-4 if MAJOR action completed during each of the two previous periodic reviews
-3
Frequency of activities that result in the significant removal of lead from a BULLET TRAP.
-3 if bullet trap was not been serviced during last two periodic reviews
-5 if bullet trap was serviced once during either of the last two periodic reviews
-7 if bullet trap was serviced during each of the last two periodic reviews
Duration of Range Use
Length of time the range has been used.
2 if > 5 years
0 if ≤ 5 years 2
Source Element Score Minimum: -4 Maximum: 20 13
Notes: Range 2 has been used for operational training since 1955 (USACE, 2001). Approximately 6,964 pounds of lead were deposited annually on Range 2 between 2011 and 2014.
According to Range Control personnel, the bullet trap at Range 2 was removed in 2011.
MCAGCC was conducting lead mining activities of the impact berm at Range 2 during the time of the site visit. Such mining events occur at least once every 5 years. Sand is periodically added to the face of the berm where bullet pockets are formed from range use.
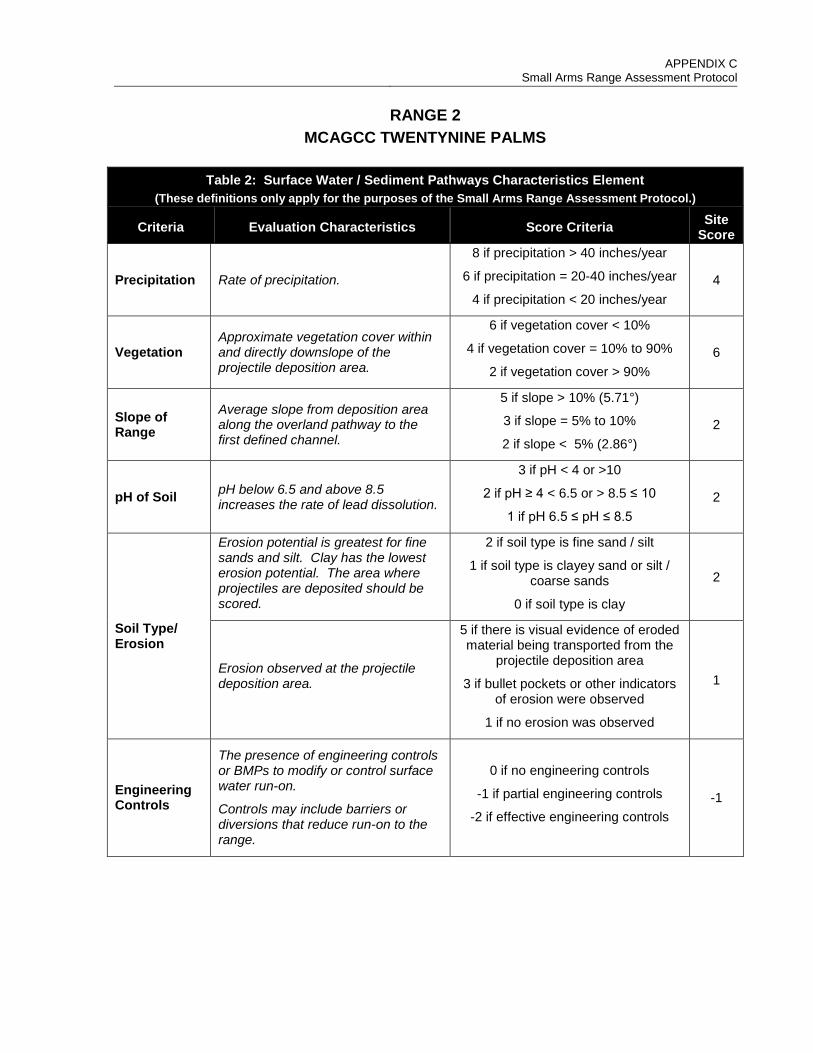
APPENDIX C
Small Arms Range Assessment Protocol
RANGE 2 MCAGCC TWENTYNINE PALMS
Table 2: Surface Water / Sediment Pathways Characteristics Element
(These definitions only apply for the purposes of the Small Arms Range Assessment Protocol.)
Criteria Evaluation Characteristics Score Criteria Site Score
Precipitation Rate of precipitation.
8 if precipitation > 40 inches/year
6 if precipitation = 20-40 inches/year
4 if precipitation < 20 inches/year 4
Vegetation Approximate vegetation cover within and directly downslope of the projectile deposition area.
6 if vegetation cover < 10%
4 if vegetation cover = 10% to 90%
2 if vegetation cover > 90% 6
Slope of Range
Average slope from deposition area along the overland pathway to the first defined channel.
5 if slope > 10% (5.71°)
3 if slope = 5% to 10%
2 if slope < 5% (2.86°) 2
pH of Soil pH below 6.5 and above 8.5 increases the rate of lead dissolution.
3 if pH < 4 or >10
2 if pH ≥ 4 < 6.5 or > 8.5 ≤ 10
1 if pH 6.5 ≤ pH ≤ 8.5 2
Soil Type/ Erosion
Erosion potential is greatest for fine sands and silt. Clay has the lowest erosion potential. The area where projectiles are deposited should be scored.
2 if soil type is fine sand / silt
1 if soil type is clayey sand or silt / coarse sands
0 if soil type is clay
2
Erosion observed at the projectile deposition area.
5 if there is visual evidence of eroded material being transported from the
projectile deposition area
3 if bullet pockets or other indicators of erosion were observed
1 if no erosion was observed
1
Engineering Controls
The presence of engineering controls or BMPs to modify or control surface water run-on.
Controls may include barriers or diversions that reduce run-on to the range.
0 if no engineering controls
-1 if partial engineering controls
-2 if effective engineering controls -1
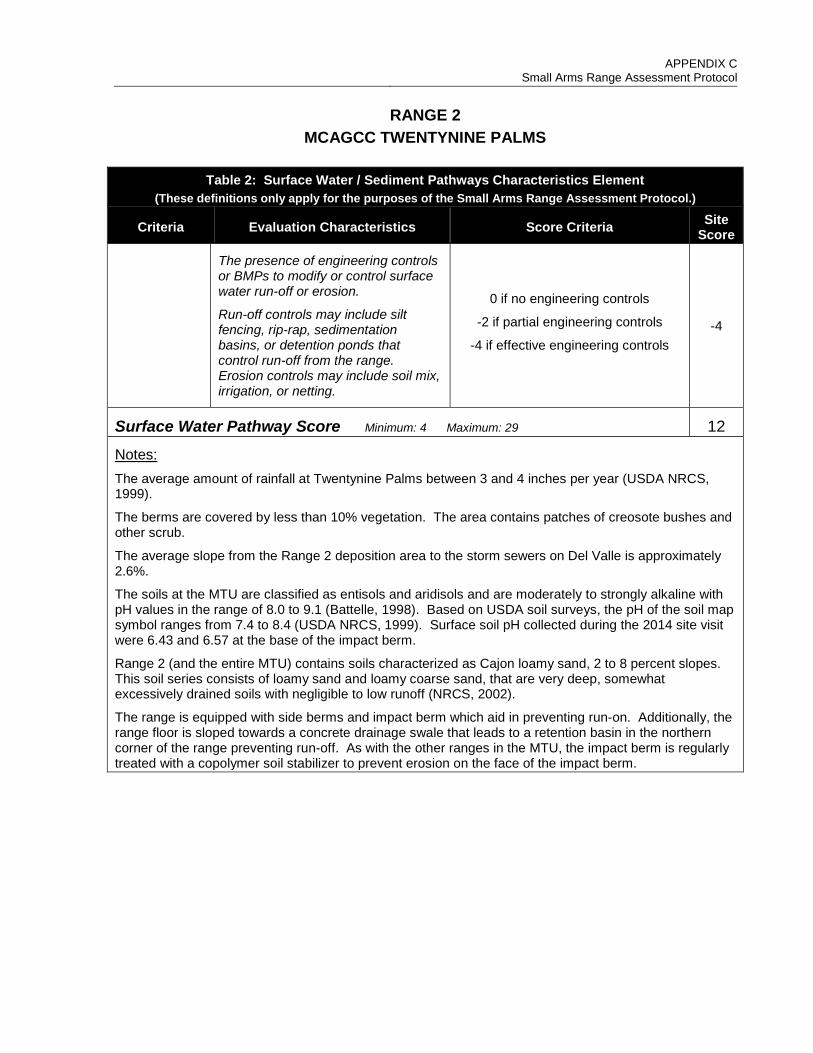
APPENDIX C
Small Arms Range Assessment Protocol
RANGE 2 MCAGCC TWENTYNINE PALMS
Table 2: Surface Water / Sediment Pathways Characteristics Element
(These definitions only apply for the purposes of the Small Arms Range Assessment Protocol.)
Criteria Evaluation Characteristics Score Criteria Site Score
The presence of engineering controls or BMPs to modify or control surface water run-off or erosion.
Run-off controls may include silt fencing, rip-rap, sedimentation basins, or detention ponds that control run-off from the range. Erosion controls may include soil mix, irrigation, or netting.
0 if no engineering controls
-2 if partial engineering controls
-4 if effective engineering controls -4
Surface Water Pathway Score Minimum: 4 Maximum: 29 12
Notes: The average amount of rainfall at Twentynine Palms between 3 and 4 inches per year (USDA NRCS, 1999).
The berms are covered by less than 10% vegetation. The area contains patches of creosote bushes and other scrub.
The average slope from the Range 2 deposition area to the storm sewers on Del Valle is approximately 2.6%.
The soils at the MTU are classified as entisols and aridisols and are moderately to strongly alkaline with pH values in the range of 8.0 to 9.1 (Battelle, 1998). Based on USDA soil surveys, the pH of the soil map symbol ranges from 7.4 to 8.4 (USDA NRCS, 1999). Surface soil pH collected during the 2014 site visit were 6.43 and 6.57 at the base of the impact berm.
Range 2 (and the entire MTU) contains soils characterized as Cajon loamy sand, 2 to 8 percent slopes. This soil series consists of loamy sand and loamy coarse sand, that are very deep, somewhat excessively drained soils with negligible to low runoff (NRCS, 2002).
The range is equipped with side berms and impact berm which aid in preventing run-on. Additionally, the range floor is sloped towards a concrete drainage swale that leads to a retention basin in the northern corner of the range preventing run-off. As with the other ranges in the MTU, the impact berm is regularly treated with a copolymer soil stabilizer to prevent erosion on the face of the impact berm.
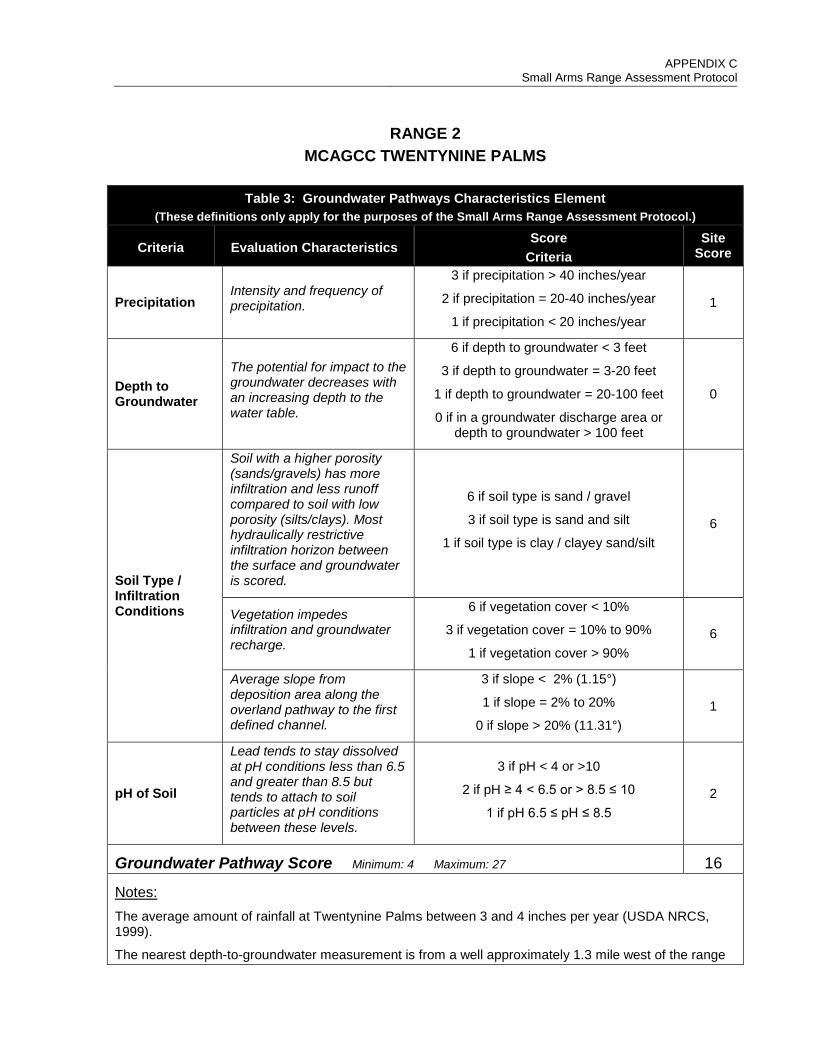
APPENDIX C
Small Arms Range Assessment Protocol
RANGE 2 MCAGCC TWENTYNINE PALMS
Table 3: Groundwater Pathways Characteristics Element
(These definitions only apply for the purposes of the Small Arms Range Assessment Protocol.)
Criteria Evaluation Characteristics Score
Criteria Site
Score
Precipitation Intensity and frequency of precipitation.
3 if precipitation > 40 inches/year
2 if precipitation = 20-40 inches/year
1 if precipitation < 20 inches/year 1
Depth to Groundwater
The potential for impact to the groundwater decreases with an increasing depth to the water table.
6 if depth to groundwater < 3 feet
3 if depth to groundwater = 3-20 feet
1 if depth to groundwater = 20-100 feet
0 if in a groundwater discharge area or depth to groundwater > 100 feet
0
Soil Type / Infiltration Conditions
Soil with a higher porosity (sands/gravels) has more infiltration and less runoff compared to soil with low porosity (silts/clays). Most hydraulically restrictive infiltration horizon between the surface and groundwater is scored.
6 if soil type is sand / gravel
3 if soil type is sand and silt
1 if soil type is clay / clayey sand/silt 6
Vegetation impedes infiltration and groundwater recharge.
6 if vegetation cover < 10%
3 if vegetation cover = 10% to 90%
1 if vegetation cover > 90% 6
Average slope from deposition area along the overland pathway to the first defined channel.
3 if slope < 2% (1.15°)
1 if slope = 2% to 20%
0 if slope > 20% (11.31°) 1
pH of Soil
Lead tends to stay dissolved at pH conditions less than 6.5 and greater than 8.5 but tends to attach to soil particles at pH conditions between these levels.
3 if pH < 4 or >10
2 if pH ≥ 4 < 6.5 or > 8.5 ≤ 10
1 if pH 6.5 ≤ pH ≤ 8.5 2
Groundwater Pathway Score Minimum: 4 Maximum: 27 16
Notes: The average amount of rainfall at Twentynine Palms between 3 and 4 inches per year (USDA NRCS, 1999).
The nearest depth-to-groundwater measurement is from a well approximately 1.3 mile west of the range

APPENDIX C
Small Arms Range Assessment Protocol
RANGE 2 MCAGCC TWENTYNINE PALMS
Table 3: Groundwater Pathways Characteristics Element
(These definitions only apply for the purposes of the Small Arms Range Assessment Protocol.)
Criteria Evaluation Characteristics Score
Criteria Site
Score (IRP Site 16). Depth to groundwater at that point was approximately 400 feet (Battelle 1998).
Range 2 (and the entire MTU) contains soils characterized as Cajon loamy sand, 2 to 8 percent slopes. This soil series consists of loamy sand and loamy coarse sand, that are very deep, somewhat excessively drained soils with negligible to low runoff (NRCS, 2002).
The berms are covered by less than 10% vegetation. The area contains patches of creosote bushes and other scrub.
The average slope from the Range 2 deposition area to the storm sewers on Del Valle is approximately 2.6%.
The soils at the MTU are classified as entisols and aridisols and are moderately to strongly alkaline with pH values in the range of 8.0 to 9.1 (Battelle, 1998). Based on USDA soil surveys, the pH of the soil map symbol ranges from 7.4 to 8.4 (USDA NRCS, 1999). Surface soil pH collected during the 2014 site visit were 6.43 and 6.57 at the base of the impact berm.
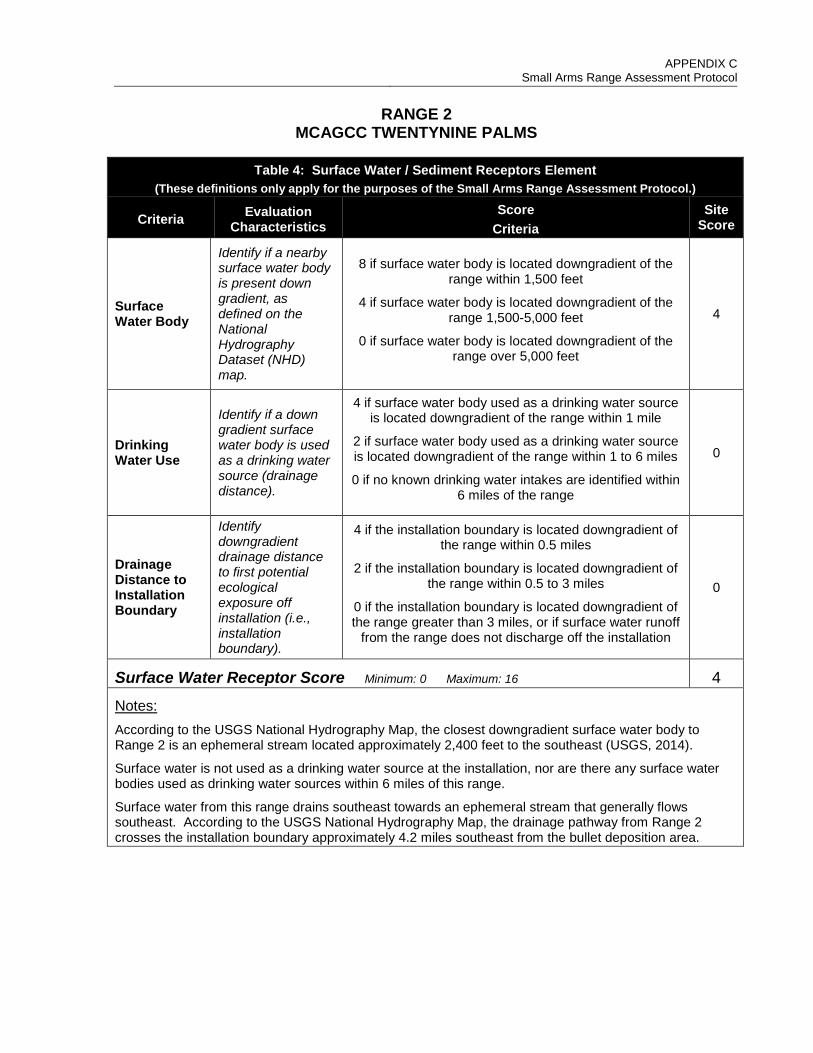
APPENDIX C
Small Arms Range Assessment Protocol
RANGE 2 MCAGCC TWENTYNINE PALMS
Table 4: Surface Water / Sediment Receptors Element
(These definitions only apply for the purposes of the Small Arms Range Assessment Protocol.)
Criteria Evaluation Characteristics
Score Criteria
Site Score
Surface Water Body
Identify if a nearby surface water body is present down gradient, as defined on the National Hydrography Dataset (NHD) map.
8 if surface water body is located downgradient of the range within 1,500 feet
4 if surface water body is located downgradient of the range 1,500-5,000 feet
0 if surface water body is located downgradient of the range over 5,000 feet
4
Drinking Water Use
Identify if a down gradient surface water body is used as a drinking water source (drainage distance).
4 if surface water body used as a drinking water source is located downgradient of the range within 1 mile
2 if surface water body used as a drinking water source is located downgradient of the range within 1 to 6 miles
0 if no known drinking water intakes are identified within 6 miles of the range
0
Drainage Distance to Installation Boundary
Identify downgradient drainage distance to first potential ecological exposure off installation (i.e., installation boundary).
4 if the installation boundary is located downgradient of the range within 0.5 miles
2 if the installation boundary is located downgradient of the range within 0.5 to 3 miles
0 if the installation boundary is located downgradient of the range greater than 3 miles, or if surface water runoff
from the range does not discharge off the installation
0
Surface Water Receptor Score Minimum: 0 Maximum: 16 4
Notes: According to the USGS National Hydrography Map, the closest downgradient surface water body to Range 2 is an ephemeral stream located approximately 2,400 feet to the southeast (USGS, 2014).
Surface water is not used as a drinking water source at the installation, nor are there any surface water bodies used as drinking water sources within 6 miles of this range.
Surface water from this range drains southeast towards an ephemeral stream that generally flows southeast. According to the USGS National Hydrography Map, the drainage pathway from Range 2 crosses the installation boundary approximately 4.2 miles southeast from the bullet deposition area.

APPENDIX C
Small Arms Range Assessment Protocol
RANGE 2 MCAGCC TWENTYNINE PALMS
Table 5: Groundwater Receptors Element
(These definitions only apply for the purposes of the Small Arms Range Assessment Protocol.)
Criteria Evaluation Characteristics
Score Criteria
Site Score
Wells Identified as Potable Water Sources
Number and location of potable water or potable water supply wells relative to the location of the range.
6 if a drinking water well is located within <50 feet of the range
3 if a drinking water well is located downgradient of the range within 50-1,500 feet
0 if there are no drinking water wells located within 1,500 feet downgradient of the range or if
groundwater is not used as a drinking water source.
0
Into what type of aquifer is the well set
6 if unconfined
3 if semi-confined
0 if confined 6
Groundwater wells identified for purpose other than drinking water
Groundwater wells used for purposes other than drinking water supply identified down gradient of the range.
3 if a groundwater well is located within 50 feet of the range
1 if a groundwater well is located downgradient of the range within 50-1,500 feet
0 if groundwater well <1,500 feet downgradient of the range is not used for any purpose.
0
Groundwater Receptor Score Minimum: 0 Maximum: 15 6
Notes: Water supply wells are located in the Surprise Springs groundwater basin, located 10 miles west-northwest of the MTU. All wells draw water from the unconfined portions of the upper and middle aquifers. Surprise Springs is located upgradient of the Mesquite Basin. The Mesquite Basin is not used as a drinking water source because of high mineral content. The known depth to groundwater near the MTU is approximately 400 feet.
There are no known agricultural wells located on the installation. Surface water and stormwater are used for irrigation purposes. Based on soil sampling results from the Small Arms Range Maintenance and Repair Project at MCAGCC Twentynine Palms (Battelle, 1998) and previous Navy studies, the vertical migration of lead in the soil column is between four and eight inches from the soil surface.
While groundwater is likely found at shallow depths near playas, there are no known groundwater discharge locations near the range which could result in lead migration from groundwater to surface water.

APPENDIX C
Small Arms Range Assessment Protocol
RANGE 2 MCAGCC TWENTYNINE PALMS
Table 6: Evaluation Score (These definitions only apply for the purposes of the Small Arms Range Assessment Protocol.)
Surface Water / Sediment
Element Table Score
Range Use and Range Management (Source) 1 13
Surface Water / Sediment Pathways 2 12
Surface Water / Sediment Receptors 4 4
Sum of Surface Water / Sediment Element Scores Minimum: 0 Maximum: 65 29
Groundwater
Element Table Score
Range Use and Range Management (Source) 1 13
Groundwater Pathways 3 16
Groundwater Receptors 5 6
Sum of Groundwater Element Scores Minimum: 0 Maximum: 62 35
Field Sampling and Observed Releases
Surface Water / Sediment
Surface water sampling conducted Yes No Sediment sampling conducted Yes No Results exceed DoD screening value Yes No
Surface Water / Sediment
No Modification High
Groundwater No Modification High
Groundwater Groundwater sampling conducted Yes No Results exceed DoD screening value Yes No
The relative evaluation ranking for each media is determined by selecting the appropriate score based on the data elements for that media:
Evaluation Ranking* Score Range High 45-65 Moderate 33-44 Minimal 0-32
Surface Water Evaluation Ranking Minimal
Groundwater Evaluation Ranking Moderate
Notes:
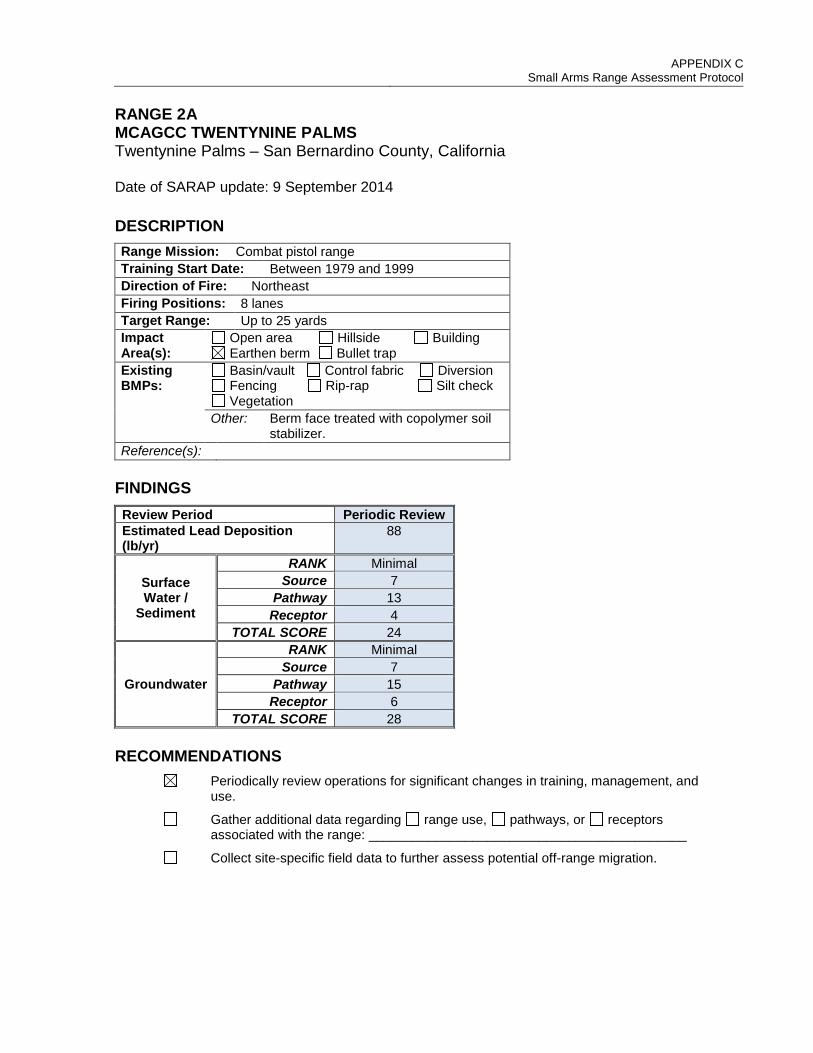
APPENDIX C
Small Arms Range Assessment Protocol RANGE 2A MCAGCC TWENTYNINE PALMS Twentynine Palms – San Bernardino County, California Date of SARAP update: 9 September 2014
DESCRIPTION Range Mission: Combat pistol range Training Start Date: Between 1979 and 1999 Direction of Fire: Northeast Firing Positions: 8 lanes Target Range: Up to 25 yards Impact Area(s):
Open area Hillside Building Earthen berm Bullet trap
Existing BMPs:
Basin/vault Control fabric Diversion Fencing Rip-rap Silt check Vegetation
Other: Berm face treated with copolymer soil stabilizer.
Reference(s): FINDINGS Review Period Periodic Review Estimated Lead Deposition (lb/yr)
88
Surface Water /
Sediment
RANK Minimal Source 7
Pathway 13 Receptor 4
TOTAL SCORE 24
Groundwater
RANK Minimal Source 7
Pathway 15 Receptor 6
TOTAL SCORE 28 RECOMMENDATIONS
Periodically review operations for significant changes in training, management, and use.
Gather additional data regarding range use, pathways, or receptors associated with the range: ___________________________________________
Collect site-specific field data to further assess potential off-range migration.
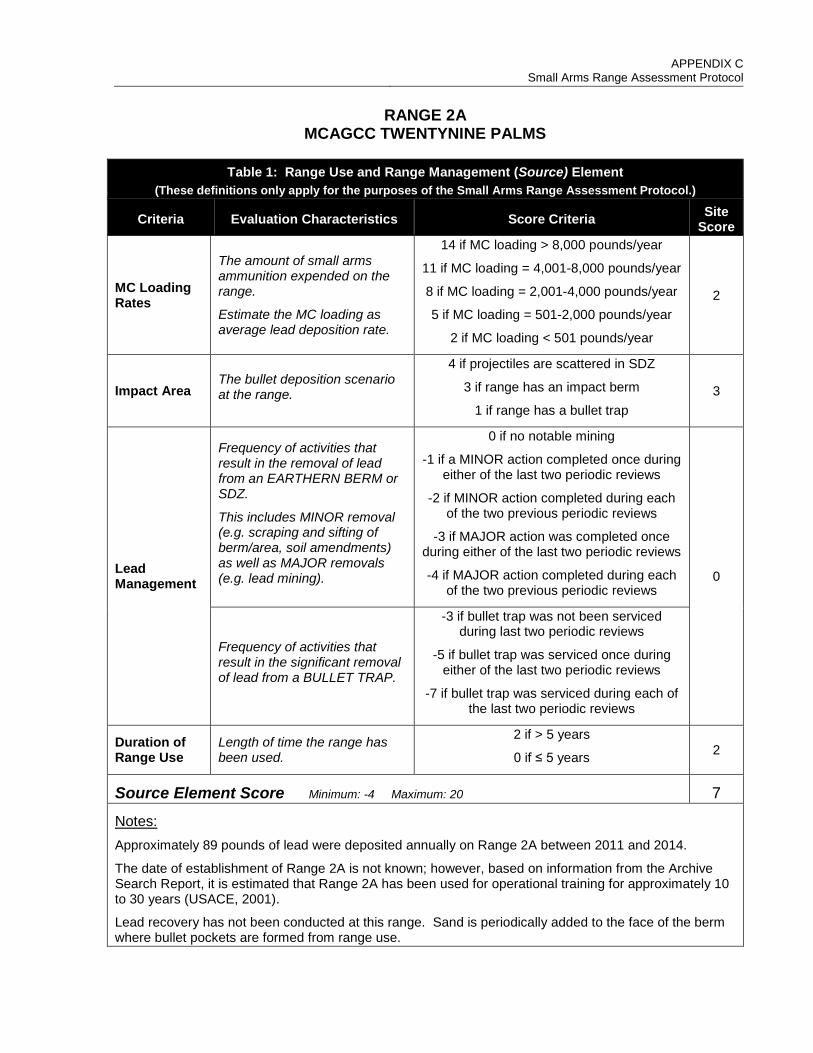
APPENDIX C
Small Arms Range Assessment Protocol
RANGE 2A MCAGCC TWENTYNINE PALMS
Table 1: Range Use and Range Management (Source) Element
(These definitions only apply for the purposes of the Small Arms Range Assessment Protocol.)
Criteria Evaluation Characteristics Score Criteria Site Score
MC Loading Rates
The amount of small arms ammunition expended on the range.
Estimate the MC loading as average lead deposition rate.
14 if MC loading > 8,000 pounds/year
11 if MC loading = 4,001-8,000 pounds/year
8 if MC loading = 2,001-4,000 pounds/year
5 if MC loading = 501-2,000 pounds/year
2 if MC loading < 501 pounds/year
2
Impact Area The bullet deposition scenario at the range.
4 if projectiles are scattered in SDZ
3 if range has an impact berm
1 if range has a bullet trap 3
Lead Management
Frequency of activities that result in the removal of lead from an EARTHERN BERM or SDZ.
This includes MINOR removal (e.g. scraping and sifting of berm/area, soil amendments) as well as MAJOR removals (e.g. lead mining).
0 if no notable mining
-1 if a MINOR action completed once during either of the last two periodic reviews
-2 if MINOR action completed during each of the two previous periodic reviews
-3 if MAJOR action was completed once during either of the last two periodic reviews
-4 if MAJOR action completed during each of the two previous periodic reviews
0
Frequency of activities that result in the significant removal of lead from a BULLET TRAP.
-3 if bullet trap was not been serviced during last two periodic reviews
-5 if bullet trap was serviced once during either of the last two periodic reviews
-7 if bullet trap was serviced during each of the last two periodic reviews
Duration of Range Use
Length of time the range has been used.
2 if > 5 years
0 if ≤ 5 years 2
Source Element Score Minimum: -4 Maximum: 20 7
Notes: Approximately 89 pounds of lead were deposited annually on Range 2A between 2011 and 2014.
The date of establishment of Range 2A is not known; however, based on information from the Archive Search Report, it is estimated that Range 2A has been used for operational training for approximately 10 to 30 years (USACE, 2001).
Lead recovery has not been conducted at this range. Sand is periodically added to the face of the berm where bullet pockets are formed from range use.
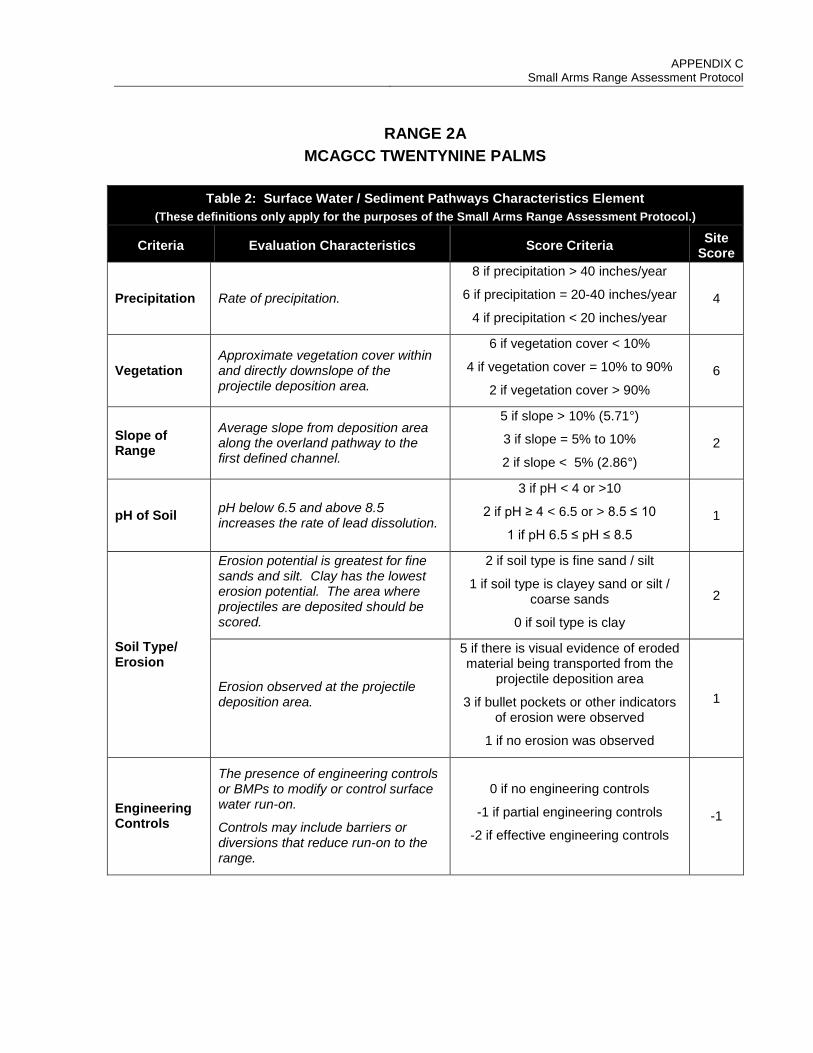
APPENDIX C
Small Arms Range Assessment Protocol
RANGE 2A MCAGCC TWENTYNINE PALMS
Table 2: Surface Water / Sediment Pathways Characteristics Element
(These definitions only apply for the purposes of the Small Arms Range Assessment Protocol.)
Criteria Evaluation Characteristics Score Criteria Site Score
Precipitation Rate of precipitation.
8 if precipitation > 40 inches/year
6 if precipitation = 20-40 inches/year
4 if precipitation < 20 inches/year 4
Vegetation Approximate vegetation cover within and directly downslope of the projectile deposition area.
6 if vegetation cover < 10%
4 if vegetation cover = 10% to 90%
2 if vegetation cover > 90% 6
Slope of Range
Average slope from deposition area along the overland pathway to the first defined channel.
5 if slope > 10% (5.71°)
3 if slope = 5% to 10%
2 if slope < 5% (2.86°) 2
pH of Soil pH below 6.5 and above 8.5 increases the rate of lead dissolution.
3 if pH < 4 or >10
2 if pH ≥ 4 < 6.5 or > 8.5 ≤ 10
1 if pH 6.5 ≤ pH ≤ 8.5 1
Soil Type/ Erosion
Erosion potential is greatest for fine sands and silt. Clay has the lowest erosion potential. The area where projectiles are deposited should be scored.
2 if soil type is fine sand / silt
1 if soil type is clayey sand or silt / coarse sands
0 if soil type is clay
2
Erosion observed at the projectile deposition area.
5 if there is visual evidence of eroded material being transported from the
projectile deposition area
3 if bullet pockets or other indicators of erosion were observed
1 if no erosion was observed
1
Engineering Controls
The presence of engineering controls or BMPs to modify or control surface water run-on.
Controls may include barriers or diversions that reduce run-on to the range.
0 if no engineering controls
-1 if partial engineering controls
-2 if effective engineering controls -1

APPENDIX C
Small Arms Range Assessment Protocol
RANGE 2A MCAGCC TWENTYNINE PALMS
Table 2: Surface Water / Sediment Pathways Characteristics Element
(These definitions only apply for the purposes of the Small Arms Range Assessment Protocol.)
Criteria Evaluation Characteristics Score Criteria Site Score
The presence of engineering controls or BMPs to modify or control surface water run-off or erosion.
Run-off controls may include silt fencing, rip-rap, sedimentation basins, or detention ponds that control run-off from the range. Erosion controls may include soil mix, irrigation, or netting.
0 if no engineering controls
-2 if partial engineering controls
-4 if effective engineering controls -2
Surface Water Pathway Score Minimum: 4 Maximum: 29 13
Notes: The average amount of rainfall at Twentynine Palms between 3 and 4 inches per year (USDA NRCS, 1999).
The berms are covered by less than 10% vegetation. The area contains patches of creosote bushes and other scrub.
The average slope from the Range 2A deposition area to the storm sewers on Del Valle is approximately 4.7%.
The soils at the MTU are classified as entisols and aridisols and are moderately to strongly alkaline with pH values in the range of 8.0 to 9.1 (Battelle, 1998). Based on USDA soil surveys, pH ranges from 7.4 to 8.4 (USDA NRCS, 1999). Surface soil pH readings collected during the 2014 site visit at the adjacent Range 3 were 7.31 in the berm and 7.98 in the range drainage pathway.
Range 2A (and the entire MTU) contains soils characterized as Cajon loamy sand, 2 to 8 percent slopes. This soil series consists of loamy sand and loamy coarse sands, that are very deep, somewhat excessively drained soils with negligible to low runoff (NRCS, 2002).
A protective berm is present behind the rear impact berm as well as along the northern side of the range to prevent run-on of surface water from the higher elevations to the north. The face of the impact berm is treated with a copolymer soil stabilizer to prevent erosion of the berm.
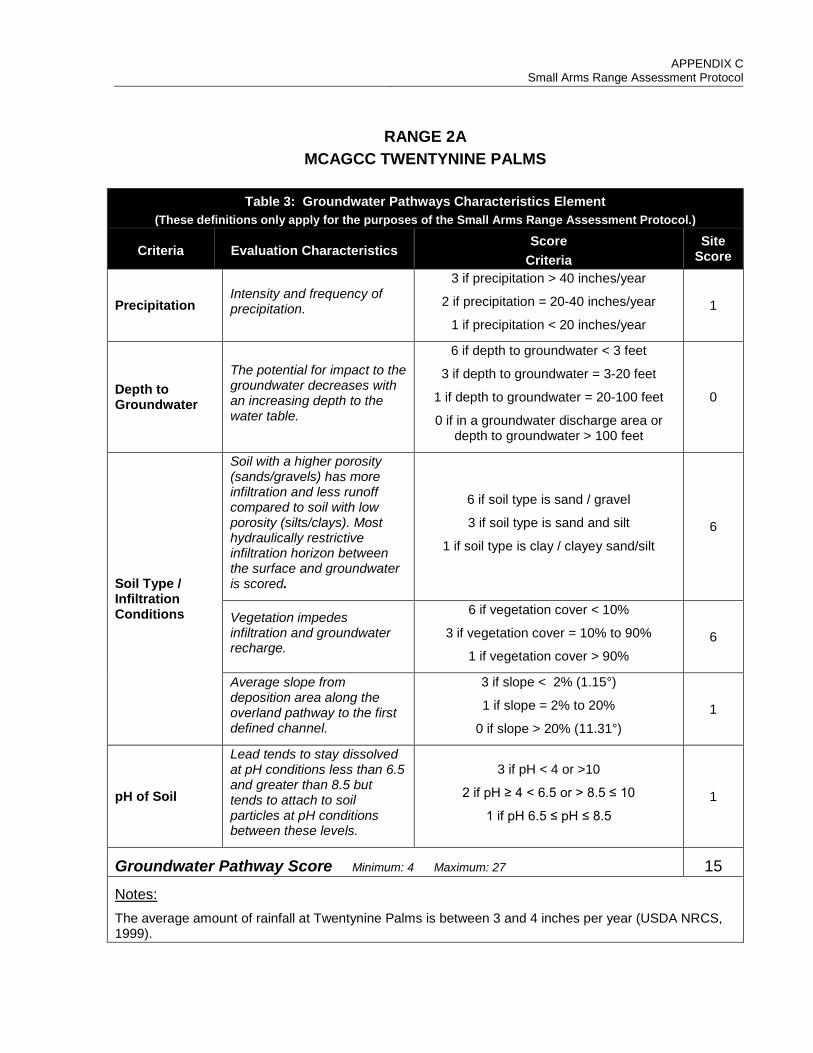
APPENDIX C
Small Arms Range Assessment Protocol
RANGE 2A MCAGCC TWENTYNINE PALMS
Table 3: Groundwater Pathways Characteristics Element
(These definitions only apply for the purposes of the Small Arms Range Assessment Protocol.)
Criteria Evaluation Characteristics Score
Criteria Site
Score
Precipitation Intensity and frequency of precipitation.
3 if precipitation > 40 inches/year
2 if precipitation = 20-40 inches/year
1 if precipitation < 20 inches/year 1
Depth to Groundwater
The potential for impact to the groundwater decreases with an increasing depth to the water table.
6 if depth to groundwater < 3 feet
3 if depth to groundwater = 3-20 feet
1 if depth to groundwater = 20-100 feet
0 if in a groundwater discharge area or depth to groundwater > 100 feet
0
Soil Type / Infiltration Conditions
Soil with a higher porosity (sands/gravels) has more infiltration and less runoff compared to soil with low porosity (silts/clays). Most hydraulically restrictive infiltration horizon between the surface and groundwater is scored.
6 if soil type is sand / gravel
3 if soil type is sand and silt
1 if soil type is clay / clayey sand/silt 6
Vegetation impedes infiltration and groundwater recharge.
6 if vegetation cover < 10%
3 if vegetation cover = 10% to 90%
1 if vegetation cover > 90% 6
Average slope from deposition area along the overland pathway to the first defined channel.
3 if slope < 2% (1.15°)
1 if slope = 2% to 20%
0 if slope > 20% (11.31°) 1
pH of Soil
Lead tends to stay dissolved at pH conditions less than 6.5 and greater than 8.5 but tends to attach to soil particles at pH conditions between these levels.
3 if pH < 4 or >10
2 if pH ≥ 4 < 6.5 or > 8.5 ≤ 10
1 if pH 6.5 ≤ pH ≤ 8.5 1
Groundwater Pathway Score Minimum: 4 Maximum: 27 15
Notes: The average amount of rainfall at Twentynine Palms is between 3 and 4 inches per year (USDA NRCS, 1999).
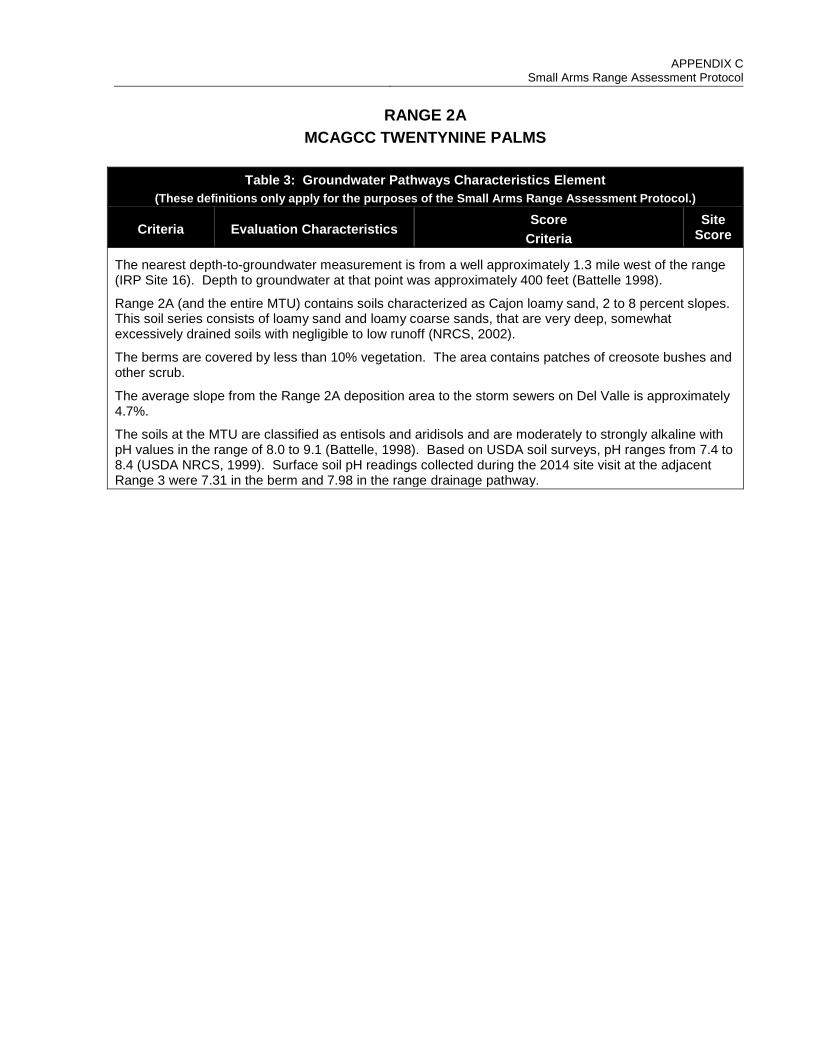
APPENDIX C
Small Arms Range Assessment Protocol
RANGE 2A MCAGCC TWENTYNINE PALMS
Table 3: Groundwater Pathways Characteristics Element
(These definitions only apply for the purposes of the Small Arms Range Assessment Protocol.)
Criteria Evaluation Characteristics Score
Criteria Site
Score
The nearest depth-to-groundwater measurement is from a well approximately 1.3 mile west of the range (IRP Site 16). Depth to groundwater at that point was approximately 400 feet (Battelle 1998).
Range 2A (and the entire MTU) contains soils characterized as Cajon loamy sand, 2 to 8 percent slopes. This soil series consists of loamy sand and loamy coarse sands, that are very deep, somewhat excessively drained soils with negligible to low runoff (NRCS, 2002).
The berms are covered by less than 10% vegetation. The area contains patches of creosote bushes and other scrub.
The average slope from the Range 2A deposition area to the storm sewers on Del Valle is approximately 4.7%.
The soils at the MTU are classified as entisols and aridisols and are moderately to strongly alkaline with pH values in the range of 8.0 to 9.1 (Battelle, 1998). Based on USDA soil surveys, pH ranges from 7.4 to 8.4 (USDA NRCS, 1999). Surface soil pH readings collected during the 2014 site visit at the adjacent Range 3 were 7.31 in the berm and 7.98 in the range drainage pathway.

APPENDIX C
Small Arms Range Assessment Protocol
RANGE 2A MCAGCC TWENTYNINE PALMS
Table 4: Surface Water / Sediment Receptors Element
(These definitions only apply for the purposes of the Small Arms Range Assessment Protocol.)
Criteria Evaluation Characteristics
Score Criteria
Site Score
Surface Water Body
Identify if a nearby surface water body is present down gradient, as defined on the National Hydrography Dataset (NHD) map.
8 if surface water body is located downgradient of the range within 1,500 feet
4 if surface water body is located downgradient of the range 1,500-5,000 feet
0 if surface water body is located downgradient of the range over 5,000 feet
4
Drinking Water Use
Identify if a down gradient surface water body is used as a drinking water source (drainage distance).
4 if surface water body used as a drinking water source is located downgradient of the range within 1 mile
2 if surface water body used as a drinking water source is located downgradient of the range within 1 to 6 miles
0 if no known drinking water intakes are identified within 6 miles of the range
0
Drainage Distance to Installation Boundary
Identify downgradient drainage distance to first potential ecological exposure off installation (i.e., installation boundary).
4 if the installation boundary is located downgradient of the range within 0.5 miles
2 if the installation boundary is located downgradient of the range within 0.5 to 3 miles
0 if the installation boundary is located downgradient of the range greater than 3 miles, or if surface water runoff
from the range does not discharge off the installation
0
Surface Water Receptor Score Minimum: 0 Maximum: 16 4
Notes: According to the USGS National Hydrography Map, the closest downgradient surface water body to Range 2A is an ephemeral stream located approximately 3,500 feet to the northwest (USGS, 2014).
Surface water is not used as a drinking water source at the installation, nor are there any surface water bodies used as drinking water sources within 6 miles of this range.
Surface water from this range drains northwest towards an ephemeral stream that generally flows southwest. According to the USGS National Hydrography Map, the ephemeral stream terminates at the installation golf course approximately 2.1 miles from the bullet deposition area. From this point, the installation boundary is approximately 1 mile downgradient.

APPENDIX C
Small Arms Range Assessment Protocol
RANGE 2A MCAGCC TWENTYNINE PALMS
Table 5: Groundwater Receptors Element
(These definitions only apply for the purposes of the Small Arms Range Assessment Protocol.)
Criteria Evaluation Characteristics
Score Criteria
Site Score
Wells Identified as Potable Water Sources
Number and location of potable water or potable water supply wells relative to the location of the range.
6 if a drinking water well is located within <50 feet of the range
3 if a drinking water well is located downgradient of the range within 50-1,500 feet
0 if there are no drinking water wells located within 1,500 feet downgradient of the range or if
groundwater is not used as a drinking water source.
0
Into what type of aquifer is the well set
6 if unconfined
3 if semi-confined
0 if confined 6
Groundwater wells identified for purpose other than drinking water
Groundwater wells used for purposes other than drinking water supply identified down gradient of the range.
3 if a groundwater well is located within 50 feet of the range
1 if a groundwater well is located downgradient of the range within 50-1,500 feet
0 if groundwater well <1,500 feet downgradient of the range is not used for any purpose.
0
Groundwater Receptor Score Minimum: 0 Maximum: 15 6
Notes: Water supply wells are located in the Surprise Springs groundwater basin, located 10 miles west-northwest of the MTU. All wells draw water from the unconfined portions of the upper and middle aquifers. Surprise Springs is located upgradient of the Mesquite Basin. The Mesquite Basin is not used as a drinking water source because of high mineral content. The known depth to groundwater near the MTU is approximately 400 feet.
There are no known agricultural wells located on the installation. Surface water and stormwater are used for irrigation purposes. Based on soil sampling results from the Small Arms Range Maintenance and Repair Project at MCAGCC Twentynine Palms (Battelle, 1998) and previous Navy studies, the vertical migration of lead in the soil column is between four and eight inches from the soil surface.
While groundwater is likely found at shallow depths near playas, there are no known groundwater discharge locations near the range which could result in lead migration from groundwater to surface water.

APPENDIX C
Small Arms Range Assessment Protocol
RANGE 2A MCAGCC TWENTYNINE PALMS
Table 6: Evaluation Score (These definitions only apply for the purposes of the Small Arms Range Assessment Protocol.)
Surface Water / Sediment
Element Table Score
Range Use and Range Management (Source) 1 7
Surface Water / Sediment Pathways 2 13
Surface Water / Sediment Receptors 4 4
Sum of Surface Water / Sediment Element Scores Minimum: 0 Maximum: 65 24
Groundwater
Element Table Score
Range Use and Range Management (Source) 1 7
Groundwater Pathways 3 15
Groundwater Receptors 5 6
Sum of Groundwater Element Scores Minimum: 0 Maximum: 62 28
Field Sampling and Observed Releases
Surface Water / Sediment
Surface water sampling conducted Yes No Sediment sampling conducted Yes No Results exceed DoD screening value Yes No
Surface Water / Sediment
No Modification High
Groundwater No Modification High
Groundwater Groundwater sampling conducted Yes No Results exceed DoD screening value Yes No
The relative evaluation ranking for each media is determined by selecting the appropriate score based on the data elements for that media:
Evaluation Ranking* Score Range High 45-65 Moderate 33-44 Minimal 0-32
Surface Water Evaluation Ranking Minimal
Groundwater Evaluation Ranking Minimal
Notes:
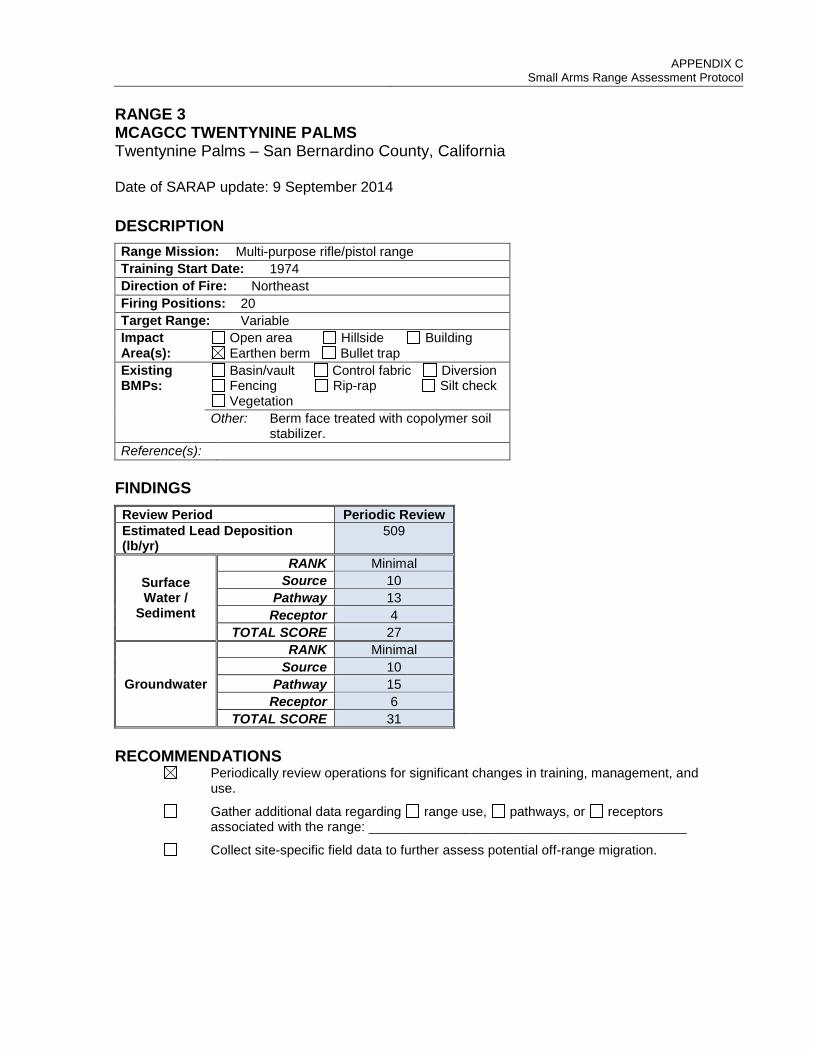
APPENDIX C
Small Arms Range Assessment Protocol RANGE 3 MCAGCC TWENTYNINE PALMS Twentynine Palms – San Bernardino County, California Date of SARAP update: 9 September 2014
DESCRIPTION Range Mission: Multi-purpose rifle/pistol range Training Start Date: 1974 Direction of Fire: Northeast Firing Positions: 20 Target Range: Variable Impact Area(s):
Open area Hillside Building Earthen berm Bullet trap
Existing BMPs:
Basin/vault Control fabric Diversion Fencing Rip-rap Silt check Vegetation
Other: Berm face treated with copolymer soil stabilizer.
Reference(s): FINDINGS Review Period Periodic Review Estimated Lead Deposition (lb/yr)
509
Surface Water /
Sediment
RANK Minimal Source 10
Pathway 13 Receptor 4
TOTAL SCORE 27
Groundwater
RANK Minimal Source 10
Pathway 15 Receptor 6
TOTAL SCORE 31 RECOMMENDATIONS
Periodically review operations for significant changes in training, management, and use.
Gather additional data regarding range use, pathways, or receptors associated with the range: ___________________________________________
Collect site-specific field data to further assess potential off-range migration.

APPENDIX C
Small Arms Range Assessment Protocol
RANGE 3 MCAGCC TWENTYNINE PALMS
Table 1: Range Use and Range Management (Source) Element
(These definitions only apply for the purposes of the Small Arms Range Assessment Protocol.)
Criteria Evaluation Characteristics Score Criteria Site Score
MC Loading Rates
The amount of small arms ammunition expended on the range.
Estimate the MC loading as average lead deposition rate.
14 if MC loading > 8,000 pounds/year
11 if MC loading = 4,001-8,000 pounds/year
8 if MC loading = 2,001-4,000 pounds/year
5 if MC loading = 501-2,000 pounds/year
2 if MC loading < 501 pounds/year
5
Impact Area The bullet deposition scenario at the range.
4 if projectiles are scattered in SDZ
3 if range has an impact berm
1 if range has a bullet trap 3
Lead Management
Frequency of activities that result in the removal of lead from an EARTHERN BERM or SDZ.
This includes MINOR removal (e.g. scraping and sifting of berm/area, soil amendments) as well as MAJOR removals (e.g. lead mining).
0 if no notable mining
-1 if a MINOR action completed once during either of the last two periodic reviews
-2 if MINOR action completed during each of the two previous periodic reviews
-3 if MAJOR action was completed once during either of the last two periodic reviews
-4 if MAJOR action completed during each of the two previous periodic reviews
0
Frequency of activities that result in the significant removal of lead from a BULLET TRAP.
-3 if bullet trap was not been serviced during last two periodic reviews
-5 if bullet trap was serviced once during either of the last two periodic reviews
-7 if bullet trap was serviced during each of the last two periodic reviews
Duration of Range Use
Length of time the range has been used.
2 if > 5 years
0 if ≤ 5 years 2
Source Element Score Minimum: -4 Maximum: 20 10
Notes: Approximately 509 pounds of lead are deposited annually on Range 3 between 2011 and 2014.
Range 3 has been used for operational training since 1974 (USACE, 2001).
According to Range Control personnel, the bullet trap at Range 3 was removed in 2013.

APPENDIX C
Small Arms Range Assessment Protocol
RANGE 3 MCAGCC TWENTYNINE PALMS
Table 2: Surface Water / Sediment Pathways Characteristics Element
(These definitions only apply for the purposes of the Small Arms Range Assessment Protocol.)
Criteria Evaluation Characteristics Score Criteria Site Score
Precipitation Rate of precipitation.
8 if precipitation > 40 inches/year
6 if precipitation = 20-40 inches/year
4 if precipitation < 20 inches/year 4
Vegetation Approximate vegetation cover within and directly downslope of the projectile deposition area.
6 if vegetation cover < 10%
4 if vegetation cover = 10% to 90%
2 if vegetation cover > 90% 6
Slope of Range
Average slope from deposition area along the overland pathway to the first defined channel.
5 if slope > 10% (5.71°)
3 if slope = 5% to 10%
2 if slope < 5% (2.86°) 2
pH of Soil pH below 6.5 and above 8.5 increases the rate of lead dissolution.
3 if pH < 4 or >10
2 if pH ≥ 4 < 6.5 or > 8.5 ≤ 10
1 if pH 6.5 ≤ pH ≤ 8.5 1
Soil Type/ Erosion
Erosion potential is greatest for fine sands and silt. Clay has the lowest erosion potential. The area where projectiles are deposited should be scored.
2 if soil type is fine sand / silt
1 if soil type is clayey sand or silt / coarse sands
0 if soil type is clay
2
Erosion observed at the projectile deposition area.
5 if there is visual evidence of eroded material being transported from the
projectile deposition area
3 if bullet pockets or other indicators of erosion were observed
1 if no erosion was observed
1
Engineering Controls
The presence of engineering controls or BMPs to modify or control surface water run-on.
Controls may include barriers or diversions that reduce run-on to the range.
0 if no engineering controls
-1 if partial engineering controls
-2 if effective engineering controls -1

APPENDIX C
Small Arms Range Assessment Protocol
RANGE 3 MCAGCC TWENTYNINE PALMS
Table 2: Surface Water / Sediment Pathways Characteristics Element
(These definitions only apply for the purposes of the Small Arms Range Assessment Protocol.)
Criteria Evaluation Characteristics Score Criteria Site Score
The presence of engineering controls or BMPs to modify or control surface water run-off or erosion.
Run-off controls may include silt fencing, rip-rap, sedimentation basins, or detention ponds that control run-off from the range. Erosion controls may include soil mix, irrigation, or netting.
0 if no engineering controls
-2 if partial engineering controls
-4 if effective engineering controls -2
Surface Water Pathway Score Minimum: 4 Maximum: 29 13
Notes: The average amount of rainfall at Twentynine Palms is between 3 and 4 inches per year (USDA NRCS, 1999).
The berms are covered by less than 10% vegetation. The area contains patches of creosote bushes and other scrub.
The average slope from the Range 3 deposition area to the storm sewers on Del Valle is approximately 4.7%.
The soils at the MTU are classified as entisols and aridisols and are moderately to strongly alkaline with pH values in the range of 8.0 to 9.1 (Battelle, 1998). Based on USDA soil surveys, pH ranges from 7.4 to 8.4 (USDA NRCS, 1999). Surface soil pH readings collected during the 2014 site visit were 7.31 in the berm and 7.98 in the range drainage pathway.
Range 3 (and the entire MTU) contains soils characterized as Cajon loamy sand, 2 to 8 percent slopes. This soil series consists of loamy sands and loamy coarse sands, that are very deep, somewhat excessively drained soils with negligible to low runoff (NRCS, 2002).
The face of the impact berm is treated with a copolymer soil stabilizer to prevent erosion of the berm. The range is also equipped with side berms to prevent surface water run-on.

APPENDIX C
Small Arms Range Assessment Protocol
RANGE 3
MCAGCC TWENTYNINE PALMS
Table 3: Groundwater Pathways Characteristics Element (These definitions only apply for the purposes of the Small Arms Range Assessment Protocol.)
Criteria Evaluation Characteristics Score
Criteria Site
Score
Precipitation Intensity and frequency of precipitation.
3 if precipitation > 40 inches/year
2 if precipitation = 20-40 inches/year
1 if precipitation < 20 inches/year 1
Depth to Groundwater
The potential for impact to the groundwater decreases with an increasing depth to the water table.
6 if depth to groundwater < 3 feet
3 if depth to groundwater = 3-20 feet
1 if depth to groundwater = 20-100 feet
0 if in a groundwater discharge area or depth to groundwater > 100 feet
0
Soil Type / Infiltration Conditions
Soil with a higher porosity (sands/gravels) has more infiltration and less runoff compared to soil with low porosity (silts/clays). Most hydraulically restrictive infiltration horizon between the surface and groundwater is scored.
6 if soil type is sand / gravel
3 if soil type is sand and silt
1 if soil type is clay / clayey sand/silt 6
Vegetation impedes infiltration and groundwater recharge.
6 if vegetation cover < 10%
3 if vegetation cover = 10% to 90%
1 if vegetation cover > 90% 6
Average slope from deposition area along the overland pathway to the first defined channel.
3 if slope < 2% (1.15°)
1 if slope = 2% to 20%
0 if slope > 20% (11.31°) 1
pH of Soil
Lead tends to stay dissolved at pH conditions less than 6.5 and greater than 8.5 but tends to attach to soil particles at pH conditions between these levels.
3 if pH < 4 or >10
2 if pH ≥ 4 < 6.5 or > 8.5 ≤ 10
1 if pH 6.5 ≤ pH ≤ 8.5 1
Groundwater Pathway Score Minimum: 4 Maximum: 27 15
Notes: The average amount of rainfall at Twentynine Palms is between 3 and 4 inches per year (USDA NRCS, 1999).
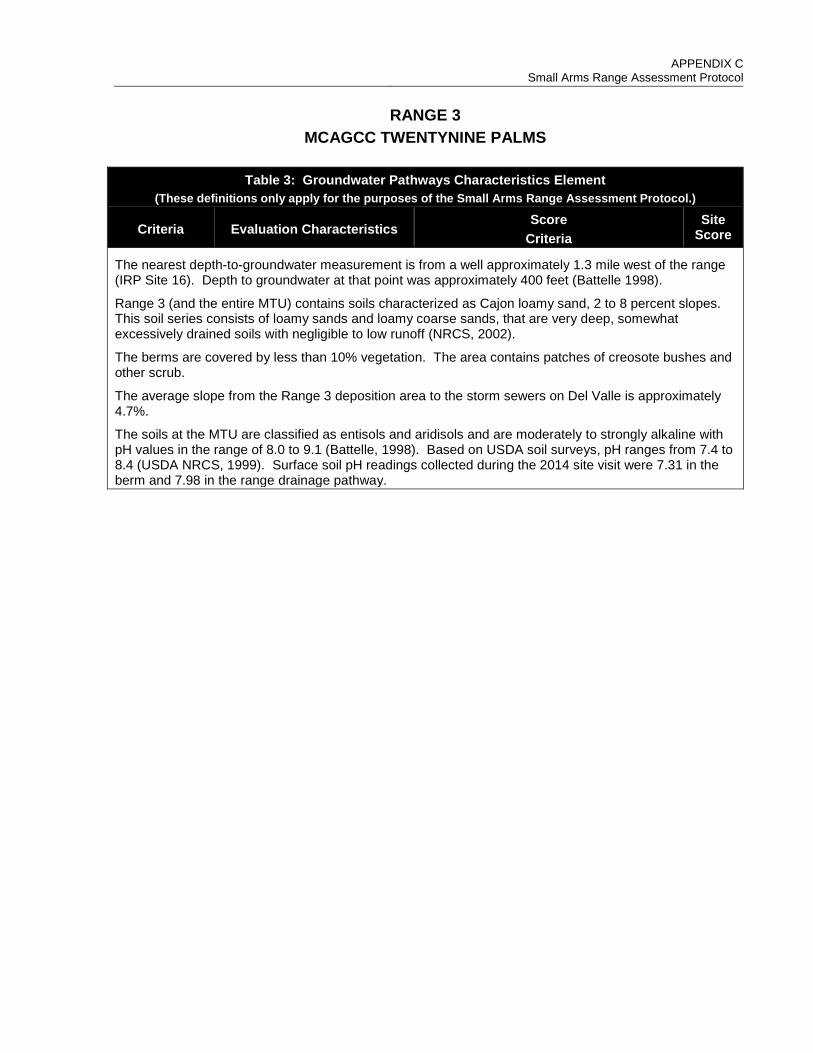
APPENDIX C
Small Arms Range Assessment Protocol
RANGE 3 MCAGCC TWENTYNINE PALMS
Table 3: Groundwater Pathways Characteristics Element
(These definitions only apply for the purposes of the Small Arms Range Assessment Protocol.)
Criteria Evaluation Characteristics Score
Criteria Site
Score
The nearest depth-to-groundwater measurement is from a well approximately 1.3 mile west of the range (IRP Site 16). Depth to groundwater at that point was approximately 400 feet (Battelle 1998).
Range 3 (and the entire MTU) contains soils characterized as Cajon loamy sand, 2 to 8 percent slopes. This soil series consists of loamy sands and loamy coarse sands, that are very deep, somewhat excessively drained soils with negligible to low runoff (NRCS, 2002).
The berms are covered by less than 10% vegetation. The area contains patches of creosote bushes and other scrub.
The average slope from the Range 3 deposition area to the storm sewers on Del Valle is approximately 4.7%.
The soils at the MTU are classified as entisols and aridisols and are moderately to strongly alkaline with pH values in the range of 8.0 to 9.1 (Battelle, 1998). Based on USDA soil surveys, pH ranges from 7.4 to 8.4 (USDA NRCS, 1999). Surface soil pH readings collected during the 2014 site visit were 7.31 in the berm and 7.98 in the range drainage pathway.

APPENDIX C
Small Arms Range Assessment Protocol
RANGE 3 MCAGCC TWENTYNINE PALMS
Table 4: Surface Water / Sediment Receptors Element
(These definitions only apply for the purposes of the Small Arms Range Assessment Protocol.)
Criteria Evaluation Characteristics
Score Criteria
Site Score
Surface Water Body
Identify if a nearby surface water body is present down gradient, as defined on the National Hydrography Dataset (NHD) map.
8 if surface water body is located downgradient of the range within 1,500 feet
4 if surface water body is located downgradient of the range 1,500-5,000 feet
0 if surface water body is located downgradient of the range over 5,000 feet
4
Drinking Water Use
Identify if a down gradient surface water body is used as a drinking water source (drainage distance).
4 if surface water body used as a drinking water source is located downgradient of the range within 1 mile
2 if surface water body used as a drinking water source is located downgradient of the range within 1 to 6 miles
0 if no known drinking water intakes are identified within 6 miles of the range
0
Drainage Distance to Installation Boundary
Identify downgradient drainage distance to first potential ecological exposure off installation (i.e., installation boundary).
4 if the installation boundary is located downgradient of the range within 0.5 miles
2 if the installation boundary is located downgradient of the range within 0.5 to 3 miles
0 if the installation boundary is located downgradient of the range greater than 3 miles, or if surface water runoff
from the range does not discharge off the installation
0
Surface Water Receptor Score Minimum: 0 Maximum: 16 4
Notes: According to the USGS National Hydrography Map, the closest downgradient surface water body to Range 3 is an ephemeral stream located approximately 3,600 feet to the northwest (USGS, 2014).
Surface water is not used as a drinking water source at the installation, nor are there any surface water bodies used as drinking water sources within 6 miles of this range.
Surface water from this range drains northwest towards an ephemeral stream that generally flows southwest. According to the USGS National Hydrography Map, the ephemeral stream terminates at the installation golf course approximately 2.2 miles from the bullet deposition area. From this point, the installation boundary is approximately 1 mile downgradient.

APPENDIX C
Small Arms Range Assessment Protocol
RANGE 3 MCAGCC TWENTYNINE PALMS
Table 5: Groundwater Receptors Element
(These definitions only apply for the purposes of the Small Arms Range Assessment Protocol.)
Criteria Evaluation Characteristics
Score Criteria
Site Score
Wells Identified as Potable Water Sources
Number and location of potable water or potable water supply wells relative to the location of the range.
6 if a drinking water well is located within <50 feet of the range
3 if a drinking water well is located downgradient of the range within 50-1,500 feet
0 if there are no drinking water wells located within 1,500 feet downgradient of the range or if
groundwater is not used as a drinking water source.
0
Into what type of aquifer is the well set
6 if unconfined
3 if semi-confined
0 if confined 6
Groundwater wells identified for purpose other than drinking water
Groundwater wells used for purposes other than drinking water supply identified down gradient of the range.
3 if a groundwater well is located within 50 feet of the range
1 if a groundwater well is located downgradient of the range within 50-1,500 feet
0 if groundwater well <1,500 feet downgradient of the range is not used for any purpose.
0
Groundwater Receptor Score Minimum: 0 Maximum: 15 6
Notes: Water supply wells are located in the Surprise Springs groundwater basin, located 10 miles west-northwest of the MTU. All wells draw water from the unconfined portions of the upper and middle aquifers. Surprise Springs is located upgradient of the Mesquite Basin. The Mesquite Basin is not used as a drinking water source because of high mineral content. The known depth to groundwater near the MTU is approximately 400 feet.
There are no known agricultural wells located on the installation. Surface water and stormwater are used for irrigation purposes. Based on soil sampling results from the Small Arms Range Maintenance and Repair Project at MCAGCC Twentynine Palms (Battelle, 1998) and previous Navy studies, the vertical migration of lead in the soil column is between four and eight inches from the soil surface.
While groundwater is likely found at shallow depths near playas, there are no known groundwater discharge locations near the range which could result in lead migration from groundwater to surface water.
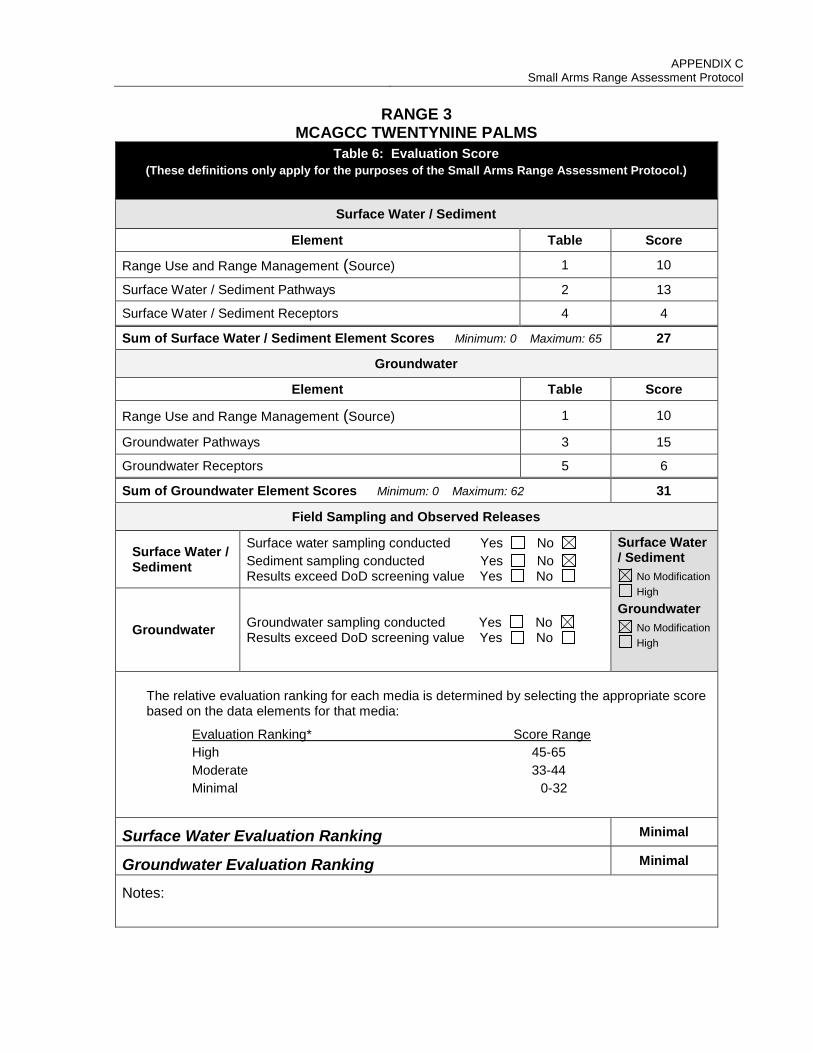
APPENDIX C
Small Arms Range Assessment Protocol
RANGE 3 MCAGCC TWENTYNINE PALMS
Table 6: Evaluation Score (These definitions only apply for the purposes of the Small Arms Range Assessment Protocol.)
Surface Water / Sediment
Element Table Score
Range Use and Range Management (Source) 1 10
Surface Water / Sediment Pathways 2 13
Surface Water / Sediment Receptors 4 4
Sum of Surface Water / Sediment Element Scores Minimum: 0 Maximum: 65 27
Groundwater
Element Table Score
Range Use and Range Management (Source) 1 10
Groundwater Pathways 3 15
Groundwater Receptors 5 6
Sum of Groundwater Element Scores Minimum: 0 Maximum: 62 31
Field Sampling and Observed Releases
Surface Water / Sediment
Surface water sampling conducted Yes No Sediment sampling conducted Yes No Results exceed DoD screening value Yes No
Surface Water / Sediment
No Modification High
Groundwater No Modification High
Groundwater Groundwater sampling conducted Yes No Results exceed DoD screening value Yes No
The relative evaluation ranking for each media is determined by selecting the appropriate score based on the data elements for that media:
Evaluation Ranking* Score Range High 45-65 Moderate 33-44 Minimal 0-32
Surface Water Evaluation Ranking Minimal
Groundwater Evaluation Ranking Minimal
Notes:
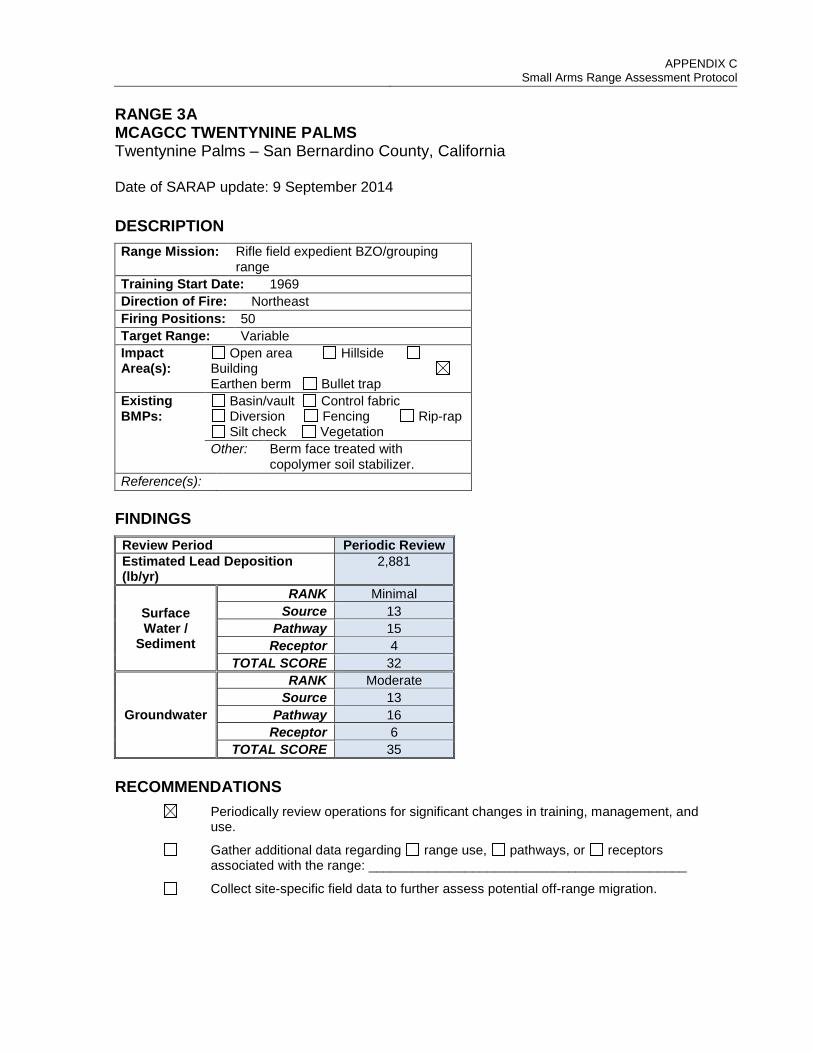
APPENDIX C
Small Arms Range Assessment Protocol RANGE 3A MCAGCC TWENTYNINE PALMS Twentynine Palms – San Bernardino County, California Date of SARAP update: 9 September 2014
DESCRIPTION Range Mission: Rifle field expedient BZO/grouping
range Training Start Date: 1969 Direction of Fire: Northeast Firing Positions: 50 Target Range: Variable Impact Area(s):
Open area Hillside Building Earthen berm Bullet trap
Existing BMPs:
Basin/vault Control fabric Diversion Fencing Rip-rap Silt check Vegetation
Other: Berm face treated with copolymer soil stabilizer.
Reference(s): FINDINGS Review Period Periodic Review Estimated Lead Deposition (lb/yr)
2,881
Surface Water /
Sediment
RANK Minimal Source 13
Pathway 15 Receptor 4
TOTAL SCORE 32
Groundwater
RANK Moderate Source 13
Pathway 16 Receptor 6
TOTAL SCORE 35 RECOMMENDATIONS
Periodically review operations for significant changes in training, management, and use.
Gather additional data regarding range use, pathways, or receptors associated with the range: ___________________________________________
Collect site-specific field data to further assess potential off-range migration.
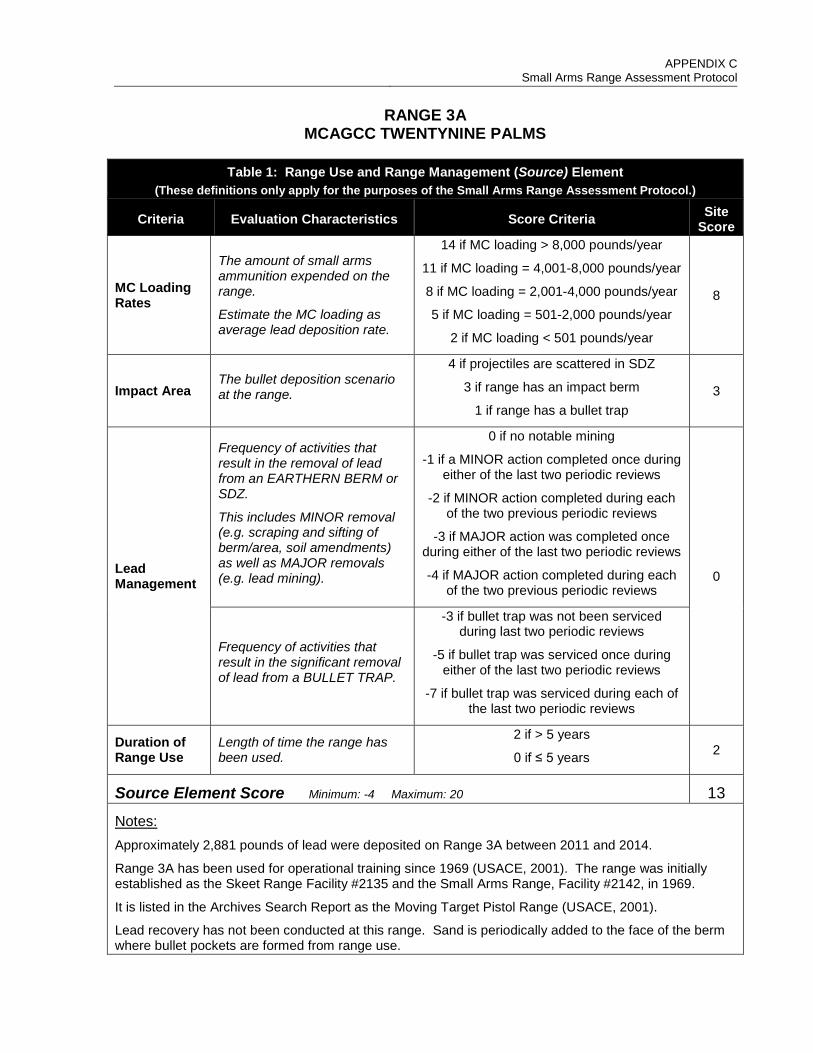
APPENDIX C
Small Arms Range Assessment Protocol
RANGE 3A MCAGCC TWENTYNINE PALMS
Table 1: Range Use and Range Management (Source) Element
(These definitions only apply for the purposes of the Small Arms Range Assessment Protocol.)
Criteria Evaluation Characteristics Score Criteria Site Score
MC Loading Rates
The amount of small arms ammunition expended on the range.
Estimate the MC loading as average lead deposition rate.
14 if MC loading > 8,000 pounds/year
11 if MC loading = 4,001-8,000 pounds/year
8 if MC loading = 2,001-4,000 pounds/year
5 if MC loading = 501-2,000 pounds/year
2 if MC loading < 501 pounds/year
8
Impact Area The bullet deposition scenario at the range.
4 if projectiles are scattered in SDZ
3 if range has an impact berm
1 if range has a bullet trap 3
Lead Management
Frequency of activities that result in the removal of lead from an EARTHERN BERM or SDZ.
This includes MINOR removal (e.g. scraping and sifting of berm/area, soil amendments) as well as MAJOR removals (e.g. lead mining).
0 if no notable mining
-1 if a MINOR action completed once during either of the last two periodic reviews
-2 if MINOR action completed during each of the two previous periodic reviews
-3 if MAJOR action was completed once during either of the last two periodic reviews
-4 if MAJOR action completed during each of the two previous periodic reviews
0
Frequency of activities that result in the significant removal of lead from a BULLET TRAP.
-3 if bullet trap was not been serviced during last two periodic reviews
-5 if bullet trap was serviced once during either of the last two periodic reviews
-7 if bullet trap was serviced during each of the last two periodic reviews
Duration of Range Use
Length of time the range has been used.
2 if > 5 years
0 if ≤ 5 years 2
Source Element Score Minimum: -4 Maximum: 20 13
Notes: Approximately 2,881 pounds of lead were deposited on Range 3A between 2011 and 2014.
Range 3A has been used for operational training since 1969 (USACE, 2001). The range was initially established as the Skeet Range Facility #2135 and the Small Arms Range, Facility #2142, in 1969.
It is listed in the Archives Search Report as the Moving Target Pistol Range (USACE, 2001).
Lead recovery has not been conducted at this range. Sand is periodically added to the face of the berm where bullet pockets are formed from range use.

APPENDIX C
Small Arms Range Assessment Protocol
RANGE 3A MCAGCC TWENTYNINE PALMS
Table 2: Surface Water / Sediment Pathways Characteristics Element
(These definitions only apply for the purposes of the Small Arms Range Assessment Protocol.)
Criteria Evaluation Characteristics Score Criteria Site Score
Precipitation Rate of precipitation.
8 if precipitation > 40 inches/year
6 if precipitation = 20-40 inches/year
4 if precipitation < 20 inches/year 4
Vegetation Approximate vegetation cover within and directly downslope of the projectile deposition area.
6 if vegetation cover < 10%
4 if vegetation cover = 10% to 90%
2 if vegetation cover > 90% 6
Slope of Range
Average slope from deposition area along the overland pathway to the first defined channel.
5 if slope > 10% (5.71°)
3 if slope = 5% to 10%
2 if slope < 5% (2.86°) 2
pH of Soil pH below 6.5 and above 8.5 increases the rate of lead dissolution.
3 if pH < 4 or >10
2 if pH ≥ 4 < 6.5 or > 8.5 ≤ 10
1 if pH 6.5 ≤ pH ≤ 8.5 1
Soil Type/ Erosion
Erosion potential is greatest for fine sands and silt. Clay has the lowest erosion potential. The area where projectiles are deposited should be scored.
2 if soil type is fine sand / silt
1 if soil type is clayey sand or silt / coarse sands
0 if soil type is clay
2
Erosion observed at the projectile deposition area.
5 if there is visual evidence of eroded material being transported from the
projectile deposition area
3 if bullet pockets or other indicators of erosion were observed
1 if no erosion was observed
3
Engineering Controls
The presence of engineering controls or BMPs to modify or control surface water run-on.
Controls may include barriers or diversions that reduce run-on to the range.
0 if no engineering controls
-1 if partial engineering controls
-2 if effective engineering controls -1
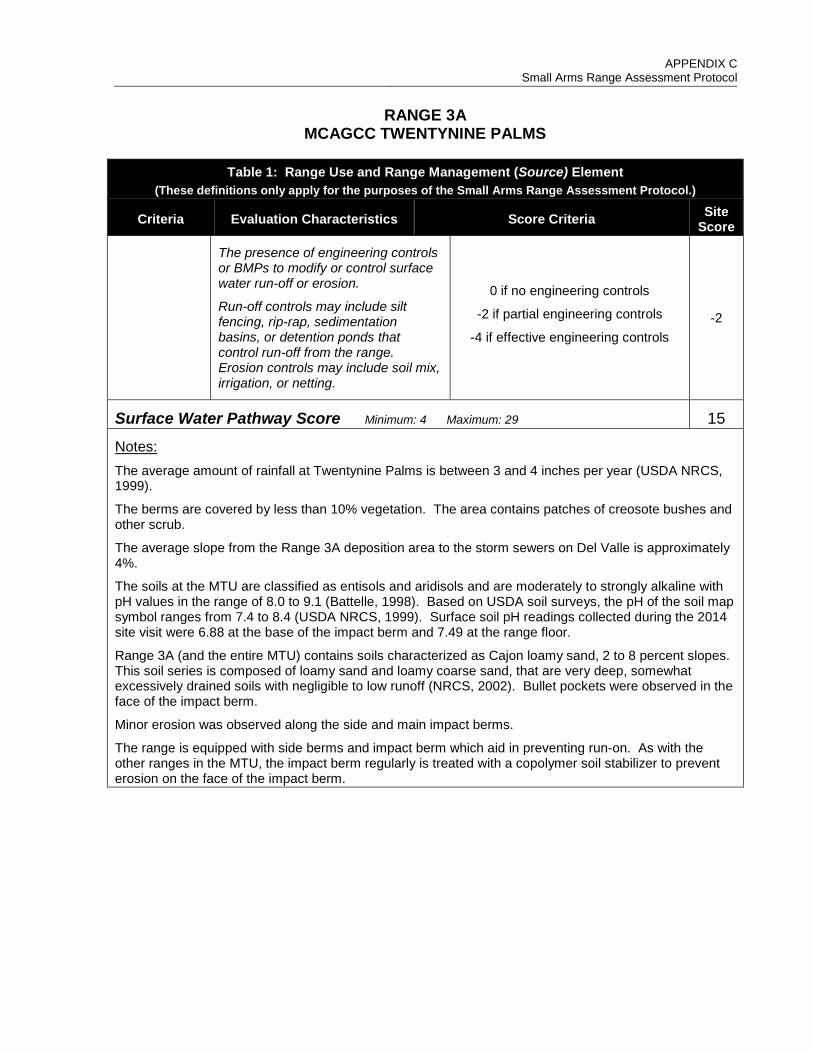
APPENDIX C
Small Arms Range Assessment Protocol
RANGE 3A MCAGCC TWENTYNINE PALMS
Table 1: Range Use and Range Management (Source) Element
(These definitions only apply for the purposes of the Small Arms Range Assessment Protocol.)
Criteria Evaluation Characteristics Score Criteria Site Score
The presence of engineering controls or BMPs to modify or control surface water run-off or erosion.
Run-off controls may include silt fencing, rip-rap, sedimentation basins, or detention ponds that control run-off from the range. Erosion controls may include soil mix, irrigation, or netting.
0 if no engineering controls
-2 if partial engineering controls
-4 if effective engineering controls -2
Surface Water Pathway Score Minimum: 4 Maximum: 29 15
Notes: The average amount of rainfall at Twentynine Palms is between 3 and 4 inches per year (USDA NRCS, 1999).
The berms are covered by less than 10% vegetation. The area contains patches of creosote bushes and other scrub.
The average slope from the Range 3A deposition area to the storm sewers on Del Valle is approximately 4%.
The soils at the MTU are classified as entisols and aridisols and are moderately to strongly alkaline with pH values in the range of 8.0 to 9.1 (Battelle, 1998). Based on USDA soil surveys, the pH of the soil map symbol ranges from 7.4 to 8.4 (USDA NRCS, 1999). Surface soil pH readings collected during the 2014 site visit were 6.88 at the base of the impact berm and 7.49 at the range floor.
Range 3A (and the entire MTU) contains soils characterized as Cajon loamy sand, 2 to 8 percent slopes. This soil series is composed of loamy sand and loamy coarse sand, that are very deep, somewhat excessively drained soils with negligible to low runoff (NRCS, 2002). Bullet pockets were observed in the face of the impact berm.
Minor erosion was observed along the side and main impact berms.
The range is equipped with side berms and impact berm which aid in preventing run-on. As with the other ranges in the MTU, the impact berm regularly is treated with a copolymer soil stabilizer to prevent erosion on the face of the impact berm.

APPENDIX C
Small Arms Range Assessment Protocol
RANGE 3A MCAGCC TWENTYNINE PALMS
Table 3: Groundwater Pathways Characteristics Element
(These definitions only apply for the purposes of the Small Arms Range Assessment Protocol.)
Criteria Evaluation Characteristics Score
Criteria Site
Score
Precipitation Intensity and frequency of precipitation.
3 if precipitation > 40 inches/year
2 if precipitation = 20-40 inches/year
1 if precipitation < 20 inches/year 1
Depth to Groundwater
The potential for impact to the groundwater decreases with an increasing depth to the water table.
6 if depth to groundwater < 3 feet
3 if depth to groundwater = 3-20 feet
1 if depth to groundwater = 20-100 feet
0 if in a groundwater discharge area or depth to groundwater > 100 feet
0
Soil Type / Infiltration Conditions
Soil with a higher porosity (sands/gravels) has more infiltration and less runoff compared to soil with low porosity (silts/clays). Most hydraulically restrictive infiltration horizon between the surface and groundwater is scored.
6 if soil type is sand / gravel
3 if soil type is sand and silt
1 if soil type is clay / clayey sand/silt 6
Vegetation impedes infiltration and groundwater recharge.
6 if vegetation cover < 10%
3 if vegetation cover = 10% to 90%
1 if vegetation cover > 90% 6
Average slope from deposition area along the overland pathway to the first defined channel.
3 if slope < 2% (1.15°)
1 if slope = 2% to 20%
0 if slope > 20% (11.31°) 1
pH of Soil
Lead tends to stay dissolved at pH conditions less than 6.5 and greater than 8.5 but tends to attach to soil particles at pH conditions between these levels.
3 if pH < 4 or >10
2 if pH ≥ 4 < 6.5 or > 8.5 ≤ 10
1 if pH 6.5 ≤ pH ≤ 8.5 2
Groundwater Pathway Score Minimum: 4 Maximum: 27 16
Notes: The average amount of rainfall at Twentynine Palms is between 3 and 4 inches per year (USDA NRCS, 1999).
The nearest depth-to-groundwater measurement is from a well approximately 1.3 mile west of the range
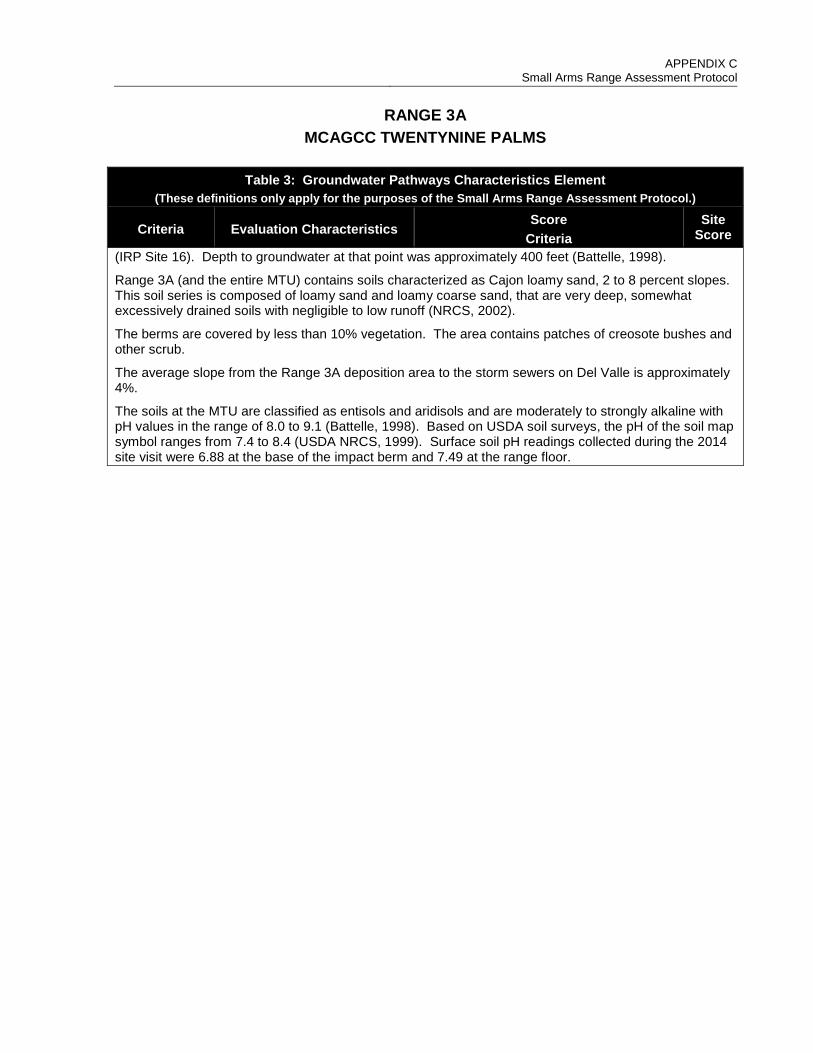
APPENDIX C
Small Arms Range Assessment Protocol
RANGE 3A MCAGCC TWENTYNINE PALMS
Table 3: Groundwater Pathways Characteristics Element
(These definitions only apply for the purposes of the Small Arms Range Assessment Protocol.)
Criteria Evaluation Characteristics Score
Criteria Site
Score (IRP Site 16). Depth to groundwater at that point was approximately 400 feet (Battelle, 1998).
Range 3A (and the entire MTU) contains soils characterized as Cajon loamy sand, 2 to 8 percent slopes. This soil series is composed of loamy sand and loamy coarse sand, that are very deep, somewhat excessively drained soils with negligible to low runoff (NRCS, 2002).
The berms are covered by less than 10% vegetation. The area contains patches of creosote bushes and other scrub.
The average slope from the Range 3A deposition area to the storm sewers on Del Valle is approximately 4%.
The soils at the MTU are classified as entisols and aridisols and are moderately to strongly alkaline with pH values in the range of 8.0 to 9.1 (Battelle, 1998). Based on USDA soil surveys, the pH of the soil map symbol ranges from 7.4 to 8.4 (USDA NRCS, 1999). Surface soil pH readings collected during the 2014 site visit were 6.88 at the base of the impact berm and 7.49 at the range floor.

APPENDIX C
Small Arms Range Assessment Protocol
RANGE 3A MCAGCC TWENTYNINE PALMS
Table 4: Surface Water / Sediment Receptors Element
(These definitions only apply for the purposes of the Small Arms Range Assessment Protocol.)
Criteria Evaluation Characteristics
Score Criteria
Site Score
Surface Water Body
Identify if a nearby surface water body is present down gradient, as defined on the National Hydrography Dataset (NHD) map.
8 if surface water body is located downgradient of the range within 1,500 feet
4 if surface water body is located downgradient of the range 1,500-5,000 feet
0 if surface water body is located downgradient of the range over 5,000 feet
4
Drinking Water Use
Identify if a down gradient surface water body is used as a drinking water source (drainage distance).
4 if surface water body used as a drinking water source is located downgradient of the range within 1 mile
2 if surface water body used as a drinking water source is located downgradient of the range within 1 to 6 miles
0 if no known drinking water intakes are identified within 6 miles of the range
0
Drainage Distance to Installation Boundary
Identify downgradient drainage distance to first potential ecological exposure off installation (i.e., installation boundary).
4 if the installation boundary is located downgradient of the range within 0.5 miles
2 if the installation boundary is located downgradient of the range within 0.5 to 3 miles
0 if the installation boundary is located downgradient of the range greater than 3 miles, or if surface water runoff
from the range does not discharge off the installation
0
Surface Water Receptor Score Minimum: 0 Maximum: 16 4
Notes: According to the USGS National Hydrography Map, the closest downgradient surface water body to Range 3A is an ephemeral stream located approximately 1,900 feet to the southeast (USGS, 2014).
Surface water is not used as a drinking water source at the installation, nor are there any surface water bodies used as drinking water sources within 6 miles of this range.
Surface water from this range drains southeast towards an ephemeral stream that generally flows southeast. According to the USGS National Hydrography Map, the drainage pathway from Range 3A crosses the installation boundary approximately 4 miles southeast from the bullet deposition area.

APPENDIX C
Small Arms Range Assessment Protocol
RANGE 3A MCAGCC TWENTYNINE PALMS
Table 5: Groundwater Receptors Element
(These definitions only apply for the purposes of the Small Arms Range Assessment Protocol.)
Criteria Evaluation Characteristics
Score Criteria
Site Score
Wells Identified as Potable Water Sources
Number and location of potable water or potable water supply wells relative to the location of the range.
6 if a drinking water well is located within <50 feet of the range
3 if a drinking water well is located downgradient of the range within 50-1,500 feet
0 if there are no drinking water wells located within 1,500 feet downgradient of the range or if
groundwater is not used as a drinking water source.
0
Into what type of aquifer is the well set
6 if unconfined
3 if semi-confined
0 if confined 6
Groundwater wells identified for purpose other than drinking water
Groundwater wells used for purposes other than drinking water supply identified down gradient of the range.
3 if a groundwater well is located within 50 feet of the range
1 if a groundwater well is located downgradient of the range within 50-1,500 feet
0 if groundwater well <1,500 feet downgradient of the range is not used for any purpose.
0
Groundwater Receptor Score Minimum: 0 Maximum: 15 6
Notes: Water supply wells are located in the Surprise Springs groundwater basin, located 10 miles west-northwest of the MTU. All wells draw water from the unconfined portions of the upper and middle aquifers. Surprise Springs is located upgradient of the Mesquite Basin. The Mesquite Basin is not used as a drinking water source because of high mineral content. The known depth to groundwater near the MTU is approximately 400 feet.
There are no known agricultural wells located on the installation. Surface water and stormwater are used for irrigation purposes. Based on soil sampling results from the Small Arms Range Maintenance and Repair Project at MCAGCC Twentynine Palms (Battelle, 1998) and previous Navy studies, the vertical migration of lead in the soil column is between four and eight inches from the soil surface.
While groundwater is likely found at shallow depths near playas, there are no known groundwater discharge locations near the range which could result in lead migration from groundwater to surface water.

APPENDIX C
Small Arms Range Assessment Protocol
RANGE 3A MCAGCC TWENTYNINE PALMS
Table 6: Evaluation Score (These definitions only apply for the purposes of the Small Arms Range Assessment Protocol.)
Surface Water / Sediment
Element Table Score
Range Use and Range Management (Source) 1 13
Surface Water / Sediment Pathways 2 15
Surface Water / Sediment Receptors 4 4
Sum of Surface Water / Sediment Element Scores Minimum: 0 Maximum: 65 32
Groundwater
Element Table Score
Range Use and Range Management (Source) 1 13
Groundwater Pathways 3 16
Groundwater Receptors 5 6
Sum of Groundwater Element Scores Minimum: 0 Maximum: 62 35
Field Sampling and Observed Releases
Surface Water / Sediment
Surface water sampling conducted Yes No Sediment sampling conducted Yes No Results exceed DoD screening value Yes No
Surface Water / Sediment
No Modification High
Groundwater No Modification High
Groundwater Groundwater sampling conducted Yes No Results exceed DoD screening value Yes No
The relative evaluation ranking for each media is determined by selecting the appropriate score based on the data elements for that media:
Evaluation Ranking* Score Range High 45-65 Moderate 33-44 Minimal 0-32
Surface Water Evaluation Ranking Minimal
Groundwater Evaluation Ranking Moderate
Notes:
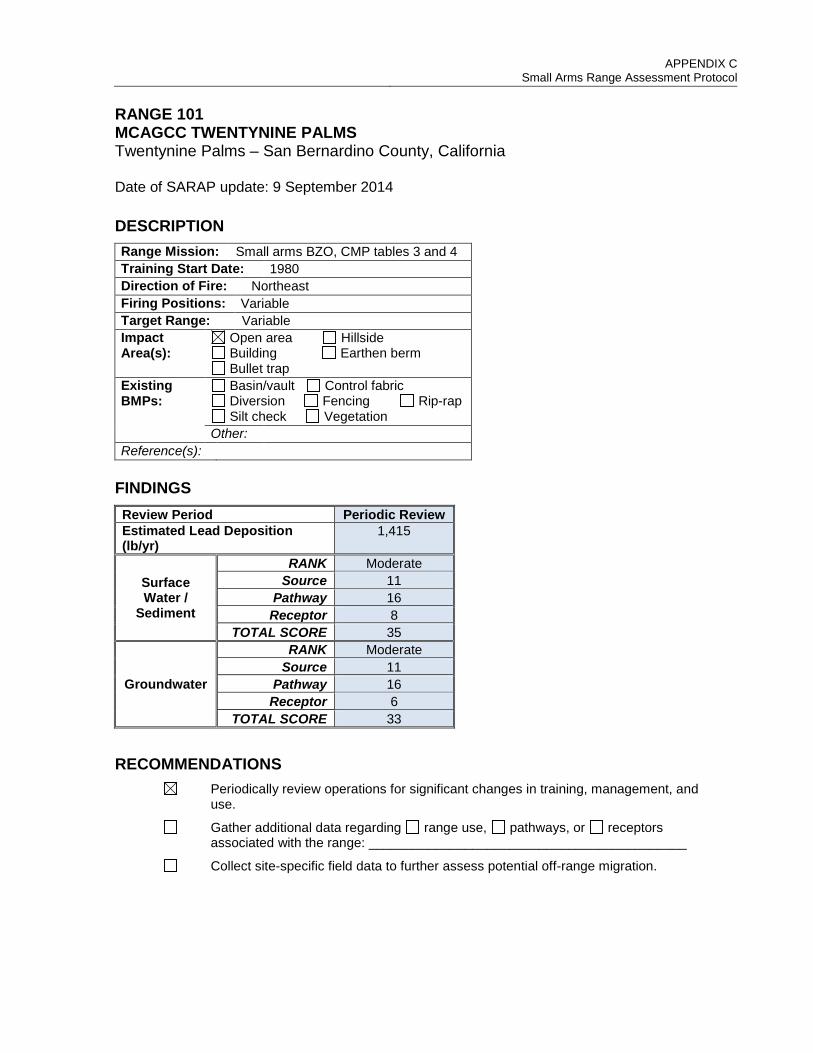
APPENDIX C
Small Arms Range Assessment Protocol RANGE 101 MCAGCC TWENTYNINE PALMS Twentynine Palms – San Bernardino County, California Date of SARAP update: 9 September 2014
DESCRIPTION Range Mission: Small arms BZO, CMP tables 3 and 4 Training Start Date: 1980 Direction of Fire: Northeast Firing Positions: Variable Target Range: Variable Impact Area(s):
Open area Hillside Building Earthen berm Bullet trap
Existing BMPs:
Basin/vault Control fabric Diversion Fencing Rip-rap Silt check Vegetation
Other: Reference(s):
FINDINGS Review Period Periodic Review Estimated Lead Deposition (lb/yr)
1,415
Surface Water /
Sediment
RANK Moderate Source 11
Pathway 16 Receptor 8
TOTAL SCORE 35
Groundwater
RANK Moderate Source 11
Pathway 16 Receptor 6
TOTAL SCORE 33 RECOMMENDATIONS
Periodically review operations for significant changes in training, management, and use.
Gather additional data regarding range use, pathways, or receptors associated with the range: ___________________________________________
Collect site-specific field data to further assess potential off-range migration.

APPENDIX C
Small Arms Range Assessment Protocol
RANGE 101 MCAGCC TWENTYNINE PALMS
Table 1: Range Use and Range Management (Source) Element
(These definitions only apply for the purposes of the Small Arms Range Assessment Protocol.)
Criteria Evaluation Characteristics Score Criteria Site Score
MC Loading Rates
The amount of small arms ammunition expended on the range.
Estimate the MC loading as average lead deposition rate.
14 if MC loading > 8,000 pounds/year
11 if MC loading = 4,001-8,000 pounds/year
8 if MC loading = 2,001-4,000 pounds/year
5 if MC loading = 501-2,000 pounds/year
2 if MC loading < 501 pounds/year
5
Impact Area The bullet deposition scenario at the range.
4 if projectiles are scattered in SDZ
3 if range has an impact berm
1 if range has a bullet trap 4
Lead Management
Frequency of activities that result in the removal of lead from an EARTHERN BERM or SDZ.
This includes MINOR removal (e.g. scraping and sifting of berm/area, soil amendments) as well as MAJOR removals (e.g. lead mining).
0 if no notable mining
-1 if a MINOR action completed once during either of the last two periodic reviews
-2 if MINOR action completed during each of the two previous periodic reviews
-3 if MAJOR action was completed once during either of the last two periodic reviews
-4 if MAJOR action completed during each of the two previous periodic reviews
0
Frequency of activities that result in the significant removal of lead from a BULLET TRAP.
-3 if bullet trap was not been serviced during last two periodic reviews
-5 if bullet trap was serviced once during either of the last two periodic reviews
-7 if bullet trap was serviced during each of the last two periodic reviews
Duration of Range Use
Length of time the range has been used.
2 if > 5 years
0 if ≤ 5 years 2
Source Element Score Minimum: -4 Maximum: 20 11
Notes: Approximately 1,415 pounds of lead were deposited on Range 101 between 2011 and 2014.
Range 101 has been used for operational training since 1980. It was first documented in the 1984 Range Standard Operating Procedure (MCAGCC Twentynine Palms, 1984). Range 101 was combined with Range 101A after the 2006 REVA Baseline Assessment (ARCADIS/Malcolm Pirnie, 2011).
The range does not have a specific impact berm; lead recovery is not conducted at this range.

APPENDIX C
Small Arms Range Assessment Protocol
RANGE 101 MCAGCC TWENTYNINE PALMS
Table 2: Surface Water / Sediment Pathways Characteristics Element
(These definitions only apply for the purposes of the Small Arms Range Assessment Protocol.)
Criteria Evaluation Characteristics Score Criteria Site Score
Precipitation Rate of precipitation.
8 if precipitation > 40 inches/year
6 if precipitation = 20-40 inches/year
4 if precipitation < 20 inches/year 4
Vegetation Approximate vegetation cover within and directly downslope of the projectile deposition area.
6 if vegetation cover < 10%
4 if vegetation cover = 10% to 90%
2 if vegetation cover > 90% 6
Slope of Range
Average slope from deposition area along the overland pathway to the first defined channel.
5 if slope > 10% (5.71°)
3 if slope = 5% to 10%
2 if slope < 5% (2.86°) 2
pH of Soil pH below 6.5 and above 8.5 increases the rate of lead dissolution.
3 if pH < 4 or >10
2 if pH ≥ 4 < 6.5 or > 8.5 ≤ 10
1 if pH 6.5 ≤ pH ≤ 8.5 1
Soil Type/ Erosion
Erosion potential is greatest for fine sands and silt. Clay has the lowest erosion potential. The area where projectiles are deposited should be scored.
2 if soil type is fine sand / silt
1 if soil type is clayey sand or silt / coarse sands
0 if soil type is clay
2
Erosion observed at the projectile deposition area.
5 if there is visual evidence of eroded material being transported from the
projectile deposition area
3 if bullet pockets or other indicators of erosion were observed
1 if no erosion was observed
1
Engineering Controls
The presence of engineering controls or BMPs to modify or control surface water run-on.
Controls may include barriers or diversions that reduce run-on to the range.
0 if no engineering controls
-1 if partial engineering controls
-2 if effective engineering controls 0
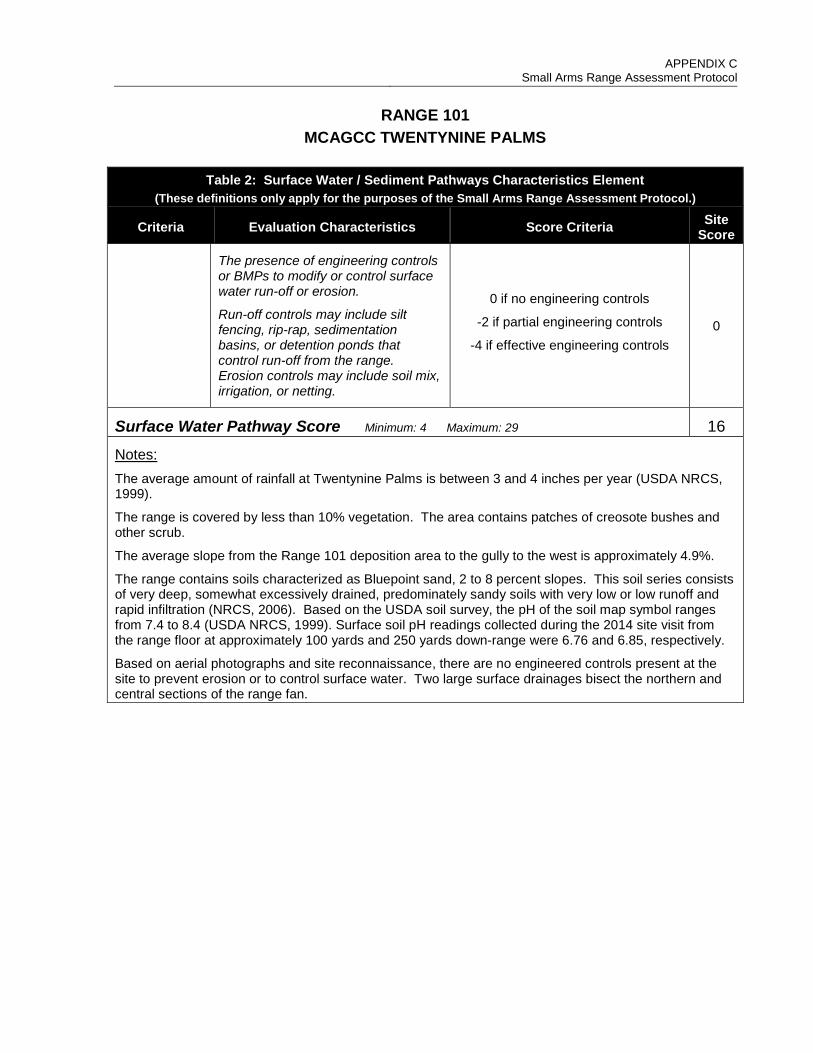
APPENDIX C
Small Arms Range Assessment Protocol
RANGE 101 MCAGCC TWENTYNINE PALMS
Table 2: Surface Water / Sediment Pathways Characteristics Element
(These definitions only apply for the purposes of the Small Arms Range Assessment Protocol.)
Criteria Evaluation Characteristics Score Criteria Site Score
The presence of engineering controls or BMPs to modify or control surface water run-off or erosion.
Run-off controls may include silt fencing, rip-rap, sedimentation basins, or detention ponds that control run-off from the range. Erosion controls may include soil mix, irrigation, or netting.
0 if no engineering controls
-2 if partial engineering controls
-4 if effective engineering controls 0
Surface Water Pathway Score Minimum: 4 Maximum: 29 16
Notes: The average amount of rainfall at Twentynine Palms is between 3 and 4 inches per year (USDA NRCS, 1999).
The range is covered by less than 10% vegetation. The area contains patches of creosote bushes and other scrub.
The average slope from the Range 101 deposition area to the gully to the west is approximately 4.9%.
The range contains soils characterized as Bluepoint sand, 2 to 8 percent slopes. This soil series consists of very deep, somewhat excessively drained, predominately sandy soils with very low or low runoff and rapid infiltration (NRCS, 2006). Based on the USDA soil survey, the pH of the soil map symbol ranges from 7.4 to 8.4 (USDA NRCS, 1999). Surface soil pH readings collected during the 2014 site visit from the range floor at approximately 100 yards and 250 yards down-range were 6.76 and 6.85, respectively.
Based on aerial photographs and site reconnaissance, there are no engineered controls present at the site to prevent erosion or to control surface water. Two large surface drainages bisect the northern and central sections of the range fan.

APPENDIX C
Small Arms Range Assessment Protocol
RANGE 101 MCAGCC TWENTYNINE PALMS
Table 3: Groundwater Pathways Characteristics Element
(These definitions only apply for the purposes of the Small Arms Range Assessment Protocol.)
Criteria Evaluation Characteristics Score
Criteria Site
Score
Precipitation Intensity and frequency of precipitation.
3 if precipitation > 40 inches/year
2 if precipitation = 20-40 inches/year
1 if precipitation < 20 inches/year 1
Depth to Groundwater
The potential for impact to the groundwater decreases with an increasing depth to the water table.
6 if depth to groundwater < 3 feet
3 if depth to groundwater = 3-20 feet
1 if depth to groundwater = 20-100 feet
0 if in a groundwater discharge area or depth to groundwater > 100 feet
1
Soil Type / Infiltration Conditions
Soil with a higher porosity (sands/gravels) has more infiltration and less runoff compared to soil with low porosity (silts/clays). Most hydraulically restrictive infiltration horizon between the surface and groundwater is scored.
6 if soil type is sand / gravel
3 if soil type is sand and silt
1 if soil type is clay / clayey sand/silt 6
Vegetation impedes infiltration and groundwater recharge.
6 if vegetation cover < 10%
3 if vegetation cover = 10% to 90%
1 if vegetation cover > 90% 6
Average slope from deposition area along the overland pathway to the first defined channel.
3 if slope < 2% (1.15°)
1 if slope = 2% to 20%
0 if slope > 20% (11.31°) 1
pH of Soil
Lead tends to stay dissolved at pH conditions less than 6.5 and greater than 8.5 but tends to attach to soil particles at pH conditions between these levels.
3 if pH < 4 or >10
2 if pH ≥ 4 < 6.5 or > 8.5 ≤ 10
1 if pH 6.5 ≤ pH ≤ 8.5 1
Groundwater Pathway Score Minimum: 4 Maximum: 27 16
Notes: The average amount of rainfall at Twentynine Palms is between 3 and 4 inches per year (USDA NRCS, 1999).
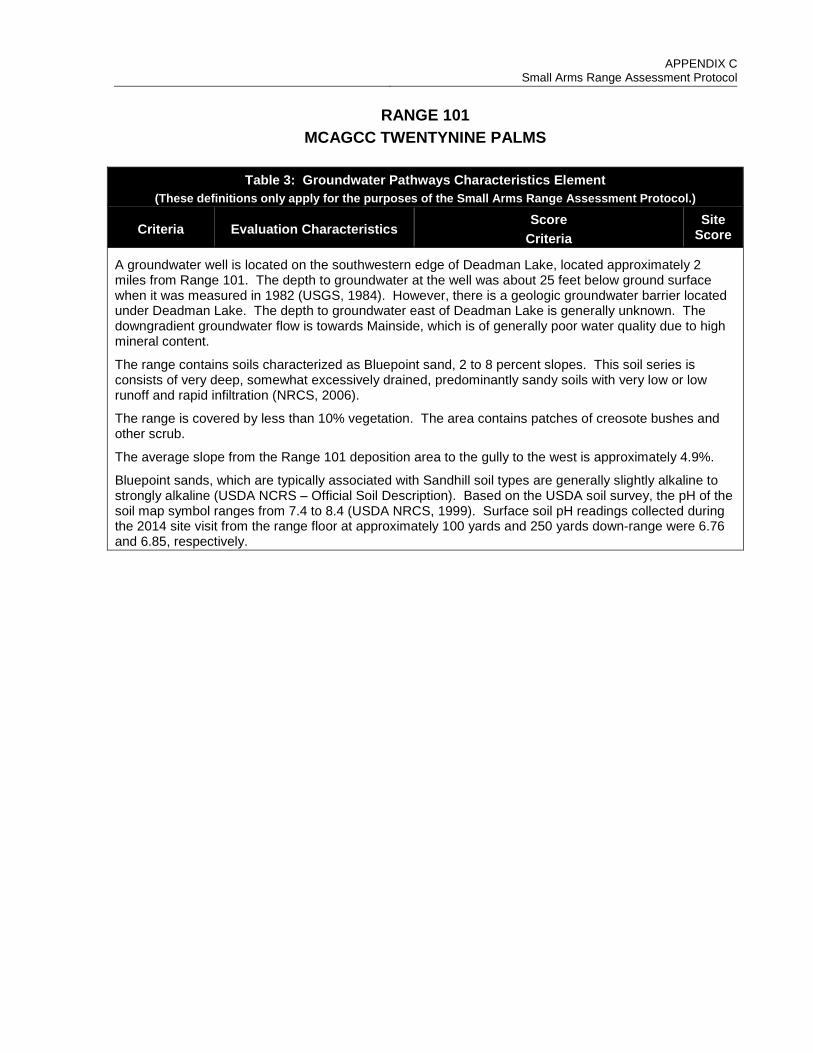
APPENDIX C
Small Arms Range Assessment Protocol
RANGE 101 MCAGCC TWENTYNINE PALMS
Table 3: Groundwater Pathways Characteristics Element
(These definitions only apply for the purposes of the Small Arms Range Assessment Protocol.)
Criteria Evaluation Characteristics Score
Criteria Site
Score
A groundwater well is located on the southwestern edge of Deadman Lake, located approximately 2 miles from Range 101. The depth to groundwater at the well was about 25 feet below ground surface when it was measured in 1982 (USGS, 1984). However, there is a geologic groundwater barrier located under Deadman Lake. The depth to groundwater east of Deadman Lake is generally unknown. The downgradient groundwater flow is towards Mainside, which is of generally poor water quality due to high mineral content.
The range contains soils characterized as Bluepoint sand, 2 to 8 percent slopes. This soil series is consists of very deep, somewhat excessively drained, predominantly sandy soils with very low or low runoff and rapid infiltration (NRCS, 2006).
The range is covered by less than 10% vegetation. The area contains patches of creosote bushes and other scrub.
The average slope from the Range 101 deposition area to the gully to the west is approximately 4.9%.
Bluepoint sands, which are typically associated with Sandhill soil types are generally slightly alkaline to strongly alkaline (USDA NCRS – Official Soil Description). Based on the USDA soil survey, the pH of the soil map symbol ranges from 7.4 to 8.4 (USDA NRCS, 1999). Surface soil pH readings collected during the 2014 site visit from the range floor at approximately 100 yards and 250 yards down-range were 6.76 and 6.85, respectively.

APPENDIX C
Small Arms Range Assessment Protocol
RANGE 101 MCAGCC TWENTYNINE PALMS
Table 4: Surface Water / Sediment Receptors Element
(These definitions only apply for the purposes of the Small Arms Range Assessment Protocol.)
Criteria Evaluation Characteristics
Score Criteria
Site Score
Surface Water Body
Identify if a nearby surface water body is present down gradient, as defined on the National Hydrography Dataset (NHD) map.
8 if surface water body is located downgradient of the range within 1,500 feet
4 if surface water body is located downgradient of the range 1,500-5,000 feet
0 if surface water body is located downgradient of the range over 5,000 feet
8
Drinking Water Use
Identify if a down gradient surface water body is used as a drinking water source (drainage distance).
4 if surface water body used as a drinking water source is located downgradient of the range within 1 mile
2 if surface water body used as a drinking water source is located downgradient of the range within 1 to 6 miles
0 if no known drinking water intakes are identified within 6 miles of the range
0
Drainage Distance to Installation Boundary
Identify downgradient drainage distance to first potential ecological exposure off installation (i.e., installation boundary).
4 if the installation boundary is located downgradient of the range within 0.5 miles
2 if the installation boundary is located downgradient of the range within 0.5 to 3 miles
0 if the installation boundary is located downgradient of the range greater than 3 miles, or if surface water runoff
from the range does not discharge off the installation
0
Surface Water Receptor Score Minimum: 0 Maximum: 16 8
Notes: According to the USGS National Hydrography Map, the closest surface water body to Range 101 is an ephemeral stream located downgradient approximately 730 feet to the northwest (USGS, 2014).
Surface water is not used as a drinking water source at the installation, nor are there any surface water bodies used as drinking water sources within 6 miles of this range.
Surface water from this range drains northwest towards an ephemeral stream that generally flows 0.7 miles southwest. According to the USGS National Hydrography Map, the ephemeral stream terminates just prior to reaching Deadman Lake which is an additional 0.73 miles downgradient from that point. Upon reaching Deadman Lake, the surface water from Range 101 either infiltrates or evaporates. Since the installation boundary is upgradient from Deadman Lake, the drainage pathway from Range 101 does not cross the installation boundary.
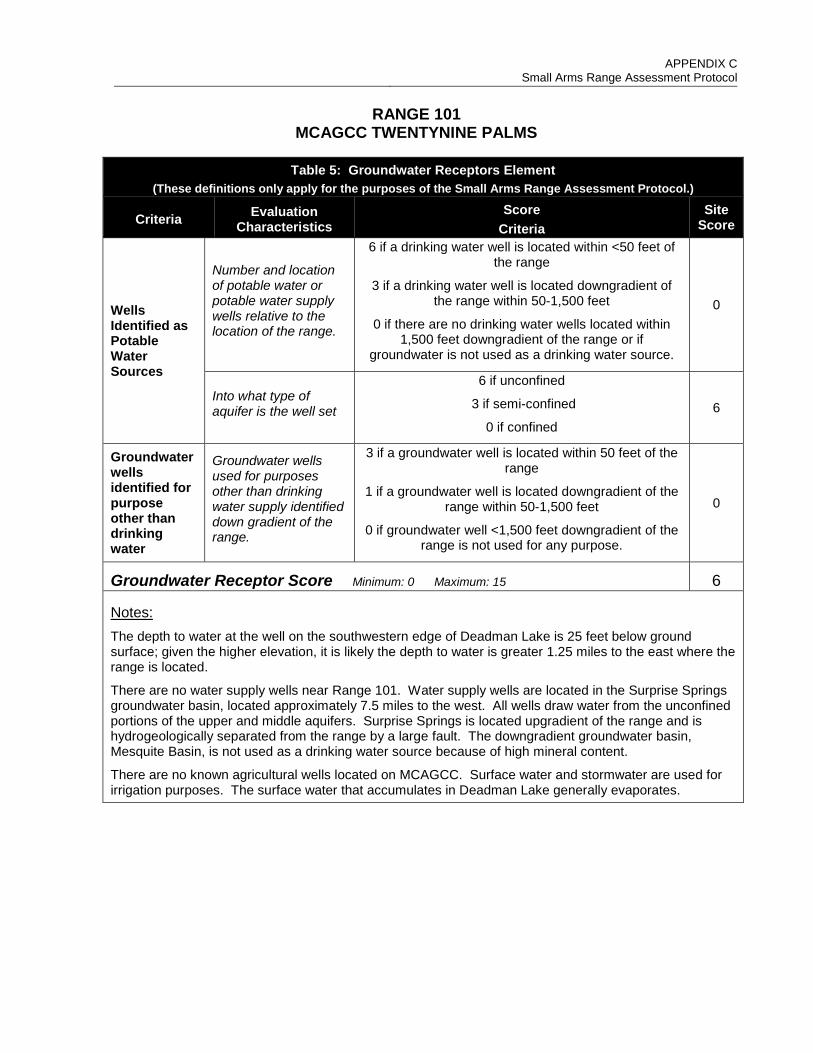
APPENDIX C
Small Arms Range Assessment Protocol
RANGE 101 MCAGCC TWENTYNINE PALMS
Table 5: Groundwater Receptors Element
(These definitions only apply for the purposes of the Small Arms Range Assessment Protocol.)
Criteria Evaluation Characteristics
Score Criteria
Site Score
Wells Identified as Potable Water Sources
Number and location of potable water or potable water supply wells relative to the location of the range.
6 if a drinking water well is located within <50 feet of the range
3 if a drinking water well is located downgradient of the range within 50-1,500 feet
0 if there are no drinking water wells located within 1,500 feet downgradient of the range or if
groundwater is not used as a drinking water source.
0
Into what type of aquifer is the well set
6 if unconfined
3 if semi-confined
0 if confined 6
Groundwater wells identified for purpose other than drinking water
Groundwater wells used for purposes other than drinking water supply identified down gradient of the range.
3 if a groundwater well is located within 50 feet of the range
1 if a groundwater well is located downgradient of the range within 50-1,500 feet
0 if groundwater well <1,500 feet downgradient of the range is not used for any purpose.
0
Groundwater Receptor Score Minimum: 0 Maximum: 15 6
Notes: The depth to water at the well on the southwestern edge of Deadman Lake is 25 feet below ground surface; given the higher elevation, it is likely the depth to water is greater 1.25 miles to the east where the range is located.
There are no water supply wells near Range 101. Water supply wells are located in the Surprise Springs groundwater basin, located approximately 7.5 miles to the west. All wells draw water from the unconfined portions of the upper and middle aquifers. Surprise Springs is located upgradient of the range and is hydrogeologically separated from the range by a large fault. The downgradient groundwater basin, Mesquite Basin, is not used as a drinking water source because of high mineral content.
There are no known agricultural wells located on MCAGCC. Surface water and stormwater are used for irrigation purposes. The surface water that accumulates in Deadman Lake generally evaporates.

APPENDIX C
Small Arms Range Assessment Protocol
RANGE 101 MCAGCC TWENTYNINE PALMS
Table 6: Evaluation Score (These definitions only apply for the purposes of the Small Arms Range Assessment Protocol.)
Surface Water / Sediment
Element Table Score
Range Use and Range Management (Source) 1 11
Surface Water / Sediment Pathways 2 16
Surface Water / Sediment Receptors 4 8
Sum of Surface Water / Sediment Element Scores Minimum: 0 Maximum: 65 35
Groundwater
Element Table Score
Range Use and Range Management (Source) 1 11
Groundwater Pathways 3 16
Groundwater Receptors 5 6
Sum of Groundwater Element Scores Minimum: 0 Maximum: 62 33
Field Sampling and Observed Releases
Surface Water / Sediment
Surface water sampling conducted Yes No Sediment sampling conducted Yes No Results exceed DoD screening value Yes No
Surface Water / Sediment
No Modification High
Groundwater No Modification High
Groundwater Groundwater sampling conducted Yes No Results exceed DoD screening value Yes No
The relative evaluation ranking for each media is determined by selecting the appropriate score based on the data elements for that media:
Evaluation Ranking* Score Range High 45-65 Moderate 33-44 Minimal 0-32
Surface Water Evaluation Ranking Moderate
Groundwater Evaluation Ranking Moderate
Notes:
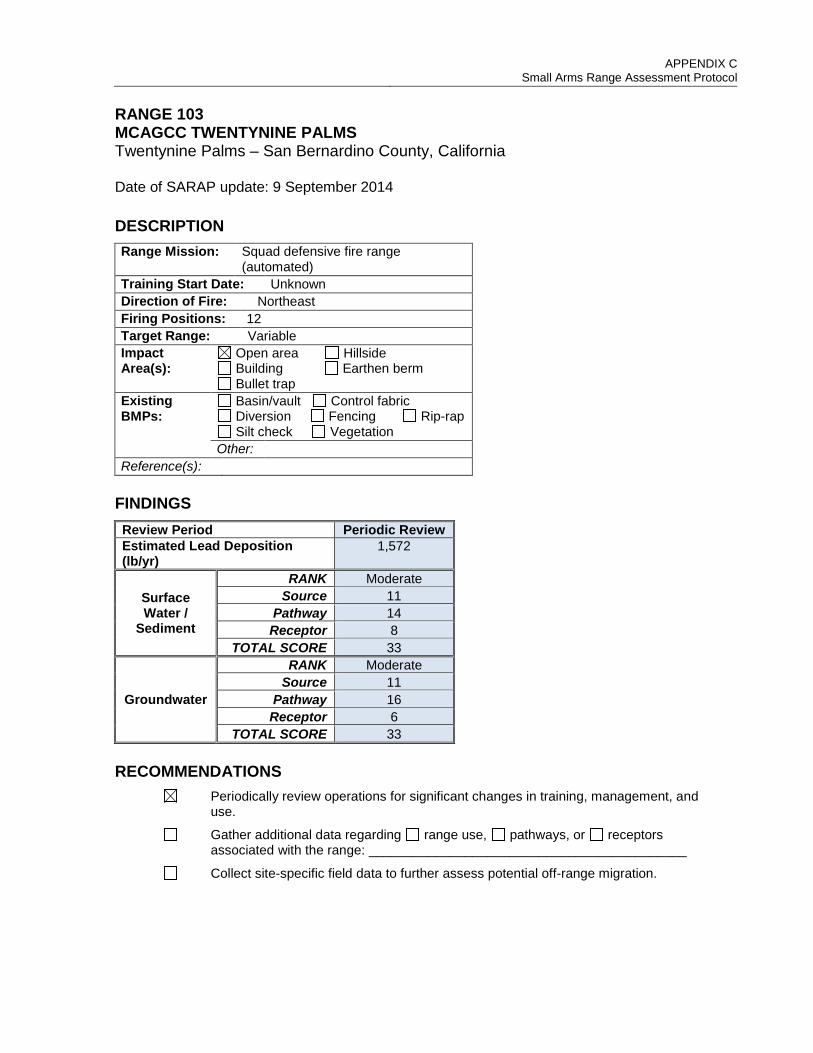
APPENDIX C
Small Arms Range Assessment Protocol RANGE 103 MCAGCC TWENTYNINE PALMS Twentynine Palms – San Bernardino County, California Date of SARAP update: 9 September 2014
DESCRIPTION Range Mission: Squad defensive fire range
(automated) Training Start Date: Unknown Direction of Fire: Northeast Firing Positions: 12 Target Range: Variable Impact Area(s):
Open area Hillside Building Earthen berm Bullet trap
Existing BMPs:
Basin/vault Control fabric Diversion Fencing Rip-rap Silt check Vegetation
Other: Reference(s):
FINDINGS Review Period Periodic Review Estimated Lead Deposition (lb/yr)
1,572
Surface Water /
Sediment
RANK Moderate Source 11
Pathway 14 Receptor 8
TOTAL SCORE 33
Groundwater
RANK Moderate Source 11
Pathway 16 Receptor 6
TOTAL SCORE 33 RECOMMENDATIONS
Periodically review operations for significant changes in training, management, and use.
Gather additional data regarding range use, pathways, or receptors associated with the range: ___________________________________________
Collect site-specific field data to further assess potential off-range migration.

APPENDIX C
Small Arms Range Assessment Protocol
RANGE 103 MCAGCC TWENTYNINE PALMS
Table 1: Range Use and Range Management (Source) Element
(These definitions only apply for the purposes of the Small Arms Range Assessment Protocol.)
Criteria Evaluation Characteristics Score Criteria Site Score
MC Loading Rates
The amount of small arms ammunition expended on the range.
Estimate the MC loading as average lead deposition rate.
14 if MC loading > 8,000 pounds/year
11 if MC loading = 4,001-8,000 pounds/year
8 if MC loading = 2,001-4,000 pounds/year
5 if MC loading = 501-2,000 pounds/year
2 if MC loading < 501 pounds/year
5
Impact Area The bullet deposition scenario at the range.
4 if projectiles are scattered in SDZ
3 if range has an impact berm
1 if range has a bullet trap 4
Lead Management
Frequency of activities that result in the removal of lead from an EARTHERN BERM or SDZ.
This includes MINOR removal (e.g. scraping and sifting of berm/area, soil amendments) as well as MAJOR removals (e.g. lead mining).
0 if no notable mining
-1 if a MINOR action completed once during either of the last two periodic reviews
-2 if MINOR action completed during each of the two previous periodic reviews
-3 if MAJOR action was completed once during either of the last two periodic reviews
-4 if MAJOR action completed during each of the two previous periodic reviews
0
Frequency of activities that result in the significant removal of lead from a BULLET TRAP.
-3 if bullet trap was not been serviced during last two periodic reviews
-5 if bullet trap was serviced once during either of the last two periodic reviews
-7 if bullet trap was serviced during each of the last two periodic reviews
Duration of Range Use
Length of time the range has been used.
2 if > 5 years
0 if ≤ 5 years 2
Source Element Score Minimum: -4 Maximum: 20 11
Notes: Approximately 1,572 pounds of lead were deposited annually on Range 103 between 2011 and 2014.
It is unknown when operational training was initiated on Range 103.
The range does not have a specific impact berm; lead recovery is not conducted at this range.

APPENDIX C
Small Arms Range Assessment Protocol
RANGE 103 MCAGCC TWENTYNINE PALMS
Table 2: Surface Water / Sediment Pathways Characteristics Element
(These definitions only apply for the purposes of the Small Arms Range Assessment Protocol.)
Criteria Evaluation Characteristics Score Criteria Site Score
Precipitation Rate of precipitation.
8 if precipitation > 40 inches/year
6 if precipitation = 20-40 inches/year
4 if precipitation < 20 inches/year 4
Vegetation Approximate vegetation cover within and directly downslope of the projectile deposition area.
6 if vegetation cover < 10%
4 if vegetation cover = 10% to 90%
2 if vegetation cover > 90% 6
Slope of Range
Average slope from deposition area along the overland pathway to the first defined channel.
5 if slope > 10% (5.71°)
3 if slope = 5% to 10%
2 if slope < 5% (2.86°) 2
pH of Soil pH below 6.5 and above 8.5 increases the rate of lead dissolution.
3 if pH < 4 or >10
2 if pH ≥ 4 < 6.5 or > 8.5 ≤ 10
1 if pH 6.5 ≤ pH ≤ 8.5 1
Soil Type/ Erosion
Erosion potential is greatest for fine sands and silt. Clay has the lowest erosion potential. The area where projectiles are deposited should be scored.
2 if soil type is fine sand / silt
1 if soil type is clayey sand or silt / coarse sands
0 if soil type is clay
1
Erosion observed at the projectile deposition area.
5 if there is visual evidence of eroded material being transported from the
projectile deposition area
3 if bullet pockets or other indicators of erosion were observed
1 if no erosion was observed
1
Engineering Controls
The presence of engineering controls or BMPs to modify or control surface water run-on.
Controls may include barriers or diversions that reduce run-on to the range.
0 if no engineering controls
-1 if partial engineering controls
-2 if effective engineering controls -1

APPENDIX C
Small Arms Range Assessment Protocol
RANGE 103 MCAGCC TWENTYNINE PALMS
Table 2: Surface Water / Sediment Pathways Characteristics Element
(These definitions only apply for the purposes of the Small Arms Range Assessment Protocol.)
Criteria Evaluation Characteristics Score Criteria Site Score
The presence of engineering controls or BMPs to modify or control surface water run-off or erosion.
Run-off controls may include silt fencing, rip-rap, sedimentation basins, or detention ponds that control run-off from the range. Erosion controls may include soil mix, irrigation, or netting.
0 if no engineering controls
-2 if partial engineering controls
-4 if effective engineering controls 0
Surface Water Pathway Score Minimum: 4 Maximum: 29 14
Notes: The average amount of rainfall at Twentynine Palms between 3 and 4 inches per year (USDA NRCS, 1999).
The range is covered by less than 10% vegetation. The area contains patches of creosote bushes and other scrub.
The average slope from the Range 103 deposition area to the surface drainage gully to the west is approximately 4.5%.
The range contains soils characterized as Arizo, dry-Twobitter association, 2 to 8 percent slopes. This soil consists of stratified extremely gravelly coarse sand to very gravelly coarse sand. Based on the USDA soil survey, the pH of the soil map symbol ranges from 7.9 to 8.4 (USDA NRCS, 1999). Surface soil pH readings collected during the 2014 site visit on the range floor of the adjacent Range 101 were 6.76 at approximately 100 yards down-range, and 6.85 at approximately 250 yards down-range.
A large surface drainage gully flows from the central section of the range fan towards the west. Based on aerial photographs it appears a drainage pathway is in place surrounding the northern perimeter of the target locations diverting surface water flow around the range thus reducing run-on. There appear to be no engineering controls in place to prevent run-off/erosion.
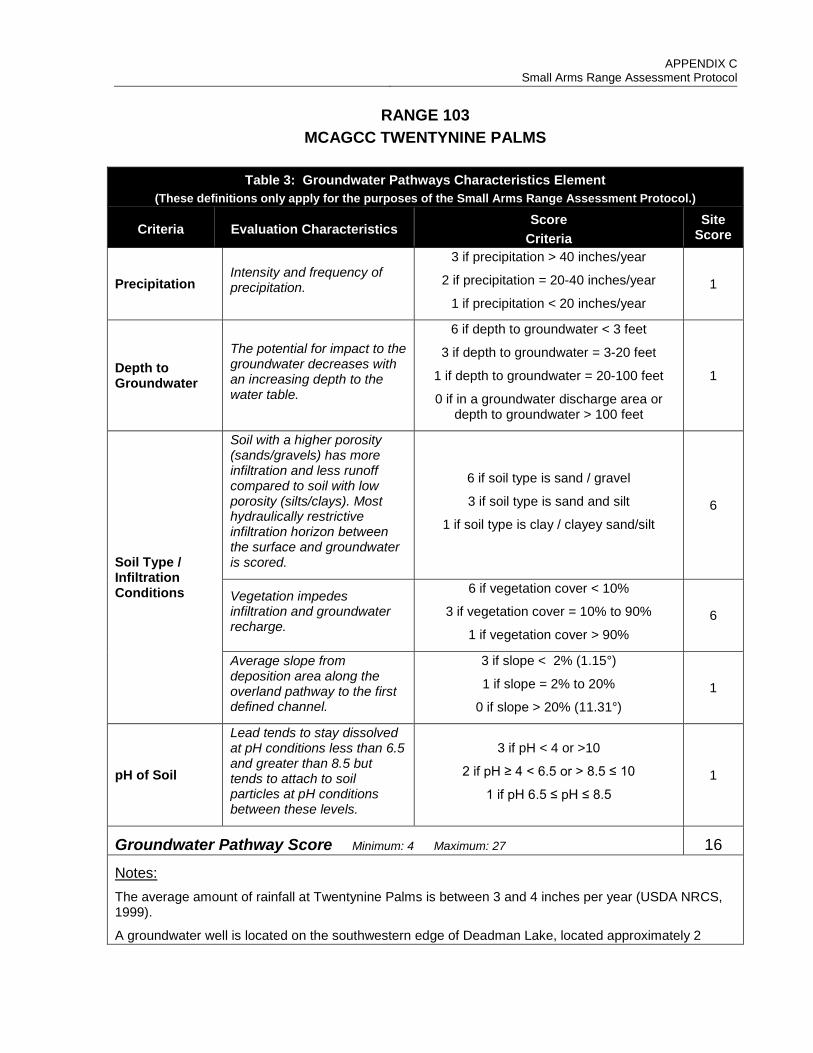
APPENDIX C
Small Arms Range Assessment Protocol
RANGE 103 MCAGCC TWENTYNINE PALMS
Table 3: Groundwater Pathways Characteristics Element
(These definitions only apply for the purposes of the Small Arms Range Assessment Protocol.)
Criteria Evaluation Characteristics Score
Criteria Site
Score
Precipitation Intensity and frequency of precipitation.
3 if precipitation > 40 inches/year
2 if precipitation = 20-40 inches/year
1 if precipitation < 20 inches/year 1
Depth to Groundwater
The potential for impact to the groundwater decreases with an increasing depth to the water table.
6 if depth to groundwater < 3 feet
3 if depth to groundwater = 3-20 feet
1 if depth to groundwater = 20-100 feet
0 if in a groundwater discharge area or depth to groundwater > 100 feet
1
Soil Type / Infiltration Conditions
Soil with a higher porosity (sands/gravels) has more infiltration and less runoff compared to soil with low porosity (silts/clays). Most hydraulically restrictive infiltration horizon between the surface and groundwater is scored.
6 if soil type is sand / gravel
3 if soil type is sand and silt
1 if soil type is clay / clayey sand/silt 6
Vegetation impedes infiltration and groundwater recharge.
6 if vegetation cover < 10%
3 if vegetation cover = 10% to 90%
1 if vegetation cover > 90% 6
Average slope from deposition area along the overland pathway to the first defined channel.
3 if slope < 2% (1.15°)
1 if slope = 2% to 20%
0 if slope > 20% (11.31°) 1
pH of Soil
Lead tends to stay dissolved at pH conditions less than 6.5 and greater than 8.5 but tends to attach to soil particles at pH conditions between these levels.
3 if pH < 4 or >10
2 if pH ≥ 4 < 6.5 or > 8.5 ≤ 10
1 if pH 6.5 ≤ pH ≤ 8.5 1
Groundwater Pathway Score Minimum: 4 Maximum: 27 16
Notes: The average amount of rainfall at Twentynine Palms is between 3 and 4 inches per year (USDA NRCS, 1999).
A groundwater well is located on the southwestern edge of Deadman Lake, located approximately 2
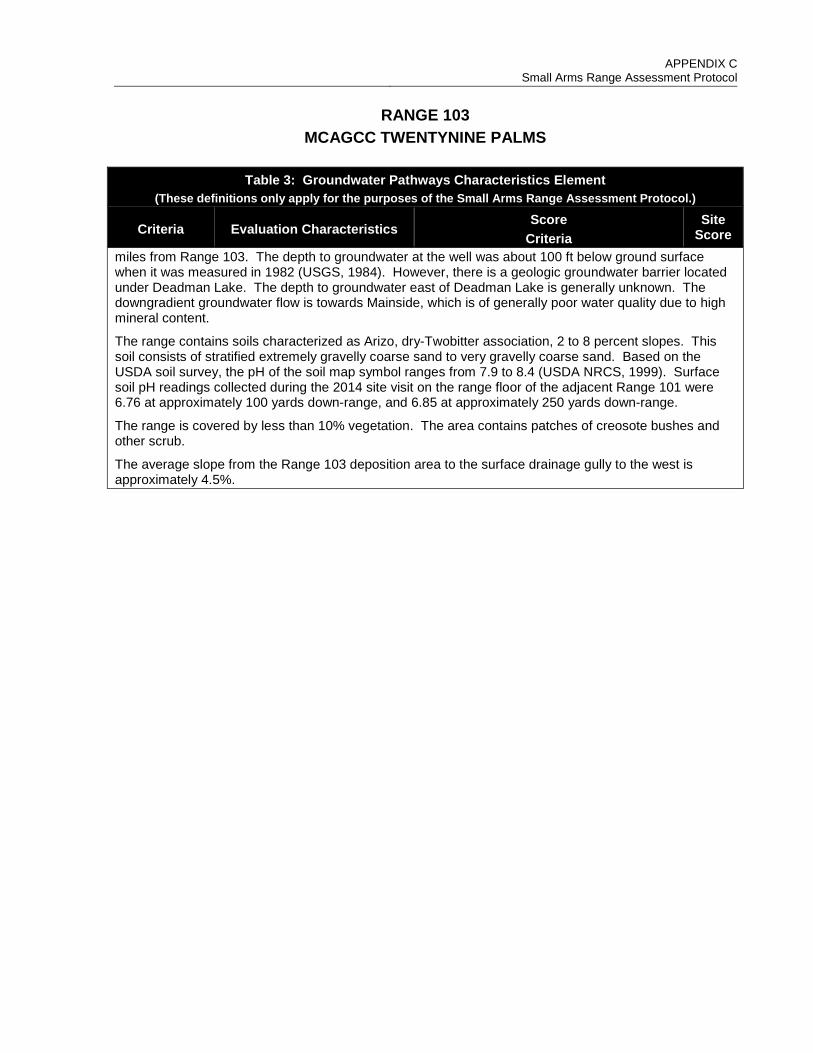
APPENDIX C
Small Arms Range Assessment Protocol
RANGE 103 MCAGCC TWENTYNINE PALMS
Table 3: Groundwater Pathways Characteristics Element
(These definitions only apply for the purposes of the Small Arms Range Assessment Protocol.)
Criteria Evaluation Characteristics Score
Criteria Site
Score miles from Range 103. The depth to groundwater at the well was about 100 ft below ground surface when it was measured in 1982 (USGS, 1984). However, there is a geologic groundwater barrier located under Deadman Lake. The depth to groundwater east of Deadman Lake is generally unknown. The downgradient groundwater flow is towards Mainside, which is of generally poor water quality due to high mineral content.
The range contains soils characterized as Arizo, dry-Twobitter association, 2 to 8 percent slopes. This soil consists of stratified extremely gravelly coarse sand to very gravelly coarse sand. Based on the USDA soil survey, the pH of the soil map symbol ranges from 7.9 to 8.4 (USDA NRCS, 1999). Surface soil pH readings collected during the 2014 site visit on the range floor of the adjacent Range 101 were 6.76 at approximately 100 yards down-range, and 6.85 at approximately 250 yards down-range.
The range is covered by less than 10% vegetation. The area contains patches of creosote bushes and other scrub.
The average slope from the Range 103 deposition area to the surface drainage gully to the west is approximately 4.5%.

APPENDIX C
Small Arms Range Assessment Protocol
RANGE 103 MCAGCC TWENTYNINE PALMS
Table 4: Surface Water / Sediment Receptors Element
(These definitions only apply for the purposes of the Small Arms Range Assessment Protocol.)
Criteria Evaluation Characteristics
Score Criteria
Site Score
Surface Water Body
Identify if a nearby surface water body is present down gradient, as defined on the National Hydrography Dataset (NHD) map.
8 if surface water body is located downgradient of the range within 1,500 feet
4 if surface water body is located downgradient of the range 1,500-5,000 feet
0 if surface water body is located downgradient of the range over 5,000 feet
8
Drinking Water Use
Identify if a down gradient surface water body is used as a drinking water source (drainage distance).
4 if surface water body used as a drinking water source is located downgradient of the range within 1 mile
2 if surface water body used as a drinking water source is located downgradient of the range within 1 to 6 miles
0 if no known drinking water intakes are identified within 6 miles of the range
0
Drainage Distance to Installation Boundary
Identify downgradient drainage distance to first potential ecological exposure off installation (i.e., installation boundary).
4 if the installation boundary is located downgradient of the range within 0.5 miles
2 if the installation boundary is located downgradient of the range within 0.5 to 3 miles
0 if the installation boundary is located downgradient of the range greater than 3 miles, or if surface water runoff
from the range does not discharge off the installation
0
Surface Water Receptor Score Minimum: 0 Maximum: 16 8
Notes: According to the USGS National Hydrography Map, the closest surface water body to Range 103 is an ephemeral stream located approximately 1,400 feet downgradient to the south of the bullet deposition area (USGS, 2014).
Surface water is not used as a drinking water source at the installation, nor are there any surface water bodies used as drinking water sources within 6 miles of this range.
Surface water from this range drains south towards an ephemeral stream that generally flows 0.4 miles southwest. According to the USGS National Hydrography Map, the ephemeral stream terminates just prior to reaching Deadman Lake which is an additional 0.73 miles downgradient from that point. Upon reaching Deadman Lake, the surface water from Range 103 either infiltrates or evaporates. Since the installation boundary is upgradient from Deadman Lake, the drainage pathway from Range 103 does not cross the installation boundary.

APPENDIX C
Small Arms Range Assessment Protocol
RANGE 103 MCAGCC TWENTYNINE PALMS
Table 5: Groundwater Receptors Element
(These definitions only apply for the purposes of the Small Arms Range Assessment Protocol.)
Criteria Evaluation Characteristics
Score Criteria
Site Score
Wells Identified as Potable Water Sources
Number and location of potable water or potable water supply wells relative to the location of the range.
6 if a drinking water well is located within <50 feet of the range
3 if a drinking water well is located downgradient of the range within 50-1,500 feet
0 if there are no drinking water wells located within 1,500 feet downgradient of the range or if
groundwater is not used as a drinking water source.
0
Into what type of aquifer is the well set
6 if unconfined
3 if semi-confined
0 if confined 6
Groundwater wells identified for purpose other than drinking water
Groundwater wells used for purposes other than drinking water supply identified down gradient of the range.
3 if a groundwater well is located within 50 feet of the range
1 if a groundwater well is located downgradient of the range within 50-1,500 feet
0 if groundwater well <1,500 feet downgradient of the range is not used for any purpose.
0
Groundwater Receptor Score Minimum: 0 Maximum: 15 6
Notes: The depth to water at the well on the southwestern edge of Deadman Lake is 100 feet below ground surface; given the higher elevation, it is likely the depth to water is greater 1.25 miles to the east where the range is located.
There are no water supply wells near Range 103. Water supply wells are located in the Surprise Springs groundwater basin, located approximately 7.5 miles to the west. All wells draw water from the unconfined portions of the upper and middle aquifers. Surprise Springs is located upgradient of the range and is hydrogeologically separated from the range by a large fault. The downgradient groundwater basin, Mesquite Basin, is not used as a drinking water source because of high mineral content.
There are no known agricultural wells located on MCAGCC. Surface water and stormwater are used for irrigation purposes. The surface water that accumulates in Deadman Lake generally evaporates.

APPENDIX C
Small Arms Range Assessment Protocol
RANGE 103 MCAGCC TWENTYNINE PALMS
Table 6: Evaluation Score (These definitions only apply for the purposes of the Small Arms Range Assessment Protocol.)
Surface Water / Sediment
Element Table Score
Range Use and Range Management (Source) 1 11
Surface Water / Sediment Pathways 2 14
Surface Water / Sediment Receptors 4 8
Sum of Surface Water / Sediment Element Scores Minimum: 0 Maximum: 65 33
Groundwater
Element Table Score
Range Use and Range Management (Source) 1 11
Groundwater Pathways 3 16
Groundwater Receptors 5 6
Sum of Groundwater Element Scores Minimum: 0 Maximum: 62 33
Field Sampling and Observed Releases
Surface Water / Sediment
Surface water sampling conducted Yes No Sediment sampling conducted Yes No Results exceed DoD screening value Yes No
Surface Water / Sediment
No Modification High
Groundwater No Modification High
Groundwater Groundwater sampling conducted Yes No Results exceed DoD screening value Yes No
The relative evaluation ranking for each media is determined by selecting the appropriate score based on the data elements for that media:
Evaluation Ranking* Score Range High 45-65 Moderate 33-44 Minimal 0-32
Surface Water Evaluation Ranking Moderate
Groundwater Evaluation Ranking Moderate
Notes:

APPENDIX C
Small Arms Range Assessment Protocol RANGE 106A MCAGCC TWENTYNINE PALMS Twentynine Palms – San Bernardino County, California Date of SARAP update: 9 September 2014
DESCRIPTION Range Mission: Machine gun certification Training Start Date: Training as SAR started in 2012 Direction of Fire: Northeast Firing Positions: 12 Target Range: Variable Impact Area(s):
Open area Hillside Building Earthen berm Bullet trap
Existing BMPs:
Basin/vault Control fabric Diversion Fencing Rip-rap Silt check Vegetation
Other: Reference(s):
FINDINGS Review Period Periodic Review Estimated Lead Deposition (lb/yr)
3,987
Surface Water /
Sediment
RANK Moderate Source 14
Pathway 15 Receptor 4
TOTAL SCORE 33
Groundwater
RANK Moderate Source 14
Pathway 16 Receptor 6
TOTAL SCORE 36 RECOMMENDATIONS
Periodically review operations for significant changes in training, management, and use.
Gather additional data regarding range use, pathways, or receptors associated with the range: ___________________________________________
Collect site-specific field data to further assess potential off-range migration.

APPENDIX C
Small Arms Range Assessment Protocol
RANGE 106A MCAGCC TWENTYNINE PALMS
Table 1: Range Use and Range Management (Source) Element
(These definitions only apply for the purposes of the Small Arms Range Assessment Protocol.)
Criteria Evaluation Characteristics Score Criteria Site Score
MC Loading Rates
The amount of small arms ammunition expended on the range.
Estimate the MC loading as average lead deposition rate.
14 if MC loading > 8,000 pounds/year
11 if MC loading = 4,001-8,000 pounds/year
8 if MC loading = 2,001-4,000 pounds/year
5 if MC loading = 501-2,000 pounds/year
2 if MC loading < 501 pounds/year
8
Impact Area The bullet deposition scenario at the range.
4 if projectiles are scattered in SDZ
3 if range has an impact berm
1 if range has a bullet trap 4
Lead Management
Frequency of activities that result in the removal of lead from an EARTHERN BERM or SDZ.
This includes MINOR removal (e.g. scraping and sifting of berm/area, soil amendments) as well as MAJOR removals (e.g. lead mining).
0 if no notable mining
-1 if a MINOR action completed once during either of the last two periodic reviews
-2 if MINOR action completed during each of the two previous periodic reviews
-3 if MAJOR action was completed once during either of the last two periodic reviews
-4 if MAJOR action completed during each of the two previous periodic reviews
0
Frequency of activities that result in the significant removal of lead from a BULLET TRAP.
-3 if bullet trap was not been serviced during last two periodic reviews
-5 if bullet trap was serviced once during either of the last two periodic reviews
-7 if bullet trap was serviced during each of the last two periodic reviews
Duration of Range Use
Length of time the range has been used.
2 if > 5 years
0 if ≤ 5 years 2
Source Element Score Minimum: -4 Maximum: 20 14
Notes: Approximately 3,987 pounds of lead were deposited annually on Range 106A between 2012 and 2014.
Range 106A has been used for small arms operational training since 2012.
The range does not have a specific impact berm; lead recovery is not conducted at this range.

APPENDIX C
Small Arms Range Assessment Protocol
RANGE 106A MCAGCC TWENTYNINE PALMS
Table 2: Surface Water / Sediment Pathways Characteristics Element
(These definitions only apply for the purposes of the Small Arms Range Assessment Protocol.)
Criteria Evaluation Characteristics Score Criteria Site Score
Precipitation Rate of precipitation.
8 if precipitation > 40 inches/year
6 if precipitation = 20-40 inches/year
4 if precipitation < 20 inches/year 4
Vegetation Approximate vegetation cover within and directly downslope of the projectile deposition area.
6 if vegetation cover < 10%
4 if vegetation cover = 10% to 90%
2 if vegetation cover > 90% 6
Slope of Range
Average slope from deposition area along the overland pathway to the first defined channel.
5 if slope > 10% (5.71°)
3 if slope = 5% to 10%
2 if slope < 5% (2.86°) 2
pH of Soil pH below 6.5 and above 8.5 increases the rate of lead dissolution.
3 if pH < 4 or >10
2 if pH ≥ 4 < 6.5 or > 8.5 ≤ 10
1 if pH 6.5 ≤ pH ≤ 8.5 1
Soil Type/ Erosion
Erosion potential is greatest for fine sands and silt. Clay has the lowest erosion potential. The area where projectiles are deposited should be scored.
2 if soil type is fine sand / silt
1 if soil type is clayey sand or silt / coarse sands
0 if soil type is clay
1
Erosion observed at the projectile deposition area.
5 if there is visual evidence of eroded material being transported from the
projectile deposition area
3 if bullet pockets or other indicators of erosion were observed
1 if no erosion was observed
1
Engineering Controls
The presence of engineering controls or BMPs to modify or control surface water run-on.
Controls may include barriers or diversions that reduce run-on to the range.
0 if no engineering controls
-1 if partial engineering controls
-2 if effective engineering controls 0
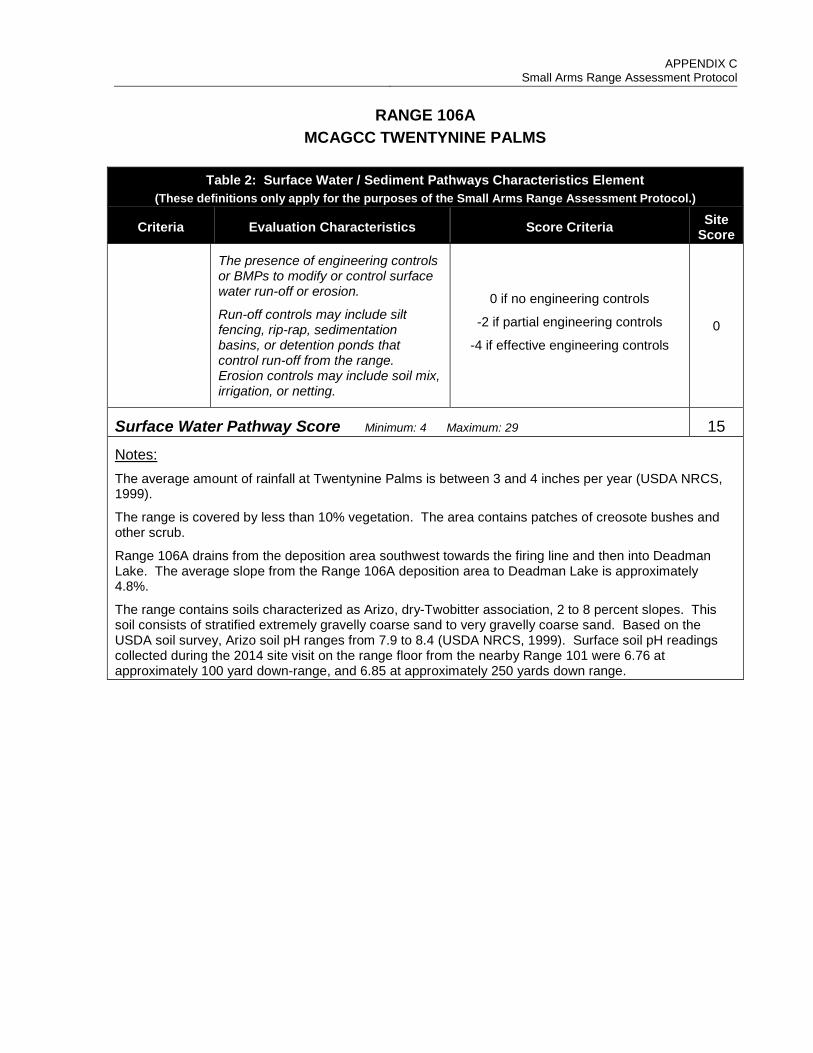
APPENDIX C
Small Arms Range Assessment Protocol
RANGE 106A MCAGCC TWENTYNINE PALMS
Table 2: Surface Water / Sediment Pathways Characteristics Element
(These definitions only apply for the purposes of the Small Arms Range Assessment Protocol.)
Criteria Evaluation Characteristics Score Criteria Site Score
The presence of engineering controls or BMPs to modify or control surface water run-off or erosion.
Run-off controls may include silt fencing, rip-rap, sedimentation basins, or detention ponds that control run-off from the range. Erosion controls may include soil mix, irrigation, or netting.
0 if no engineering controls
-2 if partial engineering controls
-4 if effective engineering controls 0
Surface Water Pathway Score Minimum: 4 Maximum: 29 15
Notes: The average amount of rainfall at Twentynine Palms is between 3 and 4 inches per year (USDA NRCS, 1999).
The range is covered by less than 10% vegetation. The area contains patches of creosote bushes and other scrub.
Range 106A drains from the deposition area southwest towards the firing line and then into Deadman Lake. The average slope from the Range 106A deposition area to Deadman Lake is approximately 4.8%.
The range contains soils characterized as Arizo, dry-Twobitter association, 2 to 8 percent slopes. This soil consists of stratified extremely gravelly coarse sand to very gravelly coarse sand. Based on the USDA soil survey, Arizo soil pH ranges from 7.9 to 8.4 (USDA NRCS, 1999). Surface soil pH readings collected during the 2014 site visit on the range floor from the nearby Range 101 were 6.76 at approximately 100 yard down-range, and 6.85 at approximately 250 yards down range.

APPENDIX C
Small Arms Range Assessment Protocol
RANGE 106A MCAGCC TWENTYNINE PALMS
Table 3: Groundwater Pathways Characteristics Element
(These definitions only apply for the purposes of the Small Arms Range Assessment Protocol.)
Criteria Evaluation Characteristics Score
Criteria Site
Score
Precipitation Intensity and frequency of precipitation.
3 if precipitation > 40 inches/year
2 if precipitation = 20-40 inches/year
1 if precipitation < 20 inches/year 1
Depth to Groundwater
The potential for impact to the groundwater decreases with an increasing depth to the water table.
6 if depth to groundwater < 3 feet
3 if depth to groundwater = 3-20 feet
1 if depth to groundwater = 20-100 feet
0 if in a groundwater discharge area or depth to groundwater > 100 feet
1
Soil Type / Infiltration Conditions
Soil with a higher porosity (sands/gravels) has more infiltration and less runoff compared to soil with low porosity (silts/clays). Most hydraulically restrictive infiltration horizon between the surface and groundwater is scored.
6 if soil type is sand / gravel
3 if soil type is sand and silt
1 if soil type is clay / clayey sand/silt 6
Vegetation impedes infiltration and groundwater recharge.
6 if vegetation cover < 10%
3 if vegetation cover = 10% to 90%
1 if vegetation cover > 90% 6
Average slope from deposition area along the overland pathway to the first defined channel.
3 if slope < 2% (1.15°)
1 if slope = 2% to 20%
0 if slope > 20% (11.31°) 1
pH of Soil
Lead tends to stay dissolved at pH conditions less than 6.5 and greater than 8.5 but tends to attach to soil particles at pH conditions between these levels.
3 if pH < 4 or >10
2 if pH ≥ 4 < 6.5 or > 8.5 ≤ 10
1 if pH 6.5 ≤ pH ≤ 8.5 1
Groundwater Pathway Score Minimum: 4 Maximum: 27 16
Notes: The average amount of rainfall at Twentynine Palms is between 3 and 4 inches per year (USDA NRCS, 1999).
A groundwater well is located on the southwestern edge of Deadman Lake, located approximately 1.5

APPENDIX C
Small Arms Range Assessment Protocol
RANGE 106A MCAGCC TWENTYNINE PALMS
Table 3: Groundwater Pathways Characteristics Element
(These definitions only apply for the purposes of the Small Arms Range Assessment Protocol.)
Criteria Evaluation Characteristics Score
Criteria Site
Score miles west of Range 106A. The depth to groundwater at the well was about 100 ft below ground surface when it was measured in 1982 (USGS, 1984). However, there is a geologic groundwater barrier located under Deadman Lake. The depth to groundwater east of Deadman Lake is generally unknown. The downgradient groundwater flow is towards Mainside, which is of generally poor water quality due to high mineral content.
The range contains soils characterized as Arizo, dry-Twobitter association, 2 to 8 percent slopes. This soil consists of stratified extremely gravelly coarse sand to very gravelly coarse sand.
The range is covered by less than 10% vegetation. The area contains patches of creosote bushes and other scrub.
Range 106A drains from the deposition area southwest towards the firing line and then into Deadman Lake. The average slope from the Range 106A deposition area to Deadman Lake is approximately 4.8%.
Based on the USDA soil survey, Arizo soil pH ranges from 7.9 to 8.4 (USDA NRCS, 1999). Surface soil pH readings collected during the 2014 site visit on the range floor from the nearby Range 101 were 6.76 at approximately 100 yards down-range, and 6.85 at approximately 250 yards down-range.

APPENDIX C
Small Arms Range Assessment Protocol
RANGE 106A MCAGCC TWENTYNINE PALMS
Table 4: Surface Water / Sediment Receptors Element
(These definitions only apply for the purposes of the Small Arms Range Assessment Protocol.)
Criteria Evaluation Characteristics
Score Criteria
Site Score
Surface Water Body
Identify if a nearby surface water body is present down gradient, as defined on the National Hydrography Dataset (NHD) map.
8 if surface water body is located downgradient of the range within 1,500 feet
4 if surface water body is located downgradient of the range 1,500-5,000 feet
0 if surface water body is located downgradient of the range over 5,000 feet
4
Drinking Water Use
Identify if a down gradient surface water body is used as a drinking water source (drainage distance).
4 if surface water body used as a drinking water source is located downgradient of the range within 1 mile
2 if surface water body used as a drinking water source is located downgradient of the range within 1 to 6 miles
0 if no known drinking water intakes are identified within 6 miles of the range
0
Drainage Distance to Installation Boundary
Identify downgradient drainage distance to first potential ecological exposure off installation (i.e., installation boundary).
4 if the installation boundary is located downgradient of the range within 0.5 miles
2 if the installation boundary is located downgradient of the range within 0.5 to 3 miles
0 if the installation boundary is located downgradient of the range greater than 3 miles, or if surface water runoff
from the range does not discharge off the installation
0
Surface Water Receptor Score Minimum: 0 Maximum: 16 4
Notes: According to the USGS National Hydrography Map, the closest surface water body to Range 106A is Deadman Lake located approximately 1,600 feet downgradient to the southwest of the bullet deposition area (USGS, 2014).
Surface water is not used as a drinking water source at the installation, nor are there any surface water bodies used as drinking water sources within 6 miles of this range.
Surface water from this range drains southwest towards Deadman Lake which is approximately 0.3 miles downgradient from the range. Upon reaching Deadman Lake, the surface water from Range 106A either infiltrates or evaporates. Since the installation boundary is upgradient from Deadman Lake, the drainage pathway from Range 106A does not cross the installation boundary.
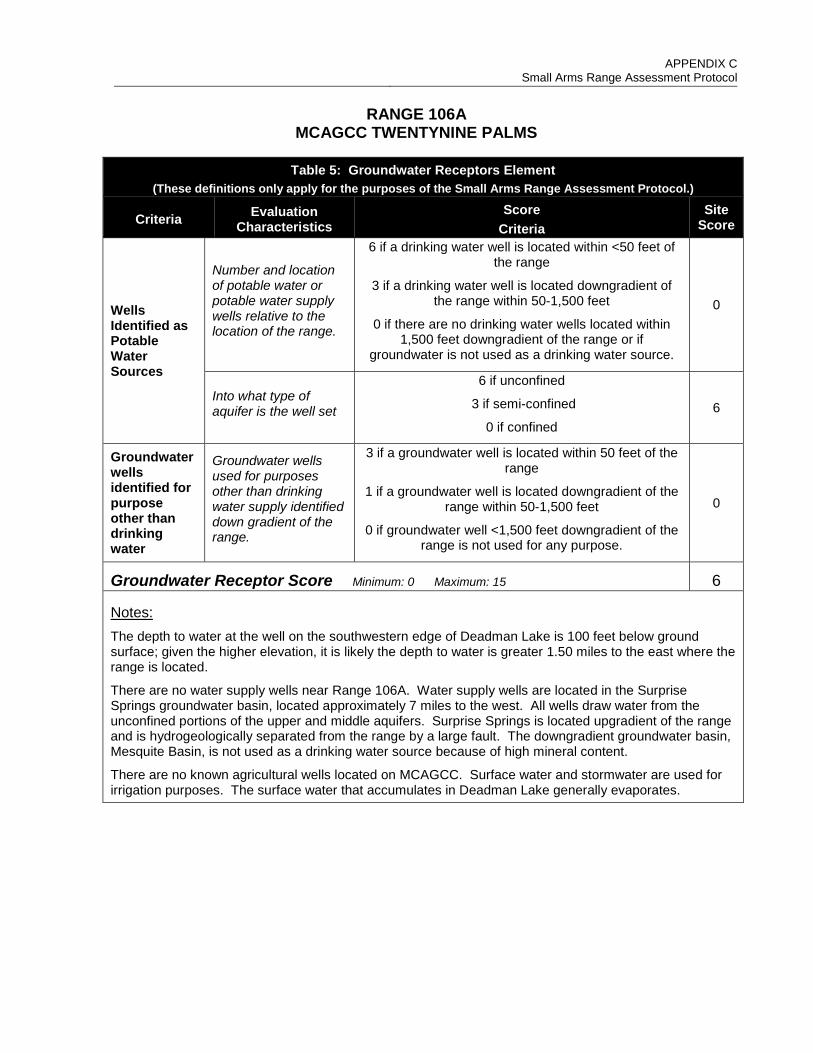
APPENDIX C
Small Arms Range Assessment Protocol
RANGE 106A MCAGCC TWENTYNINE PALMS
Table 5: Groundwater Receptors Element
(These definitions only apply for the purposes of the Small Arms Range Assessment Protocol.)
Criteria Evaluation Characteristics
Score Criteria
Site Score
Wells Identified as Potable Water Sources
Number and location of potable water or potable water supply wells relative to the location of the range.
6 if a drinking water well is located within <50 feet of the range
3 if a drinking water well is located downgradient of the range within 50-1,500 feet
0 if there are no drinking water wells located within 1,500 feet downgradient of the range or if
groundwater is not used as a drinking water source.
0
Into what type of aquifer is the well set
6 if unconfined
3 if semi-confined
0 if confined 6
Groundwater wells identified for purpose other than drinking water
Groundwater wells used for purposes other than drinking water supply identified down gradient of the range.
3 if a groundwater well is located within 50 feet of the range
1 if a groundwater well is located downgradient of the range within 50-1,500 feet
0 if groundwater well <1,500 feet downgradient of the range is not used for any purpose.
0
Groundwater Receptor Score Minimum: 0 Maximum: 15 6
Notes: The depth to water at the well on the southwestern edge of Deadman Lake is 100 feet below ground surface; given the higher elevation, it is likely the depth to water is greater 1.50 miles to the east where the range is located.
There are no water supply wells near Range 106A. Water supply wells are located in the Surprise Springs groundwater basin, located approximately 7 miles to the west. All wells draw water from the unconfined portions of the upper and middle aquifers. Surprise Springs is located upgradient of the range and is hydrogeologically separated from the range by a large fault. The downgradient groundwater basin, Mesquite Basin, is not used as a drinking water source because of high mineral content.
There are no known agricultural wells located on MCAGCC. Surface water and stormwater are used for irrigation purposes. The surface water that accumulates in Deadman Lake generally evaporates.

APPENDIX C
Small Arms Range Assessment Protocol
RANGE 106A MCAGCC TWENTYNINE PALMS
Table 6: Evaluation Score (These definitions only apply for the purposes of the Small Arms Range Assessment Protocol.)
Surface Water / Sediment
Element Table Score
Range Use and Range Management (Source) 1 14
Surface Water / Sediment Pathways 2 15
Surface Water / Sediment Receptors 4 4
Sum of Surface Water / Sediment Element Scores Minimum: 0 Maximum: 65 33
Groundwater
Element Table Score
Range Use and Range Management (Source) 1 14
Groundwater Pathways 3 16
Groundwater Receptors 5 6
Sum of Groundwater Element Scores Minimum: 0 Maximum: 62 36
Field Sampling and Observed Releases
Surface Water / Sediment
Surface water sampling conducted Yes No Sediment sampling conducted Yes No Results exceed DoD screening value Yes No
Surface Water / Sediment
No Modification High
Groundwater No Modification High
Groundwater Groundwater sampling conducted Yes No Results exceed DoD screening value Yes No
The relative evaluation ranking for each media is determined by selecting the appropriate score based on the data elements for that media:
Evaluation Ranking* Score Range High 45-65 Moderate 33-44 Minimal 0-32
Surface Water Evaluation Ranking Moderate
Groundwater Evaluation Ranking Moderate
Notes:
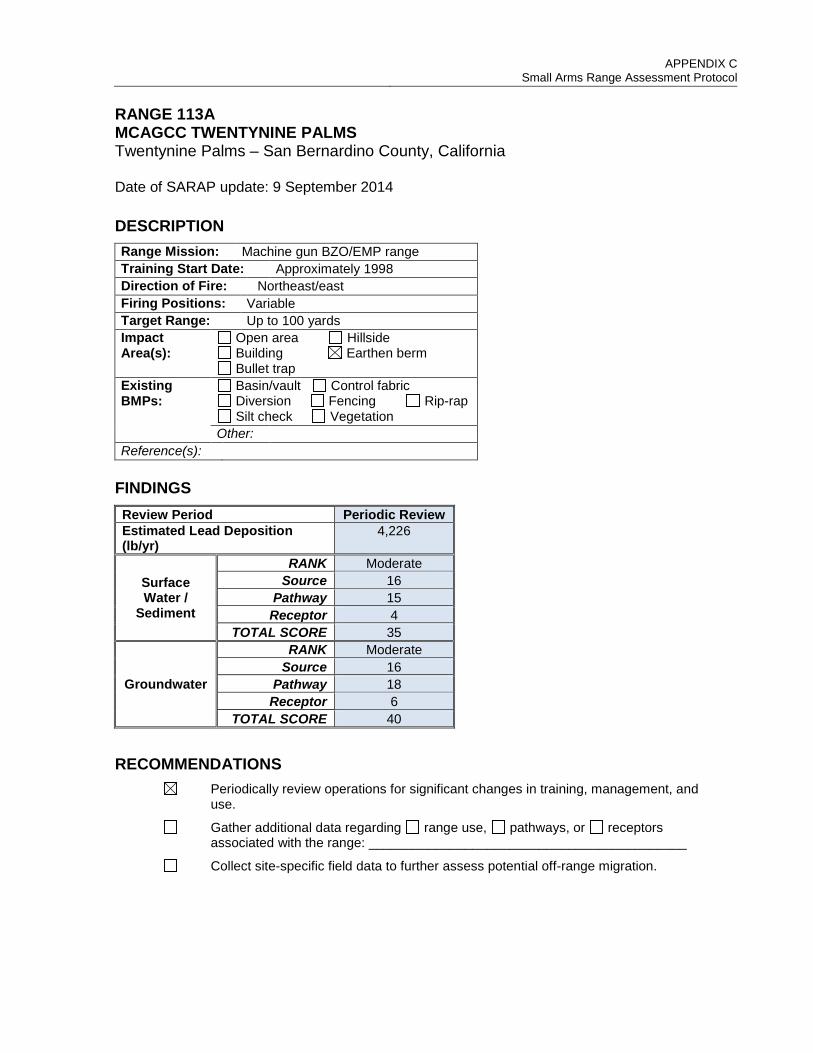
APPENDIX C
Small Arms Range Assessment Protocol RANGE 113A MCAGCC TWENTYNINE PALMS Twentynine Palms – San Bernardino County, California Date of SARAP update: 9 September 2014
DESCRIPTION Range Mission: Machine gun BZO/EMP range Training Start Date: Approximately 1998 Direction of Fire: Northeast/east Firing Positions: Variable Target Range: Up to 100 yards Impact Area(s):
Open area Hillside Building Earthen berm Bullet trap
Existing BMPs:
Basin/vault Control fabric Diversion Fencing Rip-rap Silt check Vegetation
Other: Reference(s):
FINDINGS Review Period Periodic Review Estimated Lead Deposition (lb/yr)
4,226
Surface Water /
Sediment
RANK Moderate Source 16
Pathway 15 Receptor 4
TOTAL SCORE 35
Groundwater
RANK Moderate Source 16
Pathway 18 Receptor 6
TOTAL SCORE 40 RECOMMENDATIONS
Periodically review operations for significant changes in training, management, and use.
Gather additional data regarding range use, pathways, or receptors associated with the range: ___________________________________________
Collect site-specific field data to further assess potential off-range migration.

APPENDIX C
Small Arms Range Assessment Protocol
RANGE 113A MCAGCC TWENTYNINE PALMS
Table 1: Range Use and Range Management (Source) Element
(These definitions only apply for the purposes of the Small Arms Range Assessment Protocol.)
Criteria Evaluation Characteristics Score Criteria Site Score
MC Loading Rates
The amount of small arms ammunition expended on the range.
Estimate the MC loading as average lead deposition rate.
14 if MC loading > 8,000 pounds/year
11 if MC loading = 4,001-8,000 pounds/year
8 if MC loading = 2,001-4,000 pounds/year
5 if MC loading = 501-2,000 pounds/year
2 if MC loading < 501 pounds/year
11
Impact Area The bullet deposition scenario at the range.
4 if projectiles are scattered in SDZ
3 if range has an impact berm
1 if range has a bullet trap 3
Lead Management
Frequency of activities that result in the removal of lead from an EARTHERN BERM or SDZ.
This includes MINOR removal (e.g. scraping and sifting of berm/area, soil amendments) as well as MAJOR removals (e.g. lead mining).
0 if no notable mining
-1 if a MINOR action completed once during either of the last two periodic reviews
-2 if MINOR action completed during each of the two previous periodic reviews
-3 if MAJOR action was completed once during either of the last two periodic reviews
-4 if MAJOR action completed during each of the two previous periodic reviews
0
Frequency of activities that result in the significant removal of lead from a BULLET TRAP.
-3 if bullet trap was not been serviced during last two periodic reviews
-5 if bullet trap was serviced once during either of the last two periodic reviews
-7 if bullet trap was serviced during each of the last two periodic reviews
Duration of Range Use
Length of time the range has been used.
2 if > 5 years
0 if ≤ 5 years 2
Source Element Score Minimum: -4 Maximum: 20 16
Notes: Approximately 4,226 pounds of lead were deposited annually on Range 113A between 2011 and 2014.
Date of construction of Range 113A is not known. Based on the date that Range 113 was established (1998), it is assumed that the BZO range is approximately the same age.
Lead recovery has not been conducted at this range. Sand is periodically added to the face of the berm where bullet pockets are formed from range use.

APPENDIX C
Small Arms Range Assessment Protocol
RANGE 113A MCAGCC TWENTYNINE PALMS
Table 2: Surface Water / Sediment Pathways Characteristics Element
(These definitions only apply for the purposes of the Small Arms Range Assessment Protocol.)
Criteria Evaluation Characteristics Score Criteria Site Score
Precipitation Rate of precipitation.
8 if precipitation > 40 inches/year
6 if precipitation = 20-40 inches/year
4 if precipitation < 20 inches/year 4
Vegetation Approximate vegetation cover within and directly downslope of the projectile deposition area.
6 if vegetation cover < 10%
4 if vegetation cover = 10% to 90%
2 if vegetation cover > 90% 6
Slope of Range
Average slope from deposition area along the overland pathway to the first defined channel.
5 if slope > 10% (5.71°)
3 if slope = 5% to 10%
2 if slope < 5% (2.86°) 3
pH of Soil pH below 6.5 and above 8.5 increases the rate of lead dissolution.
3 if pH < 4 or >10
2 if pH ≥ 4 < 6.5 or > 8.5 ≤ 10
1 if pH 6.5 ≤ pH ≤ 8.5 1
Soil Type/ Erosion
Erosion potential is greatest for fine sands and silt. Clay has the lowest erosion potential. The area where projectiles are deposited should be scored.
2 if soil type is fine sand / silt
1 if soil type is clayey sand or silt / coarse sands
0 if soil type is clay
1
Erosion observed at the projectile deposition area.
5 if there is visual evidence of eroded material being transported from the
projectile deposition area
3 if bullet pockets or other indicators of erosion were observed
1 if no erosion was observed
1
Engineering Controls
The presence of engineering controls or BMPs to modify or control surface water run-on.
Controls may include barriers or diversions that reduce run-on to the range.
0 if no engineering controls
-1 if partial engineering controls
-2 if effective engineering controls -1
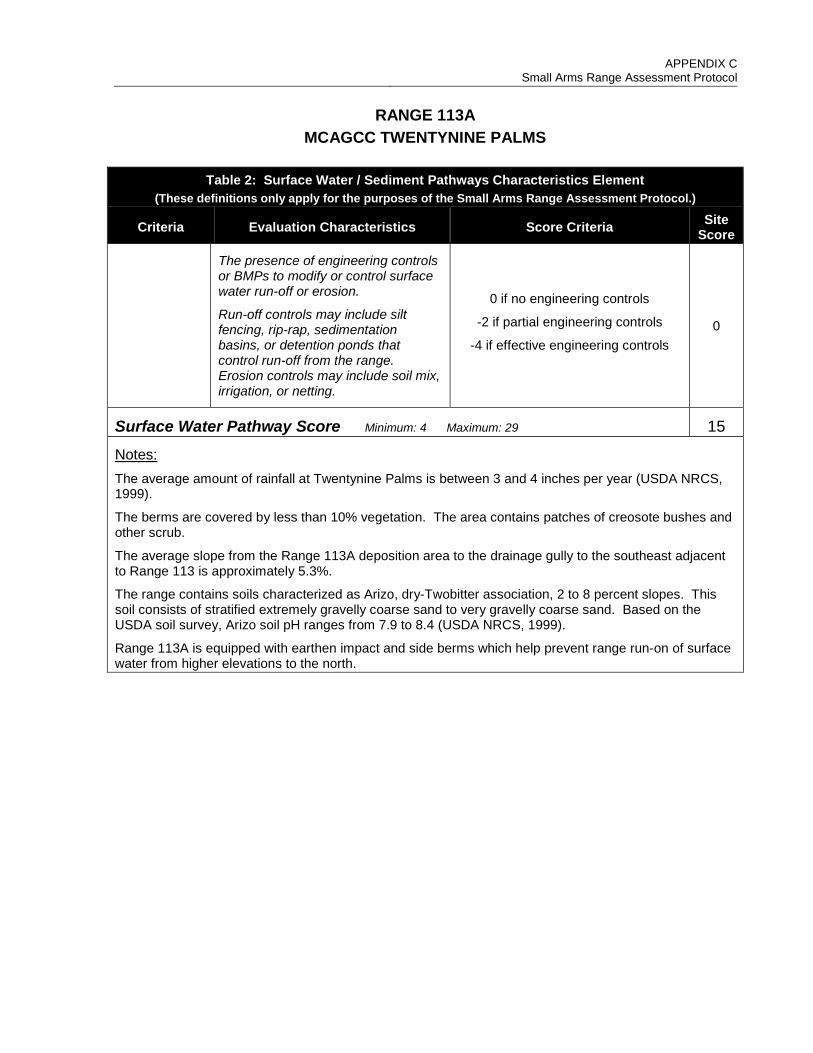
APPENDIX C
Small Arms Range Assessment Protocol
RANGE 113A MCAGCC TWENTYNINE PALMS
Table 2: Surface Water / Sediment Pathways Characteristics Element
(These definitions only apply for the purposes of the Small Arms Range Assessment Protocol.)
Criteria Evaluation Characteristics Score Criteria Site Score
The presence of engineering controls or BMPs to modify or control surface water run-off or erosion.
Run-off controls may include silt fencing, rip-rap, sedimentation basins, or detention ponds that control run-off from the range. Erosion controls may include soil mix, irrigation, or netting.
0 if no engineering controls
-2 if partial engineering controls
-4 if effective engineering controls 0
Surface Water Pathway Score Minimum: 4 Maximum: 29 15
Notes: The average amount of rainfall at Twentynine Palms is between 3 and 4 inches per year (USDA NRCS, 1999).
The berms are covered by less than 10% vegetation. The area contains patches of creosote bushes and other scrub.
The average slope from the Range 113A deposition area to the drainage gully to the southeast adjacent to Range 113 is approximately 5.3%.
The range contains soils characterized as Arizo, dry-Twobitter association, 2 to 8 percent slopes. This soil consists of stratified extremely gravelly coarse sand to very gravelly coarse sand. Based on the USDA soil survey, Arizo soil pH ranges from 7.9 to 8.4 (USDA NRCS, 1999).
Range 113A is equipped with earthen impact and side berms which help prevent range run-on of surface water from higher elevations to the north.

APPENDIX C
Small Arms Range Assessment Protocol
RANGE 113A MCAGCC TWENTYNINE PALMS
Table 3: Groundwater Pathways Characteristics Element
(These definitions only apply for the purposes of the Small Arms Range Assessment Protocol.)
Criteria Evaluation Characteristics Score
Criteria Site
Score
Precipitation Intensity and frequency of precipitation.
3 if precipitation > 40 inches/year
2 if precipitation = 20-40 inches/year
1 if precipitation < 20 inches/year 1
Depth to Groundwater
The potential for impact to the groundwater decreases with an increasing depth to the water table.
6 if depth to groundwater < 3 feet
3 if depth to groundwater = 3-20 feet
1 if depth to groundwater = 20-100 feet
0 if in a groundwater discharge area or depth to groundwater > 100 feet
1
Soil Type / Infiltration Conditions
Soil with a higher porosity (sands/gravels) has more infiltration and less runoff compared to soil with low porosity (silts/clays). Most hydraulically restrictive infiltration horizon between the surface and groundwater is scored.
6 if soil type is sand / gravel
3 if soil type is sand and silt
1 if soil type is clay / clayey sand/silt 6
Vegetation impedes infiltration and groundwater recharge.
6 if vegetation cover < 10%
3 if vegetation cover = 10% to 90%
1 if vegetation cover > 90% 6
Average slope from deposition area along the overland pathway to the first defined channel.
3 if slope < 2% (1.15°)
1 if slope = 2% to 20%
0 if slope > 20% (11.31°) 3
pH of Soil
Lead tends to stay dissolved at pH conditions less than 6.5 and greater than 8.5 but tends to attach to soil particles at pH conditions between these levels.
3 if pH < 4 or >10
2 if pH ≥ 4 < 6.5 or > 8.5 ≤ 10
1 if pH 6.5 ≤ pH ≤ 8.5 1
Groundwater Pathway Score Minimum: 4 Maximum: 27 18
Notes: The average amount of rainfall at Twentynine Palms is between 3 and 4 inches per year (USDA NRCS, 1999).
A groundwater well is located on the southwestern edge of Deadman Lake, located approximately 7

APPENDIX C
Small Arms Range Assessment Protocol
RANGE 113A MCAGCC TWENTYNINE PALMS
Table 3: Groundwater Pathways Characteristics Element
(These definitions only apply for the purposes of the Small Arms Range Assessment Protocol.)
Criteria Evaluation Characteristics Score
Criteria Site
Score miles south of Range 113A. Based on groundwater level measurements near Range 113A within the Deadman Lake subbasin, the depth to groundwater is estimated to range from 93 to 189 feet below ground surface (ARCADIS/Malcolm Pirnie, 2011). The downgradient groundwater flow is towards Mainside, which is of generally poor water quality due to high mineral content
The berms are covered by less than 10% vegetation. The area contains patches of creosote bushes and other scrub.
The average slope from the Range 113A deposition area to the drainage gully to the southeast adjacent to Range 113 is approximately 1.3%.
The range contains soils characterized as Arizo, dry-Twobitter association, 2 to 8 percent slopes. This soil consists of stratified extremely gravelly coarse sand to very gravelly coarse sand. Based on the USDA soil survey, Arizo soil pH ranges from 7.9 to 8.4 (USDA NRCS, 1999).
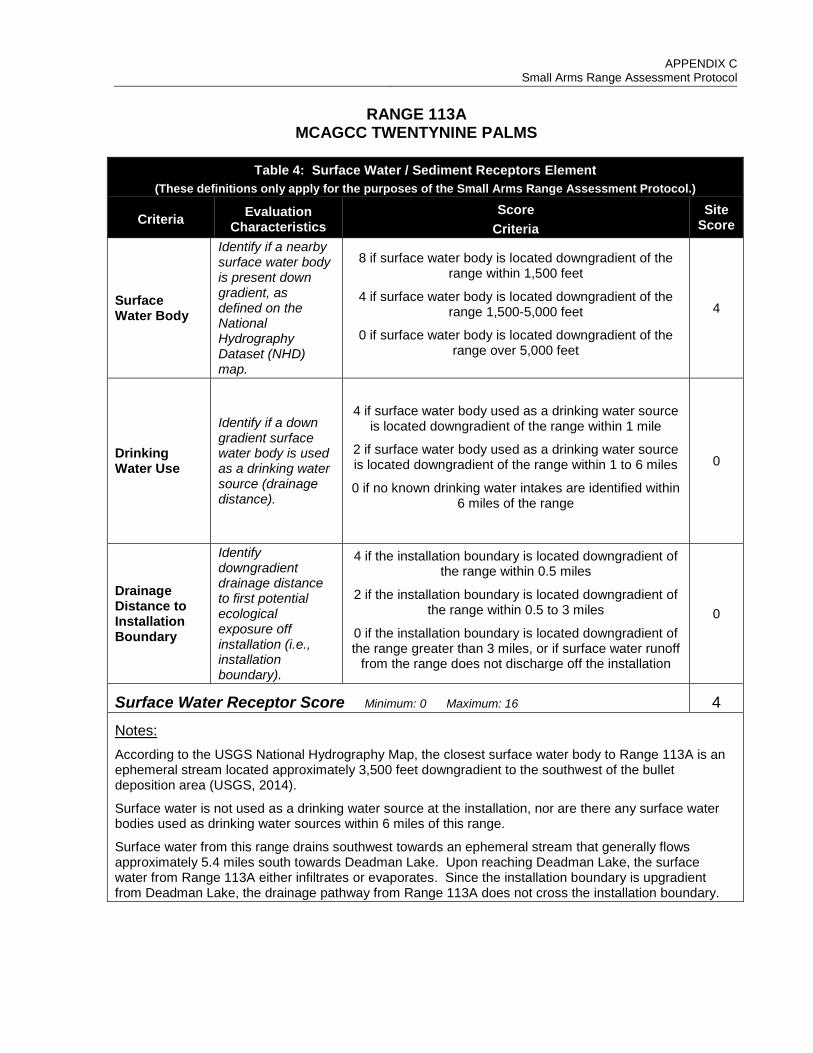
APPENDIX C
Small Arms Range Assessment Protocol
RANGE 113A MCAGCC TWENTYNINE PALMS
Table 4: Surface Water / Sediment Receptors Element
(These definitions only apply for the purposes of the Small Arms Range Assessment Protocol.)
Criteria Evaluation Characteristics
Score Criteria
Site Score
Surface Water Body
Identify if a nearby surface water body is present down gradient, as defined on the National Hydrography Dataset (NHD) map.
8 if surface water body is located downgradient of the range within 1,500 feet
4 if surface water body is located downgradient of the range 1,500-5,000 feet
0 if surface water body is located downgradient of the range over 5,000 feet
4
Drinking Water Use
Identify if a down gradient surface water body is used as a drinking water source (drainage distance).
4 if surface water body used as a drinking water source is located downgradient of the range within 1 mile
2 if surface water body used as a drinking water source is located downgradient of the range within 1 to 6 miles
0 if no known drinking water intakes are identified within 6 miles of the range
0
Drainage Distance to Installation Boundary
Identify downgradient drainage distance to first potential ecological exposure off installation (i.e., installation boundary).
4 if the installation boundary is located downgradient of the range within 0.5 miles
2 if the installation boundary is located downgradient of the range within 0.5 to 3 miles
0 if the installation boundary is located downgradient of the range greater than 3 miles, or if surface water runoff
from the range does not discharge off the installation
0
Surface Water Receptor Score Minimum: 0 Maximum: 16 4
Notes: According to the USGS National Hydrography Map, the closest surface water body to Range 113A is an ephemeral stream located approximately 3,500 feet downgradient to the southwest of the bullet deposition area (USGS, 2014).
Surface water is not used as a drinking water source at the installation, nor are there any surface water bodies used as drinking water sources within 6 miles of this range.
Surface water from this range drains southwest towards an ephemeral stream that generally flows approximately 5.4 miles south towards Deadman Lake. Upon reaching Deadman Lake, the surface water from Range 113A either infiltrates or evaporates. Since the installation boundary is upgradient from Deadman Lake, the drainage pathway from Range 113A does not cross the installation boundary.

APPENDIX C
Small Arms Range Assessment Protocol
RANGE 113A MCAGCC TWENTYNINE PALMS
Table 5: Groundwater Receptors Element
(These definitions only apply for the purposes of the Small Arms Range Assessment Protocol.)
Criteria Evaluation Characteristics
Score Criteria
Site Score
Wells Identified as Potable Water Sources
Number and location of potable water or potable water supply wells relative to the location of the range.
6 if a drinking water well is located within <50 feet of the range
3 if a drinking water well is located downgradient of the range within 50-1,500 feet
0 if there are no drinking water wells located within 1,500 feet downgradient of the range or if
groundwater is not used as a drinking water source.
0
Into what type of aquifer is the well set
6 if unconfined
3 if semi-confined
0 if confined 6
Groundwater wells identified for purpose other than drinking water
Groundwater wells used for purposes other than drinking water supply identified down gradient of the range.
3 if a groundwater well is located within 50 feet of the range
1 if a groundwater well is located downgradient of the range within 50-1,500 feet
0 if groundwater well <1,500 feet downgradient of the range is not used for any purpose.
0
Groundwater Receptor Score Minimum: 0 Maximum: 15 6
Notes: There are no water supply wells near Range 113A. Water supply wells are located in the Surprise Springs groundwater basin, located approximately 8.5 miles to the west. All wells draw water from the unconfined portions of the upper and middle aquifers. Surprise Springs is located upgradient of the range and is hydrogeologically separated from the range by a large fault. The downgradient groundwater basin, Mesquite Basin, is not used as a drinking water source because of high mineral content.
There are no known agricultural wells located on MCAGCC. Surface water and stormwater are used for irrigation purposes. The surface water that accumulates in Deadman Lake generally evaporates.
There are no groundwater discharge locations near the range which could result in lead migration from groundwater to surface water.

APPENDIX C
Small Arms Range Assessment Protocol
RANGE 113A MCAGCC TWENTYNINE PALMS
Table 6: Evaluation Score (These definitions only apply for the purposes of the Small Arms Range Assessment Protocol.)
Surface Water / Sediment
Element Table Score
Range Use and Range Management (Source) 1 16
Surface Water / Sediment Pathways 2 15
Surface Water / Sediment Receptors 4 4
Sum of Surface Water / Sediment Element Scores Minimum: 0 Maximum: 65 35
Groundwater
Element Table Score
Range Use and Range Management (Source) 1 16
Groundwater Pathways 3 18
Groundwater Receptors 5 6
Sum of Groundwater Element Scores Minimum: 0 Maximum: 62 40
Field Sampling and Observed Releases
Surface Water / Sediment
Surface water sampling conducted Yes No Sediment sampling conducted Yes No Results exceed DoD screening value Yes No
Surface Water / Sediment
No Modification High
Groundwater No Modification High
Groundwater Groundwater sampling conducted Yes No Results exceed DoD screening value Yes No
The relative evaluation ranking for each media is determined by selecting the appropriate score based on the data elements for that media:
Evaluation Ranking* Score Range High 45-65 Moderate 33-44 Minimal 0-32
Surface Water Evaluation Ranking Moderate
Groundwater Evaluation Ranking Moderate
Notes:
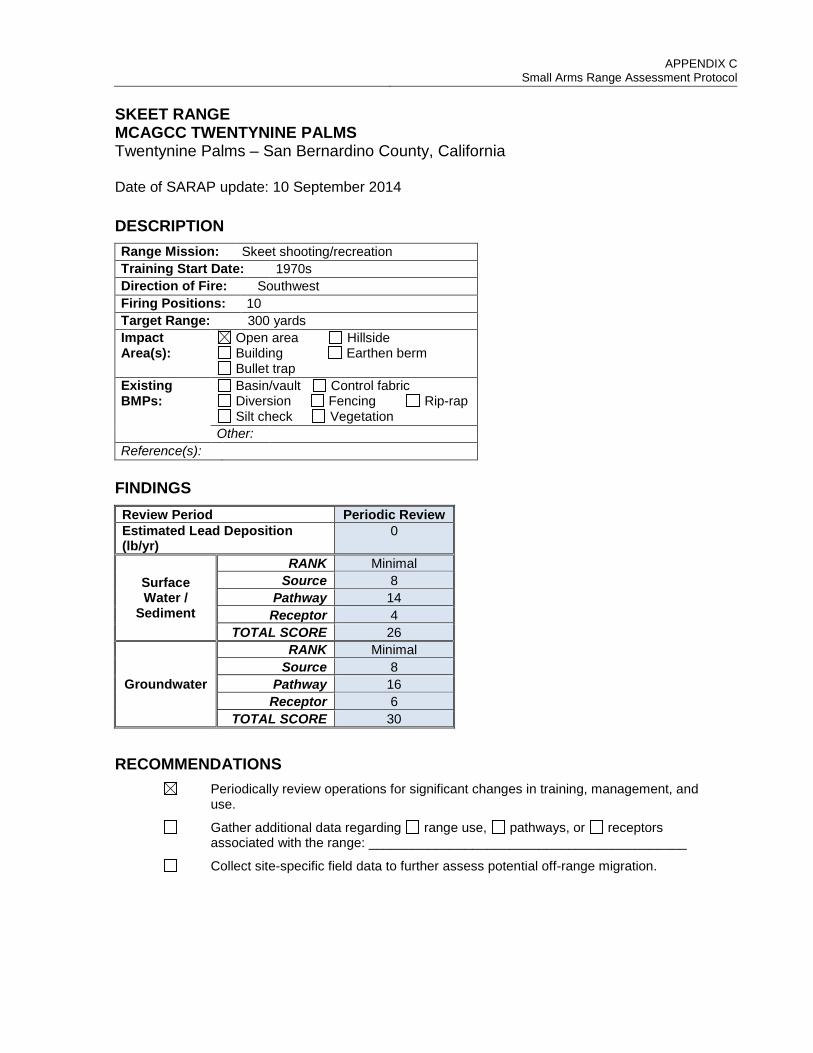
APPENDIX C
Small Arms Range Assessment Protocol SKEET RANGE MCAGCC TWENTYNINE PALMS Twentynine Palms – San Bernardino County, California Date of SARAP update: 10 September 2014
DESCRIPTION Range Mission: Skeet shooting/recreation Training Start Date: 1970s Direction of Fire: Southwest Firing Positions: 10 Target Range: 300 yards Impact Area(s):
Open area Hillside Building Earthen berm Bullet trap
Existing BMPs:
Basin/vault Control fabric Diversion Fencing Rip-rap Silt check Vegetation
Other: Reference(s):
FINDINGS Review Period Periodic Review Estimated Lead Deposition (lb/yr)
0
Surface Water /
Sediment
RANK Minimal Source 8
Pathway 14 Receptor 4
TOTAL SCORE 26
Groundwater
RANK Minimal Source 8
Pathway 16 Receptor 6
TOTAL SCORE 30 RECOMMENDATIONS
Periodically review operations for significant changes in training, management, and use.
Gather additional data regarding range use, pathways, or receptors associated with the range: ___________________________________________
Collect site-specific field data to further assess potential off-range migration.
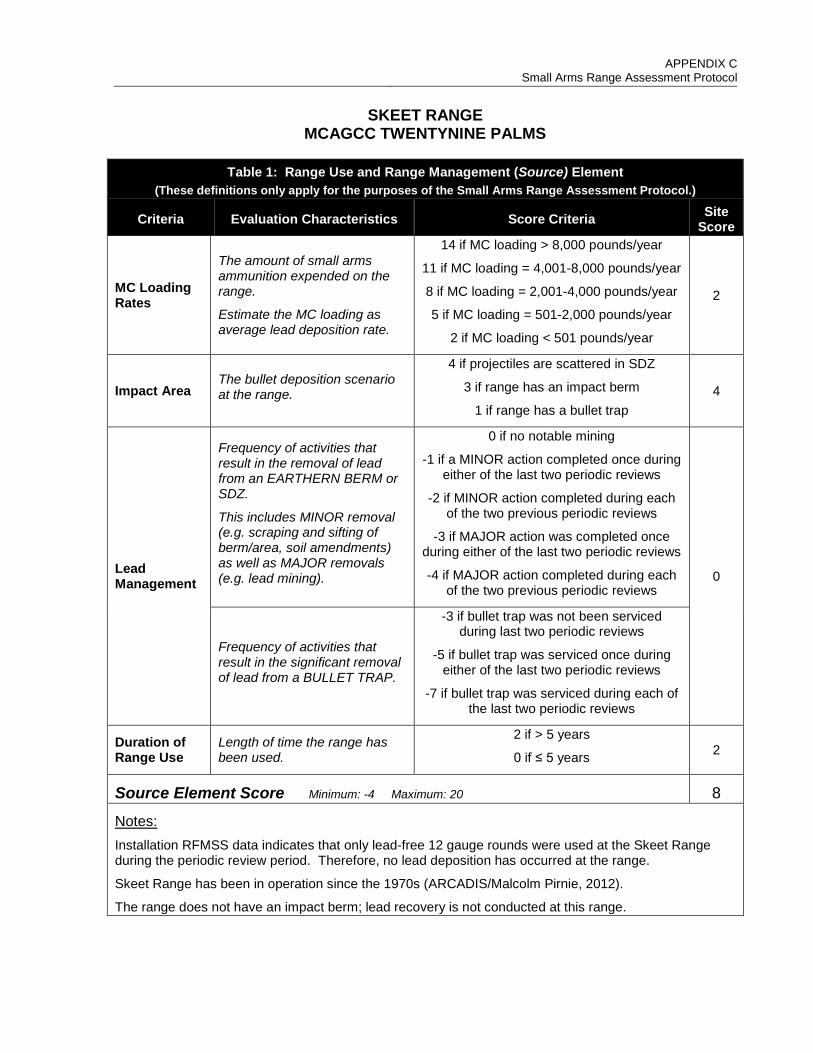
APPENDIX C
Small Arms Range Assessment Protocol
SKEET RANGE MCAGCC TWENTYNINE PALMS
Table 1: Range Use and Range Management (Source) Element
(These definitions only apply for the purposes of the Small Arms Range Assessment Protocol.)
Criteria Evaluation Characteristics Score Criteria Site Score
MC Loading Rates
The amount of small arms ammunition expended on the range.
Estimate the MC loading as average lead deposition rate.
14 if MC loading > 8,000 pounds/year
11 if MC loading = 4,001-8,000 pounds/year
8 if MC loading = 2,001-4,000 pounds/year
5 if MC loading = 501-2,000 pounds/year
2 if MC loading < 501 pounds/year
2
Impact Area The bullet deposition scenario at the range.
4 if projectiles are scattered in SDZ
3 if range has an impact berm
1 if range has a bullet trap 4
Lead Management
Frequency of activities that result in the removal of lead from an EARTHERN BERM or SDZ.
This includes MINOR removal (e.g. scraping and sifting of berm/area, soil amendments) as well as MAJOR removals (e.g. lead mining).
0 if no notable mining
-1 if a MINOR action completed once during either of the last two periodic reviews
-2 if MINOR action completed during each of the two previous periodic reviews
-3 if MAJOR action was completed once during either of the last two periodic reviews
-4 if MAJOR action completed during each of the two previous periodic reviews
0
Frequency of activities that result in the significant removal of lead from a BULLET TRAP.
-3 if bullet trap was not been serviced during last two periodic reviews
-5 if bullet trap was serviced once during either of the last two periodic reviews
-7 if bullet trap was serviced during each of the last two periodic reviews
Duration of Range Use
Length of time the range has been used.
2 if > 5 years
0 if ≤ 5 years 2
Source Element Score Minimum: -4 Maximum: 20 8
Notes: Installation RFMSS data indicates that only lead-free 12 gauge rounds were used at the Skeet Range during the periodic review period. Therefore, no lead deposition has occurred at the range.
Skeet Range has been in operation since the 1970s (ARCADIS/Malcolm Pirnie, 2012).
The range does not have an impact berm; lead recovery is not conducted at this range.

APPENDIX C
Small Arms Range Assessment Protocol
SKEET RANGE MCAGCC TWENTYNINE PALMS
Table 2: Surface Water / Sediment Pathways Characteristics Element
(These definitions only apply for the purposes of the Small Arms Range Assessment Protocol.)
Criteria Evaluation Characteristics Score Criteria Site Score
Precipitation Rate of precipitation.
8 if precipitation > 40 inches/year
6 if precipitation = 20-40 inches/year
4 if precipitation < 20 inches/year 4
Vegetation Approximate vegetation cover within and directly downslope of the projectile deposition area.
6 if vegetation cover < 10%
4 if vegetation cover = 10% to 90%
2 if vegetation cover > 90% 6
Slope of Range
Average slope from deposition area along the overland pathway to the first defined channel.
5 if slope > 10% (5.71°)
3 if slope = 5% to 10%
2 if slope < 5% (2.86°) 2
pH of Soil pH below 6.5 and above 8.5 increases the rate of lead dissolution.
3 if pH < 4 or >10
2 if pH ≥ 4 < 6.5 or > 8.5 ≤ 10
1 if pH 6.5 ≤ pH ≤ 8.5 1
Soil Type/ Erosion
Erosion potential is greatest for fine sands and silt. Clay has the lowest erosion potential. The area where projectiles are deposited should be scored.
2 if soil type is fine sand / silt
1 if soil type is clayey sand or silt / coarse sands
0 if soil type is clay
2
Erosion observed at the projectile deposition area.
5 if there is visual evidence of eroded material being transported from the
projectile deposition area
3 if bullet pockets or other indicators of erosion were observed
1 if no erosion was observed
1
Engineering Controls
The presence of engineering controls or BMPs to modify or control surface water run-on.
Controls may include barriers or diversions that reduce run-on to the range.
0 if no engineering controls
-1 if partial engineering controls
-2 if effective engineering controls 0
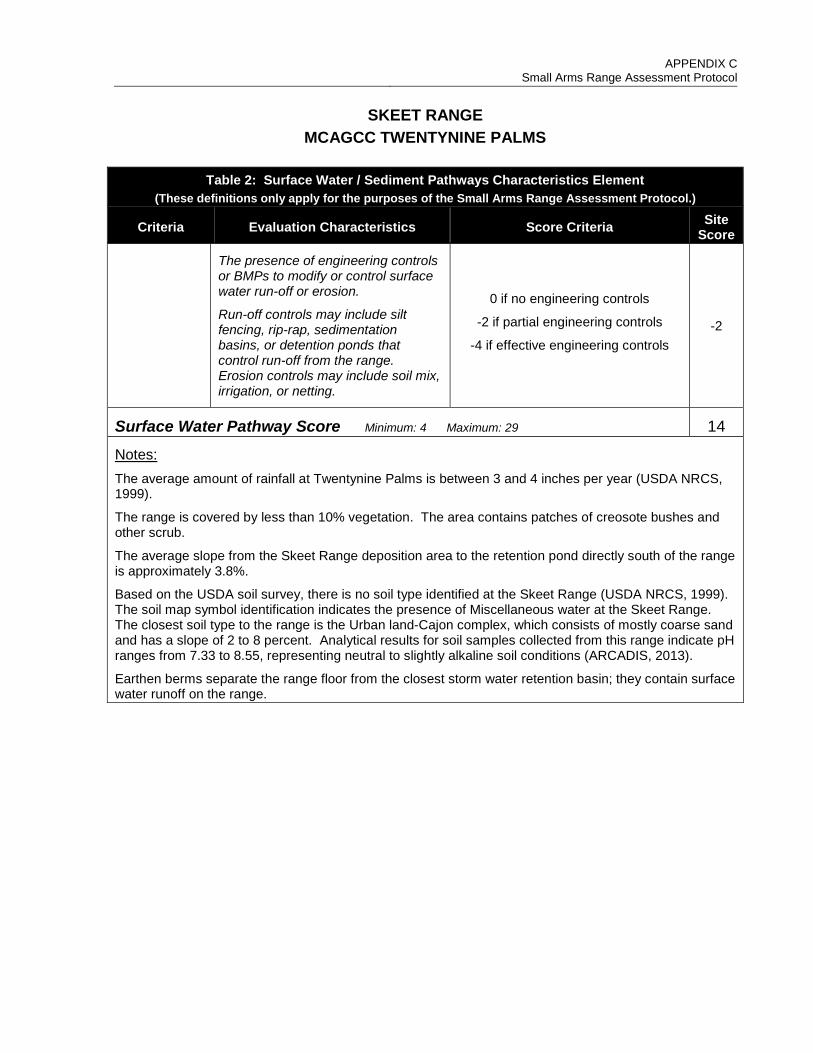
APPENDIX C
Small Arms Range Assessment Protocol
SKEET RANGE MCAGCC TWENTYNINE PALMS
Table 2: Surface Water / Sediment Pathways Characteristics Element
(These definitions only apply for the purposes of the Small Arms Range Assessment Protocol.)
Criteria Evaluation Characteristics Score Criteria Site Score
The presence of engineering controls or BMPs to modify or control surface water run-off or erosion.
Run-off controls may include silt fencing, rip-rap, sedimentation basins, or detention ponds that control run-off from the range. Erosion controls may include soil mix, irrigation, or netting.
0 if no engineering controls
-2 if partial engineering controls
-4 if effective engineering controls -2
Surface Water Pathway Score Minimum: 4 Maximum: 29 14
Notes: The average amount of rainfall at Twentynine Palms is between 3 and 4 inches per year (USDA NRCS, 1999).
The range is covered by less than 10% vegetation. The area contains patches of creosote bushes and other scrub.
The average slope from the Skeet Range deposition area to the retention pond directly south of the range is approximately 3.8%.
Based on the USDA soil survey, there is no soil type identified at the Skeet Range (USDA NRCS, 1999). The soil map symbol identification indicates the presence of Miscellaneous water at the Skeet Range. The closest soil type to the range is the Urban land-Cajon complex, which consists of mostly coarse sand and has a slope of 2 to 8 percent. Analytical results for soil samples collected from this range indicate pH ranges from 7.33 to 8.55, representing neutral to slightly alkaline soil conditions (ARCADIS, 2013).
Earthen berms separate the range floor from the closest storm water retention basin; they contain surface water runoff on the range.

APPENDIX C
Small Arms Range Assessment Protocol
SKEET RANGE MCAGCC TWENTYNINE PALMS
Table 3: Groundwater Pathways Characteristics Element
(These definitions only apply for the purposes of the Small Arms Range Assessment Protocol.)
Criteria Evaluation Characteristics Score
Criteria Site
Score
Precipitation Intensity and frequency of precipitation.
3 if precipitation > 40 inches/year
2 if precipitation = 20-40 inches/year
1 if precipitation < 20 inches/year 1
Depth to Groundwater
The potential for impact to the groundwater decreases with an increasing depth to the water table.
6 if depth to groundwater < 3 feet
3 if depth to groundwater = 3-20 feet
1 if depth to groundwater = 20-100 feet
0 if in a groundwater discharge area or depth to groundwater > 100 feet
1
Soil Type / Infiltration Conditions
Soil with a higher porosity (sands/gravels) has more infiltration and less runoff compared to soil with low porosity (silts/clays). Most hydraulically restrictive infiltration horizon between the surface and groundwater is scored.
6 if soil type is sand / gravel
3 if soil type is sand and silt
1 if soil type is clay / clayey sand/silt 6
Vegetation impedes infiltration and groundwater recharge.
6 if vegetation cover < 10%
3 if vegetation cover = 10% to 90%
1 if vegetation cover > 90% 6
Average slope from deposition area along the overland pathway to the first defined channel.
3 if slope < 2% (1.15°)
1 if slope = 2% to 20%
0 if slope > 20% (11.31°) 1
pH of Soil
Lead tends to stay dissolved at pH conditions less than 6.5 and greater than 8.5 but tends to attach to soil particles at pH conditions between these levels.
3 if pH < 4 or >10
2 if pH ≥ 4 < 6.5 or > 8.5 ≤ 10
1 if pH 6.5 ≤ pH ≤ 8.5 1
Groundwater Pathway Score Minimum: 4 Maximum: 27 16
Notes: The average amount of rainfall at Twentynine Palms is between 3 and 4 inches per year (USDA NRCS, 1999).
The Mainside cantonment area, including the Skeet Range, is located in the Mainside subbasin.

APPENDIX C
Small Arms Range Assessment Protocol
SKEET RANGE MCAGCC TWENTYNINE PALMS
Table 3: Groundwater Pathways Characteristics Element
(These definitions only apply for the purposes of the Small Arms Range Assessment Protocol.)
Criteria Evaluation Characteristics Score
Criteria Site
Score Groundwater has been encountered at 75 feet below ground surface in one well in the Mainside subbasin, though it is more commonly found at more than 200 feet below ground surface (MCAGCC, 2006).
The soil type directly underlying the Skeet Range is identified as Miscellaneous water. The closest soil type to the range is the Urban land-Cajon complex, which consists of mostly coarse sand and has a slope of 2 to 8 percent. Analytical results for soil samples collected from this range indicate pH ranges from 7.33 to 8.55, representing neutral to slightly alkaline soil conditions (ARCADIS, 2013).
The range is covered by less than 10% vegetation. The area contains patches of creosote bushes and other scrub.
The average slope from the Skeet Range deposition area to the retention pond directly south of the range is approximately 3.8%.

APPENDIX C
Small Arms Range Assessment Protocol
SKEET RANGE MCAGCC TWENTYNINE PALMS
Table 4: Surface Water / Sediment Receptors Element
(These definitions only apply for the purposes of the Small Arms Range Assessment Protocol.)
Criteria Evaluation Characteristics
Score Criteria
Site Score
Surface Water Body
Identify if a nearby surface water body is present down gradient, as defined on the National Hydrography Dataset (NHD) map.
8 if surface water body is located downgradient of the range within 1,500 feet
4 if surface water body is located downgradient of the range 1,500-5,000 feet
0 if surface water body is located downgradient of the range over 5,000 feet
4
Drinking Water Use
Identify if a down gradient surface water body is used as a drinking water source (drainage distance).
4 if surface water body used as a drinking water source is located downgradient of the range within 1 mile
2 if surface water body used as a drinking water source is located downgradient of the range within 1 to 6 miles
0 if no known drinking water intakes are identified within 6 miles of the range
0
Drainage Distance to Installation Boundary
Identify downgradient drainage distance to first potential ecological exposure off installation (i.e., installation boundary).
4 if the installation boundary is located downgradient of the range within 0.5 miles
2 if the installation boundary is located downgradient of the range within 0.5 to 3 miles
0 if the installation boundary is located downgradient of the range greater than 3 miles, or if surface water runoff
from the range does not discharge off the installation
0
Surface Water Receptor Score Minimum: 0 Maximum: 16 4
Notes: According to the USGS National Hydrography Map, the closest downgradient surface water body to the Skeet Range is the Mesquite Lake located approximately 2,700 feet to the south (USGS, 2014).
Surface water is not used as a drinking water source at the installation, and there is no surface water bodies used as drinking water sources within six miles of this range.
The installation boundary is located to the southwest approximately 0.33 miles downgradient of the Skeet Range. However, surface water from this range is discharged into the waste water treatment facility ponds directly south of the Skeet Range less than 50 yards from the range boundary. Based on this, it is unlikely for the drainage pathway from the Skeet Range to reach the installation boundary.
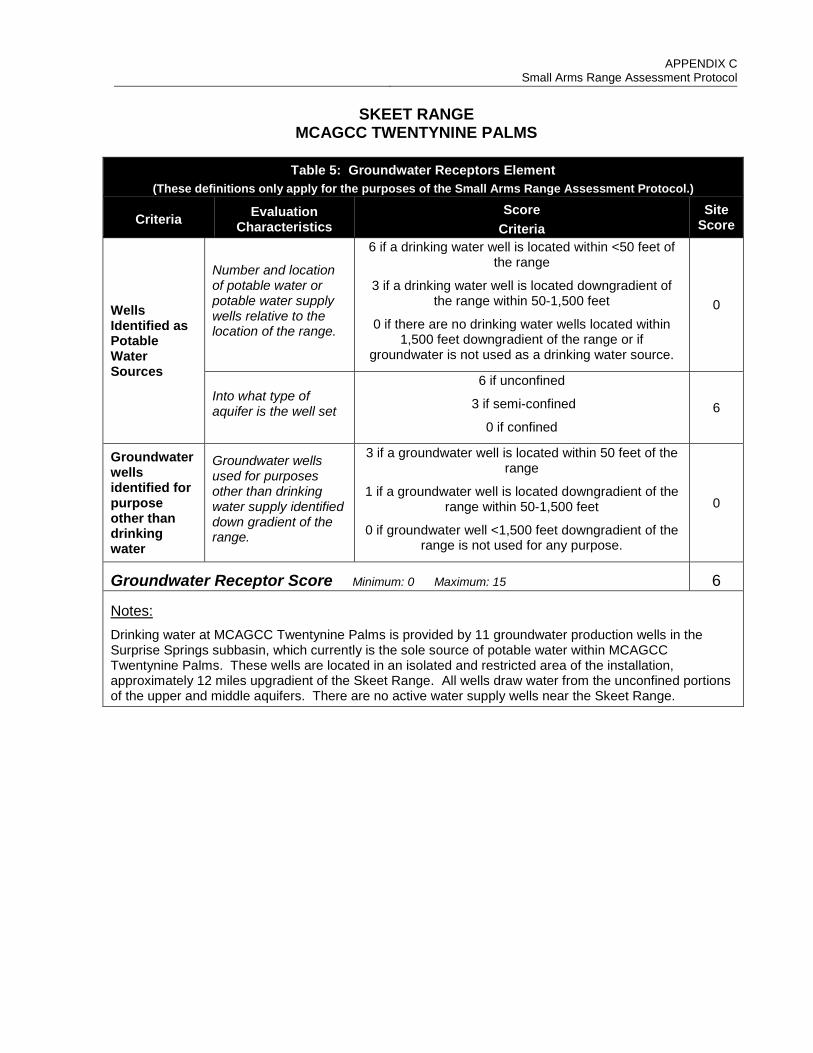
APPENDIX C
Small Arms Range Assessment Protocol
SKEET RANGE MCAGCC TWENTYNINE PALMS
Table 5: Groundwater Receptors Element
(These definitions only apply for the purposes of the Small Arms Range Assessment Protocol.)
Criteria Evaluation Characteristics
Score Criteria
Site Score
Wells Identified as Potable Water Sources
Number and location of potable water or potable water supply wells relative to the location of the range.
6 if a drinking water well is located within <50 feet of the range
3 if a drinking water well is located downgradient of the range within 50-1,500 feet
0 if there are no drinking water wells located within 1,500 feet downgradient of the range or if
groundwater is not used as a drinking water source.
0
Into what type of aquifer is the well set
6 if unconfined
3 if semi-confined
0 if confined 6
Groundwater wells identified for purpose other than drinking water
Groundwater wells used for purposes other than drinking water supply identified down gradient of the range.
3 if a groundwater well is located within 50 feet of the range
1 if a groundwater well is located downgradient of the range within 50-1,500 feet
0 if groundwater well <1,500 feet downgradient of the range is not used for any purpose.
0
Groundwater Receptor Score Minimum: 0 Maximum: 15 6
Notes: Drinking water at MCAGCC Twentynine Palms is provided by 11 groundwater production wells in the Surprise Springs subbasin, which currently is the sole source of potable water within MCAGCC Twentynine Palms. These wells are located in an isolated and restricted area of the installation, approximately 12 miles upgradient of the Skeet Range. All wells draw water from the unconfined portions of the upper and middle aquifers. There are no active water supply wells near the Skeet Range.

APPENDIX C
Small Arms Range Assessment Protocol
SKEET RANGE MCAGCC TWENTYNINE PALMS
Table 6: Evaluation Score (These definitions only apply for the purposes of the Small Arms Range Assessment Protocol.)
Surface Water / Sediment
Element Table Score
Range Use and Range Management (Source) 1 8
Surface Water / Sediment Pathways 2 14
Surface Water / Sediment Receptors 4 4
Sum of Surface Water / Sediment Element Scores Minimum: 0 Maximum: 65 26
Groundwater
Element Table Score
Range Use and Range Management (Source) 1 8
Groundwater Pathways 3 16
Groundwater Receptors 5 6
Sum of Groundwater Element Scores Minimum: 0 Maximum: 62 30
Field Sampling and Observed Releases
Surface Water / Sediment
Surface water sampling conducted Yes No Sediment sampling conducted Yes No Results exceed DoD screening value Yes No
Surface Water / Sediment
No Modification High
Groundwater No Modification High
Groundwater Groundwater sampling conducted Yes No Results exceed DoD screening value Yes No
The relative evaluation ranking for each media is determined by selecting the appropriate score based on the data elements for that media:
Evaluation Ranking* Score Range High 45-65 Moderate 33-44 Minimal 0-32
Surface Water Evaluation Ranking Minimal
Groundwater Evaluation Ranking Minimal
Notes: