randomization methods and the analysis of multivariate ecological data
TRANSCRIPT

RANDOMIZATION METHODS AND THE ANALYSIS
OF MULTIVARIATE ECOLOGICAL DATA
ERIC P. SMITH*
Department of Statistics, Virginia Tech, Blacksburg, VA 24061-0439, USA
SUMMARY
Data from ecological and biomonitoring studies are sometimes di�cult to make inferences from owing tothe high dimensionality of the data, the lack of normality and other problems. One approach for testingwhich has interested researchers is the randomization method. A general approach is based on replacing themultivariate data with distances between units, choosing a test statistic to summarize di�erences (due say toa treatment) and using a randomization test to assess the signi®cance of the di�erences.This paper discusses a number of questions and concerns related to analysis and interpretation using this
analytical approach. First, what can be said about the power of this test and how is the power related to thepower of other tests under optimal conditions? Second, the variables (species) seem to get lost in theanalysis. How important are they and should one be concerned about their importance to the power of thetest? Finally, how important are assumptions about the data? These questions and others are discussedusing examples from multispecies studies. # 1998 John Wiley & Sons, Ltd.
KEY WORDS permutation test; mesocosm; similarity analysis; distance measures; randomization test;multivariate analysis
1. INTRODUCTION
Environmental and ecological studies are often complex and di�cult to analyse. These data setsfrequently have a large number of variables; they have multiple measurements on the same units(often over time); the variables are correlated; the data almost never follow a normal distribution;variances are never homogeneous; sampling is infrequently done on a regular basis; and theremay be missing or censored values. An example considered throughout is the mesocosm studyused in the assessment of pesticides. In aquatic studies, a mesocosm is a unit which resembles apond or stream. A basic study consists of a number of replicate mesocosms to which are applied atreatment such as a pesticide at di�erent concentrations. The experiment is thus a dose±responsestudy, with a control and several doses. Measurements are made on a (often large) number oftaxa, often at di�erent times.
Although the design of the experiment is simple, the analysis is complicated. A major interestin the mesocosm study is the test of the hypothesis of no treatment e�ect and there are many
CCC 1180±4009/98/010037±15$17.50 Received 23 August 1996# 1998 John Wiley & Sons, Ltd. Accepted 2 July 1997
ENVIRONMETRICS, VOL. 9, 37±51 (1998)Environmetrics, 9, 37±51 (1998)
* Correspondence to Eric P. Smith, Department of Statistics, Virginia Tech, Blacksburg, VA 24061-0439, USA.e-mail: [email protected]
Contract grant sponsor: Air Force o�ce of Scienti®c ResearchContract grant number: F49620-94-1-0251

approaches to analysis of these highly multivariate data. One approach is to ignore the multi-variate structure and analyse the dominant variables using univariate methods. The error ratesare often adjusted for the number of variables (Gibbons 1994). Another approach summarizesthe multivariate data using a univariate measure. This method is appropriate when the variablesare measured on the same scale. With biological data, common measures include diversity, taxarichness and measures of biological health such as the index of biotic integrity. These sum-marizations are then analysed using a standard statistical analysis. Another summarizationmethod uses a data based summarization based on variance or separation. Methods such asprincipal components analysis, correspondence analysis, canonical variate analysis or canonicalcorrespondence analysis fall into this categorization (Greenacre 1984). The last approach, the onethis paper focuses on, is based on selection of a measure of similarity or distance to measurerelationship between units. The similarity matrix is then analysed to assess hypotheses of interestusing a randomization test.
Randomization methods are becoming prevalent in ecological and environmental studiesowing to their ¯exibility, intuitive interpretation and the availability of software to implementthe analysis. Note that randomization analysis may be applied with all of the approachesdescribed above (ter Braak 1986; Bell et al. 1981; Smith et al. 1990). The focus of this paper is onrandomization analysis applied to multivariate environmental data sets. Our examples usebiological data from mesocosm and ®eld experiments and use similarity or distance to reduce thedata; however, our comments are applicable to other studies. The purpose is to comment on someof the di�culties in interpreting the results of these studies. Although the randomization test itselfis easy to implement, understanding the results of the test may not be easy. When using arandomization test it is important to assess the assumptions behind the test, to investigate therole of the variables and to carry out other follow-up analyses (multiple comparisons, graphicaldisplays).
2. MANTEL AND MRPP TESTS
The analysis of multivariate data using similarity or distance usually follows several steps(Figure 1). The analysis is described using a single time although it can be generalized to moretimes. The data are assumed to be from a designed experiment with p variables, g groups of dataand N total observations. The data are represented by xik or pik where i represents the unit and kthe variable. The ®rst step is to compute the distance or similarity matrix. This matrix is a matrixwith element dij which represents the distance between units i and j. There are many distances orsimilarity measures that may be used and the choice of measure is important. The choice ofmeasure depends in part on the type of data. For example, if pik is the proportion of species k inmesocosm i, then common measures include the proportional similarity measure
PSij � S min� pik; pjk�;
where the sum is over the species, and the cosine measure (also a similarity measure)
cosij � Spikpjk=�Sp2ik *Sp2jk�1=2:
ENVIRONMETRICS, VOL. 9, 37±51 (1998) # 1998 John Wiley & Sons, Ltd.
38 E. P. SMITH

With continuous data, the Euclidean distance
Eij � �p S�xik ÿ xjk�2�
and the Bray±Curtis measure (also a distance measure)
BCij � S j xik ÿ xjk j =S�xik � xjk�
are common (see Gauch 1982 or Lamont and Grant 1979 for additional measures).When the study is a designed experiment, the data and resulting distance matrix have structures
which can be exploited to make inferences (Figure 1). Rather than indexing distance in terms ofunits, it is often convenient to think in terms of another indexing which identi®es the groups andreplicates within the group. If there is no di�erence between the treatments, all the distances(or similarities) should be similar. If there is a treatment e�ect then units receiving the sametreatment should be closer than those receiving di�erent treatments. This structure is nowexploited to form a test similar to analysis of variance. A statistic is selected which is useful forseparating groups when there is an e�ect. For example, this may be the mean or total distancewithin. If there is an e�ect, this mean distance (similarity) should be smaller (larger) than themean distance (similarity) between groups. The next step in the test procedure is to permute thedata and to recompute the statistic. This step is repeated a large number of times, often 1000 or10,000. The resulting values form a permutation distribution which describes the distribution ofthe statistic given no e�ect. The actual value from the original data may then be compared withthe distribution to compute a p-value. Other statistics may also be used to evaluate the hypo-thesis.
This test, which is useful for evaluating the hypothesis of no treatment e�ect in the mesocosmexample, is a version of the more general class of randomization tests referred to as Mantel tests(Mantel 1967) and is also a multiresponse permutation test (MRPP: Mielke et al. 1976). TheMantel test was developed as a clever way to evaluate the hypothesis that leukaemia cases occurin clusters. The test was developed as follows. Let dij be the distance between cases i and j in space
Figure 1. Flow chart illustrating multispecies randomization test method
# 1998 John Wiley & Sons, Ltd. ENVIRONMETRICS, VOL. 9, 37±51 (1998)
RANDOMIZATION IN MULTIVARIATE ANALYSIS 39
and sij be the distance between cases i and j in time. Then the statistic r� Sdijsij was used toevaluate the relationship between occurrence in space and time. The data were then permuted andthe statistic re-evaluated. The process leads to a permutation distribution and a p-value may becomputed from this distribution to test the hypothesis of no association. Note that the mesocosmtest is a special case in which distance in space is the distance between the units and distance intime is the distance between treatments. A variation on this test is the MRPP test described inMielke et al. (1981). Most researchers evaluate the test using a simulation approach, however;details on approximating the permutation distribution using a gamma distribution ®tted to threemoments are given in Mielke (1979).
One of the ®rst applications of the Mantel test in an environmental study was in the paper byvan Belle and Fisher (1977) (see also Smith and Conquest 1981). The authors evaluated datacollected at two times (1952 and 1969) and 27 locations in the Green Bay area (Howmiller andBeeton 1971). The data consisted of counts on eight aquatic taxa. Interest was in evaluatingwhether the change in the aquatic community was related to proximity to Green Bay or proximityto Oconto, a city to the north. To address the question, the authors ®rst computed distancesbetween the ranked species lists in 1952 and 1969 at the same site (yielding 27 distances). Thesecond set of distances was the geographical distance from the 27 sites to Green Bay or to Oconto.The relationship between the two sets of distances was then evaluated using the Mantel test.
3. ASSUMPTIONS AND THEIR EFFECTS
Although these methods are extremely useful, it is important to recognize their similarities withother statistical methods and hence their possible weaknesses. It must be recognized thatrandomization tests have assumptions. While it is not necessary that the data (in this case thedistances) follow a normal distribution, the method works best when the data are from the samedistribution. An important assumption which is sometimes overlooked is the assumption ofindependence between the units or among observations on the same unit over time. Therandomization tests involve a distance or similarity measure and a potential weakness is thechoice of the measure. The importance of the measure is seen in the power of the test andinterpretation of test results. Finally, the number of variables and their relationships can be animportant consideration. Some of these assumptions and considerations are discussed in furtherdetail below.
3.1. E�ects of observations
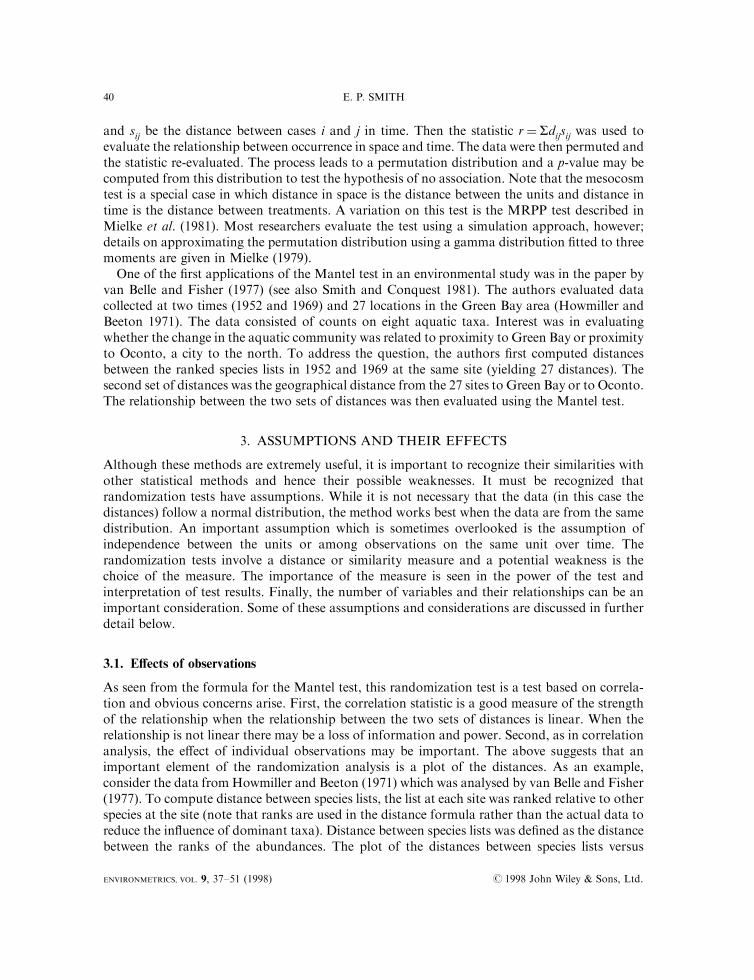
As seen from the formula for the Mantel test, this randomization test is a test based on correla-tion and obvious concerns arise. First, the correlation statistic is a good measure of the strengthof the relationship when the relationship between the two sets of distances is linear. When therelationship is not linear there may be a loss of information and power. Second, as in correlationanalysis, the e�ect of individual observations may be important. The above suggests that animportant element of the randomization analysis is a plot of the distances. As an example,consider the data from Howmiller and Beeton (1971) which was analysed by van Belle and Fisher(1977). To compute distance between species lists, the list at each site was ranked relative to otherspecies at the site (note that ranks are used in the distance formula rather than the actual data toreduce the in¯uence of dominant taxa). Distance between species lists was de®ned as the distancebetween the ranks of the abundances. The plot of the distances between species lists versus
ENVIRONMETRICS, VOL. 9, 37±51 (1998) # 1998 John Wiley & Sons, Ltd.
40 E. P. SMITH
distance from Oconto is given in Figure 2. Note that one point (site number 3) has a distance ofzero, which indicates that the ranked species list is the same for the di�erent years.
The e�ect of the observation may be seen through its e�ect on the test. Removal of the site hasa strong e�ect on the signi®cance of the test. The signi®cance of the test (using 10,000 random-izations) is 0.0072 (r�ÿ0.43) with the site but is 0.0276 (r�ÿ0.38) without, a more marginalvalue. The point is that a randomization test, although it may be viewed as a non-parametric test,is not a rank based test, and hence is not immune to the e�ects of outlying values. Lambert (1985)discusses robust methods and permutation tests.
3.2. Independence and design
When a randomization test is applied, it is important to recognize the appropriate unit forrandomization and the role of independence. The randomization model developed above requiresindependence between units. There are two cases where this assumption may be important. The®rst is the case of observations made over time. In this situation, the observations are typicallycorrelated and repeated measures analysis is required. There are extensions of the randomizationmethod for this case although the analysis is more complex (Zerbe and Walker 1977; Foutz et al.1985). The second situation to be aware of involves subsampling. In a mesocosm study, forexample, at a single time, three measurements may be taken on a single unit. To use thesemeasurements as three units for randomization would be erroneous as the measurements arecorrelated and made on the same unit (in this case the mesocosm).
3.2. Power of tests under standard conditions
The choice of measure can be extremely important in the analysis and is elemental in determiningthe power of the test. The criteria for choosing a measure often involve biological and
Figure 2. Plot of distances between ranked species lists versus geographical distance from Oconto: plot symbol indicatesthe site number
# 1998 John Wiley & Sons, Ltd. ENVIRONMETRICS, VOL. 9, 37±51 (1998)
RANDOMIZATION IN MULTIVARIATE ANALYSIS 41

environmental relevance. However, statistical issues should also play a role. From a biologicalview, considerations include the type of data (e.g. binary, continuous, count), the weight given toindividual taxa (whether dominant taxa have more importance) and the ability to detectbiologically important change. From a statistical view, important issues include power, size of thetest, and robustness.To illustrate the importance of the measure, consider the case where the data comes from two
multivariate normal distributions with di�erent means but a common covariance matrix. Twopossible measures are the Euclidean distance measure (Eij) and the Mahalanobis distance
D2ij � �xi ÿ xj�0Sÿ1p �xi ÿ xj�;
where xi is the vector if observations for a unit are from group i and Sp is the pooled covariancematrix. From statistical theory, we know that the Mahalanobis distance should be a sensiblechoice as it is related to Hotelling's T2-statistic. The T2-statistic is the uniformly most powerfulinvariant test for the two-group normal case. The power of the test depends on the non-centralityparameter which is a function of the separation between means, the variances of the variables andthe correlation between variables. Power is also a�ected by the number of variables for a givennon-centrality parameter.
To compare the distance measures in terms of power, data were generated from two multi-variate normal distributions and the permutation test was computed. The power of the permuta-tion test using Euclidean distance was compared with that of the T2-test. The power wascomputed using simulation based on 1000 repetitions. The signi®cance of the permutation testwas based on 1000 randomizations. A number of scenarios were evaluated and some are reportedbelow to illustrate the conclusions. In Figure 3, three cases are illustrated: only one variable; ®vevariables, no correlation and equal variance; and with ®ve variables, high correlation and equalvariance. First note that when there is one variable, there is little di�erence in power due to thedistance measure as expected. When there are ®ve variables and no correlation, the test usingEuclidean distance has slightly greater power than the T2-test. The power is even greater when thecorrelation between variables is large. This result may seem unusual as the expectation is that theT2-test is the most powerful invariant test for this situation. Note, however, that the situation wasdesigned to favour the test using Euclidean distance and it is easy to ®nd a case favouring theT2-test. Figure 4 illustrates the case where some of the correlations are negative and some are zero,again with equal correlations. In this case, the T2-test outperforms the test based on Euclideandistance. Although these results may seem contrary to theory, note that the theory does not statethat the T2 is the uniformly most powerful test but rather states that it is the uniformly mostpowerful invariant test. Invariance may be an important criterion in choosing a measure as itimplies that the units of measurement are not important. With data on taxonomic counts, thismay not be important as all taxa are measured on the same scale. However, with environmentalchemistry data this may be quite important as di�erent chemicals may be measured on di�erentscales. When the scale of measurement becomes important, invariance is relevant.
3.4. The role of variables
Another factor which may be important is the choice of variables. In many biological studies, thevariable is the taxon. In general, there are a large number of taxa in a study especially when theorganisms are small (e.g. insects, plankton). To illustrate the e�ect a taxon can have on the
ENVIRONMETRICS, VOL. 9, 37±51 (1998) # 1998 John Wiley & Sons, Ltd.
42 E. P. SMITH

results, consider the data in Table I and results in Table II. Table II gives the ratio of the meansimilarity for units receiving di�erent treatments to the mean similarity for units receiving thesame treatment (i.e. mean between similarity to mean within similarity). Large values of the ratio(near 1) indicate no di�erence while small values indicate a large di�erence (Good 1982). Notethat in Table IIa there appears to be little e�ect due to the treatments as all ratios are close to one.When the last taxon is dropped from the analysis, the ratios change dramatically, as indicated inTable II. Note that this taxon is quite dominant and that the relative abundance is quite large forthis taxon. For the measure that was used, this taxon controls the analysis and the other taxa havevery little in¯uence on the measure.
An important question is: how do the number of taxa relate to the power of the test and thechoice of the distance measure? At ®rst it would seem that deleting unimportant variables issensible. However, this decision does not always lead to an increase in power. Two factors whicha�ect the result are the sampling scheme and the distributional assumption. Two examplesillustrate the problem.
First, consider sampling taxonomic units. Two sample schemes may be used. With largerorganisms, counting may be exhaustive. Thus on a given unit, the total count is random. Asecond scheme, more common with smaller organisms, is to count a ®xed number of organisms
Figure 3. Power of the two-group T2 and permutation tests versus the non-centrality parameter for multivariate normaldata, using one variable; ®ve variables with an equicorrelation matrix with correlation equal to 0.8; or ®ve independentvariables. Sample sizes are equal to 10 for each group. , T2-test, one variable; s permutation test, one variable;j permutation test, ®ve variables with correlation 0.8; � permutation test, ®ve variables, zero correlation; � T2-test,
®ve variables, zero correlation; d T2-test, ®ve variables, correlation 0.8
# 1998 John Wiley & Sons, Ltd. ENVIRONMETRICS, VOL. 9, 37±51 (1998)
RANDOMIZATION IN MULTIVARIATE ANALYSIS 43

Figure 4. Power of the two-group T2 and permutation tests versus the non-centrality parameter for multivariate normaldata, using ®ve variables with negative and zero correlations and sample sizes of 10. h T2-test; � permutation test
Table I. Data from a mesocosm study
Treatment i Species j1 2 3 4 5 6 7 8 9 10 11 12
1 47 26 12 7 6 312 6 13 9 16 31 265514 44 2 1 14 292 32 31 9 16 32 188631 42 6 27 6 276 14 44 9 16 31 207142 22 4 3 20 290 9 30 6 8 18 2037
2 36 29 5 10 4 248 2 18 8 17 30 273924 6 3 9 6 340 5 17 15 6 22 360512 16 4 7 4 277 20 36 2 8 15 273152 66 4 12 20 368 30 24 10 22 36 2976
3 52 30 0 5 2 102 0 21 8 15 37 404612 22 0 4 4 50 16 20 11 16 30 203719 46 0 8 0 91 8 32 5 24 31 265886 46 0 11 6 97 13 4 4 6 15 3432
4 0 0 0 0 0 5 0 2 6 8 16 47590 0 0 1 0 0 0 0 9 6 17 43423 0 0 3 0 6 0 0 7 10 22 36551 4 0 1 0 3 0 0 0 6 8 3361
ENVIRONMETRICS, VOL. 9, 37±51 (1998) # 1998 John Wiley & Sons, Ltd.
44 E. P. SMITH

or a ®xed area (for example, the number of diatoms in a ®eld of a slide). Now if a measure basedon proportional abundance is used, the power of the test should depend on the total count andthe di�erences between the proportions. Initially, it may seem reasonable to omit a taxon whichhas the same proportions for di�erent groups. However, this may not change the power, asillustrated in Figure 5. In this ®gure, two taxa were given the same proportional abundance and
Table II. (a) Ratio of mean between similarity to mean within similarity
Treatment i Treatment j2 3 4
1 0.984 0.917 0.8442 0.956 0.8923 0.946
(b) E�ect of dropping the last taxon on the ratio of mean betweensimilarity to mean within similarity
Treatment i Treatment j2 3 4
1 1.011 0.803 0.3222 0.784 0.3203 0.520
Figure 5. E�ect of deleting unimportant variable on the power of the permutation test for di�erent proportions heldequal. h keep all variables s drop variable prior to sampling; � drop after sampling
# 1998 John Wiley & Sons, Ltd. ENVIRONMETRICS, VOL. 9, 37±51 (1998)
RANDOMIZATION IN MULTIVARIATE ANALYSIS 45
the other taxa had di�erent proportional abundance. Multinomial vectors with extra variationand a ®xed total count were generated for the di�erent groups and the groups were comparedusing the proportional similarity measure and the permutation approach. There were nine vectorsgenerated for each of two groups. Note that when a taxon with equal proportional abundanceis omitted, the power of the test is the same as if the taxon were not omitted. This resultoccurs because although the separation is greater, the multinomial sample size (total count)decreases, and thus the signi®cance of the separation does not change. What is best to do in thissituation is to select which taxa to use prior to the study (say through a pilot study). When thetotal count is not ®xed, selecting which taxa to use in an a posteriori fashion may not always beappropriate.
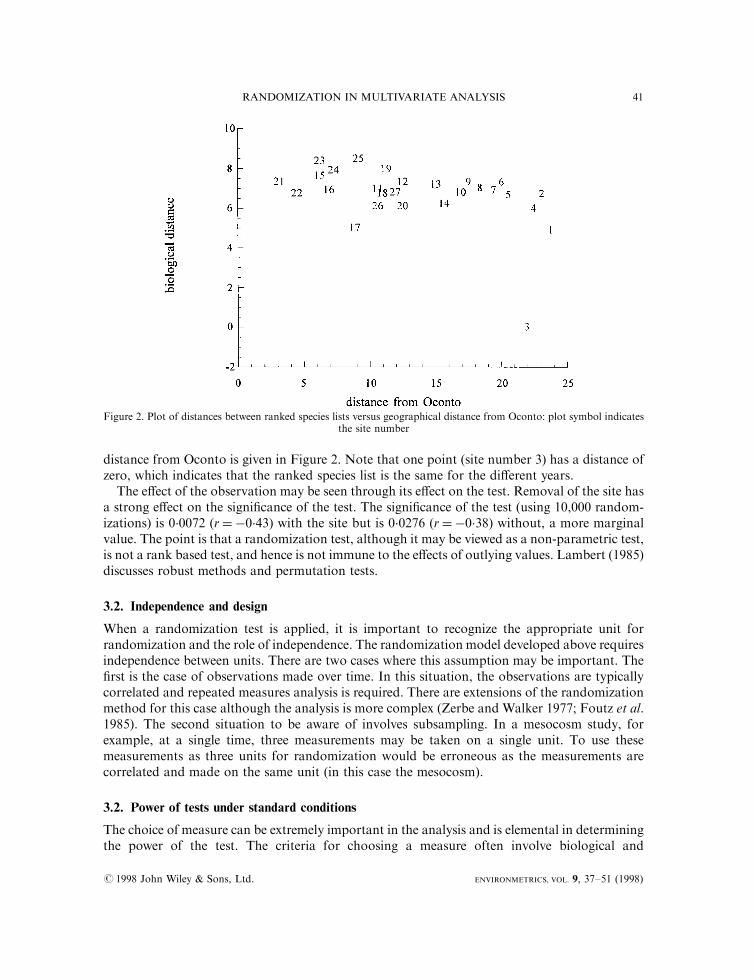
A second case is for continuous variables. Figures 6 and 7 illustrate the power for testingmultivariate data from two distributions with ®ve variables and common covariance. The meanof the last variable is the same for both groups. The power curves were based on the samesampling scheme as Figure 3, with 1000 simulations. In Figure 6, the covariance containsnegative and zero correlations. For the permutation and the T 2-test there are two curves, one forall variables and the second without the last variable. As expected, the deletion of the unimpor-tant variable leads to an increase in power. Figure 7 illustrates some examples using a covariancematrix with positive correlations (r� 0.8 for all pairs). Now the results are not as clear. In thiscase there are ®ve variables. Two correlation structures are considered: ®rst, where allcorrelations are 0.8; and second, where the correlation with the last variable is zero. For the
Figure 6. E�ect of omitting a variable on the power of the T 2 and permutation tests versus the non-centrality parameterfor normal data with ®ve variables. The means of all variables change except the last. The correlation matrix containsnegative and zero correlations. s T 2-test, dropping the last variable; h T 2-test, keeping the last variable; � permutation
test, dropping the last variable; � permutation test, keeping the last variable
ENVIRONMETRICS, VOL. 9, 37±51 (1998) # 1998 John Wiley & Sons, Ltd.
46 E. P. SMITH

permutation test the importance of deleting the unimportant variable seems to depend on thecorrelation with the other variables. When this correlation is large, the increase in power ondeleting the variable is sizable. However, when this variable is uncorrelated with the others,deletion only slightly alters the power. For the T 2-test, the ®gures indicate a slight increase inpower when the variable is omitted. The power is slight because (given the sample sizes), althoughthe F-statistic for testing for di�erences increases, the critical F-value also increases.
3.5. Importance of size of e�ect
As in most statistical methods there is a di�erence between statistical signi®cance and biologicalsigni®cance or relevance. Thus, it is important to consider not just the p-value of the test but alsothe size of the e�ect, which is not considered in the randomization test. As a simple example,consider a two-group paired data study and the paired t-test. Suppose that the observations fromgroup 1 are x1 , x2 , . . ., xn . Then take the observations from group 2 to be x1 � 0.001, x2 � 0.001,. . ., xn � 0.001. Then the (paired) permutation test will give a very small p-value if n is reasonablylarge, as all permutations will reduce the value of the paired t-test. However, the di�erencebetween the groups is quite small. With designed experiments, the magnitude of the di�erencebetween treatments is relevant. With regression studies, the size of the correlation is a usefulmeasure. Interpretation of di�erences and correlations may be a little di�cult in more complexmultivariate studies as distances are involved. Experimentation with data with known propertiesis useful in these cases.
Figure 7. E�ect of omitting a variable on the power for T2 and permutation tests versus the non-centrality parameterfor normal data with ®ve variables. Means di�er by group, except for the last variable. The correlation matrix has allcorrelations equal to 0.8 except when noted. h permutation test with all correlations 0.8, except those with the lastvariable; � permutation test omitting last variable; s T 2-test omitting last variable; d T 2-test with all correlations 0.8
except for the last variable; �T2-test with all correlations 0.8; n permutation test with all correlations 0.8
# 1998 John Wiley & Sons, Ltd. ENVIRONMETRICS, VOL. 9, 37±51 (1998)
RANDOMIZATION IN MULTIVARIATE ANALYSIS 47

4. FURTHER ANALYSIS
In many scienti®c analyses, the hypothesis test is not the end of the analysis but only thebeginning. The randomization test provides only an indication of di�erences. It is important torecognize this in the analysis and to pursue other questions. With multivariate designed experi-ments, these include graphical displays of di�erences, multiple comparisons and the evaluation ofspecies importance (Smith et al. 1990). Our discussion re¯ects experience with mesocosmexperiments.
Graphical displays are described in numerous multivariate textbooks (Seber 1988; Greenacre1984; Gauch 1982). The methods include principal components analysis, principal coordinatesanalysis and multidimensional scaling. The methods are useful for identifying similarities anddi�erences between the treatments and also for identifying outlying units. Smith et al. (1990)recommend matching the metric used in the analysis with the graphical technique. Although themethod displays distance or similarity and not separation, principal coordinates analysis may bemost appropriate for display of treatments and their relative e�ects.A di�cult part of the follow-up analysis is the evaluation of which groups di�er. While a
graphical method is useful for displaying similarities between treatments, it does not provide atest. Multiple comparison methods are valuable for assessing group di�erences but analysestypically have not been carried out. Foutz et al. (1985) describe a procedure for randomizedmultiple comparisons. The method uses an error rate for individual comparisons which protectsthe overall experiment-wise error rate. While the method protects the error rates, it is computerintensive and may be di�cult to implement when the number of groups is large.
The third important component of a follow-up analysis is the evaluation of species importanceor the in¯uence of the species on the test. There are several ways to do this evaluation. Onemethod is based on a relative importance measure. For example, in the evaluation of diets ofbirds the log odds ratio may be used to evaluate the importance of a taxon in one group versusanother. Another approach to importance is an in¯uence diagnostic (Smith et al. 1990). Thein¯uence of a taxon in a test may be measured by the change in the mean between similarity whenthe taxon is removed. Thus the relative in¯uence of taxon i may be de®ned by
I i � �Bÿi ÿ B�=B
where B is the mean between similarity and B7i is the mean between similarity without thei th taxon.
Another approach to evaluating importance is through a variable selection process. For this tobe valuable, it must be connected to the randomization method. One approach is to use aconditional test with a forward, backward or stepwise selection method. The process wouldrequire the following steps:
1. Start with Sk taxa at step k.2. Compute the mean between similarity with the taxa.3. Permute the data for taxon k.4. Compute the between similarity without the taxon.5. Repeat for a large number of permutations.6. Compare the between similarity with and without the taxon.7. Repeat for all taxa.
ENVIRONMETRICS, VOL. 9, 37±51 (1998) # 1998 John Wiley & Sons, Ltd.
48 E. P. SMITH

The process selects the taxon that produces the greatest change in between similarity and can beused to obtain a crude test. The test is crude as the method does not take into account possiblecorrelations between taxa in the permutation process.The method is applied to the data in Table I using a similarity measure and the results are
summarized in Table III. The in¯uence statistics in Table III indicate two taxa with large values,taxa 6 and 12. For taxon 12, the value is negative. The negative value indicates that the removal ofthe taxon decreases the mean between similarity which indicates a taxon which dominates theanalysis but is not changing with the treatment. Taxon 6 is also a dominant taxon which changesconsiderably with the treatment. Other taxa are indicated as being signi®cant but do not havenearly as important an in¯uence. The analysis suggests that the results of the study can beinterpreted in terms of changes in two taxa.
The importance of the taxon is also suggested by considering proportional abundances. Notein Table I that the proportional abundance of taxon 12 is quite large and is increasing with thetreatment. Taxon 6 has the next highest relative abundance and the proportions decrease with thetreatment. When this taxa is removed, the data become more similar. The other taxa haveconsiderably smaller proportional abundance and, although they change, are not as dominant.
5. COMMENTS AND CONCLUSIONS
Although randomization methods are potentially of great use in environmental and ecologicalstudies, like other statistical methods they need to be applied in a critical fashion. The methodsare sensitive to violations in the assumptions behind the test. With designed experiments, lack ofindependence, heterogeneity of variance and odd observations can a�ect the results. The powerof the method is also dependent on the choice of the distance or similarity measure. Carefulattention, based on biological as well as statistical considerations, should be given to the selectionof the measure. Finally, studies in which the variables are selected based on a priori informationare more likely to produce useful results than sampling a full set of variables (i.e. all taxa).
This paper has not provided a complete survey of multivariate randomization tests and relatedanalyses. Our focus is on analyses related to multispecies mesocosm tests. This focus is somewhatlimited as more complex issues such as the repeated measures problem, the problem of combininginformation on di�erent taxonomic units (®sh and phytoplankton, for example) and the analysis
Table III. In¯uence diagnostics for data from a mesocosm experiment
Species removed In¯uence p-value
1 0.662 0.108912 0.663 0.039603 0.119 0.000004 0.190 0.019805 0.242 0.000006 6.597* 0.000007 0.354 0.000008 0.585 0.000009 0.101 0.0990110 0.182 0.0594111 0.310 0.0396012 ÿ43.229* 0.00990
# 1998 John Wiley & Sons, Ltd. ENVIRONMETRICS, VOL. 9, 37±51 (1998)
RANDOMIZATION IN MULTIVARIATE ANALYSIS 49

of more complex experimental designs are not discussed. Although the focus in this paper ison biological data, the problems are similar with chemical data. For example, in a ground-water monitoring programme, measurements may be made on a large number of chemicals.Depending on the degree of compliance at a waste site, the programme may need to sample for upto 222 hazardous constituents (Gibbons 1994).
Research on randomization and related methods has produced a rich literature. A recent bookby Good (1993) provides over 600 references of related literature. Manly (1991) contains manyexamples and references on applications of randomization tests in biology and some computerprograms. These texts and the literature cited in the texts are potentially useful for environmentaldata analysis.
Although the discussion in this paper has centred around randomization tests, the results alsoapply to bootstrap and resampling methods. Since these methods involve the data to derive thedistribution of test statistics, assumptions about the data are important and need to be checked.
ACKNOWLEDGEMENTS
The author bene®ted from discussions with Don Jensen and Changgou Yang. This research wassponsored in part by the Air Force O�ce of Scienti®c Research, Air Force Systems Command,USAF, under grant F49620-94-1-0251. The US government is authorized to reproduce anddistribute reprints for governmental purposes notwithstanding any copyright notation thereon.
REFERENCES
Bell, C. B., Conquest, L. L., Pyke, R. and Smith, E. P. (1981). `Some nonparametric statistics for monitoringwater quality using benthic species counts', in Environmetrics 81: Selected Papers, Society of Industrialand Applied Mathematics, Philadelphia, pp. 100±121.
Foutz, R. V., Jensen, D. R. and Andersen, G. W. (1985). `Multiple comparisons in the randomizationanalysis of designed experiments', Biometrics, 41, 29±38.
Gauch, H. G. (1982). Multivariate Analysis in Community Ecology, Cambridge University Press,Cambridge.
Gibbons, R. D. (1994). Statistical Methods for Groundwater Monitoring, Wiley, New York.Good, I. J. (1982). `An index of separateness of clusters and a permutation test for its signi®cance,' Journal
of Statistical Computation and Simulation, 15, 81±84.Good, P. I. (1993). Permutation Tests, Springer, New York.Greenacre, M. J. (1984). Theory and Application of Correspondence Analysis, Academic Press, London.Howmiller, R. P. and Beeton, A. M. (1971). `Biological evaluation of environmental quality in Green Bay,Michigan', Journal of the Water Pollution Control Federation, 43, 123±133.
Lambert, D. (1985). `Robust two-sample permutation tests', Annals of Statistics, 13, 606±625.Lamont, B. and Grant, K. J. (1979). `A comparison of twenty measures of site dissimilarity', in Orloci, L.,Rao, C. R., and Stiteler, W. M. (eds), Multivariate Methods in Ecological Work, InternationalCooperative Publishing House, Fairland, MD, pp. 101±126.
Manly, B. F. J. (1991). Randomization and Monte Carlo Methods in Biology, Chapman and Hall, New York.Mantel, N. (1967). `The detection of disease clustering and a generalized regression approach', Cancer
Research, 27, 209±220.Mielke, P. W. (1979). `On the asymptotic non-normality of null distributions of MRPP statistics',
Communications in Statistics: Theory and Methods, A8, 1541±1550.Mielke, P. W., Berry, K. J. and Johnson, E. S. (1976). `Multiresponse permutation procedures for a prioriclassi®cations', Communications in Statistics, A5, 1409±1424.
Mielke, P. W., Berry, K. J., Brockwell, P. J. and Williams, J. S. (1981). `A class of nonparametric proceduresbased on multiresponse permutation procedures', Biometrika, 68, 720±724.
ENVIRONMETRICS, VOL. 9, 37±51 (1998) # 1998 John Wiley & Sons, Ltd.
50 E. P. SMITH

Seber, G. A. F. (1988). Multivariate Observations, Wiley, New York.Smith, E. P. and Conquest, L. L. (1981). `On the van Belle±Fisher statistic for water pollution monitoring
via ecological change', Journal of the Water Pollution Control Federation, 53, 1648±1650.Smith, E. P., Pontasch, K. W. and Cairns, J. Jr (1990). `Community similarity and the analysis of
multispecies environmental data: a uni®ed statistical approach', Water Research, 24, 507±514.ter Braak, C. J. F. (1986). `Canonical correspondence analysis: a new eigenvector technique for multivariatedirect gradient analysis', Ecology, 67, 1167±1179.
van Belle, G. and Fisher, L. (1977). `Monitoring the environment for ecological change', Journal of theWater Pollution Control Federation, 49, 1671±1679.
Zerbe, G. O. and Walker, S. H. (1977). `A randomization test for comparison of groups of growth curveswith di�erent polynomial design matrices', Biometrics, 33, 653±657.
# 1998 John Wiley & Sons, Ltd. ENVIRONMETRICS, VOL. 9, 37±51 (1998)
RANDOMIZATION IN MULTIVARIATE ANALYSIS 51