r&d expenditure ecosystem - science policy forum
TRANSCRIPT
CURRENT STATUS & WAY FORWARD
R&D EXPENDITUREECOSYSTEM
JULY 2019
EAC-PM

FOREWORD
EAC-PM
Investments in Research & Development (R&D) are key inputs for economic growth. There is ample empirical evidence to support investment in R&D in view of its impact on productivity, exports, employment and capital formation. Many countries have therefore opted to earmark a certain portion of the national budget towards R&D. Various reports of World Bank, UNESCO and World Intellectual Property Organization (WIPO) reflect the progress in R&D expenditure country wise.
India’s investment in R&D has shown a consistently increasing trend over the years. However, as a fraction of GDP, public expenditure on R&D has been stagnant over the past two decades. It has remained constant at around 0.6% to 0.7% of GDP. This is well below that in major countries such as the US (2.8), China (2.1), Israel (4.3) and Korea (4.2). Public expenditure is not only dominant but also the driving force of R&D spend in the country. This is in sharp contrast to the pattern in most advanced countries where private sector is the dominant force. However, the share of public expenditure in total R&D spend has come down from three-fourths of all expenditures to about three-fifths over the last few years. Further, the Government is not only the primary source of R&D funding but also it is the primary user of these funds. Most strikingly, Government expenditure on R&D is undertaken almost entirely by the Central Government. There is a need for greater participation of State Government and Private Sector in overall R&D spending especially in application-oriented R&D.
With this background, this document has been prepared to give an insight into the various institutional elements of the R&D ecosystem in the country. The objective of this document is threefold. First objective is to address the data gaps in compiling R&D data so that international agencies receive up to date data on R&D in order to reflect India’s true rank globally. Second objective is to examine the expenditure trends in various sectors and their shortcomings. The third and final objective is to lay down the roadmap for achieving the desired target of R&D spend by the year 2022. It is pertinent to mention that the focus of this booklet is on R&D expenditure and not on other outputs of R&D which may be equally important.

The inputs for this document have been derived from various stakeholders including industry, academia and Government. I had chaired three meetings with these stakeholders to ascertain the status of R&D spend and invite suggestions on the way forward. Based on these discussions this document has proposed a host of measures for transforming the R&D ecosystem and increasing the share of R&D in GDP.
I would like to thank Mr B.N. Satpathy, Senior Consultant, EAC to PM and Mr Suneet Mohan, Assistant Consultant, EAC to PM for their vital support in coordinating the development of this document. I would also like to extend a special vote of thanks to Prof. K Vijay Raghavan, Principal Scientific Adviser to the Government of India, to Dr. Arabinda Mitra, Scientific Secretary, Office of PSA and to Shri. J B Mohapatra, Adviser to PSA for their immense support in finalization of this document. I hope this document will open a new chapter in economy-wide mainstreaming of Research and Development in the country.
Ratan P. WatalMember Secretary
Economic Advisory Council to the Prime Minister

I would like to congratulate the Economic Advisory Council to the Prime Minister, its Member- Secretary, Shri Ratan Watal (a former Finance Secretary and cheer-leader for science) and his team consisting of Shri B. N. Satpathy and Shri Suneet Mohan for their efforts in compiling this report on the ‘Research and Development Expenditure Ecosystem: The Way Forward’.
We all agree that the research and development investment leads to disproportionate positive rewards in today’s world. Meeting our sustainable development goals, mitigating the consequences of climate catastrophe, striving for a circular-economy, ensuring health and well- being for our people, conserving biodiversity, ensuring food security, and national security— all these are inalienable components of our ambition to be a US $ 5 trillion economy soon. Rarely has so much been expected and demanded of a large nation in so little time. India’s challenge is to grow economically, lift everyone out of poverty but do so by not exploiting the planet, by not polluting and by not exploiting people. This task is feasible only if science and technology are the fulcrum on which the levers of government and industry rest. When the fulcrum is strong, the levers can lift any weight.
The question, then, is how one can strengthen the fulcrum of science. Invest more in science, is the ready refrain. While total investment in science is a valuable metric, it often hides far more than it reveals. The correlation between percentage of GDP invested in science and economic growth is a correlation. The investment has to be broken up into parts to understand the causal components. This will lead to deciding how we should increase our investment. Where and how does the government invest? What are the components of each funding agency’s investment? By industry? By philanthropy? By state governments? This is the input-end. Next, there is the use of investment. What are the expectations, the responsibilities the accountabilities. Finally, what are the outcomes and impacts of the investments.
India will be 75 years young soon. In 1947, India was a very small country in terms of its science and its economy. Today our scientific enterprise is large and has been a major
PREFACE
Office of the Principal Scientific Adviser to the Government of India
contributor to a large economy. We can feed our people, hundreds of millions have health and well-being, and the consequences of natural disasters have been minimized due to the use of technology. Much, much more remains to be done.
Yet, if we introspect, we might conclude that the whole is less than the sum of the parts and wonderful things have happened despite not paying attention to synergy and collaboration. What if, just what if, the finance ministry, our industry and philanthropy worked together with our ecosystem to strengthen our foundations, enhance our institutions from good to great, impact positively in a focused way on our people and our economy? And, if our scientists and institutions see the government and industry as partners in the future of the country? Miracles can happen. We have seen some examples where such collaboration and synergy have worked well. The development and deployment of a rotavirus vaccine is one example. The nan-science mission is another. We need a thousand such efforts.
We have had over the years, had many small under- powered boats attempting to accomplish big voyages. Today we need more power to the boats, refurbish them and also need to facilitate their movement in the same direction, each in their own manner but together to a common goal. The Watal report charts the seas we are voyaging, tells us about our boats and suggest how we can have them reach our common destination. Kudos to the team. We now have the task to distil their thoughts and go forward.
Prof. K Vijay RaghavanPrincipal Scientific Adviser to the Government of India


BRICS Brazil, Russia, India, China and South Africa
CPSE Central Public Sector Enterprises
CSIR Council of Scientific & Industrial Research
CSO Central Statistics Office
CSR Corporate Social Responsibility
DAE Department of Atomic Energy
DBT Department of Bio Technology
DOS Department of Space
DPE Department of Public Expenditure
DRDO Defence Research and Development Organisation
DSIR Department for Scientific & Industrial Research
DST Department of Science and Technology
EAC to PM Economic Advisory Council to the Prime Minister
EMR Extra Mural Research
ERD Engineering, Research and Development
FDI Foreign Direct Investment
FM Frascati Manual
FY Financial Year
FYP Five Year Plan
GERD Gross Expenditure on Research and Development
GII Global Innovation Index
GST Goods and Service Tax
ICAI Institute of Chartered Accountants of India
ICAR Indian Council of Agricultural Research
ICMR Indian Council of Medical Research
ICT Information and Communications Technology
IISER Indian Institutes of Science Education and Research
IIT Indian Institute of Technology
INR Indian Rupee
2
INSEAD Institut Européen d'Administration des Affaires
IP Intellectual Property
IT Act Income Tax Act
MCA/MOCA Ministry of Corporate Affairs
MeitY Ministry of Electronics and Information Technology
MHRD Ministry of Human Resource Development
MNRE Ministry of New and Renewable Energy
MoEFCC Ministry of Environment, Forest and Climate Change
MoFPI Ministry of Food Processing Industries
MoSPI Ministry of Statistics and Programme Implementation
MoU Memorandum of Understanding
MSME Micro, Small and Medium Enterprises
NDCU Non-Departmental Commercial Undertakings
NIIT National Institute of Information Technology
NISER National Institute of Science Education and Research
NITI National Institution for Transforming India
NSF National Science Foundation
OECD Organization for Economic Cooperation and Development
PPP Purchasing Power Parity
PSA Principal Scientific Adviser
R&D Research and Development
RBI Reserve Bank of India
SAP Systems, Applications and Products
SNA System of National Accounts
SSTP State Science and Technology Programme
STI Science, Technology and Innovation
TDB Technology Development Board
UNESCO United Nations Educational, Scientific and Cultural Organization
WIPO World Intellectual Property Organization
XBRL Extensible Business Reporting Language
Y-o-Y Year on Year
List of Abbreviations and Acronyms

3
BRICS Brazil, Russia, India, China and South Africa
CPSE Central Public Sector Enterprises
CSIR Council of Scientific & Industrial Research
CSO Central Statistics Office
CSR Corporate Social Responsibility
DAE Department of Atomic Energy
DBT Department of Bio Technology
DOS Department of Space
DPE Department of Public Expenditure
DRDO Defence Research and Development Organisation
DSIR Department for Scientific & Industrial Research
DST Department of Science and Technology
EAC to PM Economic Advisory Council to the Prime Minister
EMR Extra Mural Research
ERD Engineering, Research and Development
FDI Foreign Direct Investment
FM Frascati Manual
FY Financial Year
FYP Five Year Plan
GERD Gross Expenditure on Research and Development
GII Global Innovation Index
GST Goods and Service Tax
ICAI Institute of Chartered Accountants of India
ICAR Indian Council of Agricultural Research
ICMR Indian Council of Medical Research
ICT Information and Communications Technology
IISER Indian Institutes of Science Education and Research
IIT Indian Institute of Technology
INR Indian Rupee
INSEAD Institut Européen d'Administration des Affaires
IP Intellectual Property
IT Act Income Tax Act
MCA/MOCA Ministry of Corporate Affairs
MeitY Ministry of Electronics and Information Technology
MHRD Ministry of Human Resource Development
MNRE Ministry of New and Renewable Energy
MoEFCC Ministry of Environment, Forest and Climate Change
MoFPI Ministry of Food Processing Industries
MoSPI Ministry of Statistics and Programme Implementation
MoU Memorandum of Understanding
MSME Micro, Small and Medium Enterprises
NDCU Non-Departmental Commercial Undertakings
NIIT National Institute of Information Technology
NISER National Institute of Science Education and Research
NITI National Institution for Transforming India
NSF National Science Foundation
OECD Organization for Economic Cooperation and Development
PPP Purchasing Power Parity
PSA Principal Scientific Adviser
R&D Research and Development
RBI Reserve Bank of India
SAP Systems, Applications and Products
SNA System of National Accounts
SSTP State Science and Technology Programme
STI Science, Technology and Innovation
TDB Technology Development Board
UNESCO United Nations Educational, Scientific and Cultural Organization
WIPO World Intellectual Property Organization
XBRL Extensible Business Reporting Language
Y-o-Y Year on Year

4
All the global sources of data are in public domain. Out of the six national sources of data, only four data sources i.e. DST, DPE, RBI and Economic Survey are in public domain. The data sources which are not in public domain however have been used for internal analysis. We briefly discuss the salient features of various data sources and the methodology used in data analysis:
1. World Bank: World Bank maintains an online databank of R&D expenditure as a percentage of GDP for each country.
2. United Nations Educational, Scientific and Cultural Organization (UNESCO): UNECSO published a technical paper in 2010 which serves as a guide for conducting R&D surveys for countries starting to measure research and experimental development. This guide provides R&D indicators for evidence-based policy. It maintains data on R&D spend in USD in PPP.
3. World Intellectual Property Organization (WIPO): World Intellectual Property Organization (WIPO), a specialized agency of the United Nations in collaboration with Cornell University, INSEAD publishes the Global Innovation Index (GII) which aims to capture the multi-dimensional facets of innovation by providing a rich database of detailed metrics for 126 economies, which represent 90.8% of the world’s population and 96.3% of global GDP. This is an annual publication. GII 2018 covers 80 indicators out of which five indicators relate to R&D Expenditure known as GERD. The indicators are: Gross expenditure on R&D (GERD), Global R&D companies, average expenditure top 3, GERD performed by business enterprise, GERD financed by business enterprise and GERD financed by abroad. Data on these indicators are included in computing India’s rank in GII.
4. Department of Science & Technology (DST): Aggregate data on R&D spend is disseminated by DST on an annual basis. DST compiles the data through an annual survey of R&D units and
Data used in this document has been sourced from the following sources:
GLOBAL SOURCES NATIONAL SOURCES• World Bank• UNESCO• WIPO
• DST• DPE• RBI• Economic Survey • MoSPI• MCA
NOTE ON DATA SOURCES & METHODOLOGY

5
gives breakup of the compiled data into five sub-segments, namely: Central Government, State Sector, Public Sector, Private Sector and Higher Education Sector. No other official source disseminates aggregate data on R&D spend other than DST.
5. Department of Public Enterprise (DPE): DPE brings out the R&D spend by Central Public Sector Enterprises (CPSEs) on an annual basis through its annual publication titled “Public Enterprise Survey”.
6. Reserve Bank of India (RBI): RBI publishes an annual document titled State Finances – A Study of Budgets. This publication inter-alia covers state wise expenditure incurred on Agricultural Research Education & S&T and Environment incurred by State Governments.
7. Economic Survey 2017-18: Economic Survey provides an analysis of the trends in R&D expenditure. It is covered in Volumes 1 & 2 of the Economic Survey 2017-18.
8. Ministry of Statistics and programme Implementation (MoSPI): MoSPI does not disseminate R&D expenditure data in public domain, nor its shares in GDP. However, for the purpose of this document MoSPI has provided relevant information regarding the methodology for calculation of R&D/GDP share. As per this, the Research and Development Expenditure comprise of expenditure incurred by the Public and Private Corporate Sector as no expenditure is incurred by the Household Sector on R&D. Data for these two sectors are obtained from the following sources:
Data Source:
(i) Public Sector: Data is obtained from analysis of the Budget Documents of the Central & State Governments and in respect of Non-Departmental Commercial Undertakings (NDCUs), it is obtained from their Annual Reports.
(ii) Private Corporate Sector: Data is received from Ministry of Corporate Affairs filed by the Companies under MCA 21. Annually National Accounts Division received the data in respect of approx. 7 lakh companies. Around 30,000 – 40,000 big companies file their return in XBRL format as per mandate and rest of the companies may file their return in non-XBRL format. Non-XBRL companies’ contribution in capital formation and GVA is very less compared to XBRL companies.
9. Ministry of Corporate Affairs (MCA): MCA does not disseminate R&D expenditure data in public domain. However, for the purpose of this report MCA has provided data on R&D spend by companies who file their annual returns in XBRL format.
This note on Data Sources concludes with the following observations:
Data Gaps: R&D Expenditure data on certain indicators of GERD as covered in GII are not available and hence are not included in the overall computation model of GII. Secondly, as indicated earlier R&D data by private companies are not available in public domain. Third, the R&D data relating to Universities and State Governments are not readily available. Fourth, there
6
is also a considerable time lag in collection and dissemination of data on R&D spend. These major data gaps need to be addressed.
Data Variation: It has been found that there is a lot of variation in official data. Data received from DST was cross checked with comparable data received from DPE and MoSPI. It was found that the data from these sources do not match. This variation between official data is due to lack of coordinated efforts to collect data on R&D spend on a composite platform. This variation in the data needs to be addressed.
Notwithstanding these data gaps and data variation, this document presents the aggregate data on R&D spend as received from DST as the underlying trend in R&D spend remains intact irrespective of the data source.
Since all the sources of data are official sources, all are relevant and important, the analysis presented in this document is therefore without prejudice to either of these data sources.
All data and graphs used in this document are provisional and subject to revision based on inputs from stakeholders.

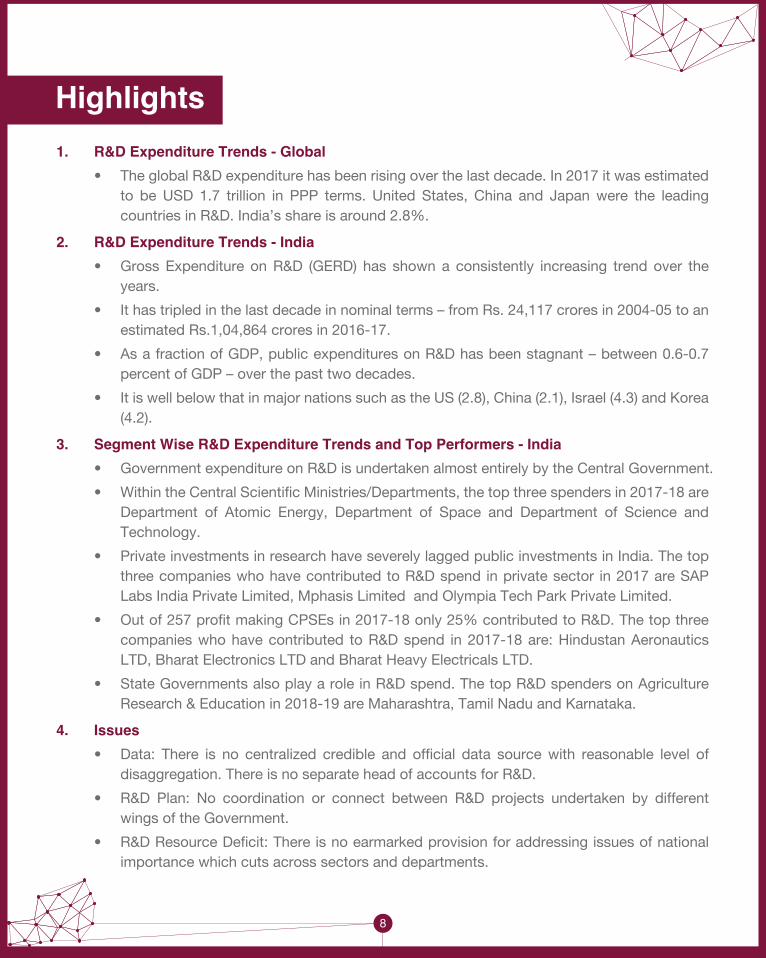
Highlights 1. R&D Expenditure Trends - Global • The global R&D expenditure has been rising over the last decade. In 2017 it was estimated
to be USD 1.7 trillion in PPP terms. United States, China and Japan were the leading countries in R&D. India’s share is around 2.8%.
2. R&D Expenditure Trends - India • Gross Expenditure on R&D (GERD) has shown a consistently increasing trend over the
years.
• It has tripled in the last decade in nominal terms – from Rs. 24,117 crores in 2004-05 to an estimated Rs.1,04,864 crores in 2016-17.
• As a fraction of GDP, public expenditures on R&D has been stagnant – between 0.6-0.7 percent of GDP – over the past two decades.
• It is well below that in major nations such as the US (2.8), China (2.1), Israel (4.3) and Korea (4.2).
3. Segment Wise R&D Expenditure Trends and Top Performers - India • Government expenditure on R&D is undertaken almost entirely by the Central Government.
• Within the Central Scientific Ministries/Departments, the top three spenders in 2017-18 are Department of Atomic Energy, Department of Space and Department of Science and Technology.
• Private investments in research have severely lagged public investments in India. The top three companies who have contributed to R&D spend in private sector in 2017 are SAP Labs India Private Limited, Mphasis Limited and Olympia Tech Park Private Limited.
• Out of 257 profit making CPSEs in 2017-18 only 25% contributed to R&D. The top three companies who have contributed to R&D spend in 2017-18 are: Hindustan Aeronautics LTD, Bharat Electronics LTD and Bharat Heavy Electricals LTD.
• State Governments also play a role in R&D spend. The top R&D spenders on Agriculture Research & Education in 2018-19 are Maharashtra, Tamil Nadu and Karnataka.
4. Issues • Data: There is no centralized credible and official data source with reasonable level of
disaggregation. There is no separate head of accounts for R&D.
• R&D Plan: No coordination or connect between R&D projects undertaken by different wings of the Government.
• R&D Resource Deficit: There is no earmarked provision for addressing issues of national importance which cuts across sectors and departments.
8

• R&D Incentives to Private Sector: The Private sector is playing a secondary role in the Indian R&D ecosystem compared to the Public sector. The reverse is the story in advanced countries.
• R&D Ecosystem in Public Sector: There is no connect between one PSU and another as regards to R&D investment. There is no institutional mechanism to connect PSU investment in R&D and academia.
• R&D in Universities: There is no systematic monitoring or evaluation of R&D projects by an independent unit.
• R&D by State Governments: There is no separate head of account for R&D and there is paucity of funds for research at the State level.
5. Opportunity • With growing globalization engineering R&D market in India is estimated to grow at a CAGR
of 14 per cent to reach US$ 42 billion by 2020.
6. Outcome and Targets • More than Double expenditure on R&D to ~ 2% of GDP by 2022
• India to target 50% of the Global R&D market
• Double R&D Exports by 2022
• Target FDI investment of USD 500 million by 2022
• Aspire to be one of the top ten Global R&D Institutions in emerging technologies
7. Recommendations • The document brings forward 14 recommendations under seven categories namely:
Institutional, Policy, Regulatory, Promotional, Monitoring & Evaluation, Data & Indicators and Tax Incentives with an empowered Office of Principal Scientific Adviser.
9
Executive Summary 15
Research & Development (R&D) – Concepts and Definitions 19
Global R&D Expenditure – An Overview 21
Economic Value of R&D 25
Gross Expenditure on R&D Trends 29
Sectoral Expenditure Trends and Issues 33
Central Government 33
CPSEs 34
Private Sector 37
State Government/UTs 38
Educational Institutions 39
Institutional Elements of R&D Ecosystem and Incentive Structure 41
Summary Issues 45
Opportunities and Targets 46
Recommendations 48
Annexures 56
Annexure 1: Definition of R&D 57
Annexure 2: Top 25 FDI Equity Inflow Cases 59
Annexure 3: R&D Expenditure Trends in Select CPSEs 62
i. Bharat Dynamics Ltd 62
ii. Bharat Electronics Ltd 63
iii. Bharat Heavy Electricals Ltd 64
10
Table of Contents

iv. Electronics Corporation of India Ltd 65
v. ITI Ltd 66
vi. MAZAGON Dock & Shipbuilders Ltd 67
vii. Hindustan Aeronautics Ltd 68
viii. Hindustan Petroleum Corporation Ltd 69
ix. Indian Oil Corporation Ltd 70
x. Bharat Petroleum Corporation Ltd 71
xi. NLC India LTD 72
xii. NTPC LTD 73
xiii. Nuclear Power Corporation of India Ltd 74
xiv. Oil & Natural Gas Corporation Ltd 75
xv. OIL India Ltd 76
xvi. Engineers India Ltd 77 xvii. Power Grid Corporation of India Ltd 78
Annexure 4: CPSE Highlights 79
Annexure 5: Sectoral break up of R&D expenditure - last 5 year 80
Annexure 6: MCA Methodology for R&D Data Capturing 82
Annexure 7: State Governments/UTs expenditure on R&D 84
Annexure 8: Core Grants released to State S&T Councils 89
Annexure 9: Expenditures made under State S&T Programme 91
Annexure 10: DSIR Criteria for R&D Recognition 92
Annexure 11: Research Initiatives in MHRD 94
11

List of Figures and TablesFigure 1: India’s R&D Ecosystem - The Public and Private Sector 16
Figure 2: % Share of Stakeholders 2016-17 16
Figure 3: Snapshot of Vision 17
Figure 4: Top 5 Priority Recommendations 18
Figure 5: Top 5 Countries Global share of R&D Spending (%) 21
Figure 6: Top 5 Countries R&D (as a % of GDP) 22
Figure 7: Top Five Companies with maximum R&D Spend 22
Figure 8: World Trade 2017 23
Figure 9: Top Exporters of R&D Services - Exported value in 2017 23
Figure 10: Top Importers of R&D Services - Imported value in 2017 24
Figure 11: R&D and Trade 26
Figure 12: Royalties, Copyright and License Fees 27
Figure 13: GERD on R&D by Performer Share 29
Figure 14: R&D Expenditure as a Percentage of GDP (Development Time) 31
Figure 15: Number of Operating CPSEs incurring Expenditure on R&D in last 5 years 35
Figure 16: Amount of R&D Expenditure of operating CPSEs in last 5 years (Rs in Crores) 35
Figure 17: % of R&D expenditure incurred by Operating CPSEs in last 5 years 35
Figure 18: Average Annual Growth Rate (%) (2017-18) 36
Figure 19: R&D Expenditure in XBRL_300500 37
Figure 20: Expenditure in Agricultural Research and Education 38
Figure 21: Expenditure in Science, Technology and Environment 39
Figure 22: Transformation of R&D Expenditure Ecosystem 44
12

Figure 23: National R&D Expenditure 47
Figure 24: Projected R&D Expenditure 47
Table 1: Top Five Countries in Global R&D Spend 21
Table 2: FDI inflow into R&D 27
Table 3: R&D Expenditure 30
Table 4: Expenditure of Principal Science Government Agencies 30
Table 5: Plan Outlays and Expenditure of Central Scientific Ministries/Departments 33
Table 6: Top Five CPSEs Incurring Maximum Expenditure on R&D 36
Table 7: Top Five Institutions & Amount Spend on R&D 40
Table 8: Recommendations, Actions, Implementing Agencies and Timelines 48
13
R&D Expenditure Ecosystem

This document has five objectives. First to examine the relevance of R&D in the context of economic growth and social wellbeing. Second to assess the level of R&D spend in India as compared to the global spend. Third to identify the major stakeholders in India’s R&D ecosystem and assess their relative contributions to total R&D spend. Fourth to examine the strength and weakness of the existing ecosystem in fostering R&D and lastly to prepare a roadmap for a smart efficient and effective R&D expenditure ecosystem by recommending suitable measures for reaching the desired level of R&D spend by 2022. These objectives have been addressed in the forthcoming chapters. A brief summary is given in the following paragraphs.
As India emerges as one of the world’s largest economies, it needs to gradually move from being a net consumer of knowledge to becoming a net producer. For this India needs to attract more productive investment in R&D. This would lay the foundation of a New India by 2022.
Investing in R&D is not only critical for maintaining growth momentum but also fundamental to India’s security: the human security of its populations; the resilience needed to address the multiple uncertainties stemming from climate change to global meltdown, the national security challenges stemming from cyberwarfare to autonomous military systems such as drones.
R&D has played a critical role in economic development of India and continues to do so. The economic contribution of R&D has been dealt in the second chapter of this document. The global R&D scenario has been dealt in the third chapter. In the subsequent chapters, India’s R&D expenditure trends have been dealt. Summary findings are as follows:
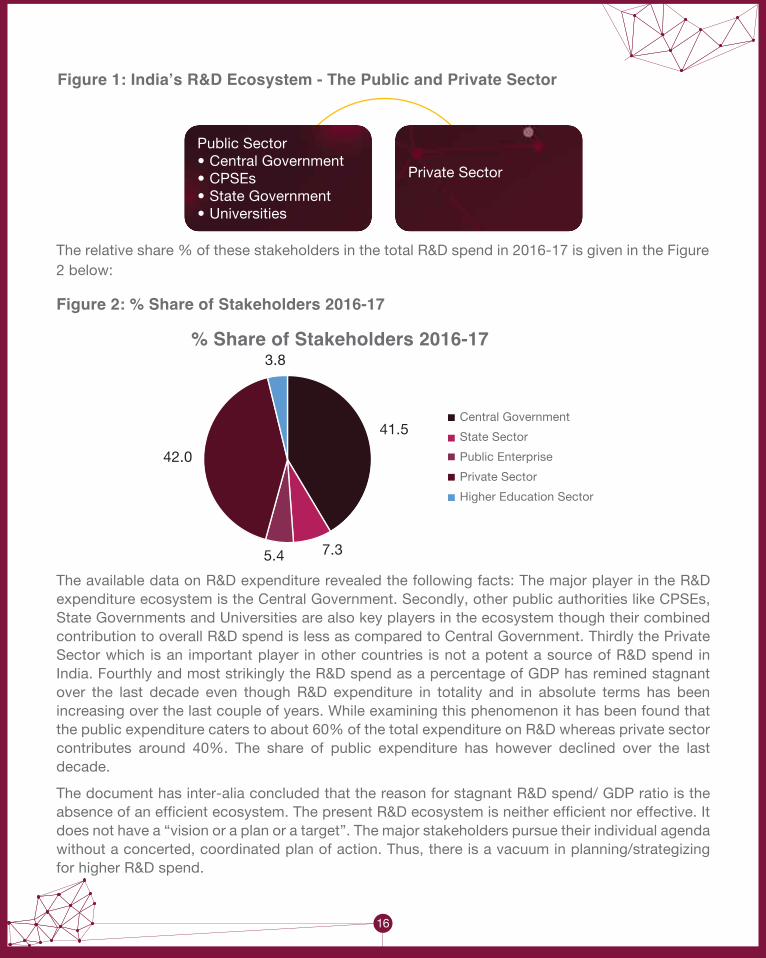
The major stakeholders in India’s R&D ecosystem can be divided into two categories. They are The Public and Private Sector:
15
1UNESCO
Towards a Smart, Efficient and Effective R&D Ecosystem
1. Executive Summary
Transform India’s R&D Expenditure Ecosystem by creating an institutional framework which fosters R&D spend in a coordinated, concerted and planned manner for achieving a target of GERD as 2% of GDP
16
Public Sector• Central Government• CPSEs• State Government• Universities
Private Sector
The relative share % of these stakeholders in the total R&D spend in 2016-17 is given in the Figure 2 below:
Figure 2: % Share of Stakeholders 2016-17
Figure 1: India’s R&D Ecosystem - The Public and Private Sector
The available data on R&D expenditure revealed the following facts: The major player in the R&D expenditure ecosystem is the Central Government. Secondly, other public authorities like CPSEs, State Governments and Universities are also key players in the ecosystem though their combined contribution to overall R&D spend is less as compared to Central Government. Thirdly the Private Sector which is an important player in other countries is not a potent a source of R&D spend in India. Fourthly and most strikingly the R&D spend as a percentage of GDP has remined stagnant over the last decade even though R&D expenditure in totality and in absolute terms has been increasing over the last couple of years. While examining this phenomenon it has been found that the public expenditure caters to about 60% of the total expenditure on R&D whereas private sector contributes around 40%. The share of public expenditure has however declined over the last decade.
The document has inter-alia concluded that the reason for stagnant R&D spend/ GDP ratio is the absence of an efficient ecosystem. The present R&D ecosystem is neither efficient nor effective. It does not have a “vision or a plan or a target”. The major stakeholders pursue their individual agenda without a concerted, coordinated plan of action. Thus, there is a vacuum in planning/strategizing for higher R&D spend.
% Share of Stakeholders 2016-17
Central Government
State Sector
Public Enterprise
Private Sector
Higher Education Sector
41.5
3.8
42.0
5.4 7.3
There is a need to have a vision, a plan to achieve and a pre-determined R&D spend target. This task was earlier dealt by the erstwhile Planning Commission where the national R&D plan was covered in the Science and Technology chapter of each Five-Year Plan (FYP). In the Twelfth FYP, R&D spend as a percentage of GDP was targeted at 2%. This role of preparing and coordinating the national R&D Plan in the country could be assigned to the Office of Principal Scientific Adviser (PSA), as it is critically placed in the hierarchy of things. For this a clear mandate however has to be assigned to PSA through appropriate amendment of allocation of business rules and the PSA’s office is to be appropriately repositioned. This could go a long way in revamping the National R&D Ecosystem with a new vision, mission and target.
Thus, it is clear that there is no single coordinating agency to oversee the quality and quantum of expenditure. Consequently, there are data gaps, data discrepancies and lack of coordinated approach to R&D spend with a vision.
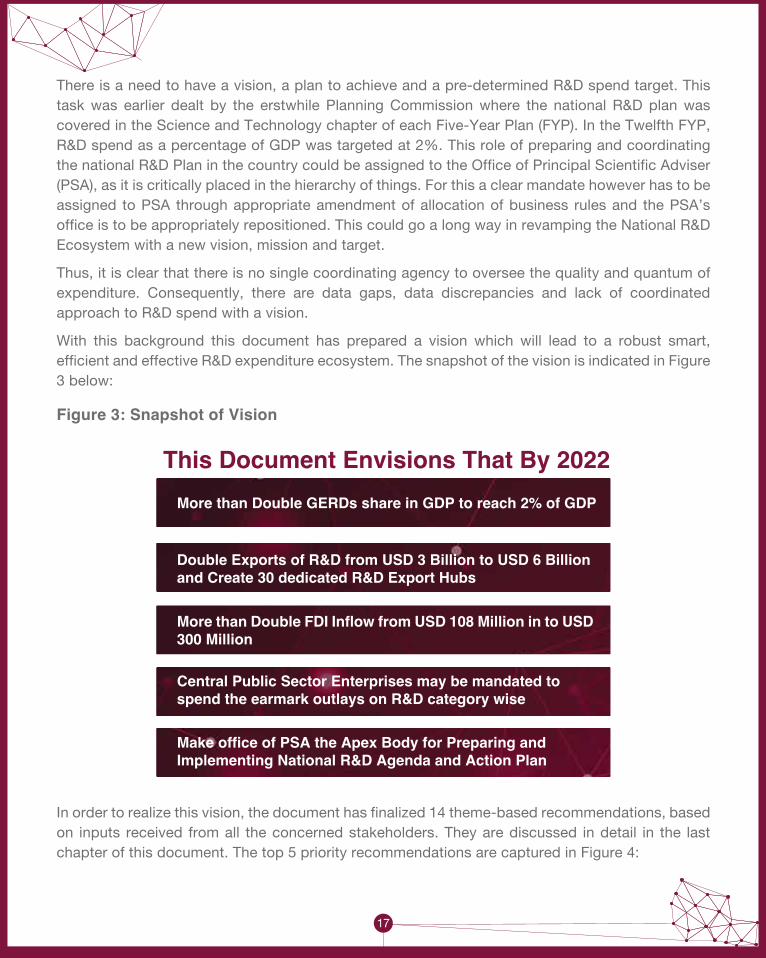
With this background this document has prepared a vision which will lead to a robust smart, efficient and effective R&D expenditure ecosystem. The snapshot of the vision is indicated in Figure 3 below:
Figure 3: Snapshot of Vision
The available data on R&D expenditure revealed the following facts: The major player in the R&D expenditure ecosystem is the Central Government. Secondly, other public authorities like CPSEs, State Governments and Universities are also key players in the ecosystem though their combined contribution to overall R&D spend is less as compared to Central Government. Thirdly the Private Sector which is an important player in other countries is not a potent a source of R&D spend in India. Fourthly and most strikingly the R&D spend as a percentage of GDP has remined stagnant over the last decade even though R&D expenditure in totality and in absolute terms has been increasing over the last couple of years. While examining this phenomenon it has been found that the public expenditure caters to about 60% of the total expenditure on R&D whereas private sector contributes around 40%. The share of public expenditure has however declined over the last decade.
The document has inter-alia concluded that the reason for stagnant R&D spend/ GDP ratio is the absence of an efficient ecosystem. The present R&D ecosystem is neither efficient nor effective. It does not have a “vision or a plan or a target”. The major stakeholders pursue their individual agenda without a concerted, coordinated plan of action. Thus, there is a vacuum in planning/strategizing for higher R&D spend.
There is a need to have a vision, a plan to achieve and a pre-determined R&D spend target. This task was earlier dealt by the erstwhile Planning Commission where the national R&D plan was covered in the Science and Technology chapter of each Five-Year Plan (FYP). In the Twelfth FYP, R&D spend as a percentage of GDP was targeted at 2%. This role of preparing and coordinating the national R&D Plan in the country could be assigned to the Office of Principal Scientific Adviser (PSA), as it is critically placed in the hierarchy of things. For this a clear mandate however has to be assigned to PSA through appropriate amendment of allocation of business rules and the PSA’s office is to be appropriately repositioned. This could go a long way in revamping the National R&D Ecosystem with a new vision, mission and target.
Thus, it is clear that there is no single coordinating agency to oversee the quality and quantum of expenditure. Consequently, there are data gaps, data discrepancies and lack of coordinated approach to R&D spend with a vision.
With this background this document has prepared a vision which will lead to a robust smart, efficient and effective R&D expenditure ecosystem. The snapshot of the vision is indicated in Figure 3 below:
Figure 3: Snapshot of Vision
17
In order to realize this vision, the document has finalized 14 theme-based recommendations, based on inputs received from all the concerned stakeholders. They are discussed in detail in the last chapter of this document. The top 5 priority recommendations are captured in Figure 4:
This Document Envisions That By 2022More than Double GERDs share in GDP to reach 2% of GDP
Double Exports of R&D from USD 3 Billion to USD 6 Billion and Create 30 dedicated R&D Export Hubs
More than Double FDI Inflow from USD 108 Million in to USD 300 Million
Central Public Sector Enterprises may be mandated to spend the earmark outlays on R&D category wise
Make office of PSA the Apex Body for Preparing and Implementing National R&D Agenda and Action Plan

Figure 4: Top 5 Priority Recommendations
Top 5 Priority RecommendationsThe STI Policy may be suitably amended to reflect the changing landscape of R&D with disaggregated targets as proposed in this report for expenditure, FDI and exports
Create new R&D Export Hubs which could leverage the existing Science Parks with Software Technology Parks. 30 such parks may be created which will be inline with special economic zones for R&D
MoU guidelines may be suitably strengthened to create greater weightage to R&D with outcome indicators. This should be reflected as an activity other than energy saving related R&D
A corpus of INR 5000 Crore may be created for funding of mega projects with cross cutting themes which are of national interest
PSA to be the top national coordinator for R&D in the Country and appropriately positioned. This office will connect with all R&D Spending stakeholders including CPSEs, Universities, domestic and international R&D institutions and State Governments
18
By acceptance of these recommendations it is estimated that overall R&D spend will increase by more than four times in 2021-2022 with private sector playing a major role and contributing 60% of the total spend instead of 40% as observed in the present scenario. This will relieve the public exchequer of fiscal stress arising out of need to achieve a 2% ratio with GDP. This will also lead to doubling of R&D exports and FDI coming into the R&D sector.

19
2. Research & Development (R&D) – Concepts and Definitions
Research & Development (R&D) has many connotations. It is used in various forums for various objectives. In this document we make a distinction between R&D as an activity which is unique and R&D Expenditure which is recognized under the prevailing law as expenditure attributable to R&D.
R&D activities can be defined as any systematic and creative work undertaken in order to increase the stock of knowledge and use of this knowledge to devise new applications. R&D activities include one or more of the categories of research such as basic research, applied research and experimental development. (Source: UNESCO manual 1984 and frascati manual, OECD, 2015). The term R&D thus covers three activities: basic research, applied research and experimental development (FM §64). The basic criterion for distinguishing R&D from related activities is the presence in R&D of an appreciable element of novelty and the resolution of scientific and/or technological uncertainty, i.e. when the solution to a problem is not readily apparent to someone familiar with the basic stock of common knowledge and techniques for the area concerned (FM §84).
As regards R&D expenditure, the global practice is to term it as Gross Domestic Expenditure on R&D (GERD). The nomenclature of GERD is derived from OECD manual “The Measurement of Scientific and Technical Activities: Proposed Standard Practice for Surveys of Research and Development, Paris”. In line with the System of National Accounts (SNA), and following the National Science Foundation (NSF), the manual recommended classifying R&D according to three main economic sectors: business, government and private. To these three sectors, the OECD, following the NSF again, added a fourth one: higher education. The rationale for including Higher Education was as follows: The definitions of the first three sectors are basically the same as in national accounts, but higher education is included as a separate main sector here because of the concentration of a large part of fundamental research activity in the universities and the crucial importance of these institutions in the formulation of an adequate national policy for R&D. For linking R&D and Economic Growth, OECD has used GERD as a percentage of Gross National Product as an indicator for international comparisons. The generalized use of this indicator has been reflected in many global
R&D as an activity has three distinguishing features. It involves Basic Research, Applied Research and Experimental Development. The concept of GERD has been derived from OECD and is known as Gross Domestic Expenditure on R&D. It is the sum of R&D Expenditure of four economic sectors namely, Business, Government, Private Sector and Higher Education. This section discusses the various definitions of R&D as an activity and the criterion for identifying R&D Expenditure.
publications like the Global Innovation Index which uses five indicators of GERD. The indicators used are: Gross expenditure on R&D (GERD) as a proportion of GDP. Global R&D companies, average expenditure top 3, GERD performed by business enterprise, GERD financed by business enterprise and GERD financed by abroad.
In India, the Department of Scientific & Industrial Research (DSIR) is operating a scheme for granting recognition & registration to in-house R&D units established by corporate industry. This is the only scheme of the Government which is set-up for benchmarking the industrial R&D. Government of India has announced a number of fiscal incentives for research and development by industry from time to time and many of these incentives are implemented through DSIR. In-house R&D units recognized by DSIR are not only eligible for these incentives (wherever applicable) but also for receiving funds for R&D from other government departments and agencies such as DST, DBT, Deity, MoEFCC, MNRE, MoFPI, CSIR, ICMR, ICAR, TDB where recognition to the in-house R&D centre by DSIR is a requirement. As regards the Accounting Standard of ICAI, an enterprise is required to disclose the aggregate amount of R&D expenditure as an expense during the period under the financial statements. The Accounting standard prescribes the recognition criteria of the Intangible Asset which may be generated from the R&D activities undertaken by the company, rules for measurement, and disclosure requirements in the financial statements. The expenditure incurred by the enterprise can broadly be categorised into Research expenditure and Development expenditure. Expenditure incurred on research is to be recognized as an expense and charged off at the point of incurrence. The other definitions of R&D used in India are mentioned in Annexure 1.
20
Research & Development (R&D) has many connotations. It is used in various forums for various objectives. In this document we make a distinction between R&D as an activity which is unique and R&D Expenditure which is recognized under the prevailing law as expenditure attributable to R&D.
R&D activities can be defined as any systematic and creative work undertaken in order to increase the stock of knowledge and use of this knowledge to devise new applications. R&D activities include one or more of the categories of research such as basic research, applied research and experimental development. (Source: UNESCO manual 1984 and frascati manual, OECD, 2015). The term R&D thus covers three activities: basic research, applied research and experimental development (FM §64). The basic criterion for distinguishing R&D from related activities is the presence in R&D of an appreciable element of novelty and the resolution of scientific and/or technological uncertainty, i.e. when the solution to a problem is not readily apparent to someone familiar with the basic stock of common knowledge and techniques for the area concerned (FM §84).
As regards R&D expenditure, the global practice is to term it as Gross Domestic Expenditure on R&D (GERD). The nomenclature of GERD is derived from OECD manual “The Measurement of Scientific and Technical Activities: Proposed Standard Practice for Surveys of Research and Development, Paris”. In line with the System of National Accounts (SNA), and following the National Science Foundation (NSF), the manual recommended classifying R&D according to three main economic sectors: business, government and private. To these three sectors, the OECD, following the NSF again, added a fourth one: higher education. The rationale for including Higher Education was as follows: The definitions of the first three sectors are basically the same as in national accounts, but higher education is included as a separate main sector here because of the concentration of a large part of fundamental research activity in the universities and the crucial importance of these institutions in the formulation of an adequate national policy for R&D. For linking R&D and Economic Growth, OECD has used GERD as a percentage of Gross National Product as an indicator for international comparisons. The generalized use of this indicator has been reflected in many global
publications like the Global Innovation Index which uses five indicators of GERD. The indicators used are: Gross expenditure on R&D (GERD) as a proportion of GDP. Global R&D companies, average expenditure top 3, GERD performed by business enterprise, GERD financed by business enterprise and GERD financed by abroad.
In India, the Department of Scientific & Industrial Research (DSIR) is operating a scheme for granting recognition & registration to in-house R&D units established by corporate industry. This is the only scheme of the Government which is set-up for benchmarking the industrial R&D. Government of India has announced a number of fiscal incentives for research and development by industry from time to time and many of these incentives are implemented through DSIR. In-house R&D units recognized by DSIR are not only eligible for these incentives (wherever applicable) but also for receiving funds for R&D from other government departments and agencies such as DST, DBT, Deity, MoEFCC, MNRE, MoFPI, CSIR, ICMR, ICAR, TDB where recognition to the in-house R&D centre by DSIR is a requirement. As regards the Accounting Standard of ICAI, an enterprise is required to disclose the aggregate amount of R&D expenditure as an expense during the period under the financial statements. The Accounting standard prescribes the recognition criteria of the Intangible Asset which may be generated from the R&D activities undertaken by the company, rules for measurement, and disclosure requirements in the financial statements. The expenditure incurred by the enterprise can broadly be categorised into Research expenditure and Development expenditure. Expenditure incurred on research is to be recognized as an expense and charged off at the point of incurrence. The other definitions of R&D used in India are mentioned in Annexure 1.

21
In 2017 the global R&D spend amounted to USD 1.7 trillion in PPP terms. The top five countries in global R&D spend are indicated in Table 1:
Table 1: Top Five Countries in Global R&D Spend1
The global share percentage of the countries listed above is indicated in Figure 5:
Figure 5: Top 5 Countries Global share of R&D Spending (%)
3. Global R&D Expenditure – An Overview
Globally R&D expenditure is led by five countries, they are: USA, China, Japan, Germany and South Korea. Asia is emerging as a global destination for R&D investment. India’s share is not only low but as compared to GDP is negligible. This is in addition to the fact that the R&D companies who have a global stature in R&D are not from India. This is not only a challenge but also an opportunity for India. In this section we have indicated the emerging trends in global R&D spend.
Rank Country R&D Spending in Billion PPP $#1 United States 543.2
#2 China 496.0
#3 Japan 175.8
#4 Germany 127.1
#5 South Korea 89.8
1UNESCO
United States
China
Japan
Germany
South Korea
Rest of the World
31.9
29.1
10.3
7.5
5.3
15.9

22
In terms of spend, United States is the largest of the global spenders on R&D followed by China and Japan. The major spenders within Europe are Germany, France, and the UK. The industries that lead in the total R&D spending are auto, health care, computing and electronics and defence. Measuring R&D in absolute terms shows where most of the world’s research happens, but it fails to capture the countries that are spending more in relative terms.
The top five countries which allocate the highest percentage of their GDP to R&D in 2017 is indicated in Figure 6:
Figure 6: Top 5 Countries R&D (as a % of GDP)
The top five companies that have the maximum spend on R&D is as under3:
Figure 7: Top Five Companies with maximum R&D Spend
3
Top 5 Countries R&D (as a % of GDP
South Korea
4.3% 4.2%
3.4%3.2% 3.2%
Israel Japan Switzerland Finland
R&D (in billion U.S. dollars)
Amazon Alphabet Volkswagen Samsung Intel Co.
22.6
16.2 15.8 15.313.1
2UNESCO3www.statista.com

While the United States and Japan remain leaders in R&D spend, there is an increasing shift of R&D spend to the Asian markets. The Asian economies such as China, India, Japan and South Korea are likely to drive R&D growth in years to come, especially in the fields of energy, pharmaceuticals and space technologies. Growth of technological capabilities in this region is the prime contributing factor. Another factor which influences the move of R&D towards the Asian countries is the demographic factor. The growing population base in Asia, primarily China and India will continue to drive market opportunities. R&D for consumer related products and technologies, such as consumer electronics, foods, and transportation, is likely to increase in direct relation to the population growth trends. With globalization, outsourcing, and increased investments in R&D in the area of ICT (information and communications technologies) there has been a spread of R & D to new geographies. Technology organizations can now outsource the development of new technology-based products to various countries that have many of the technology resources once limited to advanced economies. Countries such as China, India, Korea, Brazil, and Eastern Europe are now able to attract FDI into R&D sector.4
R&D also contributes to world trade in commercial services. In terms of classification trade in R&D is covered under “other commercial services”. It has got two categories i.e. Work undertaken on a systematic basis to increase the stock of knowledge and Other than work undertaken on a systematic basis to increase the stock of knowledge. In 2017 the share of Other Commercial Services exports and imports in total global commercial services exports and imports were 54% and 50% respectively. India is a leading exporter of other commercial services with a share of 4.9% in global trade of commercial services in 2017.
Figure 8: World Trade 2017
23
6WTO – World Trade Statistics 2017
World Trade 2017• Merchandise: USD 17.73 Trillion• Commercial Services: USD 5.28 Trillion
The top 5 countries importing and exporting R&D services are as under:
Figure 9: Top Exporters of R&D Services - Exported value in 2017
4,27,65,150
2,48,41,407
64,94,925 54,17,839 49,50,819
United States ofAmerica
Germany Japan Belgium Ireland
Top Exporters of R&D Services - Exported value in 2017 in USD Thousand
6

24
7WTO – World Trade Statistics 2017
Figure 10: Top Importers of R&D Services - Imported value in 2017
3,49,22,000
3,05,80,517
2,22,02,899
1,73,11,081
1,32,94,129
United States ofAmerica
Ireland Germany Japan Switzerland
Top Importers of R&D Services - Imported value in 2017 in USD Thousand
India’s share in Global R&D Expenditure is 2.8% amounting to USD 48.1 billion in PPP terms. In terms of R&Ds share in GDP, it is around 0.6% which is one of the lowest amongst the BRICS Countries.
7

There is ample global evidence of the fact that R&D is a key driver of productivity and economic growth. It has been observed that two-thirds of economic growth in Europe from 1995 to 2007 was attributed to R&D. R&D accounted for 15% of all productivity gains in Europe for this period. An increase of 10% in R&D investment is associated with gains in productivity ranging from 1.1% to 1.4% (Donselaar and Koopmans, 2016).
Conceptually, R&D contributes to economic growth in multiple ways. It leads to capital formation which in turn results in economic growth. It is a source for trade in services and FDI. The evidence with respect to India is given in the following paras.
As per the data received from Ministry of Statistics, R&D expenditure increased from Rs. 57,908 crore in 2015-16 to Rs. 73,720 crore in 2017-18. However, as a percentage of GDP, R&D has remained virtually stagnant at around 0.6%. It may be noted here that this data is not in public domain and does not tally with data published by Department of Science and Technology (DST) and other international organizations like World Bank. This is due to the fact that the coverage of data and their sources are different. This has been explained in the note on data sources.
Notwithstanding this data variation it is worth emphasizing that the trend of a stagnant R&D, GDP ratio in the last one decade remains unchanged.
R&D is a service activity. As per CSO’s new method, it is now a part of the professional scientific & technical activities. Export and Import revenue arising out of this activity are captured under the invisibles category of balance of payments published by RBI.
As per data received from RBI, R&D exports have grown from USD 1,486 million in 2015-16 to USD 3,603 million in 2017-18 and R&D imports have grown from USD 339 million in 2015-16 to USD 464 million in 2017-18. It is noteworthy that India enjoys a positive balance of trade in R&D sector which means that India is a net exporter of R&D to rest of the world. This is graphed in Figure 11.
25
4. Economic Value of R&D
R&D as an activity is measurable and has economic value. It contributes to GDP, Exports – Imports and FDI. The Intellectual Property generated from R&D also brings in revenue to the economy in the form of copy rights and patents. This section discusses the economic contribution of R&D to Indian Economy.

Figure 11: R&D and Trade
R&D and Trade (USD Million)
2015-16 2016-17 2017-18Exports 1486 2075 3603
Imports 339 397 464
Net 1147 1678 3139
1486
2075
3603
339397
464
1147
1678
3139
R&D leads to Intellectual Property which in turn generates revenue to the researcher in the form of Royalties, copyright and license fees. Export and Import of Royalties, copyright and license fees are important reflectors of innovation in the country.
As per the data received from RBI, export revenue on these accounts have grown from USD 489 million in 2015-16 to USD 732 million in 2017-18, whereas import revenue has grown from USD 4891 million in 2015-16 to USD 6877 million in 2017-18. The Figure 12 indicates that India is a net importer of IP and there is immense opportunity in this area to grow.
26
8
8RBI
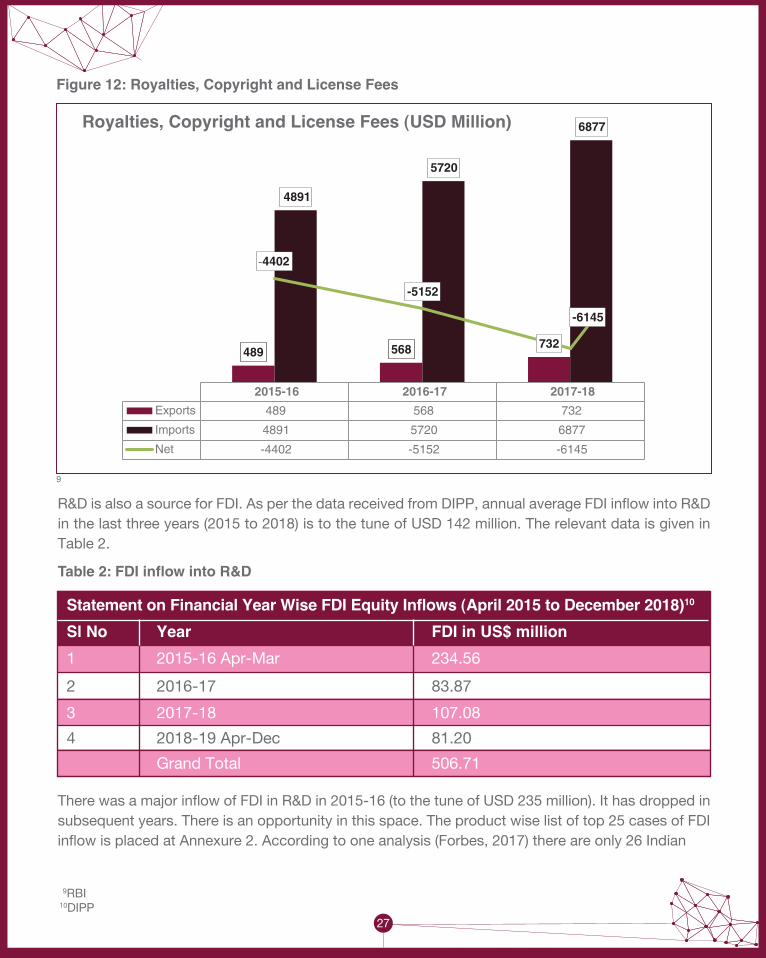
Figure 12: Royalties, Copyright and License Fees
Royalties, Copyright and License Fees (USD Million)
2015-16 2016-17 2017-18
Exports 489 568 732
Imports 4891 5720 6877
Net -4402 -5152 -6145
489 568 732
4891
5720
6877
-4402
-5152
-6145
0
R&D is also a source for FDI. As per the data received from DIPP, annual average FDI inflow into R&D in the last three years (2015 to 2018) is to the tune of USD 142 million. The relevant data is given in Table 2.
Table 2: FDI inflow into R&D
There was a major inflow of FDI in R&D in 2015-16 (to the tune of USD 235 million). It has dropped in subsequent years. There is an opportunity in this space. The product wise list of top 25 cases of FDI inflow is placed at Annexure 2. According to one analysis (Forbes, 2017) there are only 26 Indian
9RBI10DIPP
9
Statement on Financial Year Wise FDI Equity Inflows (April 2015 to December 2018)10 Sl No Year FDI in US$ million1 2015-16 Apr-Mar 234.56
2 2016-17 83.87
3 2017-18 107.08
4 2018-19 Apr-Dec 81.20
Grand Total 506.71
27

companies in the list of the top 2,500 global R&D spenders compared to 301 Chinese companies. 19 (of these 26) firms are in just three sectors: pharmaceuticals, automobiles and software. India has no firms in five of the top ten R&D sectors as opposed to China that has a presence in each of them.
To sum up, R&D has contributed to capital formation, export of services and FDI. This is in addition to the fact that the contribution of R&D to social wellbeing is also phenomenal. Our societies face multiple, complex and urgent challenges that affect the quality of life of our citizens: from energy efficiency to security, climate change or an ageing population. R&D has played a crucial role to anticipate and respond to these needs. There is little data to support these aspects of R&D though their impact is felt all across the society.
Investing in R&D is fundamental to India’s national security: the security of its populations; the resilience needed to address the multiple uncertainties stemming from climate change and global meltdown.
28

29
The first trend observed is that the investments in Indian science, measured in terms of Gross Expenditure on R&D (GERD), have shown a consistently increasing trend over the years. GERD has tripled in the last decade in nominal terms – from Rs. 24,117 crores in 2004-05 to Rs. 85,326 crores in 2014-15 and an estimated Rs.1,04,864 crores in 2016-17 – and double in real terms (Table 3).
The second trend is that as a fraction of GDP, R&D spend has been stagnant – between 0.6 - 0.7 percent of GDP – over the past two decades. India’s spending on R&D (about 0.6 percent of GDP) is well below that in major nations such as the US (2.8), China (2.1), Israel (4.3) and Korea (4.2). It is also unique in how dominant government is in carrying out R&D (Figure 13).
Figure 13: GERD on R&D by Performer Share
5. Gross Expenditure on R&D Trends11
Gross Expenditure on R&D is a relevant indicator for measuring the amount of resources allocated in the economy to R&D activities. The overall trends of R&D expenditure in India are not satisfactory. In this section we discuss the various contributors to aggregate R&D expenditure and their relative roles. This is a macro picture followed by segment wise analysis in the succeeding sections.
India China
Per
cent
age
of G
ER
D
Germany
Government Business Unversity Private Non-Profit
Korea USA Japan Israel
100%
90%
80%
70%
60%
50%
40%
30%
20%
10%
0%
GERD on R&D by Performer Share in 2015
11Economic Survey.
30
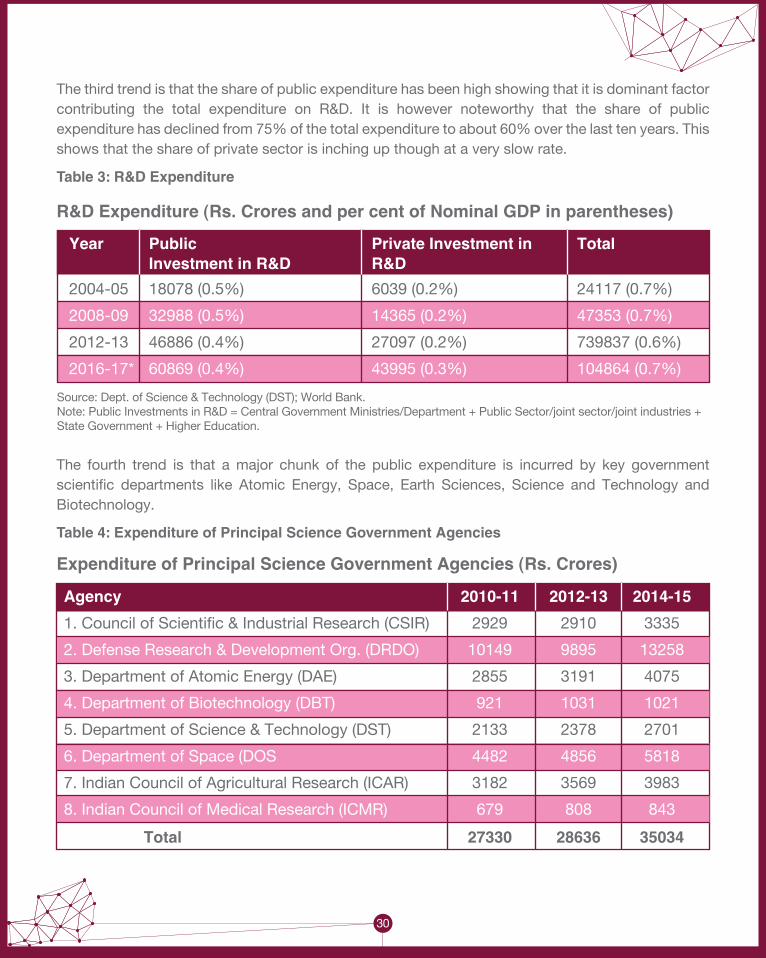
The third trend is that the share of public expenditure has been high showing that it is dominant factor contributing the total expenditure on R&D. It is however noteworthy that the share of public expenditure has declined from 75% of the total expenditure to about 60% over the last ten years. This shows that the share of private sector is inching up though at a very slow rate.
Table 3: R&D Expenditure
Year Public Private Investment in Total Investment in R&D R&D2004-05 18078 (0.5%) 6039 (0.2%) 24117 (0.7%)
2008-09 32988 (0.5%) 14365 (0.2%) 47353 (0.7%)
2012-13 46886 (0.4%) 27097 (0.2%) 739837 (0.6%)
2016-17* 60869 (0.4%) 43995 (0.3%) 104864 (0.7%)
R&D Expenditure (Rs. Crores and per cent of Nominal GDP in parentheses)
The fourth trend is that a major chunk of the public expenditure is incurred by key government scientific departments like Atomic Energy, Space, Earth Sciences, Science and Technology and Biotechnology.
Table 4: Expenditure of Principal Science Government Agencies
Expenditure of Principal Science Government Agencies (Rs. Crores)
Source: Dept. of Science & Technology (DST); World Bank.Note: Public Investments in R&D = Central Government Ministries/Department + Public Sector/joint sector/joint industries +State Government + Higher Education.
Agency 2010-11 2012-13 2014-151. Council of Scientific & Industrial Research (CSIR) 2929 2910 3335
2. Defense Research & Development Org. (DRDO) 10149 9895 13258
3. Department of Atomic Energy (DAE) 2855 3191 4075
4. Department of Biotechnology (DBT) 921 1031 1021
5. Department of Science & Technology (DST) 2133 2378 2701
6. Department of Space (DOS 4482 4856 5818
7. Indian Council of Agricultural Research (ICAR) 3182 3569 3983
8. Indian Council of Medical Research (ICMR) 679 808 843
Total 27330 28636 35034
The fifth trend is that in contrast to the trend observed in advanced countries where the private sector carries out the bulk of research and development. In India, the government is not just the primary source of R&D funding but also its the primary user of these funds.
Government expenditure on R&D is undertaken almost entirely by the central government with state government playing a secondary role.
The sixth trend is that universities play a relatively small role in the research activities of the country. This is in contrast to the scenario in advanced countries where universities play a critical role in creating the talent pool for research and generating high quality research. In India, publicly funded research is concentrated in specialized research institutes under different government departments. This leaves universities to largely play a teaching role – a decision that goes back to the 1950s. It is now widely acknowledged that whatever the merits of the decision at the time, this disconnect has severely impaired both teaching as well as the research enterprise in the country.
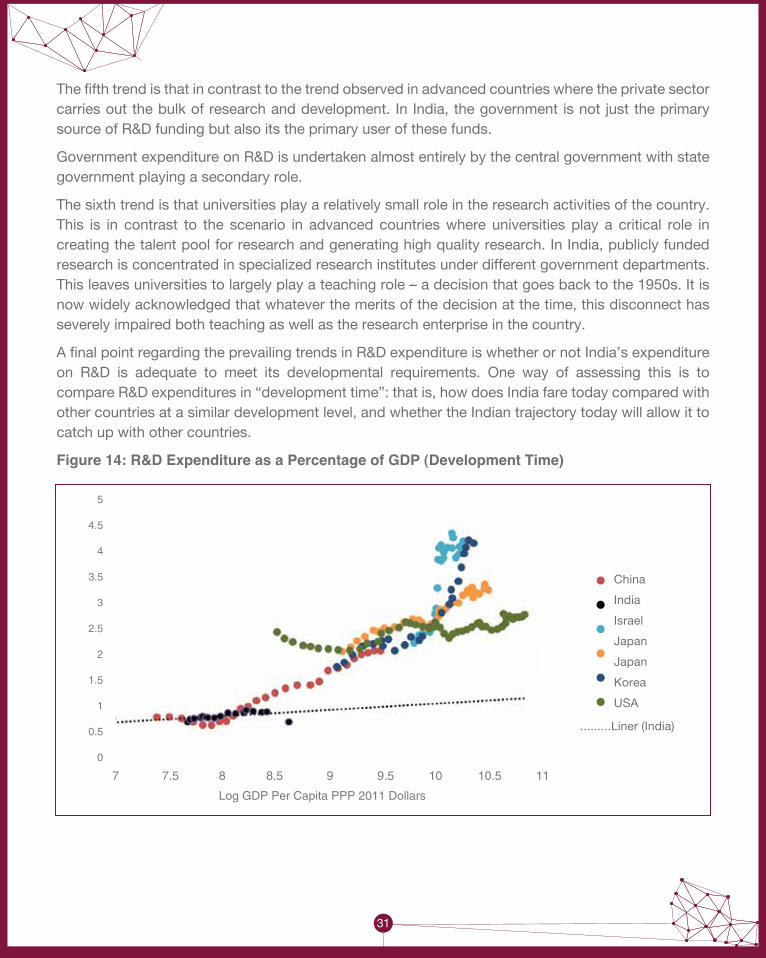
A final point regarding the prevailing trends in R&D expenditure is whether or not India’s expenditure on R&D is adequate to meet its developmental requirements. One way of assessing this is to compare R&D expenditures in “development time”: that is, how does India fare today compared with other countries at a similar development level, and whether the Indian trajectory today will allow it to catch up with other countries.
Figure 14: R&D Expenditure as a Percentage of GDP (Development Time)
31
China
India
Israel
Japan
Japan
Korea
USA
.........Liner (India)
Log GDP Per Capita PPP 2011 Dollars
5
4.5
4
3.5
3
2.5
2
1.5
1
0.5
0
7 7.5 8 8.5 9 9.5 10 10.5 11

32
The Figure 14 plots R&D as a share of GDP against per capita GDP for a set of comparable countries. It shows that India was, at one point, spending more on R&D as percentage of GDP than countries like China at the same level of GDP per capita. As a lower middle-income country, it is not surprising that India’s spending on R&D lags upper-middle income and high-income countries such as China, Israel, and the U.S. However, it currently underspends even relative to its income level. In addition, most other countries, especially East Asian countries like China, Japan, and Korea, have seen dramatic increases in R&D as a percentage of GDP as they have become richer. India, on the other hand, has only seen a slight increase. In fact, in 2015, there was a sizeable decline in R&D spending even as GDP per capita continued to rise.

33
Gross Expenditure on R&D (GERD) is mainly driven by Government sector comprising of Central Government 45.1%, State Governments 7.4%, Higher Education 3.9% and Public Sector Industries 5.5% with Private Sector Industries contributing 38.1% during 2014-15. In totality, there are five tiers under which the R&D expenditure has been categorised.
Central Government: The first tier is the Central Government. In India Central Government dominates and drives R&D. Major share of R&D spend is accounted for by the Central Government. Given the importance of the growth in R & D, the government had proposed an increased allocation for scientific departments in the 12th Five Year Plan. It had earmarked 3% of planned outlay which was higher than agriculture, irrigation and communications. It had proposed an allocation of Rs 1.30 lakh crore for science, technology and environment as against a total allocation of 43.3 lakh crore. It had also offered various incentives for promoting R&D in the country.
The Science & Technology departments who have the highest spend in R&D are as follows:
Table 5: Plan Outlays and Expenditure of Central Scientific Ministries/Departments
6. Sectoral Expenditure Trends and Issues
This section deals with R&D expenditure trends segment wise. The major segments covered are Central Government, CPSEs, Private Sector, State Governments and Educational Institutes. It is pertinent to mention here that the data for these segment wise trends have been received from relevant stakeholders. They do not tally with the data published by DST but the underlying trends and conclusions remain intact, that is Central Government is the major contributor to R&D spend in India, which is against Global Trends.
Plan Outlays and Expenditure of Central Scientific Ministries/Departments (in Rs Crore)S&T Department/Agencies Twelfth Plan (2012–17) Outlay Union Budget 2019-20
DAE (R&D sector) 19878 16725
MoES 9506 1901
DST 21596 5321
DBT 11804 2580
DSIR including CSIR 17896 4895
DOS 39750 11538Interim budget

CPSEs12 : The second tier of this ecosystem are the CPSEs. They also contribute to the overall R&D spend in the country. The official source for data pertaining to R&D spend by CPSEs is DPE. This data does not tally with the data captured by DST. However, the variation is not very large. In the following tables and graphs, the major highlights of the R&D expenditure incurred by CPSEs are discussed. The R&D expenditure trends in select CPSEs are placed at Annexure 3. The brief CPSE highlights are placed at Annexure 4.
Out of 257 operating CPSEs in 2017-18, only 65 CPSEs are incurring expenditure on R&D, though the guidelines stipulate that profit making CPSEs may earmark certain portion of their profit for R&D. All profit making CPSEs do not adhere to these guidelines. The total number of CPSEs incurring expenditure on R&D has been declining over the years. Notwithstanding this in absolute terms the total expenditure on R&D incurred by CPSEs on R&D has increased from Rs. 3360 crore in 2013-14 to Rs. 5612 crore in 2017-18. The percentage of R&D expenditure incurred by CPSEs as a proportion of Profit After Tax (PAT) and Total revenue has increased from 2.26 in 2013-14 to 4.38 in 2017-18 and from 0.16 in 2013-14 to 0.26 in 2017-18 respectively.
Issues:
• It is noteworthy that many Departments in Government of India other than scientific departments spend on R&D.
• In the absence of a separate accounting head it is difficult to capture the expenditure on R&D in the entire central government sector.
• Secondly, many scientific departments incur expenditure on commercialization of R&D without any clear outcome and impact.
• In the absence of a clear-cut guidance on commercialization, many R&D expenditures could end up as wasteful expenditure.
34
12DPE

35
65
81
6772 69
2013-14 2014-15 2015-16 2016-17 2017-18
No. of CPSEs
Figure 16: Amount of R&D Expenditure of operating CPSEs in last 5 years (Rs in Crores)
Figure 15: Number of Operating CPSEs incurring Expenditure on R&D in last 5 years
Figure 17: % of R&D expenditure incurred by Operating CPSEs in last 5 years
3360.66
2591.29
3611.46
5016.985612.3
2013-14 2014-15 2015-16 2016-17 2017-18
R&D Expenditure incurred by Operating CPSEs
2.62
0.16 0.13 0.2 0.260.26
2.52
3.16
44.38
2013-14 2014-15 2015-16 2016-17 2017-18
R&D as% PAT R&D as% of Total Revenue

The Sectoral break of R&D expenditure in CPSEs for last 5 years is given in Annexure 5. The Figure 18 shows the average annual growth rate in R&D expenditure sector wise. It can be seen that the petroleum sector has registered the highest growth rate in R&D expenditure during 2017-18 (an increase of ~12%) compared to the greatest dip in the growth rate of R&D expenditure in power generation sector which saw a decline of about 14% during this period.
Figure 18: Average Annual Growth Rate (%) (2017-18)
Table 6: Top Five CPSEs Incurring Maximum Expenditure on R&D
S. No. Expenditure on Research & Development (`in Crores) 2017-18
1 Hindustan Aeronautics LTD. 1611.86
2 Bharat Electronics LTD. 938.51
3 Bharat Heavy Electricals LTD. 752.64
4 Oil & Natural Gas Corporation LTD. 586.23
5 Steel Authority of India LTD. 335.5
36
Average Annual Growth Rate (%) (2017-18)
Heavy & MediumEngineering
Petroleum (Refinery& Marketing
Crude Oil Contract &Construction and
Tech. Consultancy Services
6.14
11.62
0.16
-14.08
4.42
PowerGeneration
Issues: • The major issue is that notwithstanding the detailed guidelines on R&D, the CPSEs are
not incurring R&D expenditure as it is not being monitored closely.• The second issue is that the MoU guidelines which require specific target setting are
also not closely watched. • The third issue is that the outcome of expenditure on R&D is not clearly visible nor is
there any structured collaboration with academia.

Private Sector13: The third tier in the ecosystem is the private sector. The data pertaining to the expenditure trends in the private sector is captured by both DST and MCA. It is however pertinent to mention that while DST data is in public domain, MCA data is not in public domain. Notwithstanding this it was found that there is a huge discrepancy in the data published by DST and the data received from MCA. The extent of discrepancy is as follows: As per data received from MCA, on 31.03.2017, the total number of registered companies were 1641333 out of which total number of registered and active companies was 1169303. The total number of companies which filed annual financial statements was 713088 out of which 46567 companies filed their financial statements in XBRL format. The total number of registered and active companies incurring expenditure on R&D were only 6104 and the total expenditure on R&D incurred by them was INR 3918.3 crore. These R&D data figures are completely at variance with the data reported by DST, as per which private investment in R&D in 2016-17 is INR 43995 crore. Since MCA is the official primary source of all data relating to companies registered under the Companies Act, data furnished by MCA has been quoted in this document in order to reflect the extent of discrepancy with DST data. This could be due to different methodologies adopted in collecting relevant data from companies. The methodology of data capturing as adopted by MCA for R&D expenditure is given in Annexure 6. The summary point is that this huge discrepancy needs to be addressed by examining the financial statements of each R&D incurring company.
The top 5 private companies that have the maximum R&D expenditure in FY 2017 are shown in Figure 19:
Figure 19: R&D Expenditure in XBRL_300500
37
13MCA
453.2414.4
162.57 145.86
SAP Labs IndiaPrivate Limited
Mphasis Limited Olympia Tech Park (Chennai) Private Limited
Nuevosol EnergyPrivate Limited
Sun PharmaAdvanced Research
Company Limited
230.3
R&D Expenditure in (In Rs. Crore) XBRL_300500
14RBI
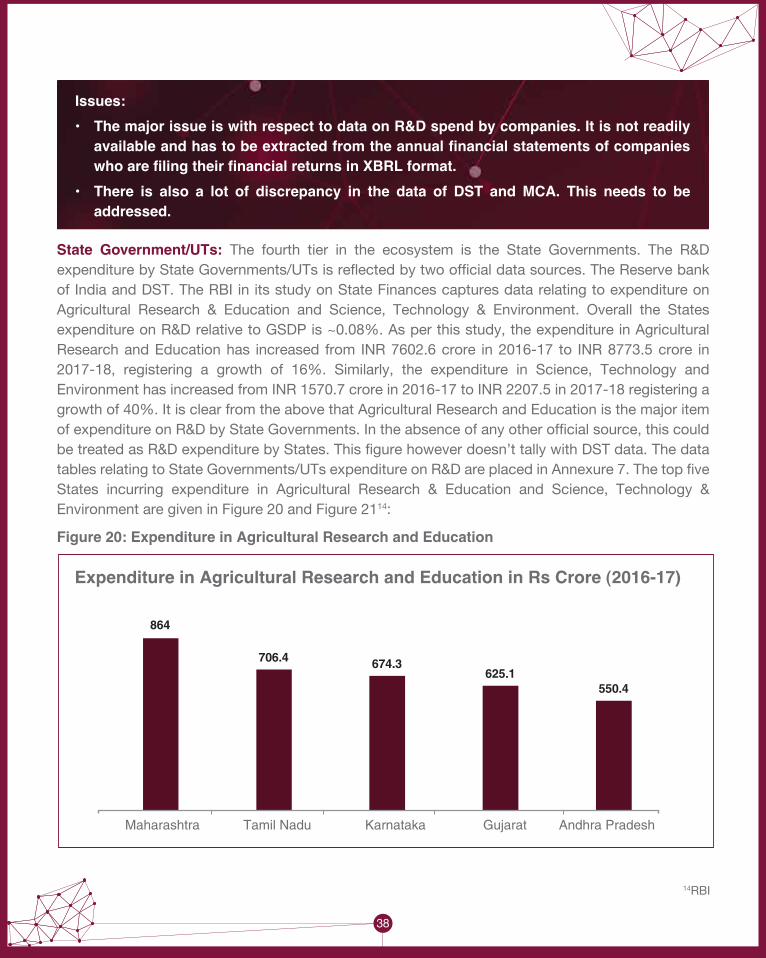
State Government/UTs: The fourth tier in the ecosystem is the State Governments. The R&D expenditure by State Governments/UTs is reflected by two official data sources. The Reserve bank of India and DST. The RBI in its study on State Finances captures data relating to expenditure on Agricultural Research & Education and Science, Technology & Environment. Overall the States expenditure on R&D relative to GSDP is ~0.08%. As per this study, the expenditure in Agricultural Research and Education has increased from INR 7602.6 crore in 2016-17 to INR 8773.5 crore in 2017-18, registering a growth of 16%. Similarly, the expenditure in Science, Technology and Environment has increased from INR 1570.7 crore in 2016-17 to INR 2207.5 in 2017-18 registering a growth of 40%. It is clear from the above that Agricultural Research and Education is the major item of expenditure on R&D by State Governments. In the absence of any other official source, this could be treated as R&D expenditure by States. This figure however doesn’t tally with DST data. The data tables relating to State Governments/UTs expenditure on R&D are placed in Annexure 7. The top five States incurring expenditure in Agricultural Research & Education and Science, Technology & Environment are given in Figure 20 and Figure 2114:
Figure 20: Expenditure in Agricultural Research and Education
38
Issues: • The major issue is with respect to data on R&D spend by companies. It is not readily
available and has to be extracted from the annual financial statements of companies who are filing their financial returns in XBRL format.
• There is also a lot of discrepancy in the data of DST and MCA. This needs to be addressed.
Expenditure in Agricultural Research and Education in Rs Crore (2016-17)
864
706.4 674.3625.1
550.4
Maharashtra Tamil Nadu Karnataka Gujarat Andhra Pradesh

39
Figure 21: Expenditure in Science, Technology and Environment
249.3237.3 229
151.7
79
Gujarat Maharashtra Madhya Pradesh Kerala Karnataka
Expenditure in Science, Technology and Environment in RS Crore (2016-17)
DST has initiated a State S&T Programme (SSTP) and has facilitated establishment of State S&T Councils under State S&T Programme (SSTP) with specific objectives of spreading awareness, building capacity, promoting innovation, and boosting up India’s indigenous capabilities to solve various location specific challenges. The Core support to S&T Councils and the details of expenditures made under the State S&T Programme from FY 2014-15 to current year by DST are given in Annexures 8 and 9 respectively.
Issues: • The state budgets do not reflect R&D spend directly. It is merged in agricultural
research or with science, technology and environment heads. It therefore useful to have a separate accounting head for R&D in states.
Educational Institutions: The fifth tier in the ecosystem is the educational institution. Higher education is critical for developing a modern economy, a just society and a vibrant polity. It equips young people with skills relevant for the labour market and the opportunity for social mobility. It provides people already in employment with skills to negotiate rapidly evolving career requirements. It is estimated that developed economies and even China will face a shortage of about 40 million highly skilled workers by 2020, while, based on current projections of higher education, India is likely to see some surplus of graduates in 2020. Thus, India could capture a higher share of global knowledge-based work, by increasing its exports of knowledge-intensive goods and R&D services, if there is adequate focus on higher education and its research quality is globally benchmarked.
The data for R&D spends in higher educational institutions is not readily available in Ministry of Human Resource Development. However as per the information provided by MHRD, the top five institutions and the amount spend by them on R&D is indicated in Table 7:
Table 7: Top Five Institutions & Amount Spend on R&D
S.No. Name of IIT Research Grant Received from GoI (Rupees in crore) 2016-17 2017-18 2018-19 Total1 IIT Madras 188.87 277.24 536.55 1002.66
2 IIT Bombay 282.34 282.02 250.93 815.29
3 IIT Kharagpur 161.65 222.14 138.76 522.55
4 IIT Delhi 97.03 236.85 154.24 488.12
5 IIT Kanpur 87.03 110.59 119.28 316.90
The only available data in public domain is maintained by DST, as per which the higher educational institutions play a secondary role in national R&D spend. 12th FYP had therefore observed that India must develop world class research universities as well as have sophisticated teaching institutions to impart key vocational and generic skills in a timely manner to cope with the rapidly changing market needs. This would create an ecosystem to foster R&D in educational institutions. The resources for this could be garnered by earmarking a certain proportion of education cess toward research.
Issues: • There is no consolidated information available on R&D spend by higher education
institutions. • The list of R&D projects being undertaken is not also available in public domain
though they are incurred from public sources. • There is no institutional mechanism for industry and academia collaboration on
research. • The quality of research and its outcome is not available in public domain.
40

41
The institutional elements of R&D ecosystem revolve around six stakeholders. They are DST, DSIR, DPE, MHRD State Governments and MCA.
Department of Science & Technology:
DST is a major stakeholder in the R&D ecosystem. As per allocation of business rules of Government of India, DST is responsible for science & technology policy and also data compilation on R&D. Accordingly, it has a significant role to play.
The S&TI policy of the Government of India as formulated by DST was published in 2013. As per this, India's R&D investment is currently under 1% of the GDP. Increasing Gross Expenditure in Research and Development (GERD) to 2% of the GDP has been a national goal for some time. Achieving this in the next five years (2018) is realizable if the private sector raises its R&D investment to at least match the public sector R&D investment from the current ratio of around 1:1.4 which is as per DST data. The implementation of policy has however not resulted in achieving the target of 2% of GDP. Secondly, the data compiled by DST comes with a long-time lag and does not tally with data disseminated by other stakeholders.
These weaknesses need to be addressed. A new S&T policy is required which will lay down the roadmap for achieving the 2% GDP target and also put in place an online system of data collection and make the system smarter.
Department of Scientific & Industrial Research:
The other key player is the Department of Scientific & Industrial Research (DSIR), which is operating a scheme for granting recognition & registration to in-house R&D units established by corporate industry. This is the only scheme in the entire government set-up for benchmarking the industrial R&D. Government of India has announced a number of fiscal incentives for research and development by industry from time to time and many of these incentives are implemented through DSIR. In-house R&D units recognized by DSIR are not only eligible for these incentives (wherever
7. Institutional Elements of R&D Ecosystem and Incentive Structure
As it is evident from the previous sections the major players in the R&D expenditure ecosystem are Central Government, CPSEs, State Governments, Universities and Private Sector. There is no single coordinating agency to oversee the quality and quantum of expenditure. Consequently, there are data gaps, data discrepancies and lack of coordinated approach to R&D spend with a vision. This section deals with the strengths and weakness of major players in this field including the incentive structure being offered by DSIR and other stakeholders.
applicable) but also for receiving funds for R&D from other government departments and agencies such as DST, DBT, Meity, MoEFCC, MNRE, MoFPI, CSIR, ICMR, ICAR, TDB where recognition to the in-house R&D center by DSIR is a requirement.
The Fiscal incentives and support measures presently available and administered by DSIR are listed below:
• 100% write off of revenue expenditure on R&D (Section 35(1)(i) of IT Act) • 100% write off of capital expenditure on R&D in the year the expenditure is incurred (Section
35(1)(iv) of IT Act)• 175% Weighted tax deduction u/s 35(2AA) of IT Act 1961 for sponsored research programs in
approved National laboratories, Universities and IITs;• 150% Weighted tax deduction u/s 35 (2AB) of IT Act, 1961 on In-house R&D expenditure for
any company engaged in the business of biotechnology or in any business of manufacture or production of any article or thing, not being an article or thing specified in the list of the eleventh schedule of IT Act, having R&D facility approved by Secretary, DSIR.
• Customs Duty exemption and concessional GST on import / purchase of goods for R&D required by Industries/Institutions for the purpose of their research as per notifications issued by Department of Revenue, Ministry of finance from time to time
• Customs Duty exemption on specified goods (Comprising of analytical and specialty equipment) for use in pharmaceutical and biotechnology sector;
• Central Excise Duty waiver for 3 years on goods produced based on indigenously developed technologies and duly patented in any two of the countries out of India, European Union (one country), USA and Japan;
• Accelerated depreciation allowance on plant and machinery set-up based on indigenous technology as per provision of rule 5(2) of IT Rules,1962;
• Customs Duty exemption on imports for R&D projects supported by Government.
The general criteria for CPSEs to avail these incentives is placed in Annexure 10.
These incentives call for a review with introduction of GST and abolition of R&D cess. The criterion for recognition of R&D units also needs to be transparent, time bound and industry friendly. This requires revisiting the guidelines for recognition of R&D units. The tax concessions which have a sunset clause also needs to be extended in order to attract the private sector investment into the R&D sector.
Department of Public Enterprises:
Another important stakeholder is Department of Public Enterprises which collects, collates and analyses R&D expenditure by CPSEs. It also implements the Memorandum of Understanding between the administrative department and the concerned CPSE. It also gives a score based on the performance of the CPSE in which R&D expenditure is a parameter. The detailed guidelines for R&D spend issued by DPE in 2011 can be accessed from the following link: https://dpemou.nic.in/MOUFiles/R&D.pdf. The guidelines lay down in detail how R&D expenditure is to be incurred by different categories of CPSEs and what activities are covered under this.
42

Notwithstanding these detailed guidelines it is observed that the number of CPSEs incurring R&D expenditure are just a few in number. Secondly, it is observed that most CPSEs don’t set R&D targets while submitting performance report under the MoU. Consequently, they are not rated on R&D performance. The MoU guidelines therefore needs to be strengthened to insist that each profit making CPSEs sets R&D targets and incurs R&D expenditure to meet these targets. CPSEs could be ranked based on the R&D performance. R&D performance should not only indicate the R&D expenditure but also the patents generated, material costs saved, technology developed and commercialized etc. Significant scope exists in enhancing the role of CPSEs in R&D. All CPSEs who are profit making should set R&D targets and this may be strictly enforced.
Ministry of Human Resource Development:
Ministry of Human Resource Development is another major stakeholder in the R&D ecosystem. Universities and Technical Institutions who are major players in this are guided by the overall policy of MHRD towards research. In the 12th FYP, the initiative taken by university and technical institutions in furthering research was clearly spelt out along with proposals towards further collaborative research. Recently, MHRD has taken up various schemes for furthering research in universities. These initiatives are mentioned in Annexure 11.
MHRD is the line Ministry for monitoring research in higher education. However it does not maintain consolidated institution wise data on R&D expenditure. Consequently, it is difficult to estimate the quantum of R&D expenditure being incurred by grants from MHRD and grants flowing from sources other than MHRD. Secondly, no university or technical institution also maintains or publishes this kind of information. The kind of research and quality of research being undertaken is also not known. The resources being devoted to fundamental research and applied research are also not publicly available.
State Governments:
The State Governments play a minimal role in R&D spend but avail the benefits of R&D output when translated into actual economic gains like Green Revolution, White Revolution etc. Each State Government/UT has a department of Science & Technology which is headed invariably by a Secretary who is in charge of Environment or some other department. There was no State/UT where Secretary had an exclusive charge of S&T department. This reflects poorly on the importance of R&D ecosystem in States. It is pertinent to mention that there are State Council of S&T which are linked to DST through the National S&T council. The effectiveness of this institutional arrangement except receiving grants from Government of India is not very clear at this moment.
Ministry of Corporate Affairs:
Ministry of Corporate Affairs is another stakeholder in R&D ecosystem. Its role however has not been integrated in the R&D ecosystem. It maintains the data on R&D spend by all companies registered under the Companies Act which reflects the role of private sector. This data is however not available in easily retrievable format. It is also not in public domain like CSR data. This matter needs to be examined and suitable changes may be introduced in the accounting standards of financial statements.
43
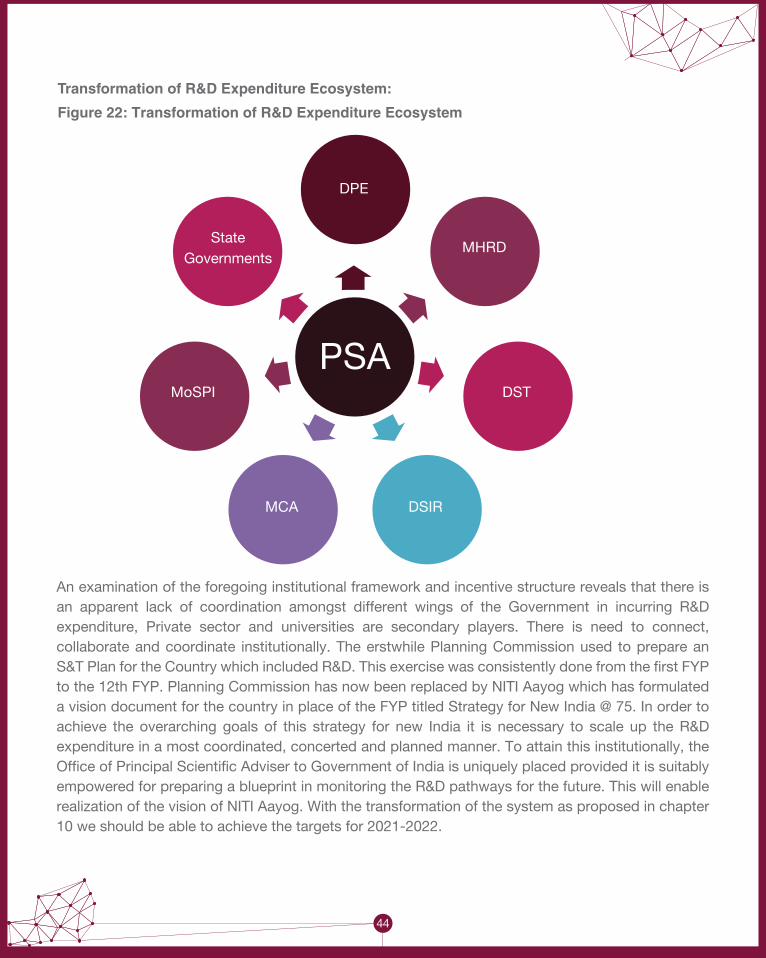
Transformation of R&D Expenditure Ecosystem:
Figure 22: Transformation of R&D Expenditure Ecosystem
44
PSA
DPE
MoSPI
MCA DSIR
DST
MHRDState
Governments
An examination of the foregoing institutional framework and incentive structure reveals that there is an apparent lack of coordination amongst different wings of the Government in incurring R&D expenditure, Private sector and universities are secondary players. There is need to connect, collaborate and coordinate institutionally. The erstwhile Planning Commission used to prepare an S&T Plan for the Country which included R&D. This exercise was consistently done from the first FYP to the 12th FYP. Planning Commission has now been replaced by NITI Aayog which has formulated a vision document for the country in place of the FYP titled Strategy for New India @ 75. In order to achieve the overarching goals of this strategy for new India it is necessary to scale up the R&D expenditure in a most coordinated, concerted and planned manner. To attain this institutionally, the Office of Principal Scientific Adviser to Government of India is uniquely placed provided it is suitably empowered for preparing a blueprint in monitoring the R&D pathways for the future. This will enable realization of the vision of NITI Aayog. With the transformation of the system as proposed in chapter 10 we should be able to achieve the targets for 2021-2022.
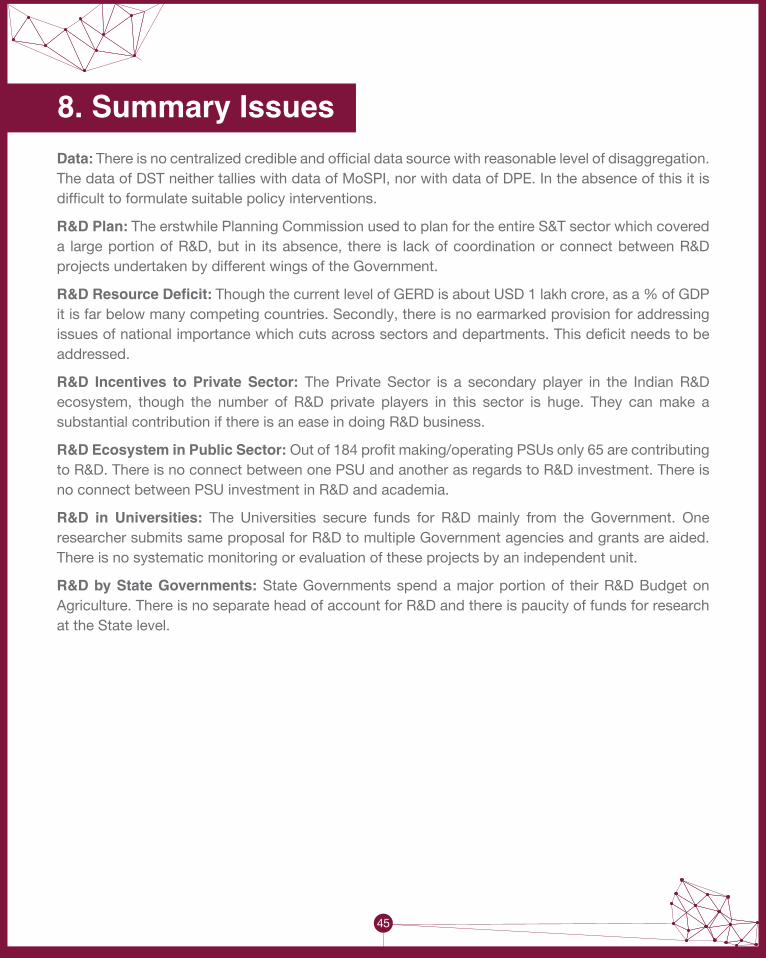
45
Data: There is no centralized credible and official data source with reasonable level of disaggregation. The data of DST neither tallies with data of MoSPI, nor with data of DPE. In the absence of this it is difficult to formulate suitable policy interventions.
R&D Plan: The erstwhile Planning Commission used to plan for the entire S&T sector which covered a large portion of R&D, but in its absence, there is lack of coordination or connect between R&D projects undertaken by different wings of the Government.
R&D Resource Deficit: Though the current level of GERD is about USD 1 lakh crore, as a % of GDP it is far below many competing countries. Secondly, there is no earmarked provision for addressing issues of national importance which cuts across sectors and departments. This deficit needs to be addressed.
R&D Incentives to Private Sector: The Private Sector is a secondary player in the Indian R&D ecosystem, though the number of R&D private players in this sector is huge. They can make a substantial contribution if there is an ease in doing R&D business.
R&D Ecosystem in Public Sector: Out of 184 profit making/operating PSUs only 65 are contributing to R&D. There is no connect between one PSU and another as regards to R&D investment. There is no connect between PSU investment in R&D and academia.
R&D in Universities: The Universities secure funds for R&D mainly from the Government. One researcher submits same proposal for R&D to multiple Government agencies and grants are aided. There is no systematic monitoring or evaluation of these projects by an independent unit.
R&D by State Governments: State Governments spend a major portion of their R&D Budget on Agriculture. There is no separate head of account for R&D and there is paucity of funds for research at the State level.
8. Summary Issues

Globalisation Provides Immense Opportunity for R&D. With the globalisation of businesses, corporate innovation strategies tend to be global as well. As in any other field, Globalisation of R&D is the outcome of seamless economies providing new opportunities for businesses, to leverage on the local strengths and derive the advantages of specialisation on a global scale.
According to the global rankings of service providers in the Engineering R&D segment for 2016, the R&D spend by global top 500 R&D spenders is growing consistently at 1.5 per cent over the last two years with focus on building digital first R&D organizations.
The total R&D Globalization & Services opportunity in 2016 was estimated at US$ 232 billion, and is projected to reach US$ 289 billion by 2021. Embedded and Software engineering constitute 76 per cent of the R&D outsourcing market. On the geographical spread, India, Western Europe and North America capture 75 per cent of the global Engineering R&D Services market.
India’s Engineering R&D (ER&D) globalization and services market, which currently stands at about US$ 22 billion, is expected to reach US$ 38 billion by 2020.
Targets for 202215:
The new institutional framework will coordinate and connect the private sector with academia, increase funding for research from private sector as well as from state governments, connect national labs to universities and create new knowledge eco-systems, take a mission driven approach to R&D, leverage scientific diaspora and above all cultivate the culture of research at all levels. The present share of National R&D expenditure sector wise is as follows:
46
9. Opportunities and Targets
15Existing share of GERD in GDP in nominal terms is about 0.6%.This is projected to rise to 2% of GDP by 2022.

47
Figure 23: National R&D Expenditure
Figure 24: Projected R&D Expenditure
National R&D Expenditure 2016-17
41.5
7.35.4
42.0
3.8
Central Government
State Sector
Public Enterprise
Private Sector
Higher Education Sector
24.00
4.00
8.0060.00
4.00
Projected R&D Expenditure 2021-22
Central Government
State Sector
Public Enterprise
Private Sector
Higher Education Sector
The targeted nominal GDP for FY 2021-2022 is Rs. 24344448 crore. The projected R&D expenditure is 2% of GDP that is Rs 486889 crore (more than 4 times of the current GERD). The relative shares of the different segments in FY 2022 may be targeted as follows:

48
India clearly needs to redouble its efforts to improve the status quo of the science and research ecosystem in the country by increasing the national expenditure on R&D. The growth in R&D expenditure should be commensurate with the growth of GDP and should be targeted to reach at least 2% of the GDP by 2022. At the same time output metrics also needs to aim beyond the necessary ones such as quality publications and patents to a much broader contribution by providing value through technological innovations leading to commercialization. Wealth must be increasingly invested in building strong foundation that creates new knowledge. Our researchers and students, in turn, be also creators of wealth from this knowledge for our economic growth that impact the wellbeing of our people and of the planet. Our metrics therefore should assess impact of R&D both on discovery and the knowledge economy.
The categorical breakup of the major recommendations proposed by this document for transforming the Indian R&D ecosystem along with the actions to be undertaken, implementing agencies and suggested timelines for implementation are as follows:
Table 8: Recommendations, Actions, Implementing Agencies and Timelines
10. Recommendations
Category R. No. Recommendation Action Implementing Timelines
1
1A
PSA 6 months
PSA to be the top national coordinator for R&D in the Country and appropriately positioned. His office will coordinate with all R&D Spending stakeholders including CPSEs, Universities, domestic and international R&D institutions and State Governments
PSA would be the focal point in formulation of National R&D Policies and strategies and administratively empowered to evaluate, coordinate and integrate /the efforts of Science Ministries and other Ministries which implement R&D schemes and programs
The Office of PSA may be strengthened to execute the short-term action plan and long-term deliverables
Institutional
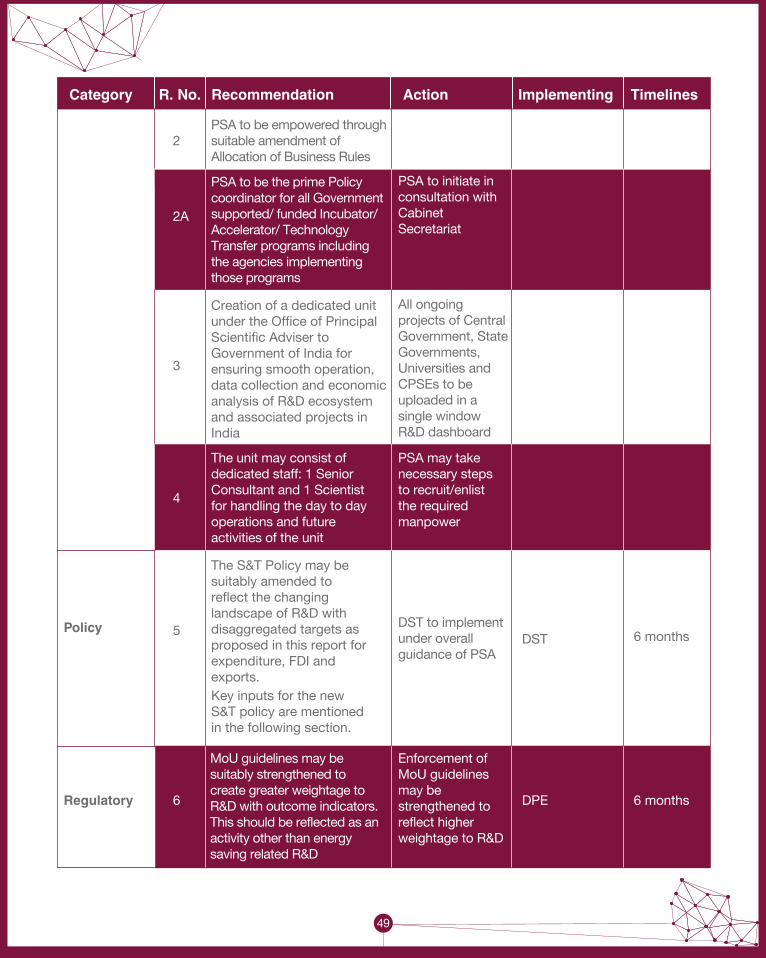
49
Category R. No. Recommendation Action Implementing Timelines
2
3
2A
1A
PSA to be empowered through suitable amendment of Allocation of Business Rules
PSA to be the prime Policy coordinator for all Government supported/ funded Incubator/ Accelerator/ Technology Transfer programs including the agencies implementing those programs
Creation of a dedicated unit under the Office of Principal Scientific Adviser to Government of India for ensuring smooth operation, data collection and economic analysis of R&D ecosystem and associated projects in India
PSA to initiate in consultation with Cabinet Secretariat
4
The unit may consist of dedicated staff: 1 Senior Consultant and 1 Scientist for handling the day to day operations and future activities of the unit
PSA may take necessary steps to recruit/enlist the required manpower
All ongoing projects of Central Government, State Governments, Universities and CPSEs to be uploaded in a single windowR&D dashboard
5
The S&T Policy may be suitably amended to reflect the changing landscape of R&D with disaggregated targets as proposed in this report for expenditure, FDI and exports. Key inputs for the new S&T policy are mentioned in the following section.
DST to implement under overall guidance of PSA
PolicyDST 6 months
6
MoU guidelines may be suitably strengthened to create greater weightage to R&D with outcome indicators. This should be reflected as an activity other than energy saving related R&D
Enforcement of MoU guidelines may be strengthened to reflect higher weightage to R&D
Regulatory DPE 6 months

Category R. No. Recommendation Action Implementing Timelines
7
1A
On the pattern of inter-state council, invite proposals from States/UTs for bulk funding of R&D projects
8
A joint fund of size Rs 5000 crores could be created under PPP and managed jointly by the private sector and the Government for promoting R&D in the areas of national importance
PSA may consider suitable proposal in this regard
The S&T council may submit the proposals to PSA for overall recommendations. This is to be in line with R&D plan formulated
10
Create new R&D Export Hubs which could leverage the existing Science Parks with Software Technology Parks. 30 such parks may be created which will be in line with special economic zones for R&D
Promotional
Monitoring &
Evaluation
PSA 6 months
9 Capacity Building in States for R&D in priority sectors
Research in Agricultural, Industrial and Emerging technologies to be prioritized and capacity may be built at universities and research institutions under a suitable scheme of MHRD
11
O/o of PSA to be a central one stop institution for all relevant data on R&D. This will enable monitoring of India’s global rankings in international platforms
The proposed cell under PSA may take appropriate actions
MHRD and
Stakeholder
Ministries
6 months
– 1 year
PSA 1 year
PSA 6 months
Suitable proposal in this maybe conceived by DST, DSIR, DBT, MeitY under the overall supervision of PSA
Stakeholder
Ministries and
PSA
50
9 months

51
Category R. No. Recommendation Action Implementing Timelines
12Central repository of data on R&D projects, grants and related activities may be created in the office of PSA
13Commissioning a scoping study of global best models
A scoping study for developing a suitable country specific model for promoting PPP for R&D could be commissioned. The scoping could be to complete with implementation structure and approval mechanisms
The proposed cell under PSA may take appropriate actions
Tax
Incentives
Data,
Indicators
and Global
Best
Practices
PSA 1 year
14
• Continue the weighted deduction under section 35(l)(ii) and section 35(2AA) of the Income Tax Act at 150% of the sum paid beyond 0l-04-2020 and remove the sunset clause referred in those provisions
• Allow weighted deduction of 125% for contract research under section 35(l)(iia) which has been withdrawn vide Finance Act 2018
• Allow weighted deduction of 150% for in-house research under section 35(2AB) beyond 01-04-2020 and remove the sunset clause referred therein
Ministry of Finance may consider
Ministry of
Finance 1 year
PSA 6 months

Key inputs for the new S&T policy:
A favourable policy paradigm which promotes collaborative R&D that would encourage more private sector investments in Research and Development as a part of their enterprise is needed. To enable faster implementation, Government may consider creating a direct funding mechanism for industry led R&D projects. Industry could partner with national research labs, academia, MSMEs for accelerated technological development. Such seamless collaborative efforts will help industry create the right work-force from universities as they will be trained and be future ready both for academia and industry. This new R&D Policy could consider including the following suggested interventions:
(i) To ensure India leaps into a leadership role in Innovation and industrial R&D by stimulating private sector’s investment in R&D from current 0.35% GDP, it is suggested that a minimum percentage of turn-over of the company may be invested in R&D by medium and large enterprises registered in India. Globally including India, investment in R&D by private sector as a percentage of revenue varies from sector to sector. Hence, while fixing the minimum investment requirement in R&D in terms of percentage of turn-over would be decided based on R&D intensity of the sector. A differential percentage mandated to be invested in R&D for key industry sector can be devised in consultation with Industry associations along with some defining conditions.
(ii) A substantial concern for R&D investments from the private sector is the scheduled withdrawal of weighted R&D tax deduction provisions with effect from 1-4-2020. While Ministry of Finance justifies the withdrawal to the lowering of corporate tax rate (current concessional tax rate is 25% in case of Companies whose turnover does not exceed Rs 250 cr), consequences of complete withdrawal of tax incentive could lower private sector investment in R&D, hence an impact on GERD, retarding new product generation in the country, and slowdown in indigenisation. Mission programs (Digital India, Amrut, Smart City, Make in India, National Solar Mission etc.) do have Industry as R&D partners and stakeholders. To help and keep the Industry enthused to invest in R&D, there is a case for not enforcing the complete withdrawal of the weighted deduction provisions on R&D investments by 1-4-2020. PSA’s office has received unanimous support from relevant Ministries against the complete withdrawal of weighted deduction and is in the process of raising this with the MOF.
(iii) The line ministries in Government of India could be mandated to allocate certain percentage of their budget for research and innovation for developing and deploying technologies as per the priorities of the respective ministries. All mission programs (like Digital India, Amrut, Smart City, Make in India, Solar Mission, Clean Ganga, Swach Bharat etc.) should have an allocated budget for undertaking R&D that can help in developing indigenous technological solutions and also assists towards scientifically informed policy making. The PSA’s office and NITI Aayog can work out a functional mechanism for this.
(iv) Most of the areas of science, technology and innovation for which historically central government departments and agencies running fully funded Central Schemes (CS), are within
52
53
the constitutional competence of the States themselves and can directly help the States. The 2014-15 DST figures indicate that the States share is only 7.4% of GERD as against 45.1% by Central government. It will be appropriate that States partner with the Centre to jointly fund research and innovation programs through specially designed Central Sponsored Schemes (CSS) that would enable to provide technological solutions to local problems and support research and innovation in State universities and institutions as in most federal governments across the globe. This will also help the States to equalize the horizontal imbalances in the national innovation index. Financially, States are today better off with 42% share as against 32% from central divisible pool earlier. An appropriate recommendation to this effect has been provided to the approach paper for the 15th Finance Commission, considering the imperatives of research and development as simultaneously a state and a national need.
(v) The current level of financial provision for Extra Mural Research (EMR) Grants mainly disbursed primarily from the central government scientific departments is under severe stress. EMR grants cater to the research needs of the entire and growing research community of the country including the various national laboratories, MHRD institutions such as IIT, IISER, NISER, NIIT, Central Universities, State Universities & Colleges including private universities. New IITs, IIITs, IISERs and NISERs and Universities now increasingly lay claim to the limited kitty of EMR provisions of scientific Departments. Industry cannot be spurred to increase its R&D provisions for funding high-risk blue-sky research. Therefore, the short-range strategy at this stage would be reassessing the central allocation for EMR funding. Since it is acknowledged that there are unmet needs for EMR funding which is the pathway to technological innovation and that the commensurate absorptive capacity exists within the R&D and academic institutions, there is a good case for a justifiable two-fold increase in central allocation to Scientific Departments. This may be coupled with mechanisms that enable nimbler grant dispensation process and flexibility in grant utilisation by the grantee institution. This will help propel India to its right place in the comity of scientifically and technologically advanced nations.
(vi) Corporate Social Responsibility Funds (CSR) for Scientific R&D are indirectly circumscribed by the sectors and verticals mentioned in Schedule VII of the Companies Act and Companies (CSR Policy) Rules 2014. Economic Survey Report of 2018 states that ‘current tax law already favours CSR investment into R&D, but the types of R&D activities eligible can be expanded’. As recommended by all Scientific and several Infrastructure Ministries suitable reference to Ministry of Corporate Affairs (MOCA) has been made for moving an amendment to the CSR Rules for allowing contributions to public funded Universities, IITs, National Labs, and Autonomous Bodies irrespective of the fact whether the intended research falls within or outside the given verticals in Schedule VII. Once such amendment comes through, greater resources from CSR fund for R&D will be available with publicly funded academic institutions and National Laboratories.

(vii) Current Defence Offsets guidelines impose “Direct Offsets” which in the current context are understood to mean offsets directly related to the articles or services to be exported or to be exported pursuant to a purchase agreement. As opposed to “Direct Offsets” several other emerging countries require discharge of offset obligations which are unrelated to services pursuant to purchase agreement in sectors such as electronics, shipbuilding, deep sea technologies etc. For example, the Canada model allows for extending offset funding with attractive multipliers (invest in SME with a 9x offset multiplier and for university research it is 5x). Adopting this model will allow foreign OEM’s to identify Indian technology start-ups and invest in them to help achieve Governments vision of Make in India. India has much to gain through a more pragmatic approach in its Offset policy by enabling foreign entities to discharge their offset obligations particularly by investing in the field of R&D in high end emerging technologies in ‘synergistic sectors’ such as artificial intelligence, cyber-physical systems, quantum communication, quantum and meta-materials, sensors, lasers, deep sea technology, etc. to name a few. This will help to unleash several billion dollars of outstanding offsets into R&D.
(viii) Commercialization of R&D: Public research i.e. research primarily funded with public resources and carried out by public research institutions (PRIs) and research universities plays an extremely important role in national innovation systems. Its sphere of influence touches education, training, skills development, problem solving, creation and diffusion of knowledge, development of new instrumentation, and the storage and transmission of knowledge. But public research has also been the source of significant scientific and technological breakthroughs that have become major innovations, sometimes as by-products of basic scientific research goals and sometimes with no vision of any direct application to a valuable commercial activity. Awareness of the substantial economic benefits from public research and demands by governments to reap those benefits has changed the rationale for supporting PRIs and universities in particular. This has led to increased efforts and a growing number of approaches and strategies toward more direct engagement in downstream commercialisation activities. In addition, globalisation, budgetary pressure, competition for human resources and funding, greater openness in accessing research data are also driving forces for the increased focus on the commercialisation of public research results.
There are several channels for enhancing the transfer and commercialisation of knowledge generated by academic research. While patents, licenses and spin-offs remain important channels for some institutions, other channels such as collaborative research (e.g. public-private partnerships), student and faculty mobility, as well as contract research and faculty consulting appear to be increasing in importance, but solid data is lacking. It is therefore suggested that commercialization may be made an integral part of research funding specifically where research is being conducted by Government funded agencies.
The implementation of the above-mentioned suggestions may be considered by DST while formulating a new R&D and innovation Policy.
54


Annexures

Annexure 1: Definition of R&D
57
Ministry of Statistics and Programme Implementation
In the SNA 2008 (para 6.207), Research & Development is defined as: Research and development is creative work undertaken on a systematic basis to increase the stock of knowledge, and use this stock of knowledge for the purpose of discovering or developing new products, including improved versions or qualities of existing products, or discovering or developing new or more efficient processes of production. Research and development is not an ancillary activity, and a separate establishment should be distinguished for it when possible. The research and development undertaken by market producers on their own behalf should, in principle, be valued on the basis of the estimated basic prices that would be paid if the research were subcontracted commercially, but in practice is likely to have to be valued on the basis of the total production costs including the costs of fixed assets used in production. Research and development undertaken by specialized commercial research laboratories or institutes is valued by receipts from sales, contracts, commissions, fees, etc. in the usual way. Research and development undertaken by government units, universities, non-profit research institutes, etc. is nonmarket production and is valued on the basis of the total costs incurred. The activity of research and development is different from teaching and is classified separately in ISIC. In principle, the two activities ought to be distinguished from each other when undertaken within a university or other institute of higher education, although there may be considerable practical difficulties when the same staff divide their time between both activities. There may also be interaction between teaching and research which makes it difficult to separate them, even conceptually, in some cases.
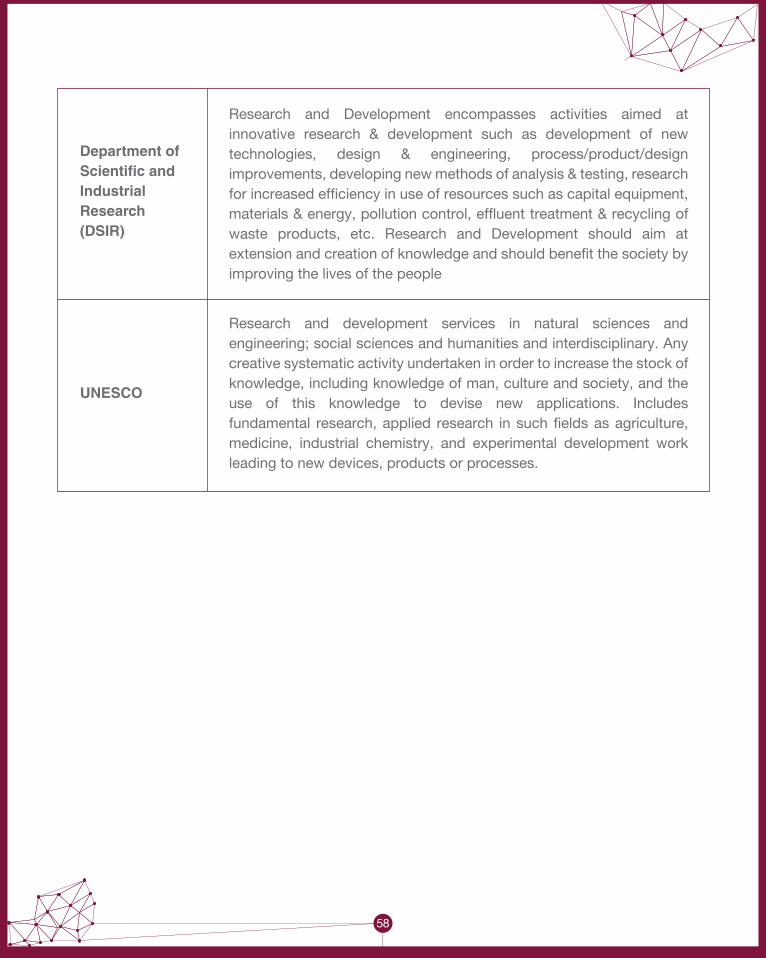
Department of Scientific and Industrial Research (DSIR)
UNESCO
Research and Development encompasses activities aimed at innovative research & development such as development of new technologies, design & engineering, process/product/design improvements, developing new methods of analysis & testing, research for increased efficiency in use of resources such as capital equipment, materials & energy, pollution control, effluent treatment & recycling of waste products, etc. Research and Development should aim at extension and creation of knowledge and should benefit the society by improving the lives of the people
Research and development services in natural sciences and engineering; social sciences and humanities and interdisciplinary. Any creative systematic activity undertaken in order to increase the stock of knowledge, including knowledge of man, culture and society, and the use of this knowledge to devise new applications. Includes fundamental research, applied research in such fields as agriculture, medicine, industrial chemistry, and experimental development work leading to new devices, products or processes.
58

Annexure 2: Top 25 FDI Equity Inflow Cases
59
Qiagen India Private Limited
6 Research and experimental development on natural sciences and engineering
Sl.
No
Name of Indian Company
Country Item of Manufacture
Hewlett Packard Enterprise India Private Limited
1 Research and experimental development on social sciences and humanities
Singapore
Syngene International Ltd
2 CONTRACT RMauritius
Vankatesh Pharma Private Limited
3 Research and experimental development on natural sciences and engineering
Mauritius
Basf Chemicals Ipl (Cognis Speciality Chemicals)
4 Research and experimental development on natural sciences and engineering
Singapore
M/S Aizant Drug Research Solutions Pvt Ltd
5 Research and experimental development on natural sciences and engineering
Mauritius
Atotech Development Centre Private Limited
8 Research and experimental development on natural sciences and engineering
Stelis Biopharma Pvt Ltd
7 Research and experimental development on natural sciences and engineering
Singapore
Distiny Investments Ltd
10 Research and experimental development on natural sciences and engineering
BASF Chemicals Ipl (Cognis Speciality Chemicals)
9 Research and experimental development on natural sciences and engineering
Singapore
Qiagen N.V. NEW DELHI 7.88Netherlands
Name of Foreign Collaborator
RBI RegionalOffice
Amount of FDI Inflows(in US$ million)
Hewlett-Packard Asia Pacific Pte Ltd
BANGALORE 112.46
Silver Leaf Oak (Mauritius) Ltd
REGION NOT INDICATED
59.56
Samara Capital Partners Fund II Limited
MUMBAI 16.31
BASF South East Asia PTE Ltd
MUMBAI 10.76
Pearl Lane Coinvest
HYDERABAD 9.34
Atotech B.V. NEW DELHI 7.75Netherlands
GMS Pharma (Singapore) Pte Ltd
BANGALORE 8.82
GVK Biosciences pvt ltd
REGION NOT INDICATED
7.10Mauritius
BASF South East Asia PTE Ltd
MUMBAI 7.43
Vyome BiosciencesPvt Ltd
11 Research and experimental development on natural sciences and engineering
Cayman Islands
Perceptive Life Sciences Master Fund Lim
NEW DELHI 7.02

Mindray Medical India Pvt Ltd
15 Research and experimental development on natural sciences and engineering
Atotech Development Centre Pvt Ltd
14 Research and experimental development on natural sciences and engineering
Netherlands
Atotech Development Centre Pvt Ltd
17 Research and experimental development on natural sciences and engineering
Atotech Development Centre Pvt Ltd
16 Research and experimental development on natural sciences and engineering
Netherlands
Mr Investments Hk Ltd
MUMBAI 5.00Hong Kong
Atotech B.V. NEW DELHI 5.99
Atotech B.V. NEW DELHI 4.50Netherlands
Atotech B.V NEW DELHI 4.46
M/S Sri Biotech Laboratories India Pvt Ltd
19 Research and experimental development on natural sciences and engineering
Great Wall India Research & Deve- lopment Pvt Ltd
18 Research and experimental development on natural sciences and engineering
China
Valagro Spa HYDERABAD 4.01Italy
Greatwall Motor Co Ltd
BANGALORE 4.26
Diasorin Trivitron Healthcare Private Limited
20 Research and experimental development on natural sciences and engineering
U.S.A DiaSorin Inc. USA
REGION NOT INDICATED
4.22
Mitra Rxdx India Private Limited
21 Research and experimental development on natural sciences and engineering
Mitra Rxdx Inc BANGALORE 3.90U.S.A
Atotech Development Centre Pvt Ltd
22 Research and experimental development on natural sciences and engineering
60
Netherlands Atotech B.V. NEW DELHI 3.71
Qiagen IndiaPvt Ltd
12 Research and experimental development on natural sciences and engineering
Netherlands
Chemo India FormulationPvt Ltd
13 Research and experimental development on natural sciences and engineering
Spain
Qiagen N.V. NEW DELHI 6.48
Chemo Holding Sl
HYDERABAD 6.23

61
Grand Total 316.12
Atotech Development Centre Pvt Ltd
23 Research and experimental development on natural sciences and engineering
Netherlands Atotech B.V. NEW DELHI 3.07
Eywa PharmaPvt Ltd
24 Research and experimental development on natural sciences and engineering
Eywa pharma pte. Limited
CHENNAI 2.85Singapore
Mitra Rxdx India Private Limited
25 Research and experimental development on natural sciences and engineering
U.S.A Mitra Rxdx Inc BANGALORE 3.00
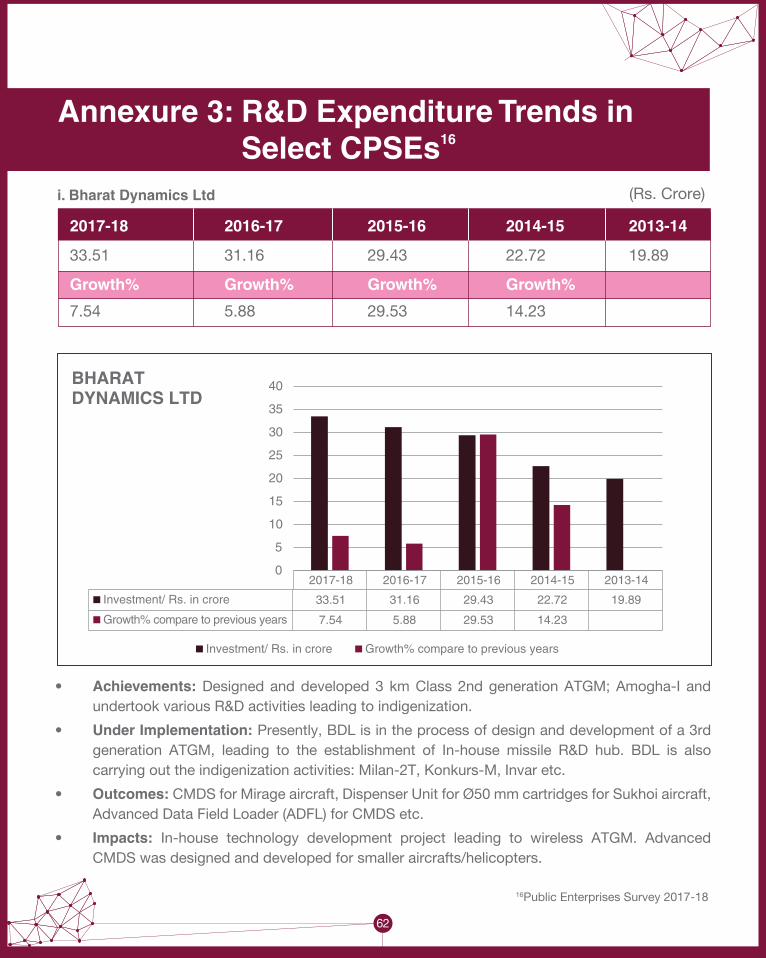
Annexure 3: R&D Expenditure Trends in Select CPSEs16 i. Bharat Dynamics Ltd
2017-18 2016-17 2015-16 2014-15 2013-14
33.51 31.16 29.43 22.72 19.89
Growth% Growth% Growth% Growth%
7.54 5.88 29.53 14.23
2017-18 2016-17 2015-16 2014-15 2013-14
Investment/ Rs. in crore 33.51 31.16 29.43 22.72 19.89
Growth% compare to previous years 7.54 5.88 29.53 14.23
0
5
10
15
20
25
30
35
40BHARATDYNAMICS LTD
Investment/ Rs. in crore Growth% compare to previous years
• Achievements: Designed and developed 3 km Class 2nd generation ATGM; Amogha-I and undertook various R&D activities leading to indigenization.
• Under Implementation: Presently, BDL is in the process of design and development of a 3rd generation ATGM, leading to the establishment of In-house missile R&D hub. BDL is also carrying out the indigenization activities: Milan-2T, Konkurs-M, Invar etc.
• Outcomes: CMDS for Mirage aircraft, Dispenser Unit for Ø50 mm cartridges for Sukhoi aircraft, Advanced Data Field Loader (ADFL) for CMDS etc.
• Impacts: In-house technology development project leading to wireless ATGM. Advanced CMDS was designed and developed for smaller aircrafts/helicopters.
16Public Enterprises Survey 2017-18
(Rs. Crore)
62

63
ii. Bharat Electronics Ltd
2017-18 2016-17 2015-16 2014-15 2013-14
938.51 750.7 704.27 0 467.01
Growth% Growth% Growth% Growth%
25.02 6.59 0 -100
• R&D Ecosystem: BEL has 2300 R&D engineers, 64 years of experience in R&D and product development.
• Achievements: During 2015-16 to 2017-18, 58 R&D products/systems developed e.g. Intelligence gathering System, Gun Fire Control System (FCS) for ships, Advanced Communication network for ship, 3D Surveillance Radar, 2D Air Surveillance Radar for Navy, Coastal Surveillance Radar, Manpack Satcom Terminal etc.
• Under Implementation: > 25 products/systems are under development
• Outcomes: Import Substitution and Cost reduction.
• Impacts: Y-o-Y increase in revenue through sales of products involving R&D. Valuable Intellectual Property generated. New products & systems developed within country every year. Reduced dependency on foreign players by means of import substitution.
BHARATELECTRONICS LTD
2017-18 2016-17 2015-16 2014-15 2013-14
Investment/ Rs. in crore 938.51 750.7 704.27 0 467.01
Growth% compare to previous years 25.02 6.59 0 -100
-200
0
200
400
600
800
1000
(Rs. Crore)
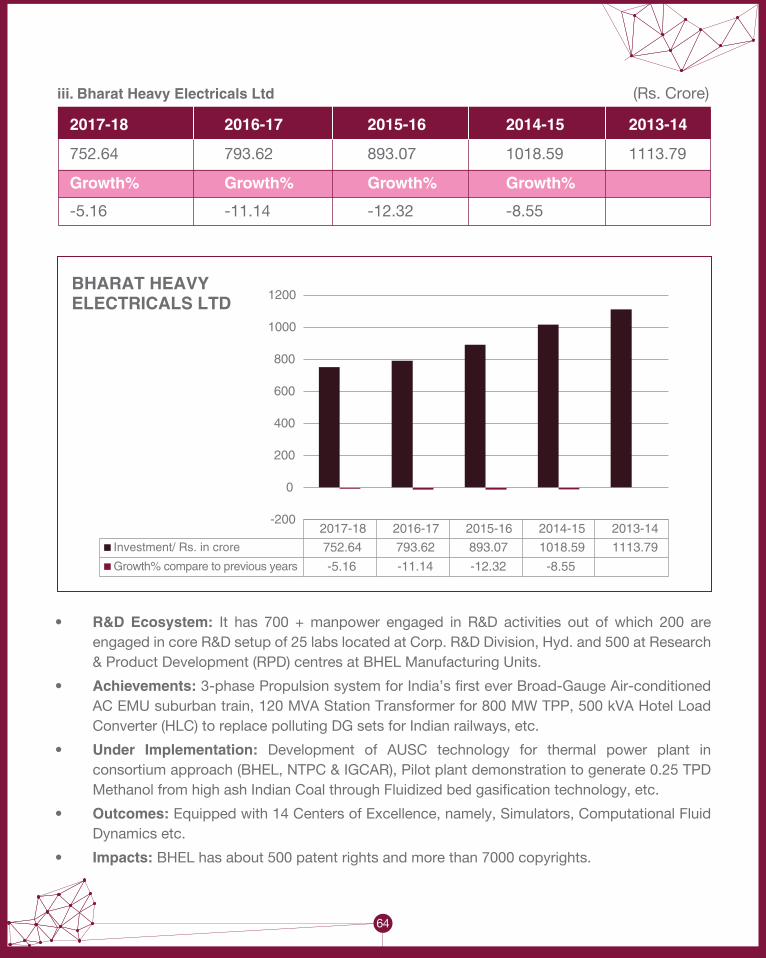
iii. Bharat Heavy Electricals Ltd
2017-18 2016-17 2015-16 2014-15 2013-14
752.64 793.62 893.07 1018.59 1113.79
Growth% Growth% Growth% Growth%
-5.16 -11.14 -12.32 -8.55
• R&D Ecosystem: It has 700 + manpower engaged in R&D activities out of which 200 are engaged in core R&D setup of 25 labs located at Corp. R&D Division, Hyd. and 500 at Research & Product Development (RPD) centres at BHEL Manufacturing Units.
• Achievements: 3-phase Propulsion system for India’s first ever Broad-Gauge Air-conditioned AC EMU suburban train, 120 MVA Station Transformer for 800 MW TPP, 500 kVA Hotel Load Converter (HLC) to replace polluting DG sets for Indian railways, etc.
• Under Implementation: Development of AUSC technology for thermal power plant in consortium approach (BHEL, NTPC & IGCAR), Pilot plant demonstration to generate 0.25 TPD Methanol from high ash Indian Coal through Fluidized bed gasification technology, etc.
• Outcomes: Equipped with 14 Centers of Excellence, namely, Simulators, Computational Fluid Dynamics etc.
• Impacts: BHEL has about 500 patent rights and more than 7000 copyrights.
BHARAT HEAVYELECTRICALS LTD
(Rs. Crore)
2017-18 2016-17 2015-16 2014-15 2013-14Investment/ Rs. in crore 752.64 793.62 893.07 1018.59 1113.79
Growth% compare to previous years -5.16 -11.14 -12.32 -8.55
-200
0
200
400
600
800
1000
1200
64

65
iv. Electronics Corporation of India Ltd
2017-18 2016-17 2015-16 2014-15 2013-14
0 0 0 23.2 47.43
Growth% Growth% Growth% Growth%
0 0 0 -51.09
ELECTRONICSCORPORATION OFINDIA LTD
(Rs. Crore)
2017-18 2016-17 2015-16 2014-15 2013-14
Investment/ Rs. in crore 0 0 23.2 47.43
Growth% compare to previous years 0 0 0
0
-51.09
-60
-40
-20
0
20
40
60

v. ITI Ltd
2017-18 2016-17 2015-16 2014-15 2013-14
15.1 16.3 16.38 12.94 17.23
Growth% Growth% Growth% Growth%
-7.36 -0.49 26.58 -24.9
ITI LTD
(Rs. Crore)
2017-18 2016-17 2015-16 2014-15 2013-14
Investment/ Rs. in crore 15.1 16.3 16.38 12.94 17.23
Growth% compare to previous years -7.36 -0.49 26.58 -24.9
-30
-20
-10
0
10
20
30
66

67
vi. MAZAGON Dock & Shipbuilders Ltd
2017-18 2016-17 2015-16 2014-15 2013-14
75.11 77.09 63.83 57.88 47.56
Growth% Growth% Growth% Growth%
-2.57 20.77 10.28 21.7
MAZAGON DOCK & SHIPBUILDERS LTD
(Rs. Crore)
2017-18 2016-17 2015-16 2014-15 2013-14
Investment/ Rs. in crore 75.11 77.09 63.83 57.88 47.56
Growth% compare to previous years -2.57 20.77 10.28 21.7
-10
0
10
20
30
40
50
60
70
80
90
• Achievements: Ergonomic and Human Factors Engineering (HFE): improved ergonomics and habitability; aesthetics and interior design on board P15B/P17A Ships, CFD analysis of plated mast structure for EOD camera and plume analysis, design of crane pontoon, virtual reality utilization, Control of distortion in DMR249A grade panels, etc.
• Outcomes: The R&D activities led to operational efficiency, better training of personnel, self-reliance etc.
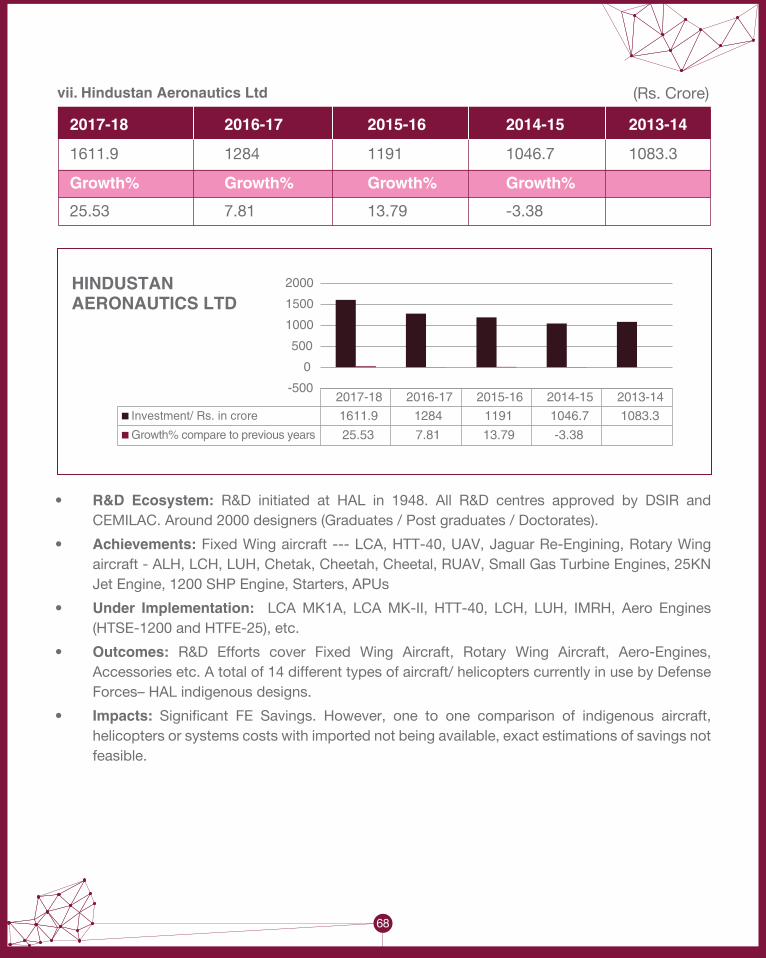
vii. Hindustan Aeronautics Ltd
2017-18 2016-17 2015-16 2014-15 2013-14
1611.9 1284 1191 1046.7 1083.3
Growth% Growth% Growth% Growth%
25.53 7.81 13.79 -3.38
• R&D Ecosystem: R&D initiated at HAL in 1948. All R&D centres approved by DSIR and CEMILAC. Around 2000 designers (Graduates / Post graduates / Doctorates).
• Achievements: Fixed Wing aircraft --- LCA, HTT-40, UAV, Jaguar Re-Engining, Rotary Wing aircraft - ALH, LCH, LUH, Chetak, Cheetah, Cheetal, RUAV, Small Gas Turbine Engines, 25KN Jet Engine, 1200 SHP Engine, Starters, APUs
• Under Implementation: LCA MK1A, LCA MK-II, HTT-40, LCH, LUH, IMRH, Aero Engines (HTSE-1200 and HTFE-25), etc.
• Outcomes: R&D Efforts cover Fixed Wing Aircraft, Rotary Wing Aircraft, Aero-Engines, Accessories etc. A total of 14 different types of aircraft/ helicopters currently in use by Defense Forces– HAL indigenous designs.
• Impacts: Significant FE Savings. However, one to one comparison of indigenous aircraft, helicopters or systems costs with imported not being available, exact estimations of savings not feasible.
68
HINDUSTANAERONAUTICS LTD
(Rs. Crore)
2017-18 2016-17 2015-16 2014-15 2013-14
Investment/ Rs. in crore 1611.9 1284 1191 1046.7 1083.3
Growth% compare to previous years 25.53 7.81 13.79 -3.38
-500
0
500
1000
1500
2000

69
viii. Hindustan Petroleum Corporation Ltd
2017-18 2016-17 2015-16 2014-15 2013-14
232.78 276.54 180.32 129.87 100.62
Growth% Growth% Growth% Growth%
-15.82 53.36 38.85 29.07
• R&D Ecosystem: HPCL has HP Green R&D Centre with Plot Area of 104 acres at Bengaluru and a new R&D Centre at Vashi, Mumbai.
• Achievements: Technology developed and commercialized include H2 PSA: - Indigenous technology for H2 purification through adsorption, HP-HiGAS:- First commercial scale unit at HPCL Visakh Refinery and Novel technology for gas absorption / distillation with this technology done with this technology, etc.
• Under Implementation: HP-DAK: - Process to produce de-aromatized hydrocarbon solvents from kerosene range hydrocarbon feed stocks. [HP]2 FCC:- Development of in-house FCC technology for enhanced propylene production, etc.
• Outcomes: Products/ Processes Developed= 13, Patents filed= 118, Patents Granted= 13, Publications= 48, Tech Reports= 88, Papers presented in Seminars/ Conferences= 95.
• Impacts: Impact of Products/ Processes developed during last 5 years in terms of revenue generated is over 600 crore per annum. Entry of HPCL as a new market player leading to more competitive pricing of products/processes by current suppliers/licensors.
HINDUSTAN PETROLEUM CORPORATION LTD
(Rs. Crore)
2017-18 2016-17 2015-16 2014-15 2013-14
Investment/ Rs. in crore 232.78 276.54 180.32 129.87 100.62
Growth% compare to previousyears
-15.82 53.36 38.85 29.07
-500
50100150200250300
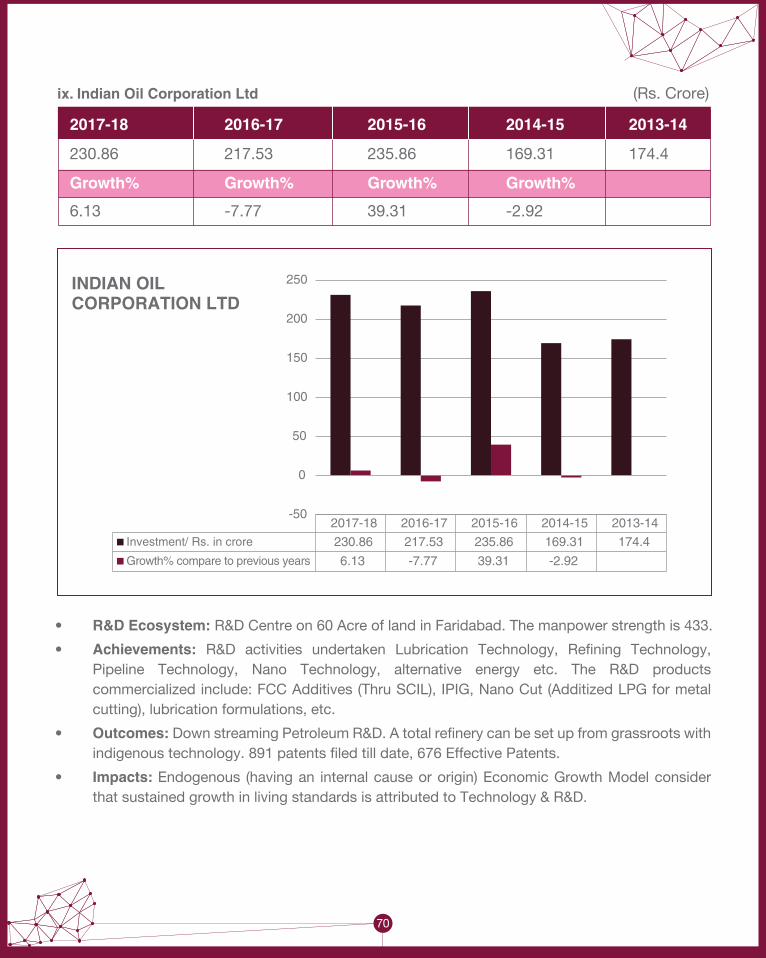
ix. Indian Oil Corporation Ltd
2017-18 2016-17 2015-16 2014-15 2013-14
230.86 217.53 235.86 169.31 174.4
Growth% Growth% Growth% Growth%
6.13 -7.77 39.31 -2.92
• R&D Ecosystem: R&D Centre on 60 Acre of land in Faridabad. The manpower strength is 433.
• Achievements: R&D activities undertaken Lubrication Technology, Refining Technology, Pipeline Technology, Nano Technology, alternative energy etc. The R&D products commercialized include: FCC Additives (Thru SCIL), IPIG, Nano Cut (Additized LPG for metal cutting), lubrication formulations, etc.
• Outcomes: Down streaming Petroleum R&D. A total refinery can be set up from grassroots with indigenous technology. 891 patents filed till date, 676 Effective Patents.
• Impacts: Endogenous (having an internal cause or origin) Economic Growth Model consider that sustained growth in living standards is attributed to Technology & R&D.
INDIAN OILCORPORATION LTD
(Rs. Crore)
2017-18 2016-17 2015-16 2014-15 2013-14
Investment/ Rs. in crore 230.86 217.53 235.86 169.31 174.4
Growth% compare to previous years 6.13 -7.77 39.31 -2.92
-50
0
50
100
150
200
250
70

71
x. Bharat Petroleum Corporation Ltd
2017-18 2016-17 2015-16 2014-15 2013-14
47.38 32.78 40.49 40.73 36.82
Growth% Growth% Growth% Growth%
44.53 -19.04 -0.59 10.61
• R&D Ecosystem: The Corporate R&D Centre at Greater Noida, Uttar Pradesh and Product & Application Development Centre at Mumbai are continuously engaged in research activities.
• Achievements: CRDC developed ethanol corrosion inhibitor to protect automobile fuel system from corrosion due to EBMS and installed and commissioned a manufacturing plant in Mathura under Bharat Ecochem project, Divided wall column process technology, etc.
• Under Implementation: Desktop solution for crude oil blend compatibility and blend optimization, Development of dew axing catalyst, Waste plastic utilization for road construction etc.
• Outcomes: A highly energy efficient configuration for effective separation of naphtha, Rigorous simulation models for process units for predicting plant performance, troubleshooting, and optimizing operating parameters etc.
• Impacts: All BPCL depots are using Bharat Ecochem and there is nil dependency on imported corrosion inhibitor. The cost of Bharat Ecochem is 1/3rd of the commercial inhibitor and the performance is 3 times better than the commercial inhibitor.
BHARAT PETROLEUM CORPORATION LTD
(Rs. Crore)
2017-18 2016-17 2015-16 2014-15 2013-14Investment/ Rs. in crore 47.38 32.78 40.49 40.73 36.82
Growth% compare to previous years 44.53 -19.04 -0.59 10.61
-30
-20
-10
0
10
20
30
40
50
60

xi. NLC India LTD
2017-18 2016-17 2015-16 2014-15 2013-14
2.25 13.35 13.82 13.16 14.34
Growth% Growth% Growth% Growth%
-83.15 -3.4 5.02 -8.23
• R&D Ecosystem: Centre for Applied R&D of NLC Ltd is a recognized R&D Centre by Department of Scientific and Industrial Research, Ministry of Science and Technology GOI, since 1975. There is an R&D policy.
• R&D Projects: Dynamic Loading of Conveyor drive heads, Customized organic coating for Specialized Mining Equipment, Studies on Synthesis of Zeolites from Lignite Fly Ash, the pilot plant for separation of iron from bottom slag, Floating solar PV plant, Solar drying of lignite etc.
• Outcomes and Impacts: The number of motors operated based on the load requirements has led to energy saving. Considerable reduction in consumption of explosives, teeth and energy consumption of the Bucket Wheel Excavator deployed in Mines, Generation of Hydro power by utilizing the free flow water from Thermal power Station. High Longevity coatings and alternate material for Erosion and Corrosion Resistance in Mining pumps and Corrosion Resistant coating for De-watering pipes in Mining industry has improved operational efficiency.
72
NLC India LTD
(Rs. Crore)
2017-18 2016-17 2015-16 2014-15 2013-14
Investment/ Rs. in crore 2.25 13.35 13.82 13.16 14.34
Growth% compare to previous years -83.15 -3.4 5.02 -8.23
-100
-80
-60
-40
-20
0
20
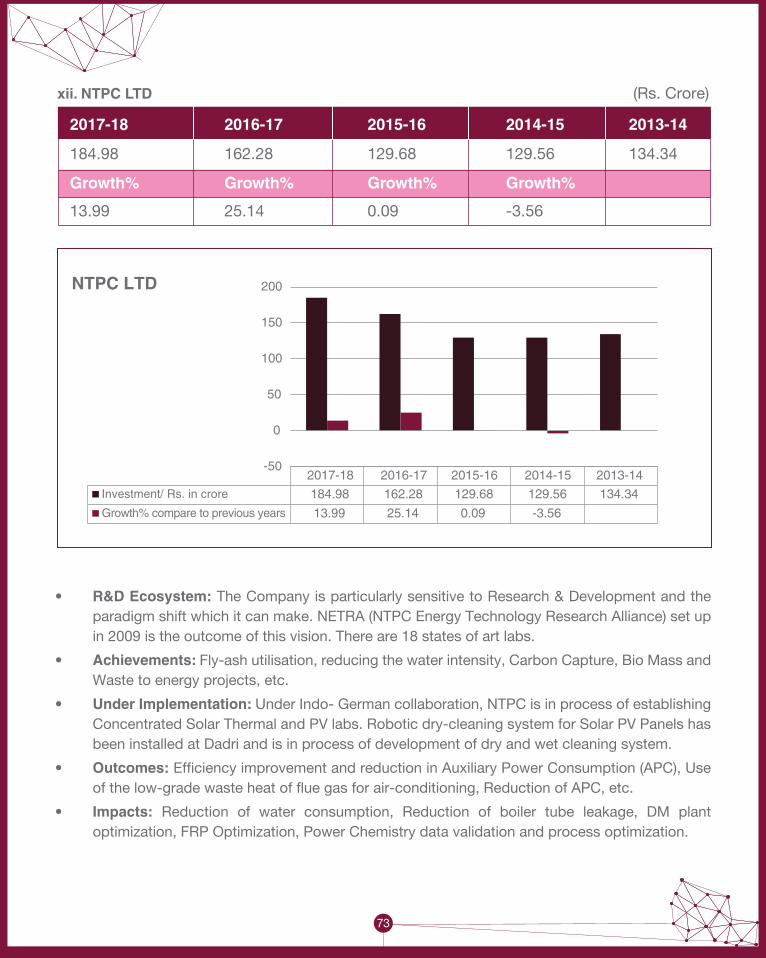
73
xii. NTPC LTD
2017-18 2016-17 2015-16 2014-15 2013-14
184.98 162.28 129.68 129.56 134.34
Growth% Growth% Growth% Growth%
13.99 25.14 0.09 -3.56
• R&D Ecosystem: The Company is particularly sensitive to Research & Development and the paradigm shift which it can make. NETRA (NTPC Energy Technology Research Alliance) set up in 2009 is the outcome of this vision. There are 18 states of art labs.
• Achievements: Fly-ash utilisation, reducing the water intensity, Carbon Capture, Bio Mass and Waste to energy projects, etc.
• Under Implementation: Under Indo- German collaboration, NTPC is in process of establishing Concentrated Solar Thermal and PV labs. Robotic dry-cleaning system for Solar PV Panels has been installed at Dadri and is in process of development of dry and wet cleaning system.
• Outcomes: Efficiency improvement and reduction in Auxiliary Power Consumption (APC), Use of the low-grade waste heat of flue gas for air-conditioning, Reduction of APC, etc.
• Impacts: Reduction of water consumption, Reduction of boiler tube leakage, DM plant optimization, FRP Optimization, Power Chemistry data validation and process optimization.
NTPC LTD
(Rs. Crore)
2017-18 2016-17 2015-16 2014-15 2013-14
Investment/ Rs. in crore 184.98 162.28 129.68 129.56 134.34
Growth% compare to previous years 13.99 25.14 0.09 -3.56
-50
0
50
100
150
200

xiii. Nuclear Power Corporation of India Ltd
2017-18 2016-17 2015-16 2014-15 2013-14
13.06 10.29 7.46 4.89 79.41
Growth% Growth% Growth% Growth%
26.92 37.94 52.56 -93.84
• R&D Projects: Development of Raw Materials for 700 MWe Pressurised Heavy Water Reactors, Indigenous development of Primary Coolant Pump, Indigenous development of Boiler Feed Pump, etc.
• Outcomes: Indigenous source developed for NPCIL 700 MWe Fleet program (10 NPPs), Indigenous source developed for KAPP-3&4, RAPP-7&8 / upcoming GHAVP-1&2 and NPCIL Fleet program (10 NPPs), etc.
• Impacts: Self-reliance achieved for Hardware and Software development for Nuclear Power Plant computer-based systems, etc.
NUCLEAR POWERCORPORATIONSOF INDIA LTD
(Rs. Crore)
2017-18 2016-17 2015-16 2014-15 2013-14
Investment/ Rs. in crore 13.06 10.29 7.46 4.89 79.41
Growth% compare to previous years 26.92 37.94 52.56 -93.84
-120
-100
-80
-60
-40
-20
0
20
40
60
80
100
74

75
xiv. Oil & Natural Gas Corporation Ltd
2017-18 2016-17 2015-16 2014-15 2013-14
586.23 591.86 539.74 544.53 529.61
Growth% Growth% Growth% Growth%
-0.95 9.66 -0.88 2.82
• R&D Ecosystem: R&D activities carried out by ONGC’s R&D Institutes located in various parts of the country on various aspects of Oil exploration, extraction, sustainable development, geology, etc.
• Achievements: Reservoir characterization to evolve regional Karstification model and prospectively analysis of Basin Formation in Heera-Panna Basin and Eastern Homocline, Western Offshore Basin, Structural Modeling of major tectonic elements of Eastern and Western margin basins of India, etc.
• Under Implementation: Offshore Environment Monitoring in Western Offshore and Eastern Offshore has helped in meeting the statutory requirements.
• Outcomes and Impacts: The R&D activities of ONGC Ltd have helped in enhancing the growth of the Company by ensuring high success-ratio through finding new oil in existing petroleum provinces. R&D activities have helped in hydrocarbon reserve accretion, production enhancement through in-depth understanding of petroleum habitat and fluid flow mechanisms within the reservoirs through understanding of reservoir mechanics, fluid properties, surface equipment usage and proper well completion practices. It also helped in improving recovery factor, incremental oil gain, mitigating complex alleges of exploration in Frontier areas, deep-water blocks and in tapping unconventional energy resources.
OIL & NATURAL GAS CORPORATION LTD
(Rs. Crore)
2017-18 2016-17 2015-16 2014-15 2013-14
Investment/ Rs. in crore 586.23 591.86 539.74 544.53 529.61
Growth% compare to previous years -0.95 9.66 -0.88 2.82
-100
0
100
200
300
400
500
600
700
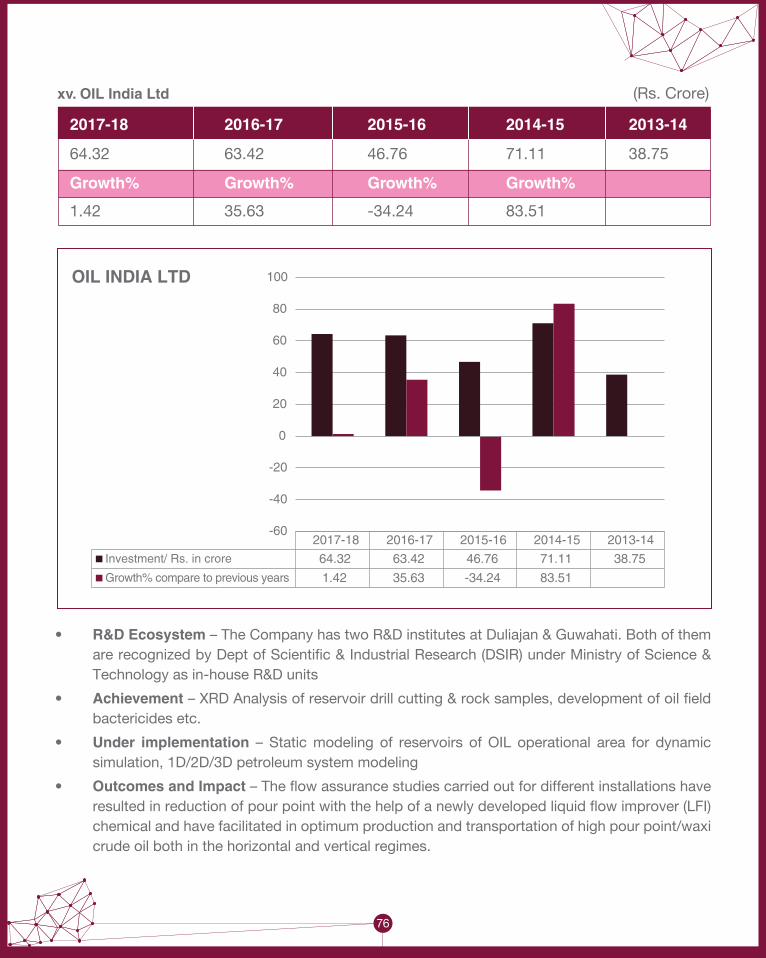
xv. OIL India Ltd
2017-18 2016-17 2015-16 2014-15 2013-14
64.32 63.42 46.76 71.11 38.75
Growth% Growth% Growth% Growth%
1.42 35.63 -34.24 83.51
• R&D Ecosystem – The Company has two R&D institutes at Duliajan & Guwahati. Both of them are recognized by Dept of Scientific & Industrial Research (DSIR) under Ministry of Science & Technology as in-house R&D units
• Achievement – XRD Analysis of reservoir drill cutting & rock samples, development of oil field bactericides etc.
• Under implementation – Static modeling of reservoirs of OIL operational area for dynamic simulation, 1D/2D/3D petroleum system modeling
• Outcomes and Impact – The flow assurance studies carried out for different installations have resulted in reduction of pour point with the help of a newly developed liquid flow improver (LFI) chemical and have facilitated in optimum production and transportation of high pour point/waxi crude oil both in the horizontal and vertical regimes.
76
OIL INDIA LTD
(Rs. Crore)
2017-18 2016-17 2015-16 2014-15 2013-14Investment/ Rs. in crore 64.32 63.42 46.76 71.11 38.75
Growth% compare to previous years 1.42 35.63 -34.24 83.51
-60
-40
-20
0
20
40
60
80
100
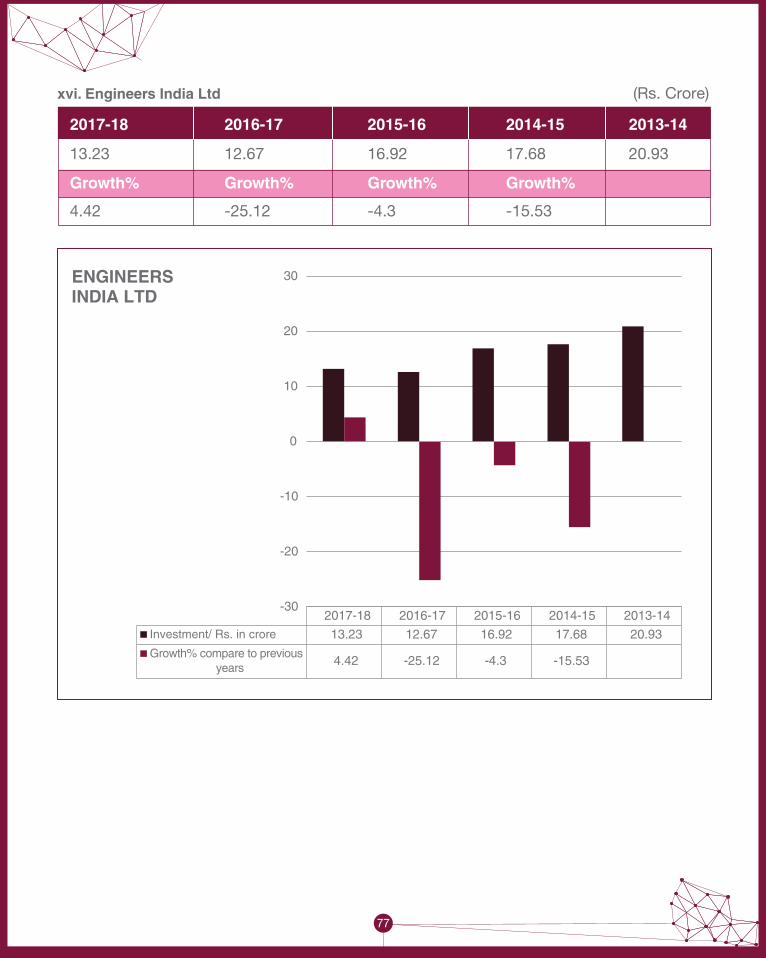
77
xvi. Engineers India Ltd
2017-18 2016-17 2015-16 2014-15 2013-14
13.23 12.67 16.92 17.68 20.93
Growth% Growth% Growth% Growth%
4.42 -25.12 -4.3 -15.53
ENGINEERSINDIA LTD
(Rs. Crore)
2017-18 2016-17 2015-16 2014-15 2013-14
Investment/ Rs. in crore 13.23 12.67 16.92 17.68 20.93
Growth% compare to previousyears
4.42 -25.12 -4.3 -15.53
-30
-20
-10
0
10
20
30
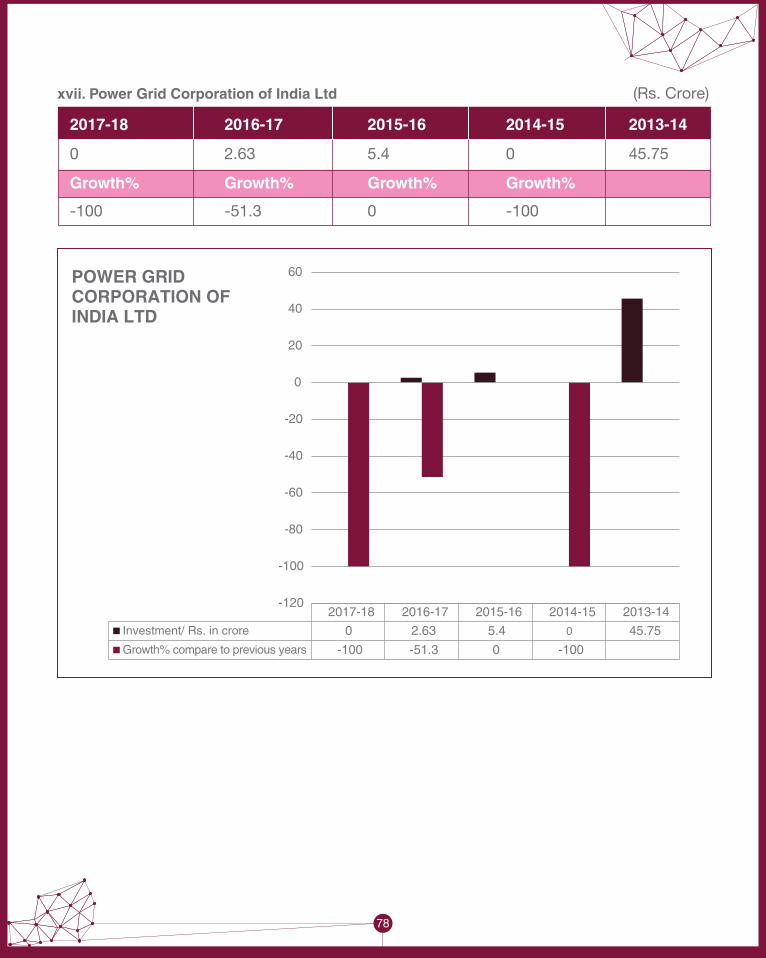
xvii. Power Grid Corporation of India Ltd
2017-18 2016-17 2015-16 2014-15 2013-14
0 2.63 5.4 0 45.75
Growth% Growth% Growth% Growth%
-100 -51.3 0 -100
POWER GRIDCORPORATION OFINDIA LTD
(Rs. Crore)
2017-18 2016-17 2015-16 2014-15 2013-14
Investment/ Rs. in crore 0 2.63 5.4 0 45.75
Growth% compare to previous years -100 -51.3 0 -100
-120
-100
-80
-60
-40
-20
0
20
40
60
78

Annexure 4: CPSE Highlights
79
CPSEs HighlightsParticulars 2013-14 2014-15 2015-16 2016-17 2017-18Nos. of Operating CPSE 234 236 244 257 257
Nos. of Profit making CPSE 164 159 164 175 184
Nos. of Loss Making CPSE 70 76 79 81 71
Overall net profit of operating 1.28 1.03 1.14 1.25 1.28CPSEs (Rs. Lakh crore)
Loss of loss making CPSEs 0.21 0.27 0.31 0.27 0.31(Rs. Lakh crore)
Investment (Rs. Lakh crore) 9.92 10.96 11.61 12.46 13.73
Capital employed (Rs.Lakh crore) 17.39 18.67 20.60 21.67 23.16
Net worth (Rs. Lakh crore) 9.45 9.84 10.80 10.84 11.27
Total gross turnover (Rs.Lakh crore) 20.66 19.95 18.35 19.56 21.56
Total net income/revenue 20.56 19.65 17.64 18.22 20.33 (Rs. Lakh crore)
Contribution to central exchequer 2.21 2.01 2.76 3.61 3.50(Rs. Lakh crore)

Annexure 5: Sectoral break up of R&Dexpenditure - last 5 year
(Base Year 2013-14, Amount>Rs.10 crore)
2017-18 2016-17 2015-16 2014-15 2013-14 Growth Growth Growth Growth % % % %
HEAVY & MEDIUM ENGINEERING1 Bharat 33.51 31.16 29.43 22.72 19.9 7.54 5.88 29.53 14.23 Dynamics ltd.
2 Bharat 938.51 750.7 704.27 0 467 25.02 6.59 0 -100 Electronics ltd.
3 Bharat Heavy 752.64 793.62 893.07 1018.59 1113.79 -5.16 -11.14 -12.33 -8.55 Electricals ltd.
4 Electronics Corpn. 0 0 0 23.2 47.43 - - - -51.09 of India ltd.
5 ITI ltd. 15.1 16.3 16.38 12.94 17.23 -7.36 -0.49 26.58 -24.9
6 Mazagon Dock 75.11 77.09 63.83 57.88 47.56 -2.57 20.77 10.28 21.7 Shipbuilders ltd.
7 Hindustan 1611.9 1284 1191 1046.7 1083 25.53 7.81 13.79 -3.38 Aeronautics ltd.
PETROLEUM (REFINERY & MARKETING)8 Hindustan Petro- 232.78 276.54 180.32 129.87 100.62 -15.82 53.36 38.85 29.07 leum Corpn. ltd.
9 Indian Oil 230.86 217.53 235.86 169.31 174.4 6.13 -7.77 39.31 -2.92 Corporation ltd.
10 Bharat Petroleum 47.38 32.78 40.49 40.73 36.8 44.54 -19.04 -0.59 10.62 Corporation ltd.
POWER GENERATION11 NLC India ltd. 2.25 13.35 13.82 13.16 14.34 -83.15 -3.4 5.02 -8.23
12 NTPC ltd. 184.98 162.28 129.68 129.56 134.34 13.99 25.14 0.09 -3.56
13 Nuclear power 13.06 10.29 7.46 4.89 79.41 26.92 37.94 52.56 -93.84 Corpn. of India ltd.
80

81
(Base Year 2013-14, Amount>Rs.10 crore)
2017-18 2016-17 2015-16 2014-15 2013-14 Growth Growth Growth Growth % % % %
CRUDE OIL14 Oil & Natural Gas 586.23 591.86 539.74 544.53 529.61 -0.95 9.66 -0.88 2.82 Corporation ltd.
15 Oil India ltd. 64.32 63.42 46.76 71.11 38.75 1.42 35.63 -34.24 83.51
CONTRACT & CONSTRUCTION AND TECH. CONSULTANCY SERVICES16 Engineers 13.23 12.67 16.92 17.68 20.93 4.42 -25.12 -4.3 -15.53 India ltd.
POWER TRANSMISSION17 Power Grid 0 2.63 5.4 0 45.75 - -51.3 - - Corporation of India ltd.

Annexure 6: MCA Methodology forR&D Data Capturing
The Companies Act, 1956, empowers the Central Government to regulate the formation, functioning and winding up of companies. The legal provisions have cast a duty upon the management of the Company to prepare the financial statements in accordance with the Indian accounting standards. The Government of India has notified the Companies (Accounting Standards) Rules, 2006. Accounting Standards are those specified in Rule 3 of Companies (Accounting Standards) Rules, 2006. Currently, Accounting Standards 1 to 7 and 9 to 29 have been prescribed by the Companies (Accounting Standards) Rules 2006 and are to be mandatorily complied with by companies.
As per sec 137 of Company’s Act 2013, every company is required to file their financial statements, adopted in the AGM, to ROC in prescribed forms, within 30 days. The Financial statements are to be filed in Form AOC4 and the consolidated financial statements, if any, with Form AOC-4 CFS. As per notification of Central government as on 9th Sep, 2015 under XBRL Rules, 2015 it was made compul-sory for following class of companies to file their financial statements in AOC 4-XBRL (Extensible Business Reporting Language) format.
These companies include: -
1) Companies listed with Stock Exchange in India and their Indian subsidiaries.
2) Companies having Paid up capital of Rs. 5 Cr. or above.
3) Companies having turnover of Rs. 100 Cr. or above.
4) All companies which are required to prepare their financial statements in accordance with Companies (Indian Accounting Standards) Rules,2015
Exceptions: - Provided that, Non-banking Financial companies, Housing Finance Companies, Companies engaged in business of banking and Insurance are exempted from filing in XBRL.
• The companies which have filed their financial statements under this rule shall continue to file their financial statements in same way even if it does not fall under the aforementioned criteria.
INDAS came into applicability in 2016 and many companies even filed INDAS forms in 2016 but it was made mandatory for companies in phases w.e.f. 01.04.2017.
• All listed or unlisted company whose Net worth is greater than equal to Rs. 500 Cr. (applicable from 1st April, 2016).
• All listed company or companies in process of being listed, whose Net worth is greater than or equal to Rs. 250 Cr. But less than Rs.500 Cr. (applicable from 1st April, 2017) (with certain exceptions).
82
1 Andhra Pradesh 84.50 0.00 43.55 47.91
2 Arunachal Pradesh 118.53 184.96 126.76 139.44
3 Assam 118.60 200.92 152.72 116.66
4 Bihar 39.95 43.00 42.00 33.13
5 Chhattisgarh 98.80 134.22 102.02 111.80
6 Goa 89.25 76.84 69.64 59.54
7 Gujarat 74.60 125.20 67.00 72.67
8 Haryana 37.50 57.53 34.27 23.41
9 Himachal Pradesh 112.66 165.12 104.72 99.77
10 J&K 0.00 0.00 0.00 0.00
11 Jharkhand 65.80 60.00 0.00 0.00
12 Karnataka 114.20 185.20 127.00 138.91
13 Kerala 102.10 94.00 188.00 191.69
14 Madhya Pradesh 140.05 208.55 150.35 165.39
15 Maharashtra 26.40 94.80 37.80 1.00
16 Manipur 99.45 145.94 114.14 106.21
17 Meghalaya 22.22 53.80 32.72 10.15
18 Mizoram 72.40 115.20 83.00 91.30
19 Nagaland 63.60 136.20 78.00 85.79
20 Odisha 0.00 0.00 0.00 0.00
21 Punjab 170.85 233.76 150.56 194.22
22 Rajasthan 167.25 156.00 156.00 55.90
23 Sikkim 98.97 135.80 86.46 47.69
24 Tamilnadu 81.70 136.88 104.72 115.19
25 Telangana 39.21 132.20 31.45 21.18
26 Tripura 55.90 63.00 62.00 67.20
27 Uttar Pradesh## 158.20 150.20 0.00 105.14
28 Uttarakhand 114.20 147.80 95.00 104.50
29 West Bengal 0.00 90.20 32.00 0.00
30 Andaman & Nicobar Islands 0.00 55.40 20.20 1.00
31 Chandigarh 0.00 0.00 0.00 0.00
32 Dadra and Nagar Haveli 0.00 0.00 0.00 0.00
33 Daman and Diu 0.00 0.00 0.00 0.00
34 Delhi 0.00 0.00 0.00 0.00
35 Lakshadweep 0.00 0.00 0.00 0.00
36 Puducherry 0.00 52.20 11.50 8.86
Total 2366.89 3434.92 2303.58 2215.65

83
• All Banks, NBFCs and Insurance companies whose Net worth is greater than or equal to Rs. 500 Cr. (applicable from 1st April, 2018).
Thus, AOC 4 does not seek specific disclosure with respect to R& D Expenditure, XBRL form does. Hence the information needed for R&D Expenses can be extracted only for those companies who have filed their annual statements in XBRL format.
1 Andhra Pradesh 84.50 0.00 43.55 47.91
2 Arunachal Pradesh 118.53 184.96 126.76 139.44
3 Assam 118.60 200.92 152.72 116.66
4 Bihar 39.95 43.00 42.00 33.13
5 Chhattisgarh 98.80 134.22 102.02 111.80
6 Goa 89.25 76.84 69.64 59.54
7 Gujarat 74.60 125.20 67.00 72.67
8 Haryana 37.50 57.53 34.27 23.41
9 Himachal Pradesh 112.66 165.12 104.72 99.77
10 J&K 0.00 0.00 0.00 0.00
11 Jharkhand 65.80 60.00 0.00 0.00
12 Karnataka 114.20 185.20 127.00 138.91
13 Kerala 102.10 94.00 188.00 191.69
14 Madhya Pradesh 140.05 208.55 150.35 165.39
15 Maharashtra 26.40 94.80 37.80 1.00
16 Manipur 99.45 145.94 114.14 106.21
17 Meghalaya 22.22 53.80 32.72 10.15
18 Mizoram 72.40 115.20 83.00 91.30
19 Nagaland 63.60 136.20 78.00 85.79
20 Odisha 0.00 0.00 0.00 0.00
21 Punjab 170.85 233.76 150.56 194.22
22 Rajasthan 167.25 156.00 156.00 55.90
23 Sikkim 98.97 135.80 86.46 47.69
24 Tamilnadu 81.70 136.88 104.72 115.19
25 Telangana 39.21 132.20 31.45 21.18
26 Tripura 55.90 63.00 62.00 67.20
27 Uttar Pradesh## 158.20 150.20 0.00 105.14
28 Uttarakhand 114.20 147.80 95.00 104.50
29 West Bengal 0.00 90.20 32.00 0.00
30 Andaman & Nicobar Islands 0.00 55.40 20.20 1.00
31 Chandigarh 0.00 0.00 0.00 0.00
32 Dadra and Nagar Haveli 0.00 0.00 0.00 0.00
33 Daman and Diu 0.00 0.00 0.00 0.00
34 Delhi 0.00 0.00 0.00 0.00
35 Lakshadweep 0.00 0.00 0.00 0.00
36 Puducherry 0.00 52.20 11.50 8.86
Total 2366.89 3434.92 2303.58 2215.65

Annexure 7: State Governments/UTs expenditure on R&D
1 Andhra Pradesh 513.38 36.99 550.37 476.14 140.00 616.14 591.22 110.00 701.22
2 Arunachal Pradesh 23.12 0.00 23.12 7.43 8.50 15.92 2.77 0.00 2.77
3 Assam 225.20 0.00 225.20 330.11 63.00 393.11 341.19 0.00 341.19
4 Bihar 456.19 0.00 456.19 371.96 0.00 371.96 404.05 0.00 404.05
5 Chhattisgarh 108.01 1.00 109.01 129.83 32.20 162.03 132.50 39.16 171.66
6 Goa 2.23 0.00 2.23 2.60 0.00 2.60 2.63 10.20 12.83
7 Gujarat 625.12 0.00 625.12 764.57 0.00 764.57 703.94 0.00 703.94
8 Haryana 320.79 0.00 320.79 398.77 0.00 398.77 482.08 0.00 482.08
9 Himachal Pradesh 205.78 0.00 205.78 251.43 0.00 251.43 167.82 0.00 167.82
10 J&K 226.87 30.00 256.87 244.30 23.40 267.70 268.83 29.80 298.63
11 Jharkhand 132.10 0.00 132.10 187.81 0.00 187.81 168.34 0.00 168.34
12 Karnataka 663.28 11.00 674.28 713.08 0.00 713.08 606.98 0.00 606.98
13 Kerala 479.71 0.00 479.71 547.97 0.00 547.97 652.35 0.00 652.35
14 Madhya Pradesh 207.78 0.00 207.78 182.66 0.00 182.66 191.93 0.00 191.93
15 Maharashtra 823.92 40.08 864.00 1089.22 18.30 1107.52 1051.31 7.55 1058.86
16 Manipur 2.70 0.00 2.70 3.63 0.00 3.63 3.79 0.00 3.79
17 Meghalaya 12.29 0.00 12.29 15.66 0.00 15.66 17.85 0.00 17.85
18 Mizoram 17.09 0.00 17.09 12.12 0.00 12.12 4.04 0.00 4.04
19 Nagaland 11.46 0.00 11.46 12.48 0.00 12.48 13.07 0.00 13.07
20 Odisha 128.40 0.00 128.40 157.40 0.00 157.40 155.31 0.00 155.31
21 Punjab 372.59 0.00 372.59 443.05 0.00 443.05 400.47 0.00 400.47
22 Rajasthan 218.67 0.00 218.67 238.48 0.00 238.48 266.90 0.00 266.90
23 Sikkim 0.00 0.00 0.00 0.00 0.00 0.00 0.00 0.00 0.00
24 Tamil Nadu 703.46 2.98 706.44 825.17 6.94 832.11 861.97 4.49 866.45
25 Telangana 366.65 0.00 366.65 385.56 0.00 385.56 467.95 0.00 467.95
26 Tripura 0.76 1.20 1.96 1.01 0.00 1.01 1.07 0.00 1.07
27 Uttarakhand 160.22 0.00 160.22 207.58 0.00 207.58 242.87 0.00 242.87
28 Uttar Pradesh 182.20 85.57 267.77 221.02 30.29 251.31 259.44 32.53 291.97
29 West Bengal 158.75 23.62 182.37 173.15 33.00 206.15 187.21 63.00 250.21
30 NCT Delhi 2.83 0.00 2.83 4.70 0.00 4.70 3.72 0.00 3.72
31 Puducherry 18.61 0.00 18.61 18.47 0.49 18.96 18.10 0.00 18.10
In Rs Crore Agricultural Research and EducationS.No. State/UT 2016-2017 (actuals) Total 2017-2018 (RE) Total 2018-2019 (BE) Total Revenue Capital Revenue Capital Revenue Capital
84
1 Andhra Pradesh 84.50 0.00 43.55 47.91
2 Arunachal Pradesh 118.53 184.96 126.76 139.44
3 Assam 118.60 200.92 152.72 116.66
4 Bihar 39.95 43.00 42.00 33.13
5 Chhattisgarh 98.80 134.22 102.02 111.80
6 Goa 89.25 76.84 69.64 59.54
7 Gujarat 74.60 125.20 67.00 72.67
8 Haryana 37.50 57.53 34.27 23.41
9 Himachal Pradesh 112.66 165.12 104.72 99.77
10 J&K 0.00 0.00 0.00 0.00
11 Jharkhand 65.80 60.00 0.00 0.00
12 Karnataka 114.20 185.20 127.00 138.91
13 Kerala 102.10 94.00 188.00 191.69
14 Madhya Pradesh 140.05 208.55 150.35 165.39
15 Maharashtra 26.40 94.80 37.80 1.00
16 Manipur 99.45 145.94 114.14 106.21
17 Meghalaya 22.22 53.80 32.72 10.15
18 Mizoram 72.40 115.20 83.00 91.30
19 Nagaland 63.60 136.20 78.00 85.79
20 Odisha 0.00 0.00 0.00 0.00
21 Punjab 170.85 233.76 150.56 194.22
22 Rajasthan 167.25 156.00 156.00 55.90
23 Sikkim 98.97 135.80 86.46 47.69
24 Tamilnadu 81.70 136.88 104.72 115.19
25 Telangana 39.21 132.20 31.45 21.18
26 Tripura 55.90 63.00 62.00 67.20
27 Uttar Pradesh## 158.20 150.20 0.00 105.14
28 Uttarakhand 114.20 147.80 95.00 104.50
29 West Bengal 0.00 90.20 32.00 0.00
30 Andaman & Nicobar Islands 0.00 55.40 20.20 1.00
31 Chandigarh 0.00 0.00 0.00 0.00
32 Dadra and Nagar Haveli 0.00 0.00 0.00 0.00
33 Daman and Diu 0.00 0.00 0.00 0.00
34 Delhi 0.00 0.00 0.00 0.00
35 Lakshadweep 0.00 0.00 0.00 0.00
36 Puducherry 0.00 52.20 11.50 8.86
Total 2366.89 3434.92 2303.58 2215.65
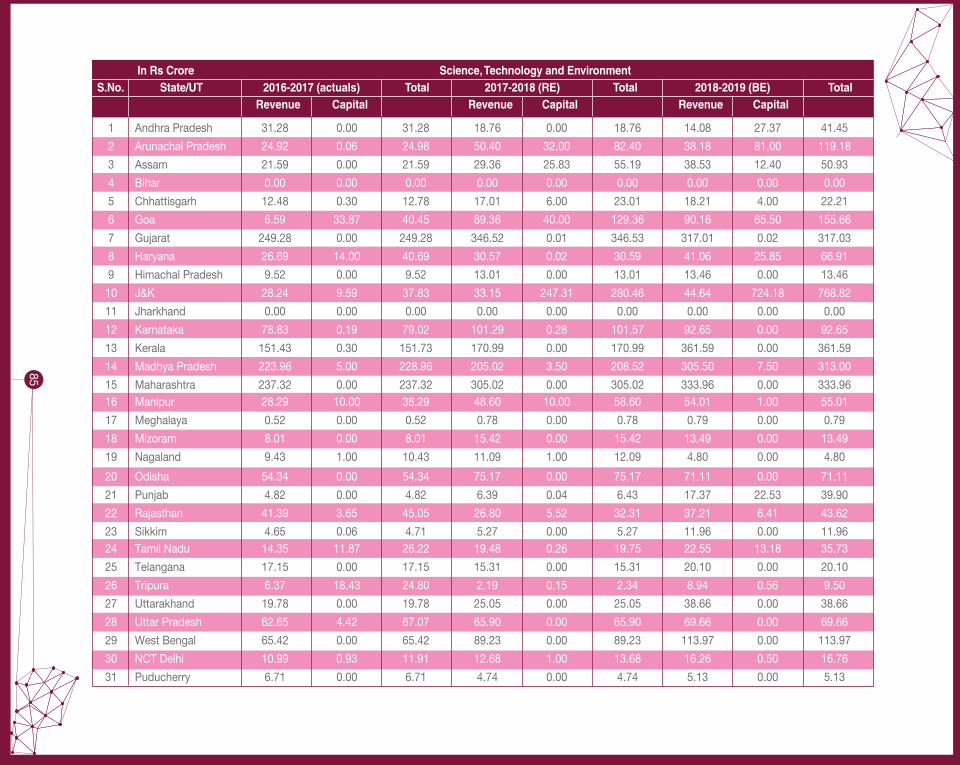
85
1 Andhra Pradesh 31.28 0.00 31.28 18.76 0.00 18.76 14.08 27.37 41.45
2 Arunachal Pradesh 24.92 0.06 24.98 50.40 32.00 82.40 38.18 81.00 119.18
3 Assam 21.59 0.00 21.59 29.36 25.83 55.19 38.53 12.40 50.93
4 Bihar 0.00 0.00 0.00 0.00 0.00 0.00 0.00 0.00 0.00
5 Chhattisgarh 12.48 0.30 12.78 17.01 6.00 23.01 18.21 4.00 22.21
6 Goa 6.59 33.87 40.45 89.36 40.00 129.36 90.16 65.50 155.66
7 Gujarat 249.28 0.00 249.28 346.52 0.01 346.53 317.01 0.02 317.03
8 Haryana 26.69 14.00 40.69 30.57 0.02 30.59 41.06 25.85 66.91
9 Himachal Pradesh 9.52 0.00 9.52 13.01 0.00 13.01 13.46 0.00 13.46
10 J&K 28.24 9.59 37.83 33.15 247.31 280.46 44.64 724.18 768.82
11 Jharkhand 0.00 0.00 0.00 0.00 0.00 0.00 0.00 0.00 0.00
12 Karnataka 78.83 0.19 79.02 101.29 0.28 101.57 92.65 0.00 92.65
13 Kerala 151.43 0.30 151.73 170.99 0.00 170.99 361.59 0.00 361.59
14 Madhya Pradesh 223.96 5.00 228.96 205.02 3.50 208.52 305.50 7.50 313.00
15 Maharashtra 237.32 0.00 237.32 305.02 0.00 305.02 333.96 0.00 333.96 16 Manipur 28.29 10.00 38.29 48.60 10.00 58.60 54.01 1.00 55.01
17 Meghalaya 0.52 0.00 0.52 0.78 0.00 0.78 0.79 0.00 0.79
18 Mizoram 8.01 0.00 8.01 15.42 0.00 15.42 13.49 0.00 13.49
19 Nagaland 9.43 1.00 10.43 11.09 1.00 12.09 4.80 0.00 4.80
20 Odisha 54.34 0.00 54.34 75.17 0.00 75.17 71.11 0.00 71.11
21 Punjab 4.82 0.00 4.82 6.39 0.04 6.43 17.37 22.53 39.90
22 Rajasthan 41.39 3.65 45.05 26.80 5.52 32.31 37.21 6.41 43.62
23 Sikkim 4.65 0.06 4.71 5.27 0.00 5.27 11.96 0.00 11.96 24 Tamil Nadu 14.35 11.87 26.22 19.48 0.26 19.75 22.55 13.18 35.73
25 Telangana 17.15 0.00 17.15 15.31 0.00 15.31 20.10 0.00 20.10
26 Tripura 6.37 18.43 24.80 2.19 0.15 2.34 8.94 0.56 9.50
27 Uttarakhand 19.78 0.00 19.78 25.05 0.00 25.05 38.66 0.00 38.66
28 Uttar Pradesh 62.65 4.42 67.07 65.90 0.00 65.90 69.66 0.00 69.66
29 West Bengal 65.42 0.00 65.42 89.23 0.00 89.23 113.97 0.00 113.97
30 NCT Delhi 10.99 0.93 11.91 12.68 1.00 13.68 16.26 0.50 16.76
31 Puducherry 6.71 0.00 6.71 4.74 0.00 4.74 5.13 0.00 5.13
In Rs Crore Science, Technology and EnvironmentS.No. State/UT 2016-2017 (actuals) Total 2017-2018 (RE) Total 2018-2019 (BE) Total Revenue Capital Revenue Capital Revenue Capital
1 Andhra Pradesh 84.50 0.00 43.55 47.91
2 Arunachal Pradesh 118.53 184.96 126.76 139.44
3 Assam 118.60 200.92 152.72 116.66
4 Bihar 39.95 43.00 42.00 33.13
5 Chhattisgarh 98.80 134.22 102.02 111.80
6 Goa 89.25 76.84 69.64 59.54
7 Gujarat 74.60 125.20 67.00 72.67
8 Haryana 37.50 57.53 34.27 23.41
9 Himachal Pradesh 112.66 165.12 104.72 99.77
10 J&K 0.00 0.00 0.00 0.00
11 Jharkhand 65.80 60.00 0.00 0.00
12 Karnataka 114.20 185.20 127.00 138.91
13 Kerala 102.10 94.00 188.00 191.69
14 Madhya Pradesh 140.05 208.55 150.35 165.39
15 Maharashtra 26.40 94.80 37.80 1.00
16 Manipur 99.45 145.94 114.14 106.21
17 Meghalaya 22.22 53.80 32.72 10.15
18 Mizoram 72.40 115.20 83.00 91.30
19 Nagaland 63.60 136.20 78.00 85.79
20 Odisha 0.00 0.00 0.00 0.00
21 Punjab 170.85 233.76 150.56 194.22
22 Rajasthan 167.25 156.00 156.00 55.90
23 Sikkim 98.97 135.80 86.46 47.69
24 Tamilnadu 81.70 136.88 104.72 115.19
25 Telangana 39.21 132.20 31.45 21.18
26 Tripura 55.90 63.00 62.00 67.20
27 Uttar Pradesh## 158.20 150.20 0.00 105.14
28 Uttarakhand 114.20 147.80 95.00 104.50
29 West Bengal 0.00 90.20 32.00 0.00
30 Andaman & Nicobar Islands 0.00 55.40 20.20 1.00
31 Chandigarh 0.00 0.00 0.00 0.00
32 Dadra and Nagar Haveli 0.00 0.00 0.00 0.00
33 Daman and Diu 0.00 0.00 0.00 0.00
34 Delhi 0.00 0.00 0.00 0.00
35 Lakshadweep 0.00 0.00 0.00 0.00
36 Puducherry 0.00 52.20 11.50 8.86
Total 2366.89 3434.92 2303.58 2215.65
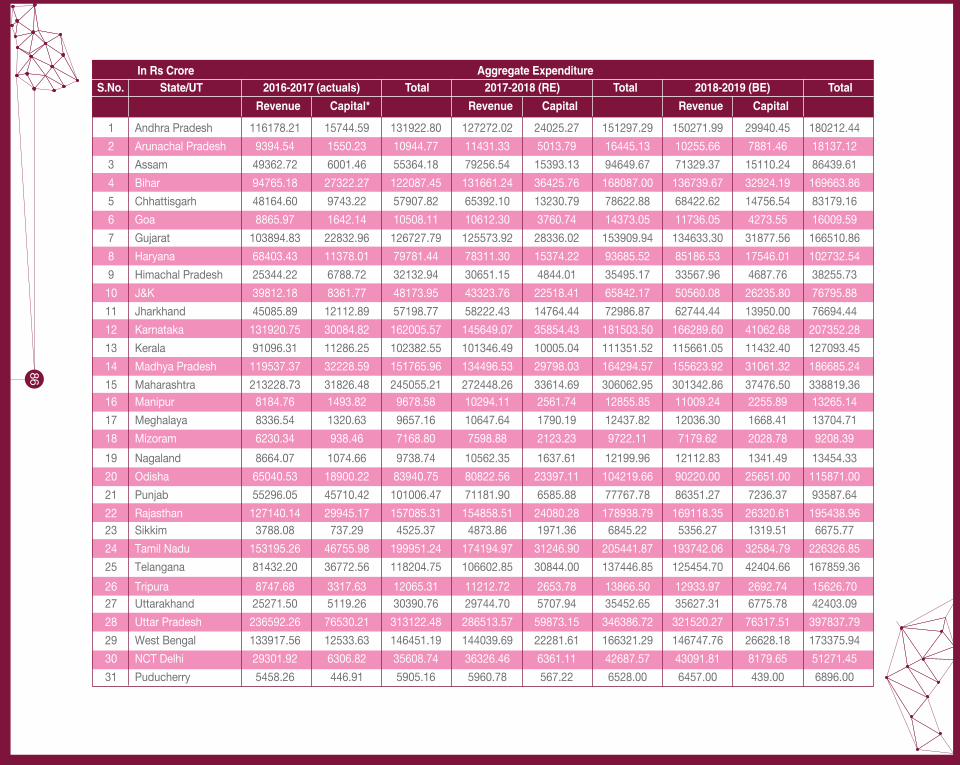
1 Andhra Pradesh 116178.21 15744.59 131922.80 127272.02 24025.27 151297.29 150271.99 29940.45 180212.44
2 Arunachal Pradesh 9394.54 1550.23 10944.77 11431.33 5013.79 16445.13 10255.66 7881.46 18137.12
3 Assam 49362.72 6001.46 55364.18 79256.54 15393.13 94649.67 71329.37 15110.24 86439.61
4 Bihar 94765.18 27322.27 122087.45 131661.24 36425.76 168087.00 136739.67 32924.19 169663.86
5 Chhattisgarh 48164.60 9743.22 57907.82 65392.10 13230.79 78622.88 68422.62 14756.54 83179.16
6 Goa 8865.97 1642.14 10508.11 10612.30 3760.74 14373.05 11736.05 4273.55 16009.59
7 Gujarat 103894.83 22832.96 126727.79 125573.92 28336.02 153909.94 134633.30 31877.56 166510.86
8 Haryana 68403.43 11378.01 79781.44 78311.30 15374.22 93685.52 85186.53 17546.01 102732.54
9 Himachal Pradesh 25344.22 6788.72 32132.94 30651.15 4844.01 35495.17 33567.96 4687.76 38255.73
10 J&K 39812.18 8361.77 48173.95 43323.76 22518.41 65842.17 50560.08 26235.80 76795.88
11 Jharkhand 45085.89 12112.89 57198.77 58222.43 14764.44 72986.87 62744.44 13950.00 76694.44
12 Karnataka 131920.75 30084.82 162005.57 145649.07 35854.43 181503.50 166289.60 41062.68 207352.28
13 Kerala 91096.31 11286.25 102382.55 101346.49 10005.04 111351.52 115661.05 11432.40 127093.45
14 Madhya Pradesh 119537.37 32228.59 151765.96 134496.53 29798.03 164294.57 155623.92 31061.32 186685.24
15 Maharashtra 213228.73 31826.48 245055.21 272448.26 33614.69 306062.95 301342.86 37476.50 338819.36 16 Manipur 8184.76 1493.82 9678.58 10294.11 2561.74 12855.85 11009.24 2255.89 13265.14
17 Meghalaya 8336.54 1320.63 9657.16 10647.64 1790.19 12437.82 12036.30 1668.41 13704.71
18 Mizoram 6230.34 938.46 7168.80 7598.88 2123.23 9722.11 7179.62 2028.78 9208.39
19 Nagaland 8664.07 1074.66 9738.74 10562.35 1637.61 12199.96 12112.83 1341.49 13454.33
20 Odisha 65040.53 18900.22 83940.75 80822.56 23397.11 104219.66 90220.00 25651.00 115871.00
21 Punjab 55296.05 45710.42 101006.47 71181.90 6585.88 77767.78 86351.27 7236.37 93587.64
22 Rajasthan 127140.14 29945.17 157085.31 154858.51 24080.28 178938.79 169118.35 26320.61 195438.96 23 Sikkim 3788.08 737.29 4525.37 4873.86 1971.36 6845.22 5356.27 1319.51 6675.77
24 Tamil Nadu 153195.26 46755.98 199951.24 174194.97 31246.90 205441.87 193742.06 32584.79 226326.85
25 Telangana 81432.20 36772.56 118204.75 106602.85 30844.00 137446.85 125454.70 42404.66 167859.36
26 Tripura 8747.68 3317.63 12065.31 11212.72 2653.78 13866.50 12933.97 2692.74 15626.70 27 Uttarakhand 25271.50 5119.26 30390.76 29744.70 5707.94 35452.65 35627.31 6775.78 42403.09
28 Uttar Pradesh 236592.26 76530.21 313122.48 286513.57 59873.15 346386.72 321520.27 76317.51 397837.79
29 West Bengal 133917.56 12533.63 146451.19 144039.69 22281.61 166321.29 146747.76 26628.18 173375.94
30 NCT Delhi 29301.92 6306.82 35608.74 36326.46 6361.11 42687.57 43091.81 8179.65 51271.45
31 Puducherry 5458.26 446.91 5905.16 5960.78 567.22 6528.00 6457.00 439.00 6896.00
86
In Rs Crore Aggregate ExpenditureS.No. State/UT 2016-2017 (actuals) Total 2017-2018 (RE) Total 2018-2019 (BE) Total
Revenue Capital* Revenue Capital Revenue Capital
1 Andhra Pradesh 84.50 0.00 43.55 47.91
2 Arunachal Pradesh 118.53 184.96 126.76 139.44
3 Assam 118.60 200.92 152.72 116.66
4 Bihar 39.95 43.00 42.00 33.13
5 Chhattisgarh 98.80 134.22 102.02 111.80
6 Goa 89.25 76.84 69.64 59.54
7 Gujarat 74.60 125.20 67.00 72.67
8 Haryana 37.50 57.53 34.27 23.41
9 Himachal Pradesh 112.66 165.12 104.72 99.77
10 J&K 0.00 0.00 0.00 0.00
11 Jharkhand 65.80 60.00 0.00 0.00
12 Karnataka 114.20 185.20 127.00 138.91
13 Kerala 102.10 94.00 188.00 191.69
14 Madhya Pradesh 140.05 208.55 150.35 165.39
15 Maharashtra 26.40 94.80 37.80 1.00
16 Manipur 99.45 145.94 114.14 106.21
17 Meghalaya 22.22 53.80 32.72 10.15
18 Mizoram 72.40 115.20 83.00 91.30
19 Nagaland 63.60 136.20 78.00 85.79
20 Odisha 0.00 0.00 0.00 0.00
21 Punjab 170.85 233.76 150.56 194.22
22 Rajasthan 167.25 156.00 156.00 55.90
23 Sikkim 98.97 135.80 86.46 47.69
24 Tamilnadu 81.70 136.88 104.72 115.19
25 Telangana 39.21 132.20 31.45 21.18
26 Tripura 55.90 63.00 62.00 67.20
27 Uttar Pradesh## 158.20 150.20 0.00 105.14
28 Uttarakhand 114.20 147.80 95.00 104.50
29 West Bengal 0.00 90.20 32.00 0.00
30 Andaman & Nicobar Islands 0.00 55.40 20.20 1.00
31 Chandigarh 0.00 0.00 0.00 0.00
32 Dadra and Nagar Haveli 0.00 0.00 0.00 0.00
33 Daman and Diu 0.00 0.00 0.00 0.00
34 Delhi 0.00 0.00 0.00 0.00
35 Lakshadweep 0.00 0.00 0.00 0.00
36 Puducherry 0.00 52.20 11.50 8.86
Total 2366.89 3434.92 2303.58 2215.65

87
1 Andhra Pradesh 0.47 0.23 0.44 0.39 0.58 0.42 0.40 0.46 0.41
2 Arunachal Pradesh 0.51 0.00 0.44 0.51 0.81 0.60 0.40 1.03 0.67
3 Assam 0.50 0.00 0.45 0.45 0.58 0.47 0.53 0.08 0.45
4 Bihar 0.48 0.00 0.37 0.28 0.00 0.22 0.30 0.00 0.24
5 Chhattisgarh 0.25 0.01 0.21 0.22 0.29 0.24 0.22 0.29 0.23
6 Goa 0.10 2.06 0.41 0.87 1.06 0.92 0.79 1.77 1.05
7 Gujarat 0.84 0.00 0.69 0.88 0.00 0.72 0.76 0.00 0.61
8 Haryana 0.51 0.12 0.45 0.55 0.00 0.46 0.61 0.15 0.53
9 Himachal Pradesh 0.85 0.00 0.67 0.86 0.00 0.74 0.54 0.00 0.47
10 J&K 0.64 0.47 0.61 0.64 1.20 0.83 0.62 2.87 1.39
11 Jharkhand 0.29 0.00 0.23 0.32 0.00 0.26 0.27 0.00 0.22 12 Karnataka 0.56 0.04 0.46 0.56 0.00 0.45 0.42 0.00 0.34
13 Kerala 0.69 0.00 0.62 0.71 0.00 0.65 0.88 0.00 0.80
14 Madhya Pradesh 0.36 0.02 0.29 0.29 0.01 0.24 0.32 0.02 0.27
15 Maharashtra 0.50 0.13 0.45 0.51 0.05 0.46 0.46 0.02 0.41
16 Manipur 0.38 0.67 0.42 0.51 0.39 0.48 0.53 0.04 0.44
17 Meghalaya 0.15 0.00 0.13 0.15 0.00 0.13 0.15 0.00 0.14
18 Mizoram 0.40 0.00 0.35 0.36 0.00 0.28 0.24 0.00 0.19
19 Nagaland 0.24 0.09 0.22 0.22 0.06 0.20 0.15 0.00 0.13
20 Odisha 0.28 0.00 0.22 0.29 0.00 0.22 0.25 0.00 0.20
21 Punjab 0.68 0.00 0.37 0.63 0.00 0.58 0.48 0.31 0.47 22 Rajasthan 0.20 0.01 0.17 0.17 0.02 0.15 0.18 0.02 0.16
23 Sikkim 0.12 0.01 0.10 0.11 0.00 0.08 0.22 0.00 0.18
24 Tamil Nadu 0.47 0.03 0.37 0.48 0.02 0.41 0.46 0.05 0.40
25 Telangana 0.47 0.00 0.32 0.38 0.00 0.29 0.39 0.00 0.29
26 Tripura 0.08 0.59 0.22 0.03 0.01 0.02 0.08 0.02 0.07
27 Uttarakhand 0.71 0.00 0.59 0.78 0.00 0.66 0.79 0.00 0.66
28 Uttar Pradesh 0.10 0.12 0.11 0.10 0.05 0.09 0.10 0.04 0.09
29 West Bengal 0.17 0.19 0.17 0.18 0.15 0.18 0.21 0.24 0.21
30 NCT Delhi 0.05 0.01 0.04 0.05 0.02 0.04 0.05 0.01 0.04
31 Puducherry 0.46 0.00 0.43 0.39 0.09 0.36 0.36 0.00 0.34
In Rs Crore R& D Expenditure as a proportion of Aggregate ExpenditureS.No. State/UT 2016-2017 (actuals) Total 2017-2018 (RE) Total 2018-2019 (BE) Total
Revenue Capital Revenue Capital Revenue Capital
1 Andhra Pradesh 84.50 0.00 43.55 47.91
2 Arunachal Pradesh 118.53 184.96 126.76 139.44
3 Assam 118.60 200.92 152.72 116.66
4 Bihar 39.95 43.00 42.00 33.13
5 Chhattisgarh 98.80 134.22 102.02 111.80
6 Goa 89.25 76.84 69.64 59.54
7 Gujarat 74.60 125.20 67.00 72.67
8 Haryana 37.50 57.53 34.27 23.41
9 Himachal Pradesh 112.66 165.12 104.72 99.77
10 J&K 0.00 0.00 0.00 0.00
11 Jharkhand 65.80 60.00 0.00 0.00
12 Karnataka 114.20 185.20 127.00 138.91
13 Kerala 102.10 94.00 188.00 191.69
14 Madhya Pradesh 140.05 208.55 150.35 165.39
15 Maharashtra 26.40 94.80 37.80 1.00
16 Manipur 99.45 145.94 114.14 106.21
17 Meghalaya 22.22 53.80 32.72 10.15
18 Mizoram 72.40 115.20 83.00 91.30
19 Nagaland 63.60 136.20 78.00 85.79
20 Odisha 0.00 0.00 0.00 0.00
21 Punjab 170.85 233.76 150.56 194.22
22 Rajasthan 167.25 156.00 156.00 55.90
23 Sikkim 98.97 135.80 86.46 47.69
24 Tamilnadu 81.70 136.88 104.72 115.19
25 Telangana 39.21 132.20 31.45 21.18
26 Tripura 55.90 63.00 62.00 67.20
27 Uttar Pradesh## 158.20 150.20 0.00 105.14
28 Uttarakhand 114.20 147.80 95.00 104.50
29 West Bengal 0.00 90.20 32.00 0.00
30 Andaman & Nicobar Islands 0.00 55.40 20.20 1.00
31 Chandigarh 0.00 0.00 0.00 0.00
32 Dadra and Nagar Haveli 0.00 0.00 0.00 0.00
33 Daman and Diu 0.00 0.00 0.00 0.00
34 Delhi 0.00 0.00 0.00 0.00
35 Lakshadweep 0.00 0.00 0.00 0.00
36 Puducherry 0.00 52.20 11.50 8.86
Total 2366.89 3434.92 2303.58 2215.65

1 Andhra Pradesh 0.08 0.01 0.08 0.06 0.02 0.08 0.06 0.01 0.08
2 Arunachal Pradesh 0.24 0.00 0.24 0.25 0.17 0.42 0.16 0.32 0.48
3 Assam 0.10 0.00 0.10 0.13 0.03 0.16 0.12 0.00 0.12
4 Bihar 0.11 0.00 0.11 0.08 0.00 0.08 0.07 0.00 0.07
5 Chhattisgarh 0.05 0.00 0.05 0.05 0.01 0.07 0.05 0.01 0.06
6 Goa 0.01 0.05 0.07 0.12 0.05 0.17 0.11 0.09 0.19
7 Gujarat 0.08 0.00 0.08 0.08 0.00 0.08 0.07 0.00 0.07
8 Haryana 0.06 0.00 0.07 0.07 0.00 0.07 0.08 0.00 0.08
9 Himachal Pradesh 0.17 0.00 0.17 0.19 0.00 0.19 0.12 0.00 0.12
10 J&K 0.20 0.03 0.23 0.20 0.19 0.39 0.20 0.48 0.68
11 Jharkhand 0.06 0.00 0.06 0.07 0.00 0.07 0.06 0.00 0.06
12 Karnataka 0.06 0.00 0.07 0.06 0.00 0.06 0.05 0.00 0.05
13 Kerala 0.10 0.00 0.10 0.10 0.00 0.10 0.13 0.00 0.13
14 Madhya Pradesh 0.07 0.00 0.07 0.05 0.00 0.05 0.06 0.00 0.06
15 Maharashtra 0.05 0.00 0.05 0.06 0.00 0.06 0.05 0.00 0.05 16 Manipur 0.15 0.05 0.20 0.23 0.04 0.27 0.23 0.00 0.24
17 Meghalaya 0.05 0.00 0.05 0.06 0.00 0.06 0.06 0.00 0.06
18 Mizoram 0.14 0.00 0.14 0.16 0.00 0.16 0.09 0.00 0.09
19 Nagaland 0.10 0.00 0.10 0.10 0.00 0.10 0.07 0.00 0.07
20 Odisha 0.05 0.00 0.05 0.06 0.00 0.06 0.05 0.00 0.05
21 Punjab 0.09 0.00 0.09 0.09 0.00 0.09 0.08 0.00 0.08 22 Rajasthan 0.03 0.00 0.04 0.03 0.00 0.03 0.03 0.00 0.03
23 Sikkim 0.02 0.00 0.02 0.02 0.00 0.02 0.05 0.00 0.05
24 Tamil Nadu 0.06 0.00 0.06 0.06 0.00 0.06 0.06 0.00 0.06
25 Telangana 0.06 0.00 0.06 0.05 0.00 0.05 0.06 0.00 0.06
26 Tripura 0.02 0.00 0.02 0.01 0.00 0.01 0.02 0.00 0.02
27 Uttarakhand 0.09 0.00 0.09 0.11 0.00 0.11 0.12 0.00 0.12
28 Uttar Pradesh 0.02 0.01 0.03 0.02 0.00 0.02 0.02 0.00 0.02
29 West Bengal 0.03 0.00 0.03 0.03 0.00 0.03 0.03 0.01 0.03
30 NCT Delhi 0.00 0.00 0.00 0.00 0.00 0.00 0.00 0.00 0.00 31 Puducherry 0.09 0.00 0.09 0.08 0.00 0.08 0.07 0.00 0.07
In Rs Crore R&D Expenditure as a proportion of GSDPS.No. State/UT 2016-2017 (actuals) Total 2017-2018 (RE) Total 2018-2019 (BE) Total
Revenue Capital Revenue Capital Revenue Capital
88
1 Andhra Pradesh 84.50 0.00 43.55 47.91
2 Arunachal Pradesh 118.53 184.96 126.76 139.44
3 Assam 118.60 200.92 152.72 116.66
4 Bihar 39.95 43.00 42.00 33.13
5 Chhattisgarh 98.80 134.22 102.02 111.80
6 Goa 89.25 76.84 69.64 59.54
7 Gujarat 74.60 125.20 67.00 72.67
8 Haryana 37.50 57.53 34.27 23.41
9 Himachal Pradesh 112.66 165.12 104.72 99.77
10 J&K 0.00 0.00 0.00 0.00
11 Jharkhand 65.80 60.00 0.00 0.00
12 Karnataka 114.20 185.20 127.00 138.91
13 Kerala 102.10 94.00 188.00 191.69
14 Madhya Pradesh 140.05 208.55 150.35 165.39
15 Maharashtra 26.40 94.80 37.80 1.00
16 Manipur 99.45 145.94 114.14 106.21
17 Meghalaya 22.22 53.80 32.72 10.15
18 Mizoram 72.40 115.20 83.00 91.30
19 Nagaland 63.60 136.20 78.00 85.79
20 Odisha 0.00 0.00 0.00 0.00
21 Punjab 170.85 233.76 150.56 194.22
22 Rajasthan 167.25 156.00 156.00 55.90
23 Sikkim 98.97 135.80 86.46 47.69
24 Tamilnadu 81.70 136.88 104.72 115.19
25 Telangana 39.21 132.20 31.45 21.18
26 Tripura 55.90 63.00 62.00 67.20
27 Uttar Pradesh## 158.20 150.20 0.00 105.14
28 Uttarakhand 114.20 147.80 95.00 104.50
29 West Bengal 0.00 90.20 32.00 0.00
30 Andaman & Nicobar Islands 0.00 55.40 20.20 1.00
31 Chandigarh 0.00 0.00 0.00 0.00
32 Dadra and Nagar Haveli 0.00 0.00 0.00 0.00
33 Daman and Diu 0.00 0.00 0.00 0.00
34 Delhi 0.00 0.00 0.00 0.00
35 Lakshadweep 0.00 0.00 0.00 0.00
36 Puducherry 0.00 52.20 11.50 8.86
Total 2366.89 3434.92 2303.58 2215.65

89
Annexure 8: Core Grants released to State S&T Councils
(Base Year 2013-14, Amount>Rs.10 crore)
Sl. No. Name of the State Financial Year (Rs. In Lakhs) 2015-16 2016-17* 2017-18 2018-19#1 Andhra Pradesh 84.50 0.00 43.55 47.91
2 Arunachal Pradesh 118.53 184.96 126.76 139.44
3 Assam 118.60 200.92 152.72 116.66
4 Bihar 39.95 43.00 42.00 33.13
5 Chhattisgarh 98.80 134.22 102.02 111.80
6 Goa 89.25 76.84 69.64 59.54
7 Gujarat 74.60 125.20 67.00 72.67
8 Haryana 37.50 57.53 34.27 23.41
9 Himachal Pradesh 112.66 165.12 104.72 99.77
10 J&K 0.00 0.00 0.00 0.00
11 Jharkhand 65.80 60.00 0.00 0.00
12 Karnataka 114.20 185.20 127.00 138.91
13 Kerala 102.10 94.00 188.00 191.69
14 Madhya Pradesh 140.05 208.55 150.35 165.39
15 Maharashtra 26.40 94.80 37.80 1.00
16 Manipur 99.45 145.94 114.14 106.21
17 Meghalaya 22.22 53.80 32.72 10.15
18 Mizoram 72.40 115.20 83.00 91.30
19 Nagaland 63.60 136.20 78.00 85.79
20 Odisha 0.00 0.00 0.00 0.00
21 Punjab 170.85 233.76 150.56 194.22
22 Rajasthan 167.25 156.00 156.00 55.90
23 Sikkim 98.97 135.80 86.46 47.69
24 Tamilnadu 81.70 136.88 104.72 115.19
25 Telangana 39.21 132.20 31.45 21.18
26 Tripura 55.90 63.00 62.00 67.20
27 Uttar Pradesh## 158.20 150.20 0.00 105.14
28 Uttarakhand 114.20 147.80 95.00 104.50
29 West Bengal 0.00 90.20 32.00 0.00
30 Andaman & Nicobar Islands 0.00 55.40 20.20 1.00
31 Chandigarh 0.00 0.00 0.00 0.00
32 Dadra and Nagar Haveli 0.00 0.00 0.00 0.00
33 Daman and Diu 0.00 0.00 0.00 0.00
34 Delhi 0.00 0.00 0.00 0.00
35 Lakshadweep 0.00 0.00 0.00 0.00
36 Puducherry 0.00 52.20 11.50 8.86
Total 2366.89 3434.92 2303.58 2215.65

1 Andhra Pradesh 84.50 0.00 43.55 47.91
2 Arunachal Pradesh 118.53 184.96 126.76 139.44
3 Assam 118.60 200.92 152.72 116.66
4 Bihar 39.95 43.00 42.00 33.13
5 Chhattisgarh 98.80 134.22 102.02 111.80
6 Goa 89.25 76.84 69.64 59.54
7 Gujarat 74.60 125.20 67.00 72.67
8 Haryana 37.50 57.53 34.27 23.41
9 Himachal Pradesh 112.66 165.12 104.72 99.77
10 J&K 0.00 0.00 0.00 0.00
11 Jharkhand 65.80 60.00 0.00 0.00
12 Karnataka 114.20 185.20 127.00 138.91
13 Kerala 102.10 94.00 188.00 191.69
14 Madhya Pradesh 140.05 208.55 150.35 165.39
15 Maharashtra 26.40 94.80 37.80 1.00
16 Manipur 99.45 145.94 114.14 106.21
17 Meghalaya 22.22 53.80 32.72 10.15
18 Mizoram 72.40 115.20 83.00 91.30
19 Nagaland 63.60 136.20 78.00 85.79
20 Odisha 0.00 0.00 0.00 0.00
21 Punjab 170.85 233.76 150.56 194.22
22 Rajasthan 167.25 156.00 156.00 55.90
23 Sikkim 98.97 135.80 86.46 47.69
24 Tamilnadu 81.70 136.88 104.72 115.19
25 Telangana 39.21 132.20 31.45 21.18
26 Tripura 55.90 63.00 62.00 67.20
(Base Year 2013-14, Amount>Rs.10 crore)
Sl. No. Name of the State Financial Year (Rs. In Lakhs) 2015-16 2016-17* 2017-18 2018-19#
# The net release to each State is fixed after adjusting the carry forwarded amount of each State S&T Council in 2018-19 ie., Rs. 431.81 Lakhs.
*The Core Grant for the F. Y 2016-17 includes the project related grant and salary for the consultants ie., Rs. 941.20 Lakhs.
0.00 shows the proposal for receiving the grant from State S&T Council not received in the Department.
## The core grants to UP S&T Council is restricted to 70% of the grant sanctioned in the F. Y 2016-17 (70@% of 1.50 crore ie., 105,14,000/) due to the non-receipt of report from CST UP.
90
27 Uttar Pradesh## 158.20 150.20 0.00 105.14
28 Uttarakhand 114.20 147.80 95.00 104.50
29 West Bengal 0.00 90.20 32.00 0.00
30 Andaman & Nicobar Islands 0.00 55.40 20.20 1.00
31 Chandigarh 0.00 0.00 0.00 0.00
32 Dadra and Nagar Haveli 0.00 0.00 0.00 0.00
33 Daman and Diu 0.00 0.00 0.00 0.00
34 Delhi 0.00 0.00 0.00 0.00
35 Lakshadweep 0.00 0.00 0.00 0.00
36 Puducherry 0.00 52.20 11.50 8.86
Total 2366.89 3434.92 2303.58 2215.65
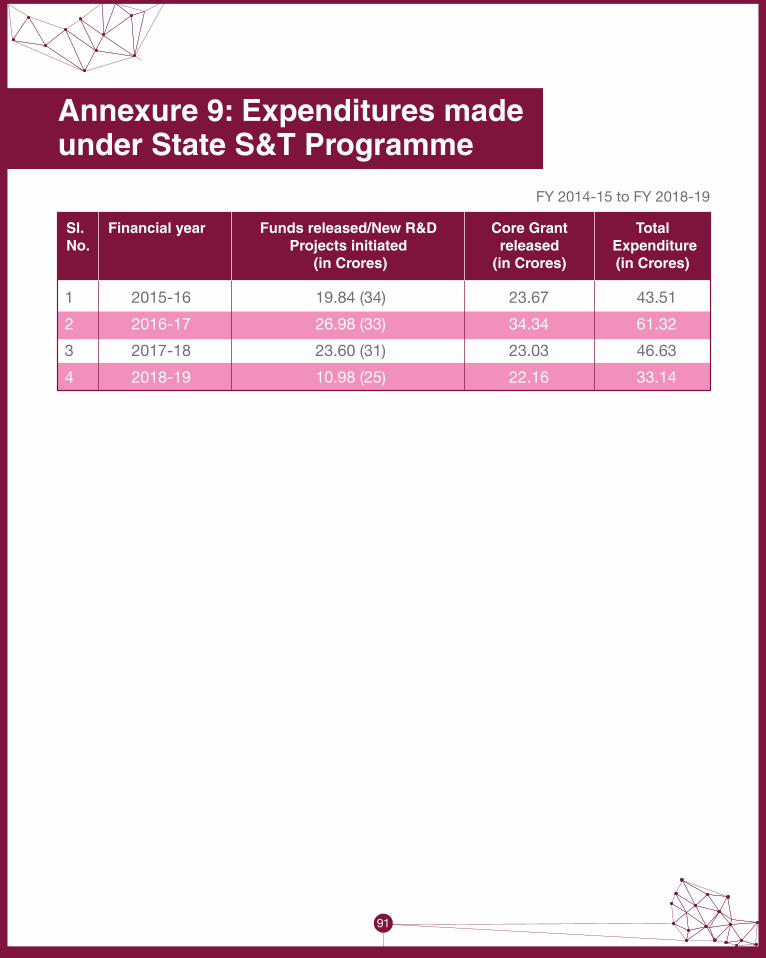
91
1 Andhra Pradesh 84.50 0.00 43.55 47.91
2 Arunachal Pradesh 118.53 184.96 126.76 139.44
3 Assam 118.60 200.92 152.72 116.66
4 Bihar 39.95 43.00 42.00 33.13
5 Chhattisgarh 98.80 134.22 102.02 111.80
6 Goa 89.25 76.84 69.64 59.54
7 Gujarat 74.60 125.20 67.00 72.67
8 Haryana 37.50 57.53 34.27 23.41
9 Himachal Pradesh 112.66 165.12 104.72 99.77
10 J&K 0.00 0.00 0.00 0.00
11 Jharkhand 65.80 60.00 0.00 0.00
12 Karnataka 114.20 185.20 127.00 138.91
13 Kerala 102.10 94.00 188.00 191.69
14 Madhya Pradesh 140.05 208.55 150.35 165.39
15 Maharashtra 26.40 94.80 37.80 1.00
16 Manipur 99.45 145.94 114.14 106.21
17 Meghalaya 22.22 53.80 32.72 10.15
18 Mizoram 72.40 115.20 83.00 91.30
19 Nagaland 63.60 136.20 78.00 85.79
20 Odisha 0.00 0.00 0.00 0.00
21 Punjab 170.85 233.76 150.56 194.22
22 Rajasthan 167.25 156.00 156.00 55.90
23 Sikkim 98.97 135.80 86.46 47.69
24 Tamilnadu 81.70 136.88 104.72 115.19
25 Telangana 39.21 132.20 31.45 21.18
26 Tripura 55.90 63.00 62.00 67.20
Annexure 9: Expenditures made under State S&T Programme
FY 2014-15 to FY 2018-19
1 2015-16 19.84 (34) 23.67 43.51
2 2016-17 26.98 (33) 34.34 61.32
3 2017-18 23.60 (31) 23.03 46.63
4 2018-19 10.98 (25) 22.16 33.14
Sl. Financial year Funds released/New R&D Core Grant TotalNo. Projects initiated released Expenditure (in Crores) (in Crores) (in Crores)
27 Uttar Pradesh## 158.20 150.20 0.00 105.14
28 Uttarakhand 114.20 147.80 95.00 104.50
29 West Bengal 0.00 90.20 32.00 0.00
30 Andaman & Nicobar Islands 0.00 55.40 20.20 1.00
31 Chandigarh 0.00 0.00 0.00 0.00
32 Dadra and Nagar Haveli 0.00 0.00 0.00 0.00
33 Daman and Diu 0.00 0.00 0.00 0.00
34 Delhi 0.00 0.00 0.00 0.00
35 Lakshadweep 0.00 0.00 0.00 0.00
36 Puducherry 0.00 52.20 11.50 8.86
Total 2366.89 3434.92 2303.58 2215.65

General criteria
• The In-house R&D units applying for recognition to DSIR are expected to be engaged in innovative research & development activities related to the line of business of the firm, such as, development of new technologies, design & engineering, process/product/design improvements, developing new methods of analysis & testing; research for increased efficiency in use of resources, such as, capital equipment, materials & energy; pollution control, effluent treatment & recycling of waste products or any other areas of research.
• It may be noted that market research, work & methods study, operations & management research, testing & analysis of routine nature for operation, process control, quality control and maintenance of day to day production, maintenance of plant are not considered as R&D activities.
• The company must spell out a long-term R&D policy which should be displayed prominently in the in-house R&D unit(s).
• R&D activities should be separate from routine activities of the firm, such as, production and quality control. The units should have separate & identifiable infrastructure for carrying out R&D work.
• It is preferable that the in-house R&D unit(s) be located outside the factory premises, or it may be located in a separate building within the factory premises or it may be located in a separate floor. In case of small companies, the R&D unit may be located in a separate room or area. The R&D activities should be clearly demarcated from the manufacturing/quality control activities.
• The R&D units should have well defined, time bound R&D programmes. The unit should maintain proper record of its R&D activities in the form of documentation.
• The units should have qualified staff exclusively engaged in R&D and should be headed by a full-time qualified & experienced R&D person who has direct access to the Chief Executive or to the Board of Directors, depending on the size of the company. The number of R&D manpower should be commensurate with the S&T manpower size of the company. The R&D units should maintain separate books of accounts for all the R&D expenditures.
• Expenditure should be booked when incurred and not allocated. The company should reflect the R&D expenditure (both capital & revenue) in the Annual Report and Statement of Accounts of the company in separate schedules. The R&D expenditure incurred should be commensurate with the financial size of the company.
Eligibility criteria • The applicant should be a company registered under the Companies Act, 1956 or 2013.
• The applicant should have regular source of income at least during the last two years to sustain the business and this needs to be elaborated in the application.
92
Annexure 10: DSIR Criteria forR&D Recognition
1 Andhra Pradesh 84.50 0.00 43.55 47.91
2 Arunachal Pradesh 118.53 184.96 126.76 139.44
3 Assam 118.60 200.92 152.72 116.66
4 Bihar 39.95 43.00 42.00 33.13
5 Chhattisgarh 98.80 134.22 102.02 111.80
6 Goa 89.25 76.84 69.64 59.54
7 Gujarat 74.60 125.20 67.00 72.67
8 Haryana 37.50 57.53 34.27 23.41
9 Himachal Pradesh 112.66 165.12 104.72 99.77
10 J&K 0.00 0.00 0.00 0.00
11 Jharkhand 65.80 60.00 0.00 0.00
12 Karnataka 114.20 185.20 127.00 138.91
13 Kerala 102.10 94.00 188.00 191.69
14 Madhya Pradesh 140.05 208.55 150.35 165.39
15 Maharashtra 26.40 94.80 37.80 1.00
16 Manipur 99.45 145.94 114.14 106.21
17 Meghalaya 22.22 53.80 32.72 10.15
18 Mizoram 72.40 115.20 83.00 91.30
19 Nagaland 63.60 136.20 78.00 85.79
20 Odisha 0.00 0.00 0.00 0.00
21 Punjab 170.85 233.76 150.56 194.22
22 Rajasthan 167.25 156.00 156.00 55.90
23 Sikkim 98.97 135.80 86.46 47.69
24 Tamilnadu 81.70 136.88 104.72 115.19
25 Telangana 39.21 132.20 31.45 21.18
26 Tripura 55.90 63.00 62.00 67.20
27 Uttar Pradesh## 158.20 150.20 0.00 105.14
28 Uttarakhand 114.20 147.80 95.00 104.50
29 West Bengal 0.00 90.20 32.00 0.00
30 Andaman & Nicobar Islands 0.00 55.40 20.20 1.00
31 Chandigarh 0.00 0.00 0.00 0.00
32 Dadra and Nagar Haveli 0.00 0.00 0.00 0.00
33 Daman and Diu 0.00 0.00 0.00 0.00
34 Delhi 0.00 0.00 0.00 0.00
35 Lakshadweep 0.00 0.00 0.00 0.00
36 Puducherry 0.00 52.20 11.50 8.86
Total 2366.89 3434.92 2303.58 2215.65
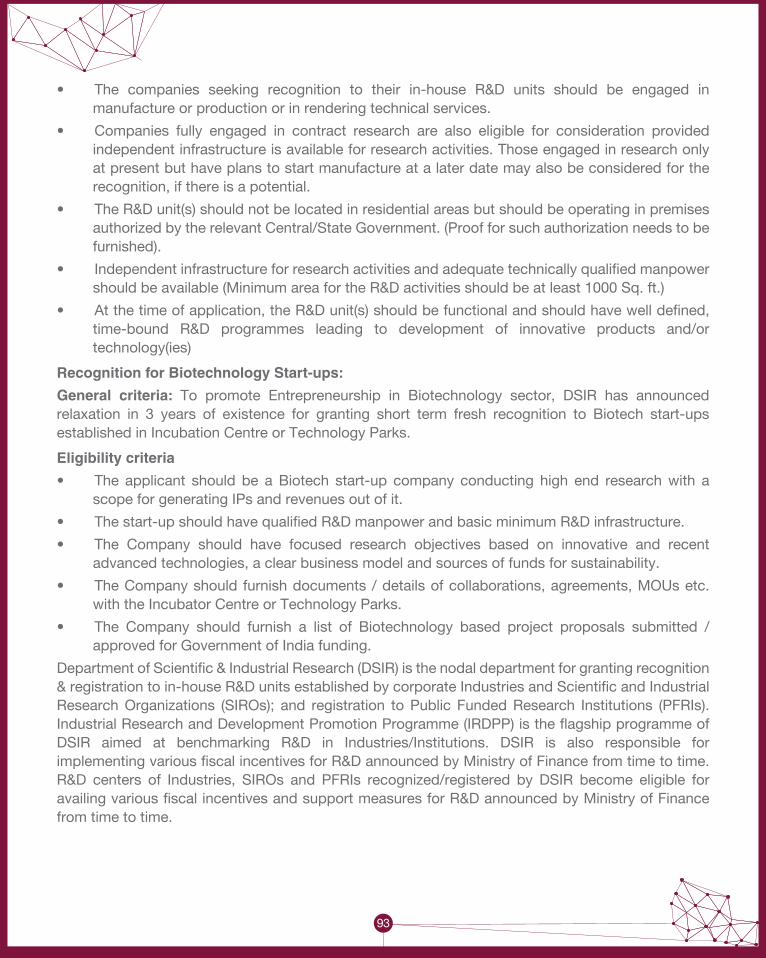
93
1 Andhra Pradesh 84.50 0.00 43.55 47.91
2 Arunachal Pradesh 118.53 184.96 126.76 139.44
3 Assam 118.60 200.92 152.72 116.66
4 Bihar 39.95 43.00 42.00 33.13
5 Chhattisgarh 98.80 134.22 102.02 111.80
6 Goa 89.25 76.84 69.64 59.54
7 Gujarat 74.60 125.20 67.00 72.67
8 Haryana 37.50 57.53 34.27 23.41
9 Himachal Pradesh 112.66 165.12 104.72 99.77
10 J&K 0.00 0.00 0.00 0.00
11 Jharkhand 65.80 60.00 0.00 0.00
12 Karnataka 114.20 185.20 127.00 138.91
13 Kerala 102.10 94.00 188.00 191.69
14 Madhya Pradesh 140.05 208.55 150.35 165.39
15 Maharashtra 26.40 94.80 37.80 1.00
16 Manipur 99.45 145.94 114.14 106.21
17 Meghalaya 22.22 53.80 32.72 10.15
18 Mizoram 72.40 115.20 83.00 91.30
19 Nagaland 63.60 136.20 78.00 85.79
20 Odisha 0.00 0.00 0.00 0.00
21 Punjab 170.85 233.76 150.56 194.22
22 Rajasthan 167.25 156.00 156.00 55.90
23 Sikkim 98.97 135.80 86.46 47.69
24 Tamilnadu 81.70 136.88 104.72 115.19
25 Telangana 39.21 132.20 31.45 21.18
26 Tripura 55.90 63.00 62.00 67.20
• The companies seeking recognition to their in-house R&D units should be engaged in manufacture or production or in rendering technical services.
• Companies fully engaged in contract research are also eligible for consideration provided independent infrastructure is available for research activities. Those engaged in research only at present but have plans to start manufacture at a later date may also be considered for the recognition, if there is a potential.
• The R&D unit(s) should not be located in residential areas but should be operating in premises authorized by the relevant Central/State Government. (Proof for such authorization needs to be furnished).
• Independent infrastructure for research activities and adequate technically qualified manpower should be available (Minimum area for the R&D activities should be at least 1000 Sq. ft.)
• At the time of application, the R&D unit(s) should be functional and should have well defined, time-bound R&D programmes leading to development of innovative products and/or technology(ies)
Recognition for Biotechnology Start-ups:
General criteria: To promote Entrepreneurship in Biotechnology sector, DSIR has announced relaxation in 3 years of existence for granting short term fresh recognition to Biotech start-ups established in Incubation Centre or Technology Parks.
Eligibility criteria
• The applicant should be a Biotech start-up company conducting high end research with a scope for generating IPs and revenues out of it.
• The start-up should have qualified R&D manpower and basic minimum R&D infrastructure.
• The Company should have focused research objectives based on innovative and recent advanced technologies, a clear business model and sources of funds for sustainability.
• The Company should furnish documents / details of collaborations, agreements, MOUs etc. with the Incubator Centre or Technology Parks.
• The Company should furnish a list of Biotechnology based project proposals submitted / approved for Government of India funding.
Department of Scientific & Industrial Research (DSIR) is the nodal department for granting recognition & registration to in-house R&D units established by corporate Industries and Scientific and Industrial Research Organizations (SIROs); and registration to Public Funded Research Institutions (PFRIs). Industrial Research and Development Promotion Programme (IRDPP) is the flagship programme of DSIR aimed at benchmarking R&D in Industries/Institutions. DSIR is also responsible for implementing various fiscal incentives for R&D announced by Ministry of Finance from time to time. R&D centers of Industries, SIROs and PFRIs recognized/registered by DSIR become eligible for availing various fiscal incentives and support measures for R&D announced by Ministry of Finance from time to time.
27 Uttar Pradesh## 158.20 150.20 0.00 105.14
28 Uttarakhand 114.20 147.80 95.00 104.50
29 West Bengal 0.00 90.20 32.00 0.00
30 Andaman & Nicobar Islands 0.00 55.40 20.20 1.00
31 Chandigarh 0.00 0.00 0.00 0.00
32 Dadra and Nagar Haveli 0.00 0.00 0.00 0.00
33 Daman and Diu 0.00 0.00 0.00 0.00
34 Delhi 0.00 0.00 0.00 0.00
35 Lakshadweep 0.00 0.00 0.00 0.00
36 Puducherry 0.00 52.20 11.50 8.86
Total 2366.89 3434.92 2303.58 2215.65
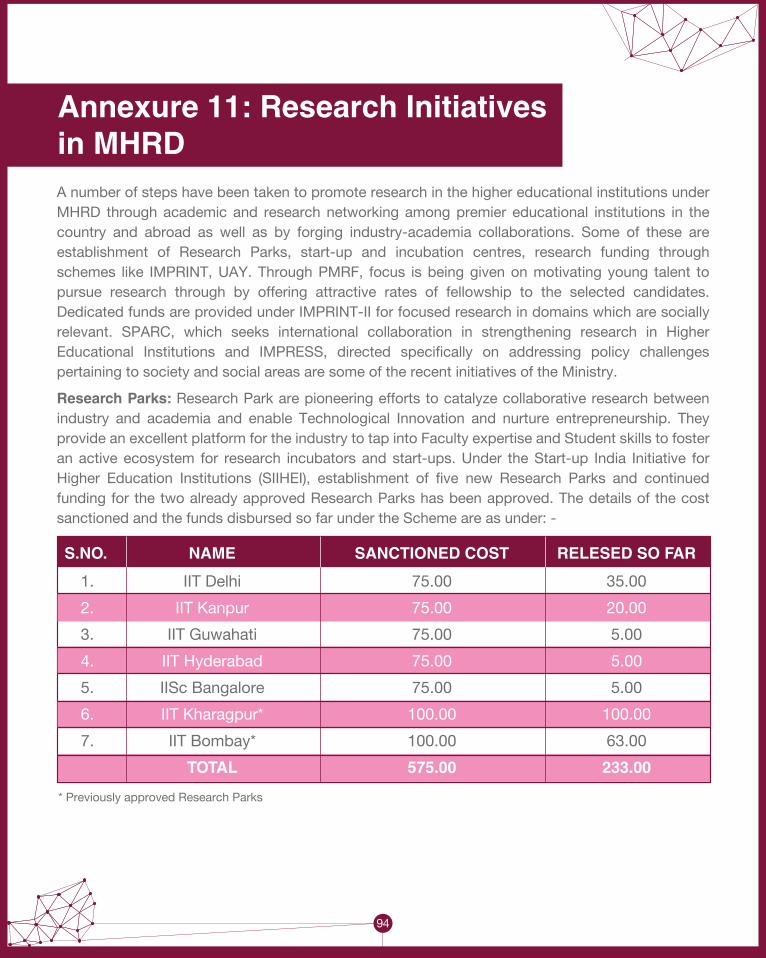
1 Andhra Pradesh 84.50 0.00 43.55 47.91
2 Arunachal Pradesh 118.53 184.96 126.76 139.44
3 Assam 118.60 200.92 152.72 116.66
4 Bihar 39.95 43.00 42.00 33.13
5 Chhattisgarh 98.80 134.22 102.02 111.80
6 Goa 89.25 76.84 69.64 59.54
7 Gujarat 74.60 125.20 67.00 72.67
8 Haryana 37.50 57.53 34.27 23.41
9 Himachal Pradesh 112.66 165.12 104.72 99.77
10 J&K 0.00 0.00 0.00 0.00
11 Jharkhand 65.80 60.00 0.00 0.00
12 Karnataka 114.20 185.20 127.00 138.91
13 Kerala 102.10 94.00 188.00 191.69
14 Madhya Pradesh 140.05 208.55 150.35 165.39
15 Maharashtra 26.40 94.80 37.80 1.00
16 Manipur 99.45 145.94 114.14 106.21
17 Meghalaya 22.22 53.80 32.72 10.15
18 Mizoram 72.40 115.20 83.00 91.30
19 Nagaland 63.60 136.20 78.00 85.79
20 Odisha 0.00 0.00 0.00 0.00
21 Punjab 170.85 233.76 150.56 194.22
22 Rajasthan 167.25 156.00 156.00 55.90
23 Sikkim 98.97 135.80 86.46 47.69
24 Tamilnadu 81.70 136.88 104.72 115.19
25 Telangana 39.21 132.20 31.45 21.18
26 Tripura 55.90 63.00 62.00 67.20
A number of steps have been taken to promote research in the higher educational institutions under MHRD through academic and research networking among premier educational institutions in the country and abroad as well as by forging industry-academia collaborations. Some of these are establishment of Research Parks, start-up and incubation centres, research funding through schemes like IMPRINT, UAY. Through PMRF, focus is being given on motivating young talent to pursue research through by offering attractive rates of fellowship to the selected candidates. Dedicated funds are provided under IMPRINT-II for focused research in domains which are socially relevant. SPARC, which seeks international collaboration in strengthening research in Higher Educational Institutions and IMPRESS, directed specifically on addressing policy challenges pertaining to society and social areas are some of the recent initiatives of the Ministry.
Research Parks: Research Park are pioneering efforts to catalyze collaborative research between industry and academia and enable Technological Innovation and nurture entrepreneurship. They provide an excellent platform for the industry to tap into Faculty expertise and Student skills to foster an active ecosystem for research incubators and start-ups. Under the Start-up India Initiative for Higher Education Institutions (SIIHEI), establishment of five new Research Parks and continued funding for the two already approved Research Parks has been approved. The details of the cost sanctioned and the funds disbursed so far under the Scheme are as under: -
Annexure 11: Research Initiativesin MHRD
S.NO. NAME SANCTIONED COST RELESED SO FAR
1. IIT Delhi 75.00 35.00
2. IIT Kanpur 75.00 20.00
3. IIT Guwahati 75.00 5.00
4. IIT Hyderabad 75.00 5.00
5. IISc Bangalore 75.00 5.00
6. IIT Kharagpur* 100.00 100.00
7. IIT Bombay* 100.00 63.00
TOTAL 575.00 233.00
* Previously approved Research Parks
94
27 Uttar Pradesh## 158.20 150.20 0.00 105.14
28 Uttarakhand 114.20 147.80 95.00 104.50
29 West Bengal 0.00 90.20 32.00 0.00
30 Andaman & Nicobar Islands 0.00 55.40 20.20 1.00
31 Chandigarh 0.00 0.00 0.00 0.00
32 Dadra and Nagar Haveli 0.00 0.00 0.00 0.00
33 Daman and Diu 0.00 0.00 0.00 0.00
34 Delhi 0.00 0.00 0.00 0.00
35 Lakshadweep 0.00 0.00 0.00 0.00
36 Puducherry 0.00 52.20 11.50 8.86
Total 2366.89 3434.92 2303.58 2215.65

1 Andhra Pradesh 84.50 0.00 43.55 47.91
2 Arunachal Pradesh 118.53 184.96 126.76 139.44
3 Assam 118.60 200.92 152.72 116.66
4 Bihar 39.95 43.00 42.00 33.13
5 Chhattisgarh 98.80 134.22 102.02 111.80
6 Goa 89.25 76.84 69.64 59.54
7 Gujarat 74.60 125.20 67.00 72.67
8 Haryana 37.50 57.53 34.27 23.41
9 Himachal Pradesh 112.66 165.12 104.72 99.77
10 J&K 0.00 0.00 0.00 0.00
11 Jharkhand 65.80 60.00 0.00 0.00
12 Karnataka 114.20 185.20 127.00 138.91
13 Kerala 102.10 94.00 188.00 191.69
14 Madhya Pradesh 140.05 208.55 150.35 165.39
15 Maharashtra 26.40 94.80 37.80 1.00
16 Manipur 99.45 145.94 114.14 106.21
17 Meghalaya 22.22 53.80 32.72 10.15
18 Mizoram 72.40 115.20 83.00 91.30
19 Nagaland 63.60 136.20 78.00 85.79
20 Odisha 0.00 0.00 0.00 0.00
21 Punjab 170.85 233.76 150.56 194.22
22 Rajasthan 167.25 156.00 156.00 55.90
23 Sikkim 98.97 135.80 86.46 47.69
24 Tamilnadu 81.70 136.88 104.72 115.19
25 Telangana 39.21 132.20 31.45 21.18
26 Tripura 55.90 63.00 62.00 67.20
95
Ucchatar Avishkar Yojana (UAY): UAY was launched in October, 2015 with a view to promoting innovation of a higher order that directly impacts the needs of the Industry and thereby improves the competitive edge of Indian manufacturing. The details of projects, cost and releases are as under: -
S.No. Name Projects Sanctioned Funds Released Sanctioned Cost (In crore)
1. UAY-I 84 253.81 177.47
2. UAY-II 64 135.05 43.28
TOTAL 148 388.86 220.75
IMPRINT-I: Impacting Research Innovation & Technology (IMPRINT) Initiative was launched in November, 2015 to provide solutions to the most relevant engineering challenges and translating knowledge into viable technology (products or processes) in 10 selected technology domains.
IMPRINT-II: has been recommended by the EFC in its meeting held on 21.02.2018 and approved by the Hon’ble Finance Minister and Hon’ble Minister of Human Resource Development with a slightly modified approach in funding. The Scheme will be funded through a corpus of Rs.670 crore created jointly by MHRD and DST (Rs.335 crore each) whereas the contribution received from other participating Ministries will be utilized to meet the additionality or to take up more projects. The details of projects, cost and releases are as under: -
Prime Minister’s Research Fellows (PMRF): PMRF Scheme has been approved by the Government with a view to attracting bright and meritorious students into research. The Scheme seeks to admit most meritorious students from any recognized Institute/University in India, as per eligibility conditions prescribed in the PMRF Guidelines, into the Ph.D programmes in IITs, IISc and IISERs with an attractive monthly fellowship of Rs.70,000/- for the first two years, Rs.75,000/- for the 3rd year, and Rs.80,000/- in the 4th and 5th years along with a yearly research grant of Rs.2.00 lakh per year for a period of 5 years to each fellow to meet the cost of presenting research papers. 176 fellows have been admitted under the Scheme so far.
S.No. Name Projects Sanctioned Funds Released Sanctioned Cost (In crore)
1. IMPRINT-I 142 313.30 194.30
2. IMPRINT-II 126 112.00 52.00
27 Uttar Pradesh## 158.20 150.20 0.00 105.14
28 Uttarakhand 114.20 147.80 95.00 104.50
29 West Bengal 0.00 90.20 32.00 0.00
30 Andaman & Nicobar Islands 0.00 55.40 20.20 1.00
31 Chandigarh 0.00 0.00 0.00 0.00
32 Dadra and Nagar Haveli 0.00 0.00 0.00 0.00
33 Daman and Diu 0.00 0.00 0.00 0.00
34 Delhi 0.00 0.00 0.00 0.00
35 Lakshadweep 0.00 0.00 0.00 0.00
36 Puducherry 0.00 52.20 11.50 8.86
Total 2366.89 3434.92 2303.58 2215.65

1 Andhra Pradesh 84.50 0.00 43.55 47.91
2 Arunachal Pradesh 118.53 184.96 126.76 139.44
3 Assam 118.60 200.92 152.72 116.66
4 Bihar 39.95 43.00 42.00 33.13
5 Chhattisgarh 98.80 134.22 102.02 111.80
6 Goa 89.25 76.84 69.64 59.54
7 Gujarat 74.60 125.20 67.00 72.67
8 Haryana 37.50 57.53 34.27 23.41
9 Himachal Pradesh 112.66 165.12 104.72 99.77
10 J&K 0.00 0.00 0.00 0.00
11 Jharkhand 65.80 60.00 0.00 0.00
12 Karnataka 114.20 185.20 127.00 138.91
13 Kerala 102.10 94.00 188.00 191.69
14 Madhya Pradesh 140.05 208.55 150.35 165.39
15 Maharashtra 26.40 94.80 37.80 1.00
16 Manipur 99.45 145.94 114.14 106.21
17 Meghalaya 22.22 53.80 32.72 10.15
18 Mizoram 72.40 115.20 83.00 91.30
19 Nagaland 63.60 136.20 78.00 85.79
20 Odisha 0.00 0.00 0.00 0.00
21 Punjab 170.85 233.76 150.56 194.22
22 Rajasthan 167.25 156.00 156.00 55.90
23 Sikkim 98.97 135.80 86.46 47.69
24 Tamilnadu 81.70 136.88 104.72 115.19
25 Telangana 39.21 132.20 31.45 21.18
26 Tripura 55.90 63.00 62.00 67.20
27 Uttar Pradesh## 158.20 150.20 0.00 105.14
28 Uttarakhand 114.20 147.80 95.00 104.50
29 West Bengal 0.00 90.20 32.00 0.00
30 Andaman & Nicobar Islands 0.00 55.40 20.20 1.00
31 Chandigarh 0.00 0.00 0.00 0.00
32 Dadra and Nagar Haveli 0.00 0.00 0.00 0.00
33 Daman and Diu 0.00 0.00 0.00 0.00
34 Delhi 0.00 0.00 0.00 0.00
35 Lakshadweep 0.00 0.00 0.00 0.00
36 Puducherry 0.00 52.20 11.50 8.86
Total 2366.89 3434.92 2303.58 2215.65