raman spectra database of the glass beads excavated - hal
TRANSCRIPT
HAL Id: hal-00543867https://hal.archives-ouvertes.fr/hal-00543867
Submitted on 7 Dec 2010
HAL is a multi-disciplinary open accessarchive for the deposit and dissemination of sci-entific research documents, whether they are pub-lished or not. The documents may come fromteaching and research institutions in France orabroad, or from public or private research centers.
L’archive ouverte pluridisciplinaire HAL, estdestinée au dépôt et à la diffusion de documentsscientifiques de niveau recherche, publiés ou non,émanant des établissements d’enseignement et derecherche français ou étrangers, des laboratoirespublics ou privés.
Raman spectra database of the glass beads excavated onmapungubwe hill and k2, two archaeological sites in
South AfricaAurélie Tournié, Linda C Prinsloo, Philippe Colomban
To cite this version:Aurélie Tournié, Linda C Prinsloo, Philippe Colomban. Raman spectra database of the glass beadsexcavated on mapungubwe hill and k2, two archaeological sites in South Africa. 2010. <hal-00543867>
1
RAMAN SPECTRA DATABASE OF THE GLASS BEADS
EXCAVATED ON MAPUNGUBWE HILL AND K2,
TWO ARCHAEOLOGICAL SITES IN SOUTH AFRICA
Aurélie Tournié Linda C. Prinsloo
Philippe Colomban
About two hundred coloured glass beads (red, yellow, green, blue, white, black, pink, plum) were selected among the thousands of beads excavated on Mapungubwe hill and at K2, archaeological sites in the Limpopo valley South Africa, and have been studied with Raman scattering. The glass matrix of the beads was classified according to its Raman signature into 3 main sub-groups and corroded glass could also be identified. At least seven different chromophores or pigments (lazurite, lead tin yellow type II, Ca/Pb arsenate, chromate, calcium antimonate, Fe-S “amber” and a spinel) have been identified. Many of the pigments were only manufactured after the 13th century that confirms the presence of modern beads in the archaeological record. This calls for further research to find a way to reconcile the carbon dating of the hill, which currently gives the last occupation date on the hill as 1280 AD with the physical evidence of the modern beads excavated on the hill.
2009-2010

2
3
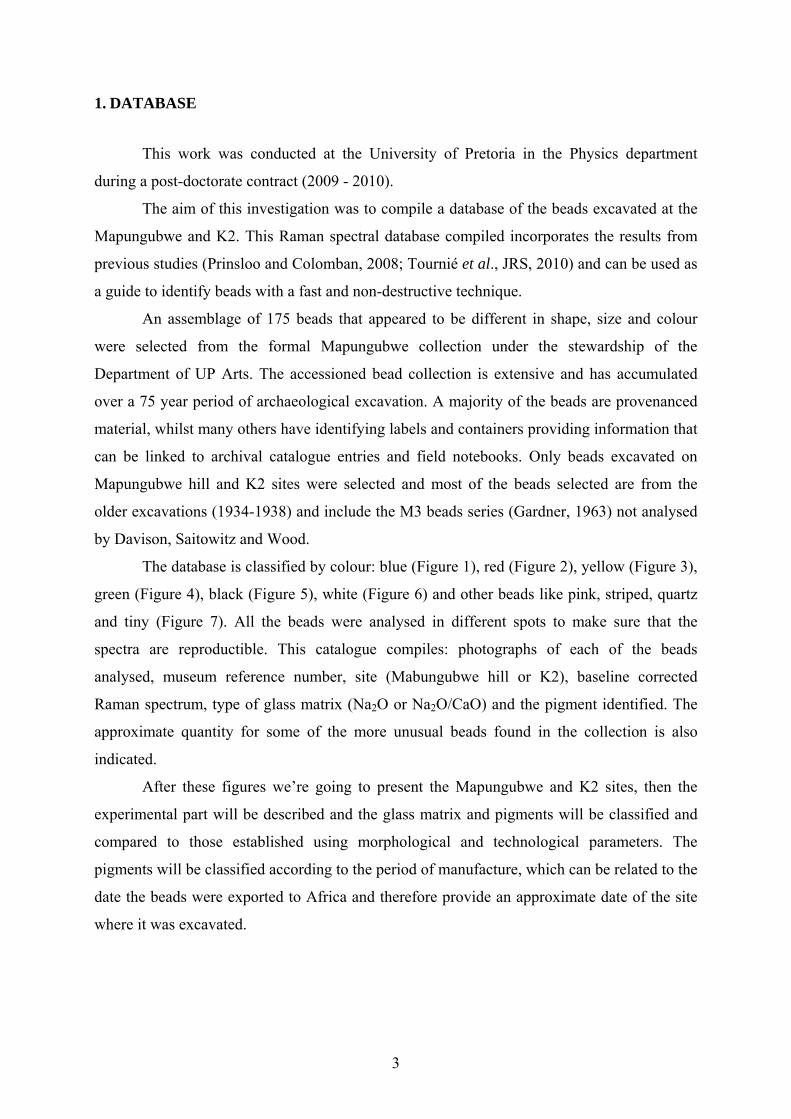
1. DATABASE
This work was conducted at the University of Pretoria in the Physics department
during a post-doctorate contract (2009 - 2010).
The aim of this investigation was to compile a database of the beads excavated at the
Mapungubwe and K2. This Raman spectral database compiled incorporates the results from
previous studies (Prinsloo and Colomban, 2008; Tournié et al., JRS, 2010) and can be used as
a guide to identify beads with a fast and non-destructive technique.
An assemblage of 175 beads that appeared to be different in shape, size and colour
were selected from the formal Mapungubwe collection under the stewardship of the
Department of UP Arts. The accessioned bead collection is extensive and has accumulated
over a 75 year period of archaeological excavation. A majority of the beads are provenanced
material, whilst many others have identifying labels and containers providing information that
can be linked to archival catalogue entries and field notebooks. Only beads excavated on
Mapungubwe hill and K2 sites were selected and most of the beads selected are from the
older excavations (1934-1938) and include the M3 beads series (Gardner, 1963) not analysed
by Davison, Saitowitz and Wood.
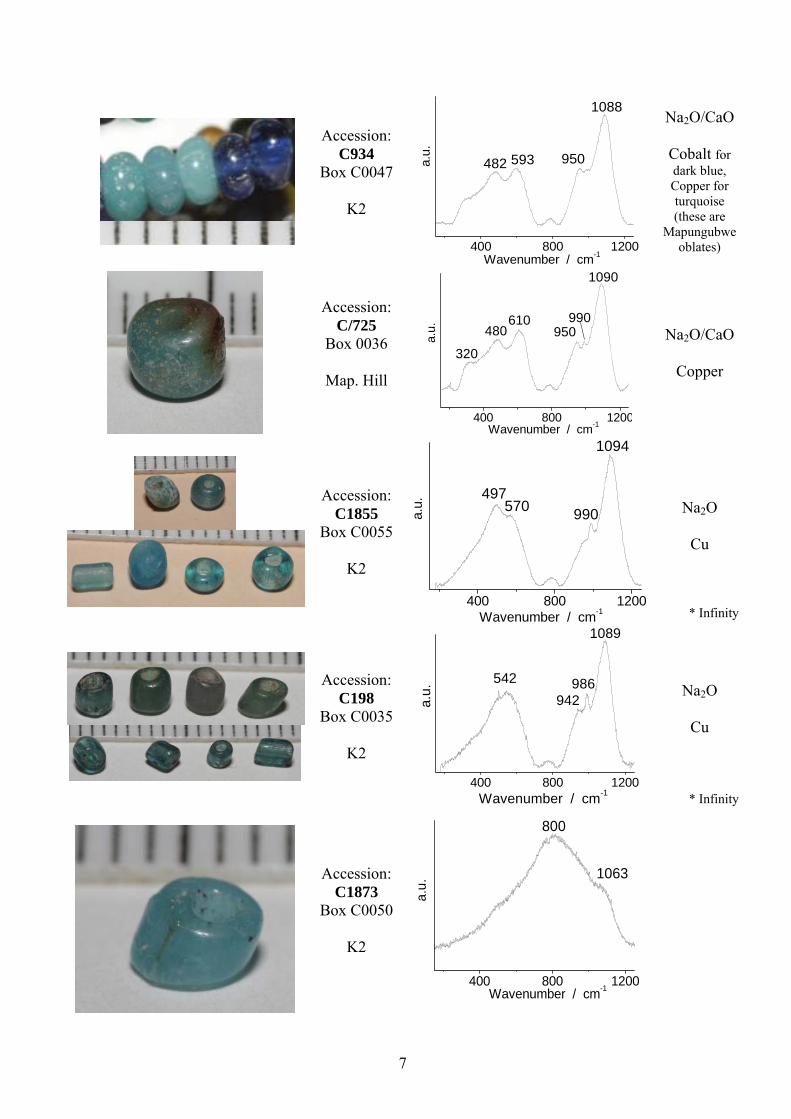
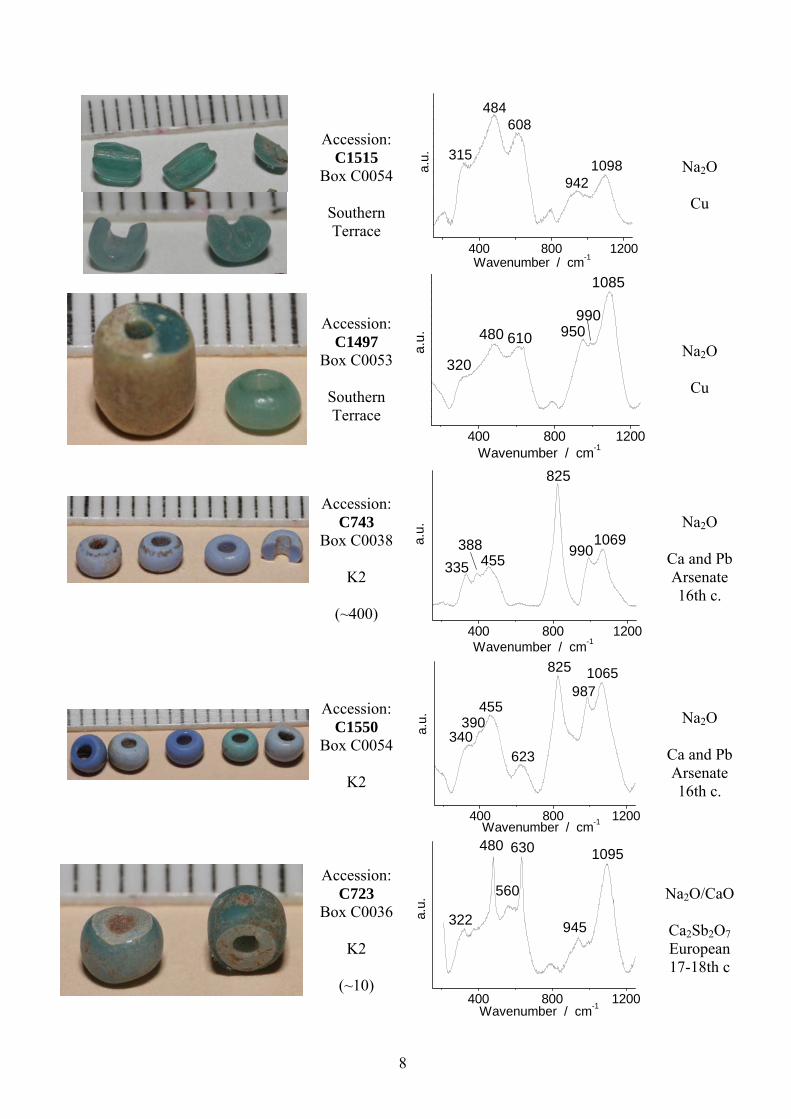
The database is classified by colour: blue (Figure 1), red (Figure 2), yellow (Figure 3),
green (Figure 4), black (Figure 5), white (Figure 6) and other beads like pink, striped, quartz
and tiny (Figure 7). All the beads were analysed in different spots to make sure that the
spectra are reproductible. This catalogue compiles: photographs of each of the beads
analysed, museum reference number, site (Mabungubwe hill or K2), baseline corrected
Raman spectrum, type of glass matrix (Na2O or Na2O/CaO) and the pigment identified. The
approximate quantity for some of the more unusual beads found in the collection is also
indicated.
After these figures we’re going to present the Mapungubwe and K2 sites, then the
experimental part will be described and the glass matrix and pigments will be classified and
compared to those established using morphological and technological parameters. The
pigments will be classified according to the period of manufacture, which can be related to the
date the beads were exported to Africa and therefore provide an approximate date of the site
where it was excavated.

4

5
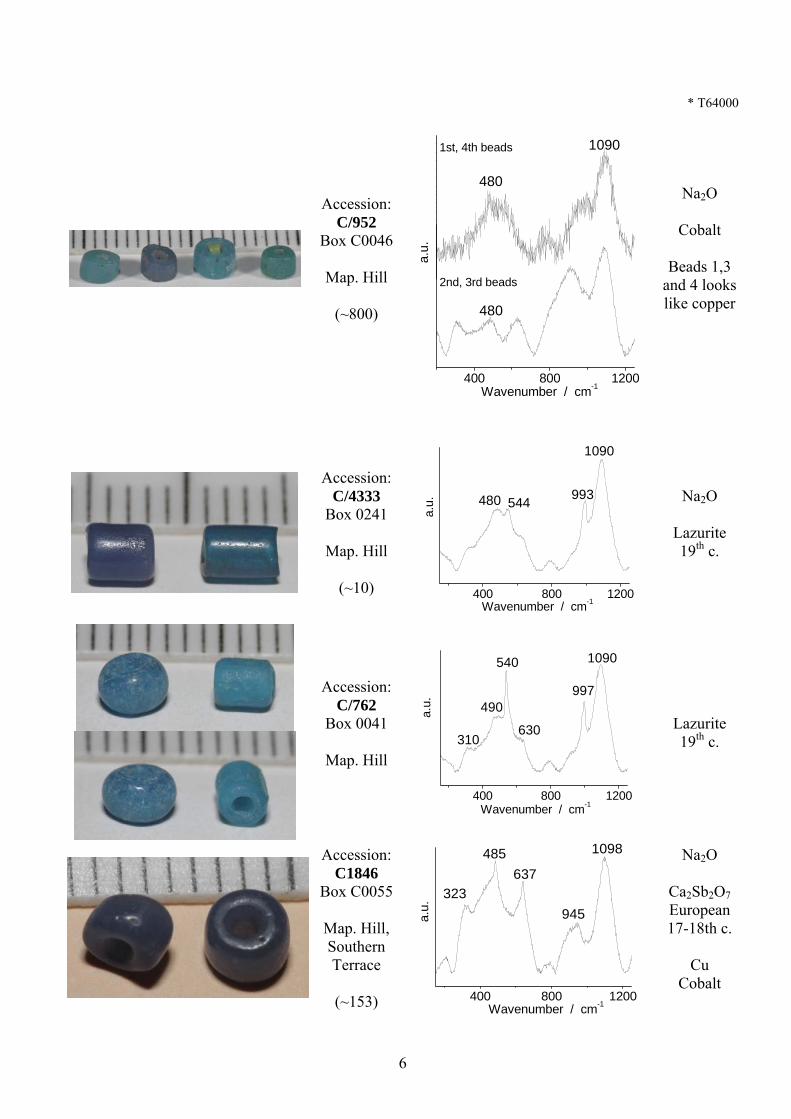
Figure 1: BLUE BEADS
BEADS (scale= 1mm)
REF. MUSEUM (quantity)
RAMAN SPECTRA (after baseline subtraction,
a.u. = arbitrary unit)
GLASS MATRIX
PIGMENT
Accession:
C/4354 Box C0241
Map. Hill
(~30)
400 800 1200
720480
607945
993
a.u
Wavenumber / cm-1
1087
bb1_4354
Na2O/CaO
Copper
Accession: C/952
Box C0046
Map. Hill
(~100) 400 800 1200
a.u.
570
1097
Wavenumber / cm-1
C952blue2nd
Na2O/CaO
Cobalt
* T64000
Accession: C/740
Box C0038
Map. Hill
(~300-400) 400 800 1200
635302488
533
986
a.u.
Wavenumber / cm-1
1092
Lazurite 19th c.
6
Accession: C/952
Box C0046
Map. Hill
(~800)
400 800 1200
1090
a.u.
Wavenumber / cm-1
480
480
1st, 4th beads
2nd, 3rd beads
* T64000
Na2O
Cobalt
Beads 1,3 and 4 looks like copper
Accession: C/4333
Box 0241
Map. Hill
(~10) 400 800 1200
480 544
1090
a.u.
Wavenumber / cm-1
993
Na2O
Lazurite 19th c.
Accession: C/762
Box 0041
Map. Hill
400 800 1200
310630
490
540
997
a.u.
Wavenumber / cm-1
1090
Lazurite 19th c.
Accession: C1846
Box C0055
Map. Hill, Southern Terrace
(~153) 400 800 1200
323
485637
945a.u.
Wavenumber / cm-1
1098
Na2O
Ca2Sb2O7 European 17-18th c.
Cu
Cobalt
7
Accession: C934
Box C0047
K2
400 800 1200
482
1088
950a.u.
Wavenumber / cm-1
593
Na2O/CaO
Cobalt for dark blue, Copper for turquoise (these are
Mapungubwe oblates)
Accession: C/725
Box 0036
Map. Hill
400 800 1200
320
480610 990
950a.u.
Wavenumber / cm-1
1090
Na2O/CaO
Copper
Accession:
C1855 Box C0055
K2
400 800 1200
1094
990570497
a.u.
Wavenumber / cm-1
Na2O
Cu
* Infinity
Accession: C198
Box C0035
K2
400 800 1200
1089
986942
542
a.u.
Wavenumber / cm-1
Na2O
Cu
* Infinity
Accession: C1873
Box C0050
K2
400 800 1200
1063
a.u.
Wavenumber / cm-1
800
8
Accession: C1515
Box C0054
Southern Terrace
400 800 1200
315
484608
1098a.u.
Wavenumber / cm-1
942
Na2O
Cu
Accession: C1497
Box C0053
Southern Terrace
400 800 1200
320
480 610 950
1085
a.u.
Wavenumber / cm-1
990
Na2O
Cu
Accession: C743
Box C0038
K2
(~400) 400 800 1200
335388
4551069
990
a.u.
Wavenumber / cm-1
825
Na2O
Ca and Pb Arsenate 16th c.
Accession: C1550
Box C0054
K2
400 800 1200
390340
623
455
1065987
a.u.
Wavenumber / cm-1
825
Na2O
Ca and Pb Arsenate 16th c.
Accession: C723
Box C0036
K2
(~10) 400 800 1200
322
560
480 630
945
a.u.
Wavenumber / cm-1
1095
Na2O/CaO
Ca2Sb2O7 European 17-18th c

9
Accession:
C745 Box C0038
K2
(~250)
400 800 1200
315
480 630
940
a.u.
Wavenumber / cm-1
1100
Ca2Sb2O7 European 17-18th c.
Accession: C731
Box C0037
Map. Hill
(~50) 400 800 1200
a.u.
454624
1098995
950
844
Wavenumber / cm-1
CrO4 ions
Ca2Sb2O7 European 17-18e c.
Accession: C765
Box C0039
Map. Hill
Garden roller
400 800 1200
953 1084
988483
Dark
800
Lighta.u.
Wavenumber / cm-1
Accession:
C/335 Box 0035
Map. Hill
400 800 1200
1090990
490
a.u.
Wavenumber / cm-1
Na2O/CaO
Cu
* Infinity
10
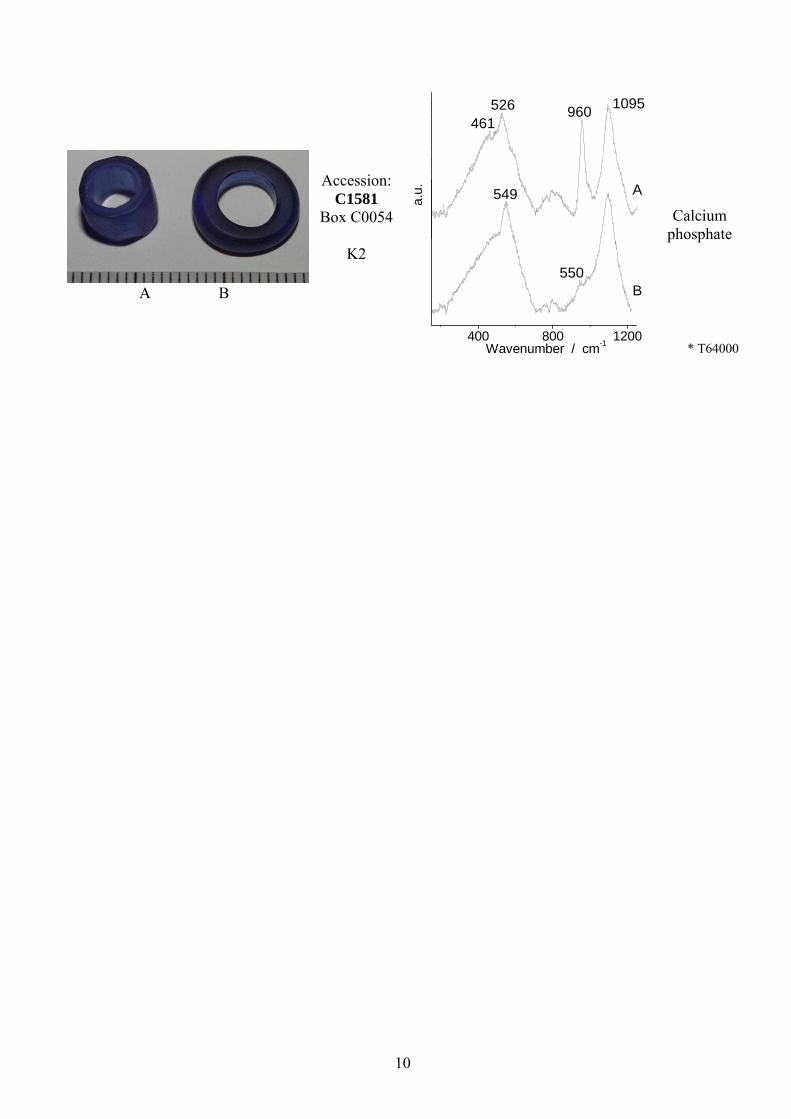
A B
Accession: C1581
Box C0054
K2
400 800 1200
549
550
4611095960
526
a.u.
B
A
Wavenumber / cm-1
Calcium phosphate
* T64000

11

12
Figure 2: RED BEADS
BEADS (scale= 1mm)
REF. MUSEUM(quantity)
RAMAN SPECTRA (after baseline subtraction,
a.u. = arbitrary unit)
GLASS MATRIX
PIGMENT
Accession: C/4354
Box C0241
Map. Hill
400 800 1200
1085
560
a.u.
Wavenumber / cm-1
990
Na2O/CaO
* T64000
Accession: C/762
Box 0041
Map. Hill
400 800 1200
1090
1082
983a.
u.
Oblate
Tube
Wavenumber / cm-1
538
573
945987
Na2O/CaO
* T64000
Accession: C1515
Box C0054
Southern Terrace
400 800 1200
476 562 980
a.u.
Wavenumber / cm-1
1081
Na2O/CaO
* T64000
Accession: C952
Box C0046
Map. Hill
400 800 1200
942989
1075
547
a.u.
Wavenumber / cm-1
493
* T64000

13
Accession: C952
Box C0045
Map. Hill
400 800 1200
493 547 953991
a.u.
Wavenumber / cm-1
1069
Na2O/CaO
* T64000
Accession: C952
Box C0046
Map. Hill
400 800 1200
315 615
9951080936
a.u.
Wavenumber / cm-1
484
Cu
Accession: C1855
Box C0055
K2
400 800 1200
1086
990
490
a.u.
Wavenumber / cm-1
Na2O
Cu
* Infinity
Accession: C1636
Box C0055
K2
400 800 1200
1086
488
495
a.u.
Wavenumber / cm-1
Na2O
Cu
* Infinity

14
Accession: C1873
Box C0050
K2
400 800 1200
1094
960
620320a.u.
Wavenumber / cm-1
480
Na2O
Cu
Accession: C952
Box C0046
(~500-600)
400 800 1200
480567 950
a.u.
Wavenumber / cm-1
1075
Na2O/CaO
Ext part
* T64000
Accession: C732
Box C0036
K2
(~50) 400 800 1200
987
820
630a.u.
Wavenumber / cm-1
450
Ca and Pb Arsenate 16th c.
White part
Red with
white base = 1836

15
16
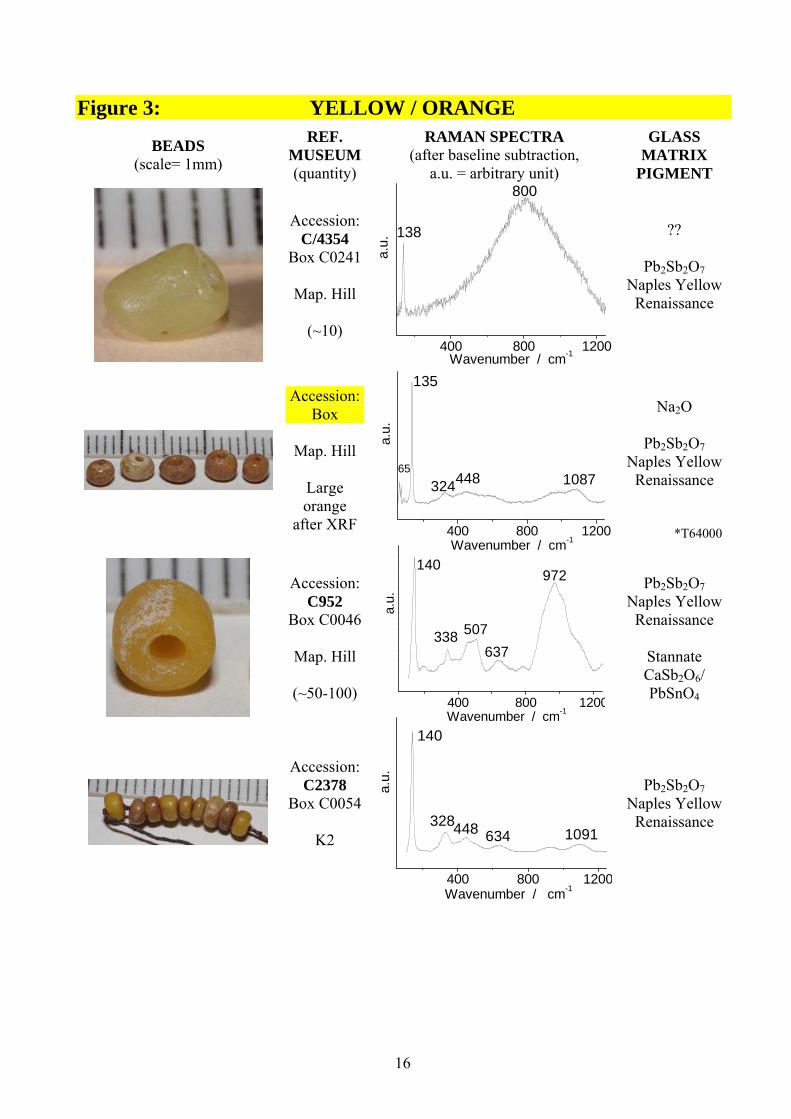
Figure 3: YELLOW / ORANGE
BEADS (scale= 1mm)
REF. MUSEUM(quantity)
RAMAN SPECTRA (after baseline subtraction,
a.u. = arbitrary unit)
GLASS MATRIX
PIGMENT
Accession: C/4354
Box C0241
Map. Hill
(~10) 400 800 1200
800
a.u.
Wavenumber / cm-1
138
??
Pb2Sb2O7 Naples Yellow
Renaissance
Accession: Box
Map. Hill
Large orange
after XRF 400 800 1200
651087448324
a.u.
Wavenumber / cm-1
135
Na2O
Pb2Sb2O7
Naples Yellow Renaissance
*T64000
Accession: C952
Box C0046
Map. Hill
(~50-100) 400 800 1200
972
637507338
a.u.
Wavenumber / cm-1
140
Pb2Sb2O7
Naples Yellow Renaissance
Stannate CaSb2O6/ PbSnO4
Accession: C2378
Box C0054
K2
400 800 1200
1091634448328
a.u.
Wavenumber / cm-1
140
Pb2Sb2O7 Naples Yellow
Renaissance
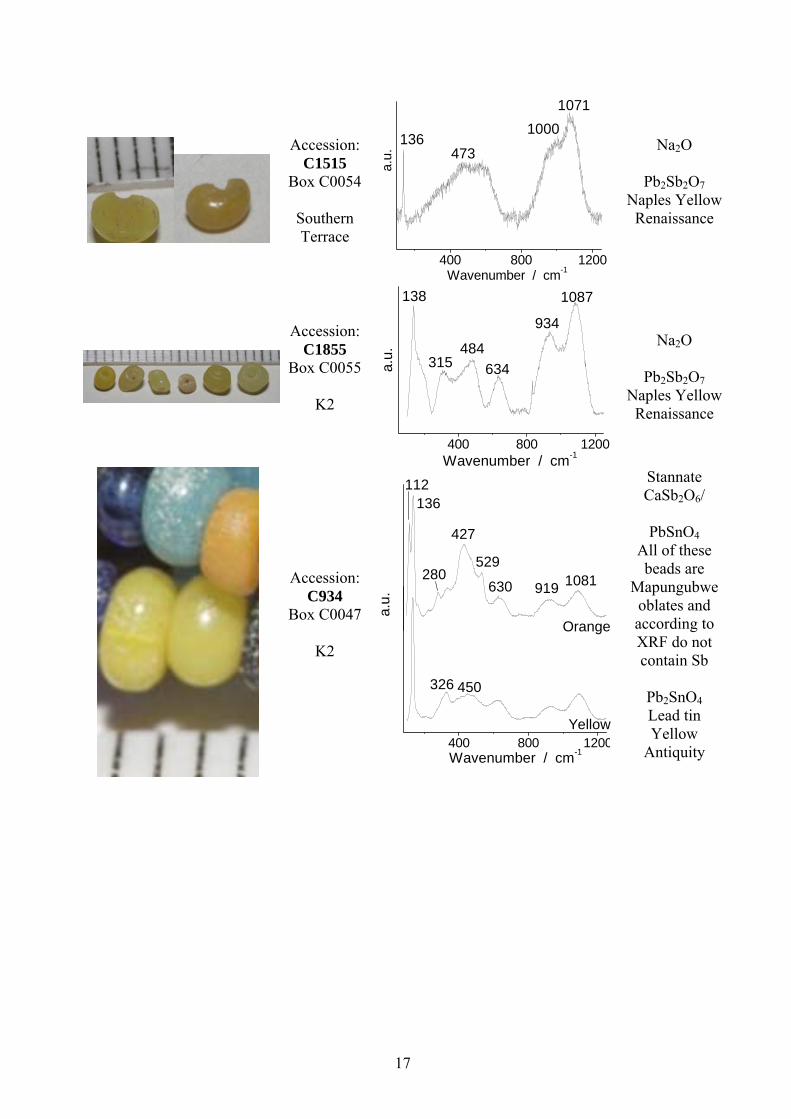
17
Accession: C1515
Box C0054
Southern Terrace
400 800 1200
1000
473
1071
a.u.
Wavenumber / cm-1
136
Na2O
Pb2Sb2O7 Naples Yellow
Renaissance
Accession: C1855
Box C0055
K2
400 800 1200
1087
634
934
484315a.
u.
Wavenumber / cm-1
138
Na2O
Pb2Sb2O7 Naples Yellow
Renaissance
Accession: C934
Box C0047
K2
400 800 1200
1081919630
529
427
280
136
Yellow
Orange
112
326 450
a.u.
Wavenumber / cm-1
Stannate CaSb2O6/
PbSnO4
All of these beads are
Mapungubwe oblates and according to XRF do not contain Sb
Pb2SnO4 Lead tin Yellow
Antiquity
18
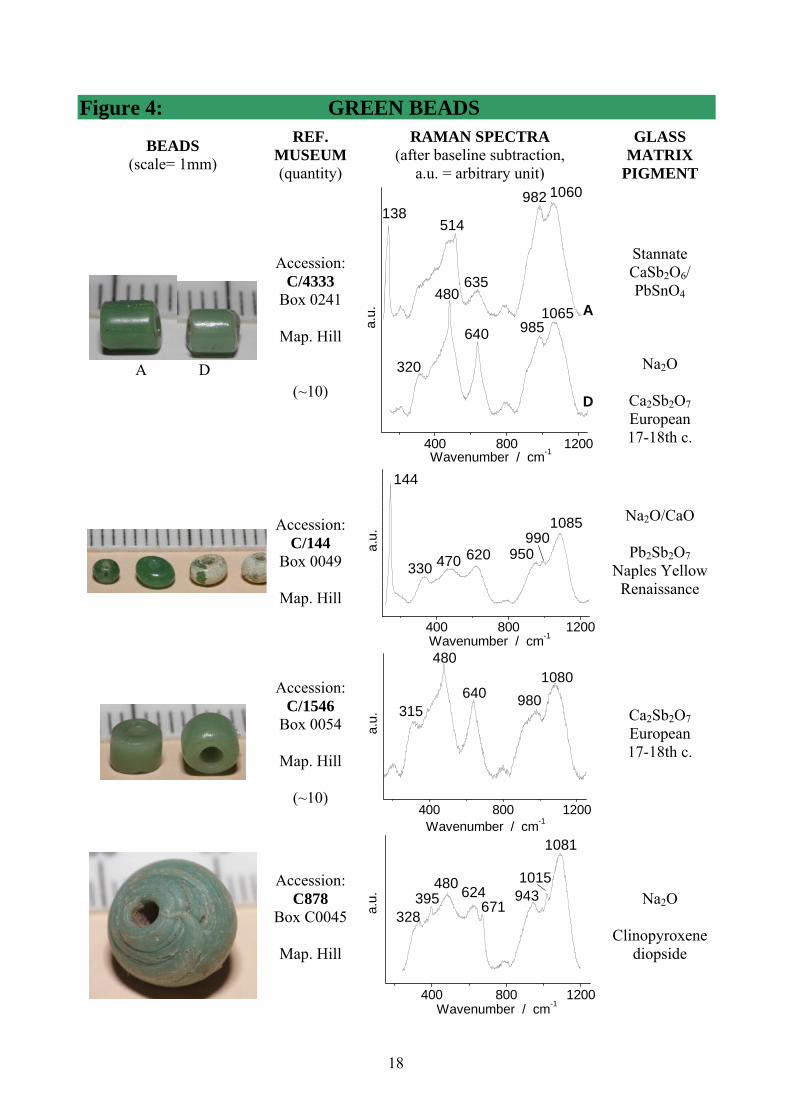
Figure 4: GREEN BEADS
BEADS (scale= 1mm)
REF. MUSEUM(quantity)
RAMAN SPECTRA (after baseline subtraction,
a.u. = arbitrary unit)
GLASS MATRIX
PIGMENT
A D
Accession: C/4333
Box 0241
Map. Hill
(~10)
400 800 1200
a.u.
480A1065
985640
320
D
Wavenumber / cm-1
1060982
635
514138
Stannate CaSb2O6/ PbSnO4
Na2O
Ca2Sb2O7 European 17-18th c.
Accession: C/144
Box 0049
Map. Hill
400 800 1200
1085990
950620470330
a.u.
Wavenumber / cm-1
144
Na2O/CaO
Pb2Sb2O7 Naples Yellow
Renaissance
Accession: C/1546
Box 0054
Map. Hill
(~10) 400 800 1200
315
480
6401080
a.u.
Wavenumber / cm-1
980
Ca2Sb2O7 European 17-18th c.
Accession: C878
Box C0045
Map. Hill
400 800 1200
328395
480 624671
9431015
a.u.
Wavenumber / cm-1
1081
Na2O
Clinopyroxene diopside
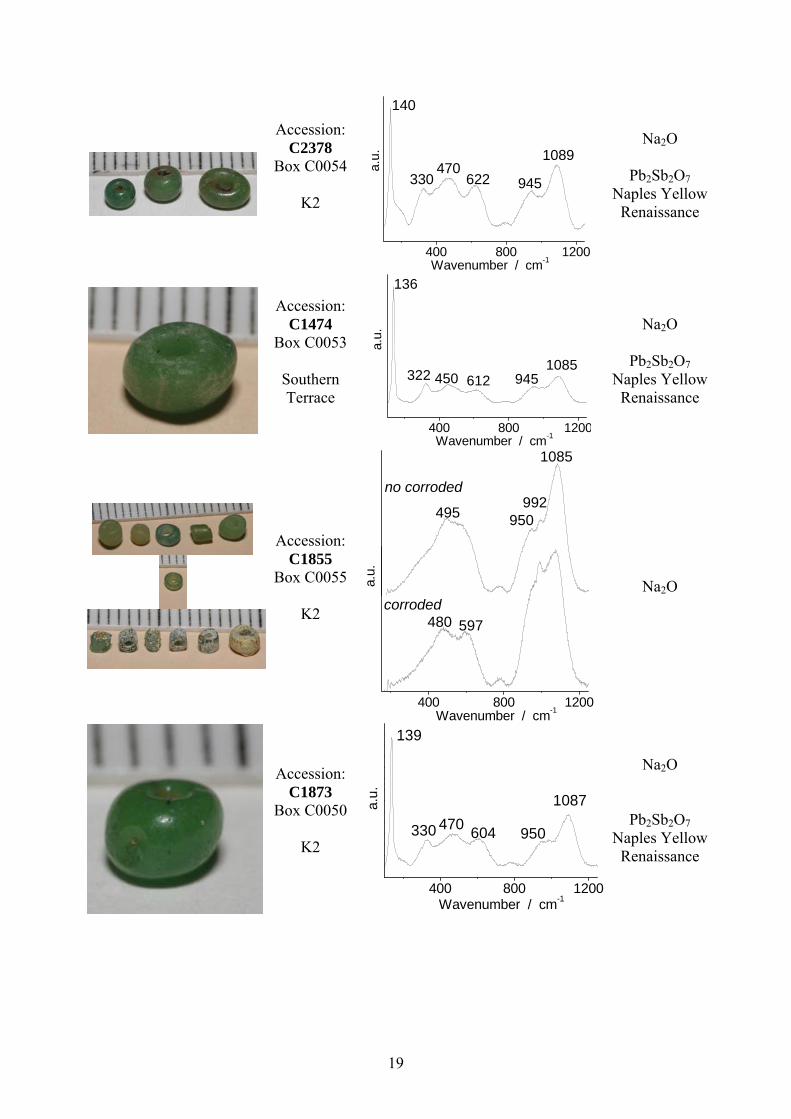
19
Accession: C2378
Box C0054
K2
400 800 1200
140
330470
622
1089
a.u.
Wavenumber / cm-1
945
Na2O
Pb2Sb2O7 Naples Yellow
Renaissance
Accession: C1474
Box C0053
Southern Terrace
400 800 1200
9451085
612450322a.
u.
Wavenumber / cm-1
136
Na2O
Pb2Sb2O7 Naples Yellow
Renaissance
Accession: C1855
Box C0055
K2
495 950992
1085
a.u.
Wavenumber / cm-1
no corroded
corroded
400 800 1200
597480
Na2O
Accession: C1873
Box C0050
K2
400 800 1200
950
1087
604470330
a.u.
Wavenumber / cm-1
139
Na2O
Pb2Sb2O7 Naples Yellow
Renaissance
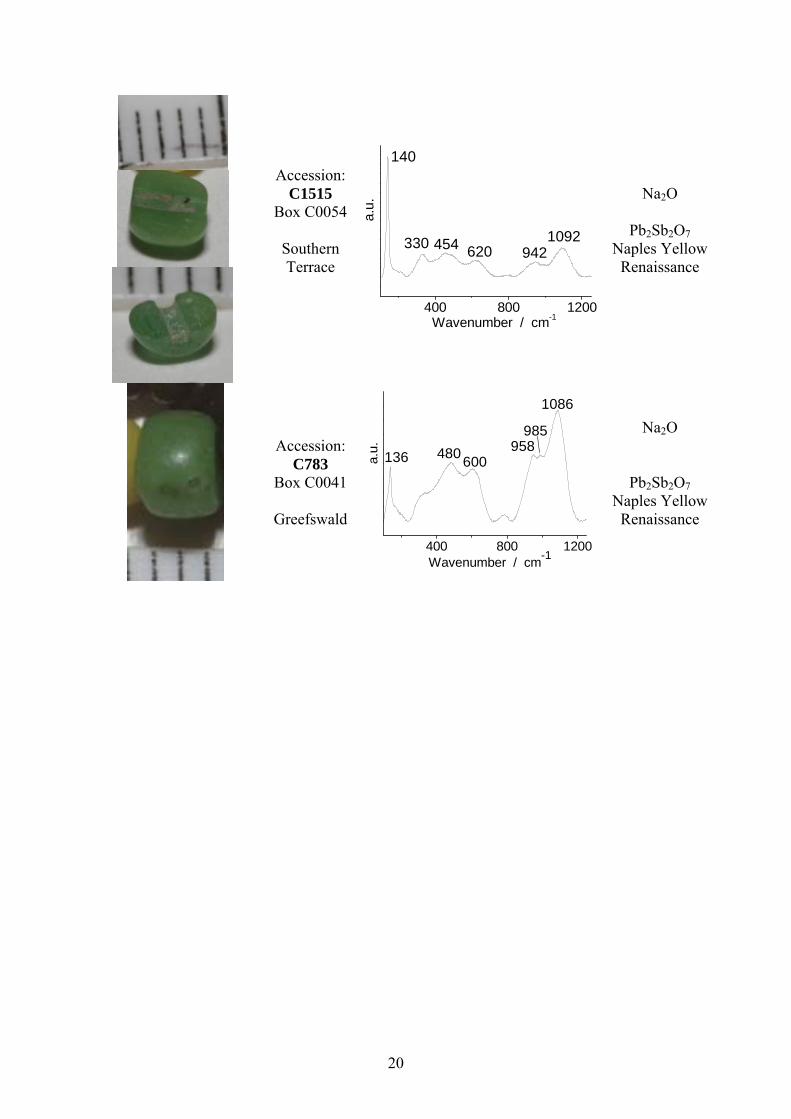
20
Accession: C1515
Box C0054
Southern Terrace
400 800 1200
140
330 454 620 942
a.u.
Wavenumber / cm-1
1092
Na2O
Pb2Sb2O7 Naples Yellow
Renaissance
Accession: C783
Box C0041
Greefswald
400 800 1200
1086
985958
600480a.u.
Wavenumber / cm-1
136
Na2O
Pb2Sb2O7 Naples Yellow
Renaissance

21

22
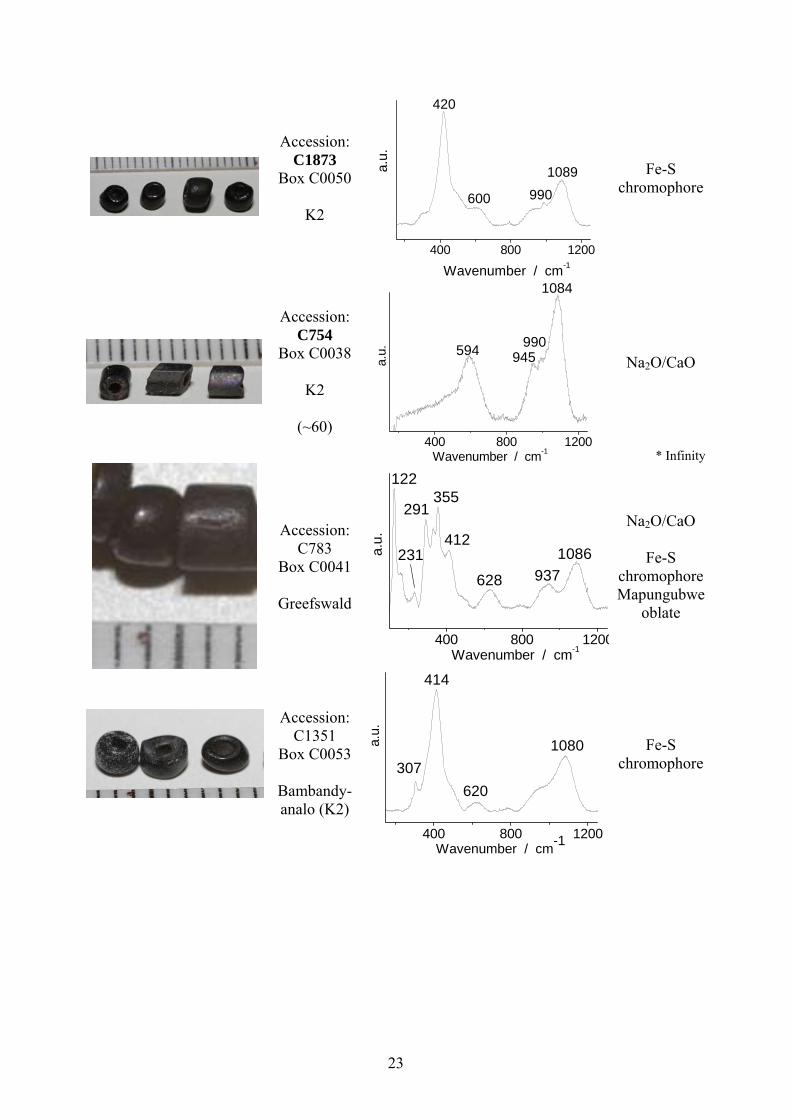
Figure 5: BLACK BEADS
BEADS (scale= 1mm)
REF. MUSEUM(quantity)
RAMAN SPECTRA (after baseline subtraction,
a.u. = arbitrary unit)
GLASS MATRIX
PIGMENT
Accession: C/762
Box 0041
Map. Hill
400 800 1200
a.u.
Wavenumber / cm-1
644
Fe3O4 spinel or Co, Cr, Zn
Accession: C2378
Box C0054
K2
400 800 1200
1094
990479
a.u.
Wavenumber / cm-1
552
Na2O/CaO
* T64000
Accession: C1515
Box C0054
Southern Terrace
400 800 1200
1080
a.u.
Wavenumber / cm-1
415
Fe-S
chromophore
* T64000
Accession: C952
Box C0046
Map. Hill
400 800 1200
309478
1082940628
a.u.
Wavenumber / cm-1
415
Fe-S chromophore
Na2O/CaO
23
Accession: C1873
Box C0050
K2
400 800 1200
1089990600
a.u.
Wavenumber / cm-1
420
Fe-S chromophore
Accession: C754
Box C0038
K2
(~60) 400 800 1200
945990
1084
594
a.u.
Wavenumber / cm-1
Na2O/CaO
* Infinity
Accession: C783
Box C0041
Greefswald
400 800 1200
1086937628
412
355291
231a.u.
Wavenumber / cm-1
122
Na2O/CaO
Fe-S chromophore Mapungubwe
oblate
Accession: C1351
Box C0053
Bambandy-analo (K2)
400 800 1200
414
1080
620
a.u.
Wavenumber / cm-1
307
Fe-S chromophore
24
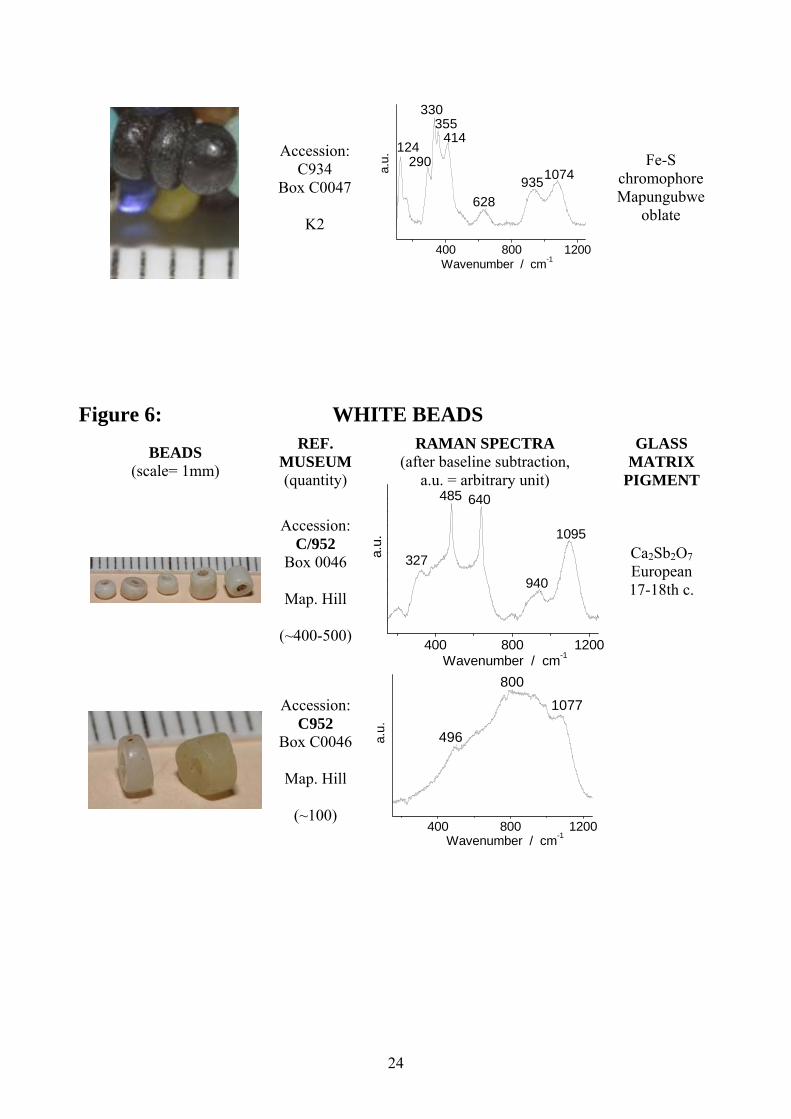
Accession: C934
Box C0047
K2 400 800 1200
1074935628
414355
330
290a.u.
Wavenumber / cm-1
124
Fe-S chromophore Mapungubwe
oblate
Figure 6: WHITE BEADS
BEADS (scale= 1mm)
REF. MUSEUM(quantity)
RAMAN SPECTRA (after baseline subtraction,
a.u. = arbitrary unit)
GLASS MATRIX
PIGMENT
Accession: C/952
Box 0046
Map. Hill
(~400-500) 400 800 1200
1095
940
640485
a.u.
Wavenumber / cm-1
327
Ca2Sb2O7 European 17-18th c.
Accession: C952
Box C0046
Map. Hill
(~100) 400 800 1200
800
1077
a.u.
Wavenumber / cm-1
496
25
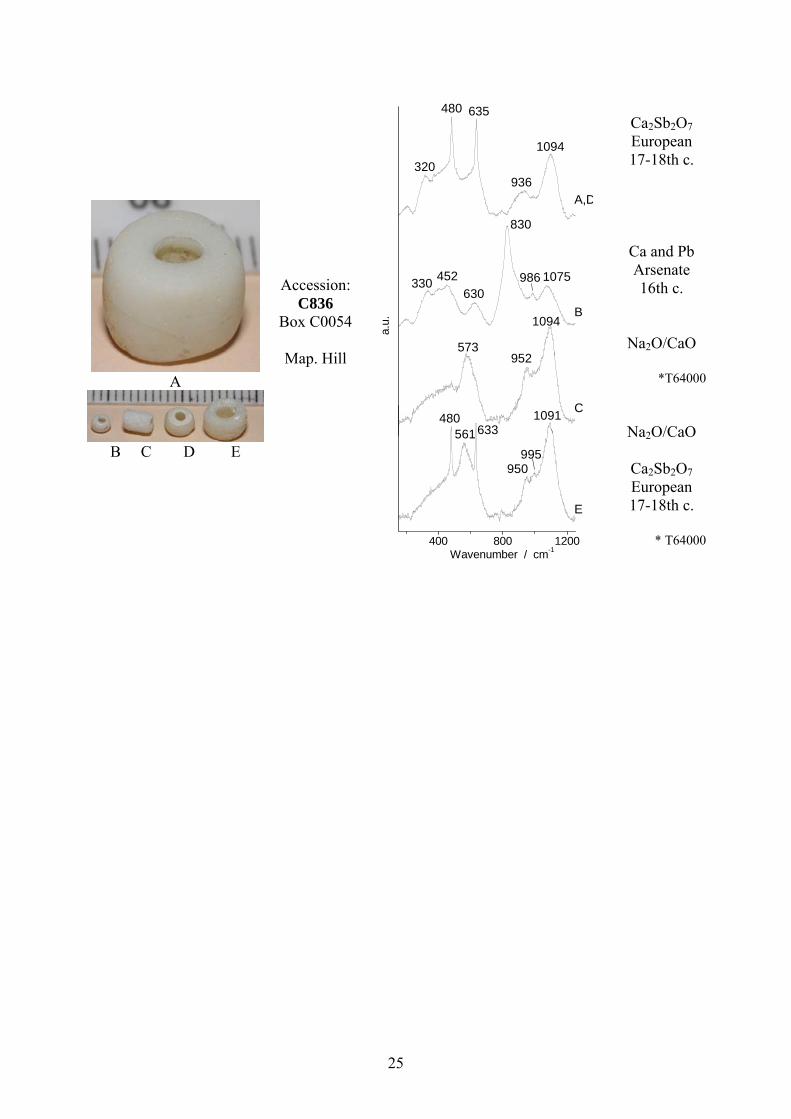
A
B C D E
Accession: C836
Box C0054
Map. Hill
400 800 1200
E
C
320936
1094
635480
B
A,D
330 452630
1075986
830
a.u.
Wavenumber / cm-1
1094
952573
1091
995950
561633480
Ca2Sb2O7 European 17-18th c.
Ca and Pb Arsenate 16th c.
Na2O/CaO
*T64000
Na2O/CaO
Ca2Sb2O7 European 17-18th c.
* T64000
26
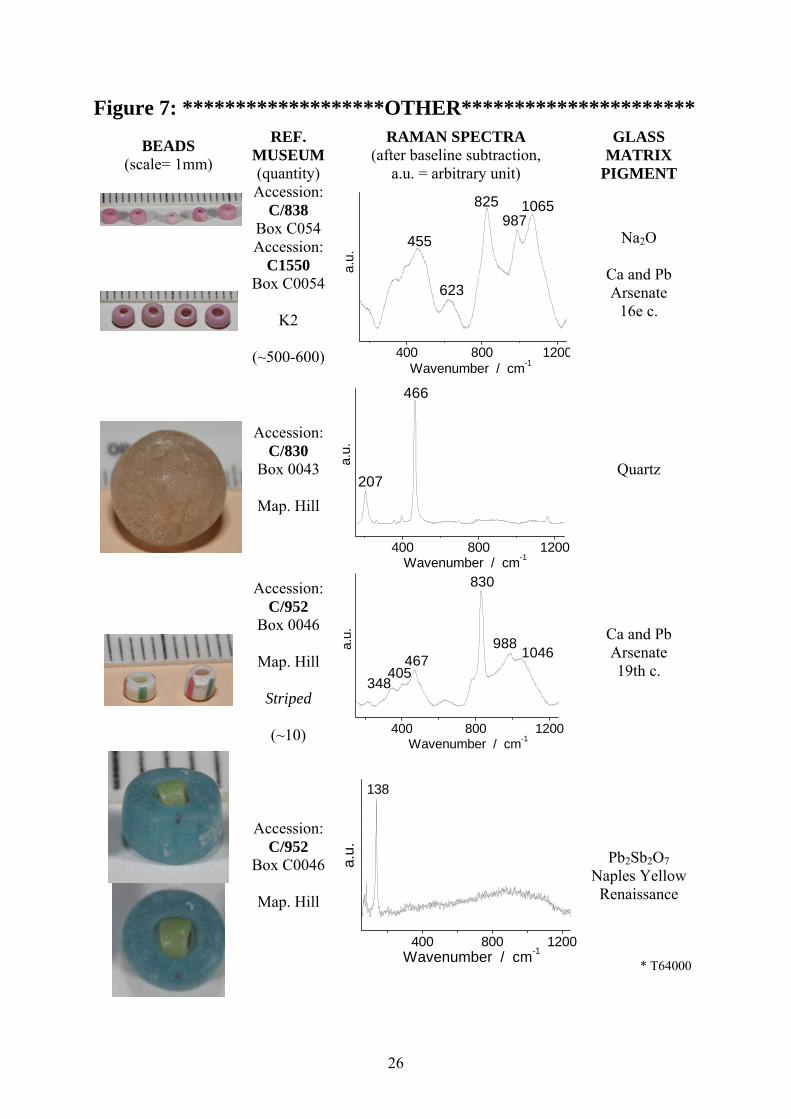
Figure 7: *******************OTHER**********************
BEADS (scale= 1mm)
REF. MUSEUM (quantity)
RAMAN SPECTRA (after baseline subtraction,
a.u. = arbitrary unit)
GLASS MATRIX
PIGMENT Accession:
C/838 Box C054 Accession:
C1550 Box C0054
K2
(~500-600)
400 800 1200
623
1065987
825
a.u.
Wavenumber / cm-1
455
Na2O
Ca and Pb Arsenate
16e c.
Accession:
C/830 Box 0043
Map. Hill
400 800 1200
466
a.u.
Wavenumber / cm-1
207
Quartz
Accession: C/952
Box 0046
Map. Hill
Striped
(~10) 400 800 1200
348405
467 1046988a.u.
Wavenumber / cm-1
830
Ca and Pb Arsenate 19th c.
Accession: C/952
Box C0046
Map. Hill
400 800 1200
a.u.
Wavenumber / cm-1
138
Pb2Sb2O7 Naples Yellow
Renaissance * T64000
27
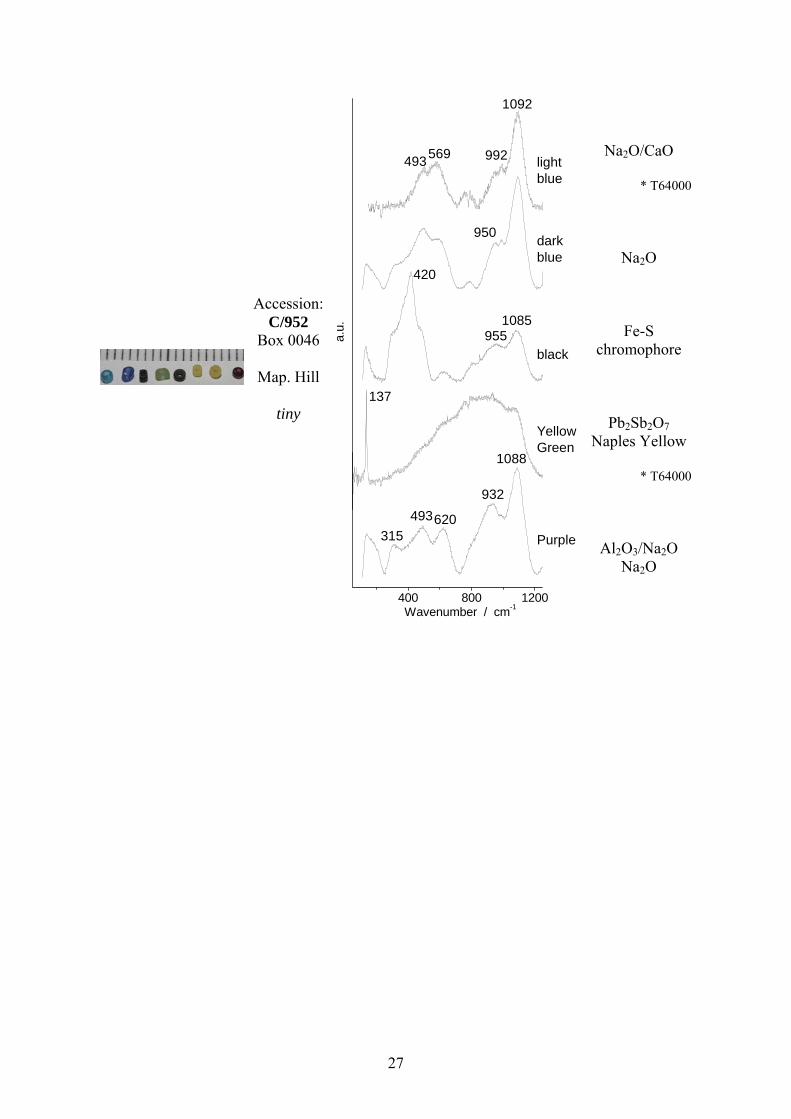
Accession: C/952
Box 0046
Map. Hill
tiny
400 800 1200
950
493569 992
1092
Purple
YellowGreen
black
dark blue
light blue
955
1085
420
137
a.
u.
1088
932
620493315
Wavenumber / cm-1
Na2O/CaO * T64000
Na2O
Fe-S chromophore
Pb2Sb2O7
Naples Yellow * T64000
Al2O3/Na2O Na2O

28
2. MAPUNGUBWE AND K2 ARCHAEOLOGICAL SITES
Mapungubwe is a small flat-topped sandstone plateau situated in the Limpopo valley
close to the present-day borders of South Africa, Botswana and Zimbabwe (Figure 8).
Excavations on Mapungubwe hill during 1933-1934 exposed three “royal” burials in which
gold funerary objects, gold beads and bangles, were found together with imported glass beads
(Fouche, 1937). The sheer volume of beads recovered is remarkable; from one burial alone 26
037 glass beads were counted (Saitowitz, 1996). Shortly after the discovery of Mapungubwe
another archaeological site, namely Bambandyanalo (later renamed K2), approximately 1 Km
to the southwest of Mapungubwe hill, was also discovered. During subsequent excavations at
both sites (1934-1940) thousands more glass beads were found (Gardner, 1963).
The excavations on Mapungubwe uncovered several strata of occupation which were
clearly separated by layers of ash indicating that the settlements were burnt down between
occupations (Gardner, 1963). Pottery styles and bead types varied between the layers and
made it possible to classify the beads into three different periods of time namely M1, M2 and
M3, with M3 being the top layer (Gardner, 1963). This stratification provided a link to the K2
site as the type of beads that was excavated at K2 is the same as those found in the M1 layer,
which is proof that this period of time of occupation on Mapungubwe coincides with the
settlement at K2. It also showed that burials at K2 associated with M2 style beads are
intrusive from the hill as M2 style beads were not found in the occupational material at K2
(Gardner, 1963). The M3 type of bead excavated in the uppermost layers was regarded as
quite modern, some dating from the 18th-19th centuries (Beck, 1937; Gardner, 1963). Based on
this and other information, such as the re-growth of plant species, the last occupation date on
the hill was estimated to be the middle of the 19th century (Gardner, 1963). Further
excavations at the site 1960-1975 used carbon dating to re-date the last occupation date on the
hill as 1280 AD (Meyer, 1998; Vogel, 1998; Woodborne et al., 2009).
29
a)
b)
K2
Zhizo
Khami
Map. hill
Botswana Zimbabwe
Limpopo River Shashe River
4 kmN
Samaria
Greefswald
Schroda
Stin
dal
La R
eve
Ham
ilton
Cer
beru
s
Ath
ens
Hac
ktho
me
Mac
hete
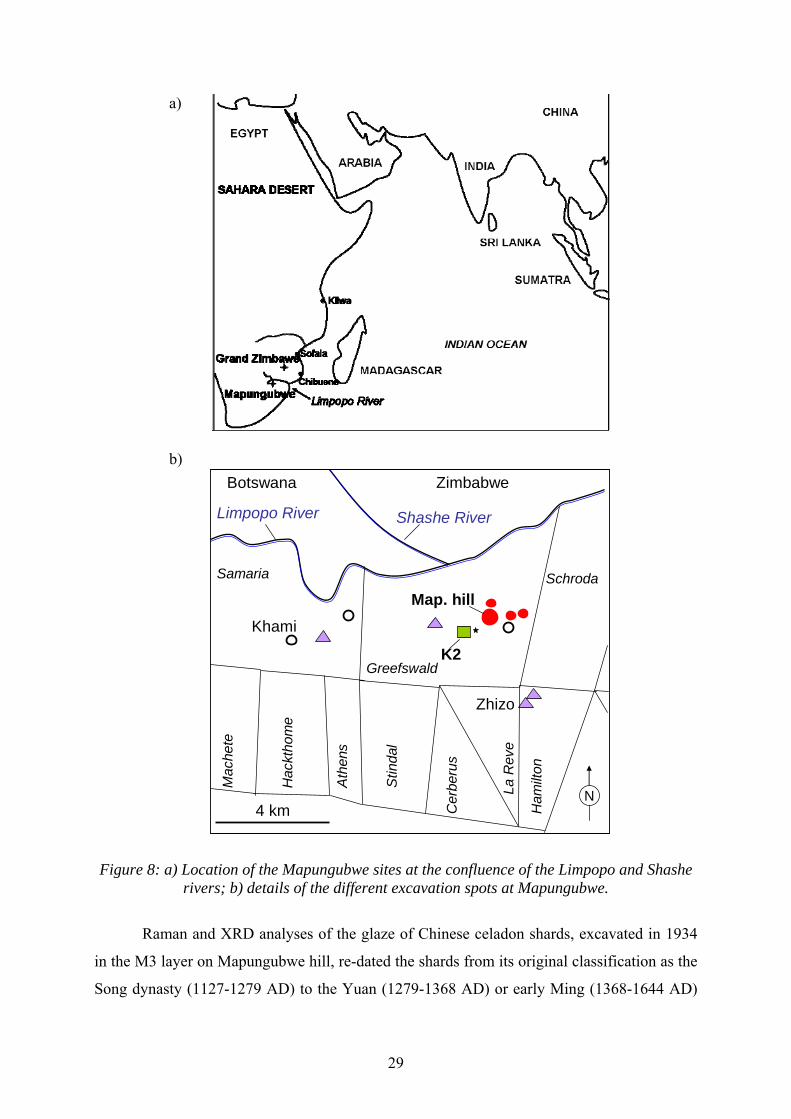
Figure 8: a) Location of the Mapungubwe sites at the confluence of the Limpopo and Shashe
rivers; b) details of the different excavation spots at Mapungubwe.
Raman and XRD analyses of the glaze of Chinese celadon shards, excavated in 1934
in the M3 layer on Mapungubwe hill, re-dated the shards from its original classification as the
Song dynasty (1127-1279 AD) to the Yuan (1279-1368 AD) or early Ming (1368-1644 AD)
30
dynasties, which was an indication that the last occupation date of Mapungubwe may have
been one to two centuries later than 1280 AD (Prinsloo et al., 2005). In order to obtain
supportive evidence for these results, which will have an impact on the chronology of the
whole region, a Raman spectroscopic study of the thousands of glass trade beads, excavated at
the same site was initiated. An in-depth study, utilizing Raman spectroscopy and supportive
techniques, was conducted on the Mapungubwe oblates, the beads associated with the gold-
bearing graves and representing the M2 time period (Prinsloo and Colomban 2008). Although
very precise information about the technology used to produce and colour the glass was
obtained, the provenance of the beads could not be established.
3. ORIGIN OF GLASS BEADS
Exotic imports, when found in an archaeological context, are clear proof of
international trade and if the provenance of the object can be determined, light can be shed on
trade routes and even roughly date the site. To unravel the early history of sub-Saharan Africa
this is of cardinal importance since only a few written records of the pre-Portuguese era exists
in western literature and up to the 19th century this is also sparse. Glass beads are the most
abundant of the imported trade goods that have been conserved and excavated at
archaeological sites all over Africa. The central position of Mapungubwe hill, situated at the
confluence of the Limpopo and Shashe rivers, made it from the earliest time accessible
through old caravan routes to Central Africa (e.g. Great Zimbabwe), Egypt and the
Mediterranean world (Saitowitz, 1996). The Limpopo River also connected Mapungubwe to
the African east coast (outposts of the Swahili Kilwa Sultanate: Sofala, Catembe (now
Maputo), etc.) and by sea trade as far as the Red sea, Arabic gulf, India, Champa and China
(Saitowitz, 1996, Colomban, 2005). Furthermore, trade along the African west coast was
accessible via the interior through Botswana and Angola, where Portuguese mariners traded
in beads from Europe 150 years before they rounded the Cape of Storms and also dominated
the African east coast trade (Saitowitz, 1996). Possible trading partners therefore were
numerous and the potential origin of the beads widespread.
Not all the beads were imported. “Garden roller” beads (Figures 1, 9a) shaped like the
heavy rollers used to press grass lawns were discovered at Bambandyanalo (K2) in 1934. The
blue-green beads were unlike any bead previously excavated at South African Iron Age
archaeological sites and the discovery of broken (and one whole) clay moulds at K2, into
which the beads fit perfectly proved that the beads were manufactured on site (Gardner,

31
1963). Garden rollers were also excavated on Mapungubwe (layer M1), but not one clay
mould (Figure 9a) was found, indicating that the beads were manufactured at the K2 site and
traded to Mapungubwe. It is the most southern site in Africa where evidence of glass-
reworking has been discovered and it was shown that the beads were manufactured by heating
smaller glass trade beads found in association with the large “Garden Rollers” up to the
temperature required for sintering and glass formation (Davison, 1973; Saitowitz, 1996;
Wood 2000).
a) b)
Figure 9: a) Garden Roller clay moulds and bead. (bead diameter ~ 12-15 mm ; photograph Mapungubwe museum files.),
b) Mapungubwe oblates (photograph A. Carr)
Initial studies on the beads found during the early excavations classified them
according to morphological appearances, specific gravity tests and fluorescence
measurements (Beck, 1937; Van Riet Lowe, 1955; Van der Sleen 1956; Gardner, 1963).
32
India, Fustat (Egypt) and Venice were proposed as origin for the older beads, whilst some
beads such as the large cobalt blue annular (“Dutch Dogons” made in Germany) and
hexagonal (“Russians” made in Czekoslovakia) beads were recognized as originating from
Europe. The beads associated with the burials (in particular the three gold-bearing skeletons)
comprise 80% of the collection. Davison (1974, 1979) found these Mapungubwe beads to be
chemically different to the beads that occur at archaeological sites in southern and eastern
Africa and at that time known as “trade wind beads” (after Van der Sleen, 1956). She named
the beads the Mapungubwe Oblates and also found that the beads from the K2 site (M1 layer
at Mapungubwe) were chemically in a separate group (XRD measurements) and after Gardner
named it the M1 group (Davison and Clark 1974; Davison 1979). Extensive studies using
XRD, REE and XRF measurements of the burial beads and the beads excavated by Meyer and
Eloff (later excavation) were undertaken by Saitowitz who proposed Fustat as the origin of
some of the beads based upon REE analysis, but gave inconclusive scientific evidence
(Robertshaw et al., 2010; Wood 2000, 2005).
Wood proposed a classification system for the beads excavated in Southern Africa
before contact with the west, according to their morphological and technological attributes
and dated each series by reference to established radiocarbon chronologies (Wood, 2000,
2005). Table 1 summarizes the bead series, which was also identified by her as occurring at
Mapungubwe and K2. She named the earliest beads Zhizo (after excavation site where they
were first excavated), K2 (after the K2 site and the same as the M1 beads of Gardner and
Davison), Garden rollers (after Gardner), Indo-Pacific (after Francis, 2001 who replaced
“trade wind beads” of van der Sleen) and Mapungubwe oblates (after Davison). A few large
Islamic beads were found at Mapungubwe, but not analysed in this study. She also described
a Zimbabwe and Khami beads series, of which she did not find examples amongst the beads
she studied from the Mapungubwe and K2 sites. Not many of the oldest type of beads, namely
the Zhizo bead series (Figure 9b), occur at Mapungubwe and they are usually heavily
corroded.
The colouring elements used in beads imported into southern African before the 14th
century were determined by elemental analysis: iron, lead, tin, copper and cobalt (Robertshaw
et al., 2010). The association of Pb with Sn in yellow glass indicated that lead stannate (lead
tin yellow type 1 or 2) was the preferred yellow pigment, particularly for plant ash glasses
(Tite et al., 1998) Iron dissolved as Fe3+ was used to obtain yellow (Perreira et al., 2009) and
acts as a reducing agent for copper so that it precipitates as metal or cuprite in brownish-red
33
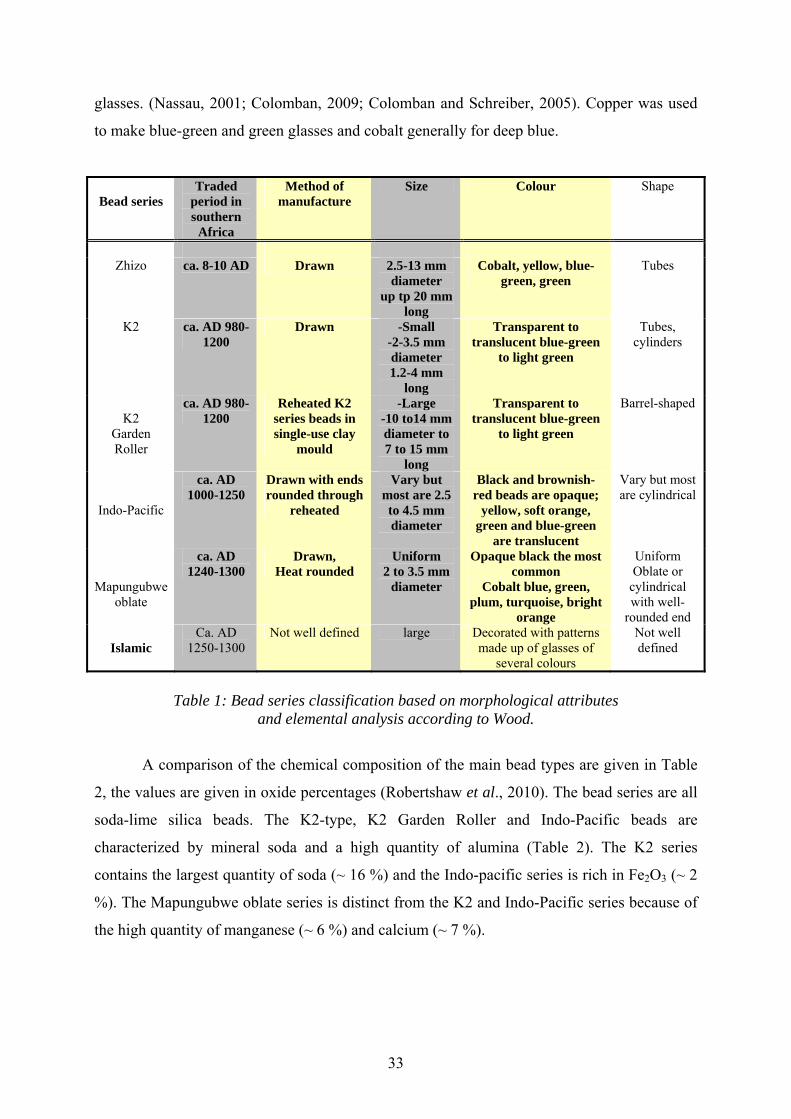
glasses. (Nassau, 2001; Colomban, 2009; Colomban and Schreiber, 2005). Copper was used
to make blue-green and green glasses and cobalt generally for deep blue.
Bead series
Traded period in southern
Africa
Method of manufacture
Size Colour Shape
Zhizo ca. 8-10 AD Drawn 2.5-13 mm
diameter up tp 20 mm
long
Cobalt, yellow, blue-green, green
Tubes
K2 ca. AD 980-1200
Drawn -Small -2-3.5 mm diameter 1.2-4 mm
long
Transparent to translucent blue-green
to light green
Tubes, cylinders
K2
Garden Roller
ca. AD 980-1200
Reheated K2 series beads in single-use clay
mould
-Large -10 to14 mm diameter to 7 to 15 mm
long
Transparent to translucent blue-green
to light green
Barrel-shaped
Indo-Pacific
ca. AD 1000-1250
Drawn with ends rounded through
reheated
Vary but most are 2.5 to 4.5 mm diameter
Black and brownish-red beads are opaque;
yellow, soft orange, green and blue-green
are translucent
Vary but most are cylindrical
Mapungubwe oblate
ca. AD 1240-1300
Drawn, Heat rounded
Uniform 2 to 3.5 mm
diameter
Opaque black the most common
Cobalt blue, green, plum, turquoise, bright
orange
Uniform Oblate or
cylindrical with well-
rounded end
Islamic Ca. AD
1250-1300 Not well defined large Decorated with patterns
made up of glasses of several colours
Not well defined
Table 1: Bead series classification based on morphological attributes
and elemental analysis according to Wood.
A comparison of the chemical composition of the main bead types are given in Table
2, the values are given in oxide percentages (Robertshaw et al., 2010). The bead series are all
soda-lime silica beads. The K2-type, K2 Garden Roller and Indo-Pacific beads are
characterized by mineral soda and a high quantity of alumina (Table 2). The K2 series
contains the largest quantity of soda (~ 16 %) and the Indo-pacific series is rich in Fe2O3 (~ 2
%). The Mapungubwe oblate series is distinct from the K2 and Indo-Pacific series because of
the high quantity of manganese (~ 6 %) and calcium (~ 7 %).

34
Site K2 Map oblate Assignment GR
K2 Indo-Pac Wood
Na2O 14.36 16.22 14.75 13.47 MgO 0.37 0.43 0.59 5.8 Al2O3 16.63 11.85 13 7.67 SiO2 61.05 64.51 63.08 61.88 K2O 3.39 3.34 3.46 3.47 CaO 2.85 2.34 2.85 6.66 Fe2O3 1.35 1.3 2.27 104 Type 2 3
Table 2: Average composition of the main beads series (K2, Garden Roller (K2GR),
K2, Indo-pacific and Mapungubwe) excavated at Mapungubwe and K2 according to Wood and Robertshaw et al.
It has been established that Raman spectroscopy is an excellent and non-invasive
method to characterise glasses as both the type of glass matrix and pigments used as colouring
agents can be determined from a Raman spectrum (Burgio and Clark, 2001; Colomban,
2003a; Colomban et al., 2003c; Ricciardi et al., 2009a). The Raman spectra and XRF analysis
of the Mapungubwe oblates confirmed the glass to be typical soda/lime/potash glass similar to
Islamic glass from the 8th century (Ommayad) (Colomban et. al, 2004a), but with higher
levels of aluminium, iron and magnesium. The turquoise, bright green, bright yellow and
orange colours were obtained by utilizing a combination of cassiterite (SnO2) and lead tin
yellow type II (PbSn1-xSixO3). Doping with cobalt and manganese produced dark blue and
plum coloured beads. The Fe-S chromophore was detected through its resonance enhanced
spectrum in the black beads. Corrosion of the black beads was investigated and an organic
phase detected on the beads, which might have influenced the corrosion process. We have
shown that Raman spectroscopy can classify the glass matrix and provide unique information
about the pigments used that is not possible with other analytical techniques.
4. EXPERIMENTAL
Micro-Raman spectroscopy was performed with HR 800, T64000 and Labram Infinity
micro-Raman spectrometers from HORIBA Scientific, Jobin Yvon Technology (Villeneuve
d’Ascq, France).
All the beads were analysed with the HR 800 with a 514 nm Argon exciting laser
(50mW at laser exit), a x50 objective and 600 t/mm grating with recording times ranging
between 50-300s. The T64000 and Labram Infinity Raman spectrometers (514 nm laser) was
used later to record spectra on some beads where no Raman signature or spectra of very poor

35
quality were obtained with the HR 800 (~10% of the spectra). In many cases where the
Raman signal of the beads was low the edge filter of the HR 800 caused interferences in the
form of a wavy background and as the T64000 spectrometer uses a triple monochromator
system to eliminate contributions from the Rayleigh line, this aspect is eliminated. In the
database an asterisk indicates the spectra recorded with the T64000 or Infinity, without
asterisk means that we used the HR 800.
The Raman signature of an amorphous silicate is composed of two massifs, one
centered around 500 cm-1 and the other one around 1000 cm-1 (Furukawa et al., 1981;
McMillan and Piriou, 1982). The first represents bending vibrations of the SiO4 tetrahedron
and the second stretching vibrations. It has been shown that the second peak can be
decomposed into five components following the Qn model, namely Q0, Q1, Q2, Q3 and Q4
which are attributed to stretching vibrations of SiO4 tetrahedra with 0, 1, 2, 3 or 4 bridging
oxygens. Because the SiO4 tetrahedron is a very strong chemical and vibrational entity, the
Raman signature of silicates depends on their nanostructure and can be directly correlated to
the glass composition. The wavenumber maxima of the Si-O bending and stretching massives
are well-established tools for the classification of amorphous silicates (Colomban, 2003a;
Colomban et al., 2006a; Tournié et al., 2008).
The analyses were made, where it was possible, on a clean part of the bead in order to obtain
the Raman signature of the original glass without interference of corrosion products. In order
to compare and identify the silicate glasses according to their Raman signatures, the
fluorescence background was subtracted and Raman parameters extracted from the spectra
such as the maximum position of the bending and stretching massifs respectively (δmax SiO2
and νmax SiO2) to use for the classification of the glass matrix.
5. GLASS MATRIX CLASSIFICATION
The glass matrix of the beads was classified according to the main parameters
extracted from the Raman signature of the SiO4 vibrational unit: the maxima position of the
bending (δmax SiO2) and stretching massifs (νmax SiO2). This classification tool has proved its
efficiency in the study of many glasses and enamels (Colomban et al., 2006a; Colomban and
Tournié, 2007, Kirmizi et al., 2010a,b; Ricciardi et al., 2009a,b). The spectra used are free of
significant bands originating from pigments, which could disturb the glass matrix. In some
cases a decomposition treatment (Colomban, 2003a; Colomban et al., 2006a; Ricciardi et al.,
36
2009a,b) was used that makes it possible to extract the requested Raman parameters even
when the pigment signature superimposes on that of the glass matrix.
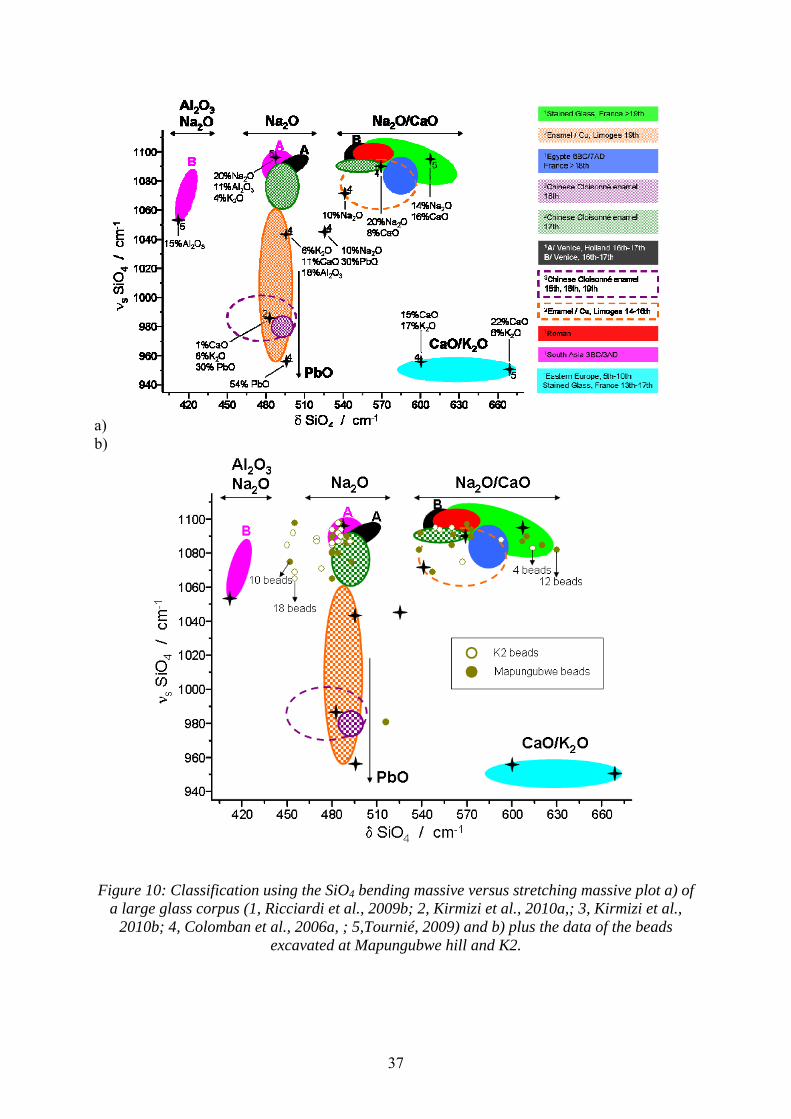
In Figure 10a the maximum positions of the bending (δmax SiO2) and stretching
massifs (νmax SiO2) of a very large collection of glass, varying in technology used, production
period and origin, are plotted against each other. Specific areas on the plot represents different
groups, in some instances compositions are also indicated. In Figure 10b the data for the
selection of beads excavated at Mapungubwe hill and K2 are added to the figure. All the
beads fit into two main groups, namely soda (Na2O) and soda-lime (Na2O/CaO) glasses,
which is in agreement with previous chemical analysis of the beads (Davison and Clark 1974;
Davison, 1979; Saitowitz, 1996; Robertshaw et al., 2010). Only one spectrum corresponds to
a PbO-rich composition. According to previous studies (Colomban et al., 2006a; Kirmizi et
al., 2010a,b; Ricciardi et al., 2009a,b), when the quantity of alumina increases the position of
the bending massif shifts towards lower wavenumbers while an increase in the quantity of
lead shifts the maximum position of the stretching massif downwards. Lixiviation also
induces a wavenumber shift and a decrease in intensity (Tournié et al., 2008). The large
scattering of the data shows a variability of composition, which are related to the raw
materials used (mineral or sea plant ash for soda glass, continental plant ash for potash-lime
glass), the workshop technology or the recycling of glass of different origins. Pigment
addition can also shift the position of the bands. The beads excavated on Mapungubwe hill are
well distributed into Na2O and Na2O/CaO groups while the majority of beads excavated at K2
are in one group Na2O. The diversity of the Mapungubwe hill beads arises from the longer
occupation time of the site in comparison to the K2 site and indicates diverse origins of the
beads.
37
a) b)
Figure 10: Classification using the SiO4 bending massive versus stretching massive plot a) of
a large glass corpus (1, Ricciardi et al., 2009b; 2, Kirmizi et al., 2010a,; 3, Kirmizi et al., 2010b; 4, Colomban et al., 2006a, ; 5,Tournié, 2009) and b) plus the data of the beads
excavated at Mapungubwe hill and K2.
38
In Figure 10b it can be seen that the K2 and Mapungubwe beads, with bending massif
around 450 cm-1, form a new group outside the established groups related to the Na2O group.
The other beads fall into the established groups. The majority of beads from the K2 site
(stretching massif around 1090 cm-1) are typical of South Asian glass (3BC/3AD) and beads
with stretching massif around 1080 cm-1 are similar to Chinese Cloisonné enamel and glass
from Venice and Holland (16th-17th c.) with a composition close to 20% of Na2O, 11% of
Al2O3 and 4% of K2O wt. The beads excavated at Mapungubwe hill, which belong to the
Na2O/CaO group, exhibit bending massifs between 540 and 630 cm-1 and are more scattered
between groups than the beads from the Na2O group. The beads with bending massif around
570 cm-1, are included in the Roman and Chinese Cloisonné enamel (17th c.) areas with a
composition close to 20% of Na2O and 8% of CaO wt. Mapungubwe beads with spectra with
bending massif around 615 cm-1 fall into the area of the stained glass windows from 19th c.
with a composition close to 14% Na2O and 16% CaO. The Zhizo beads (Figure 9b) are
corroded to a great extent, but it was possible to record spectra on both a corroded part of the
glass and an original piece. The spectrum of the corroded part has a stretching massif at 1075
cm-1 and falls into the group for corroded glass and the spectrum of the original glass (568,
1094 cm-1) falls into the sodium group.
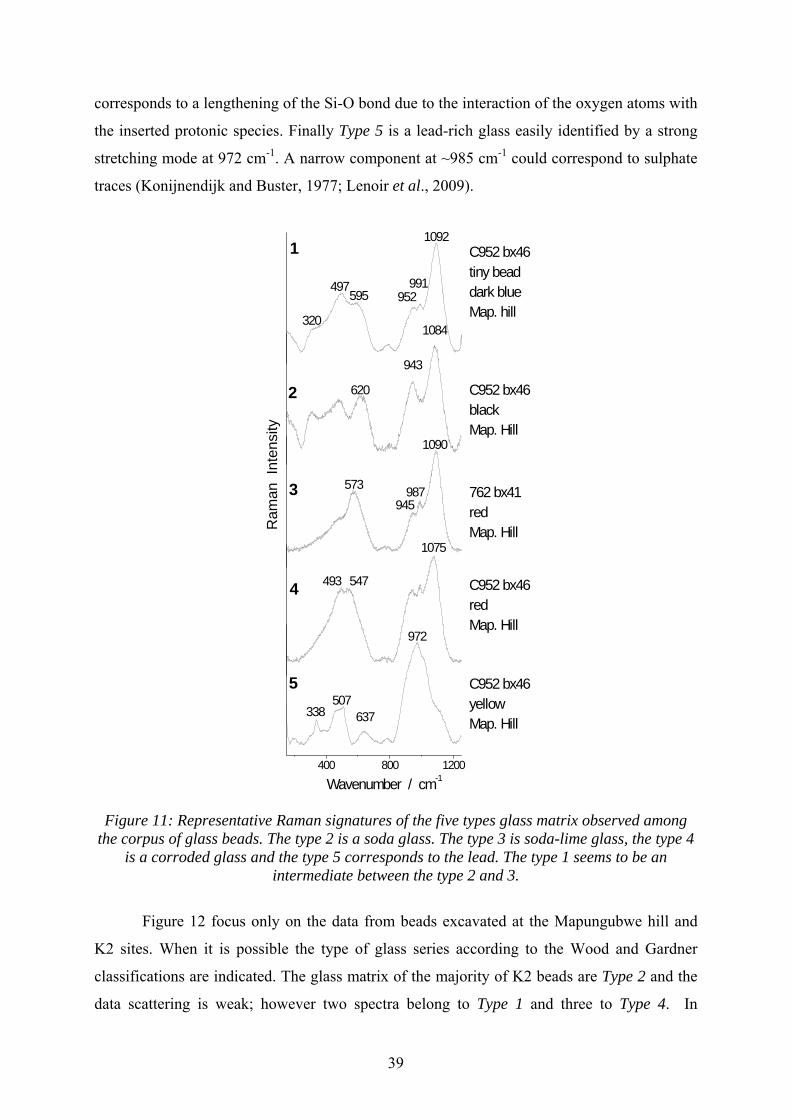
A more detailed classification of the glass types can be made by examining the shape
of the vibrational signature that is directly related to the glass nanostructure and hence not
only to the composition but also the production technology. In Figure 11, five representative
Raman signatures of the glass matrix of all the collected spectra (details available in Tournié
et al., 2010) are shown. Type 1 is characterized by three bands more or less equal at 320, 497
and 595 cm-1 for the bending massif and three bands (2 small and 1 big) respectively at 952,
991 and 1092 cm-1 for the stretching massif. Type 2 is also characterized by 3 bands for the
bending massif, but only two bands for the stretching massive at 943 and 1084 cm-1. Type 3 is
a typical Roman glass (Colomban et al., 2006a).
Type 1 can be considered as an intermediate between Type 2 and Type 3 and Type 4 is
due to corrosion by acidic water. Previous studies (Colomban et al., 2006b; Tournié et al.,
2008) have demonstrated that K+/H+ substitution (lixiviation) induces an increase in intensity
of the ~480 cm-1 component in the bending multiplet and a downshift of the stretching
maximum. Comparing the spectra of types 3 and 4 it is clear that the intensity of the 492 cm-1
component has increased in Type 4, which indicates a modification of the O-Si-O angle in the
SiO4 polymeric framework due to proton insertion (Scanu et al., 1994; Sharma et al., 1983).
Also, a downshift from 1090 to 1075 cm-1 is observed for the stretching component and
39
corresponds to a lengthening of the Si-O bond due to the interaction of the oxygen atoms with
the inserted protonic species. Finally Type 5 is a lead-rich glass easily identified by a strong
stretching mode at 972 cm-1. A narrow component at ~985 cm-1 could correspond to sulphate
traces (Konijnendijk and Buster, 1977; Lenoir et al., 2009).
C952 bx46yellowMap. Hill
1084
943
595
320
1092
991952
497
762 bx41redMap. Hill
C952 bx46redMap. Hill
1
C952 bx46blackMap. Hill
C952 bx46tiny beaddark blueMap. hill
5
4
3
2 620
R
aman
Int
ensi
ty
1075
547
493
Wavenumber / cm-1
1090
573945
987
400 800 1200
972
637507
338
Figure 11: Representative Raman signatures of the five types glass matrix observed among the corpus of glass beads. The type 2 is a soda glass. The type 3 is soda-lime glass, the type 4
is a corroded glass and the type 5 corresponds to the lead. The type 1 seems to be an intermediate between the type 2 and 3.
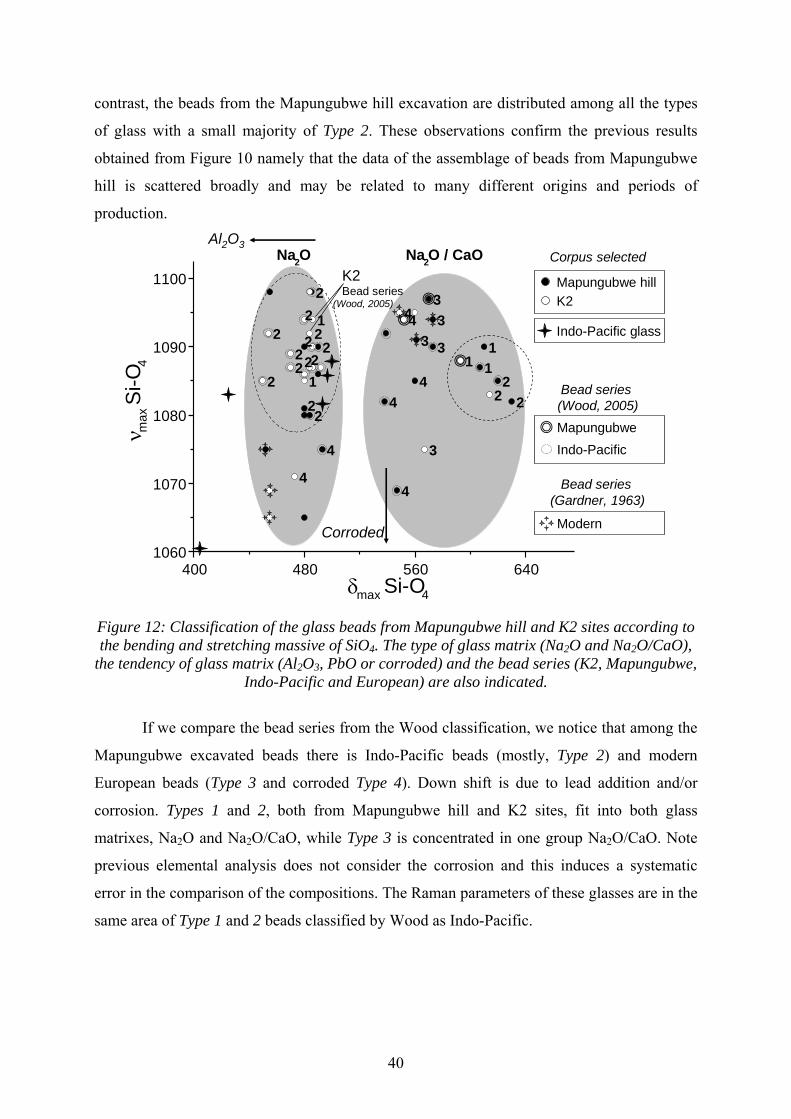
Figure 12 focus only on the data from beads excavated at the Mapungubwe hill and
K2 sites. When it is possible the type of glass series according to the Wood and Gardner
classifications are indicated. The glass matrix of the majority of K2 beads are Type 2 and the
data scattering is weak; however two spectra belong to Type 1 and three to Type 4. In
40
contrast, the beads from the Mapungubwe hill excavation are distributed among all the types
of glass with a small majority of Type 2. These observations confirm the previous results
obtained from Figure 10 namely that the data of the assemblage of beads from Mapungubwe
hill is scattered broadly and may be related to many different origins and periods of
production.
400 480 560 6401060
1070
1080
1090
1100
1
3
2
2
1
44
3
4
4
2
33
22 2
1
12
1
4
3
2
22
2
4
4
2
2
Na2O / CaONa2O
ν max
Si-O
4
δmax Si-O4
22
2
MapungubweIndo-Pacific
Modern
K2Bead series
Bead series(Gardner, 1963)
Corpus selected
Corroded
Mapungubwe hillK2
Indo-Pacific glass
Al2O3
Bead series(Wood, 2005)
(Wood, 2005)
Figure 12: Classification of the glass beads from Mapungubwe hill and K2 sites according to the bending and stretching massive of SiO4. The type of glass matrix (Na2O and Na2O/CaO),
the tendency of glass matrix (Al2O3, PbO or corroded) and the bead series (K2, Mapungubwe, Indo-Pacific and European) are also indicated.
If we compare the bead series from the Wood classification, we notice that among the
Mapungubwe excavated beads there is Indo-Pacific beads (mostly, Type 2) and modern
European beads (Type 3 and corroded Type 4). Down shift is due to lead addition and/or
corrosion. Types 1 and 2, both from Mapungubwe hill and K2 sites, fit into both glass
matrixes, Na2O and Na2O/CaO, while Type 3 is concentrated in one group Na2O/CaO. Note
previous elemental analysis does not consider the corrosion and this induces a systematic
error in the comparison of the compositions. The Raman parameters of these glasses are in the
same area of Type 1 and 2 beads classified by Wood as Indo-Pacific.
41
6. PIGMENTS
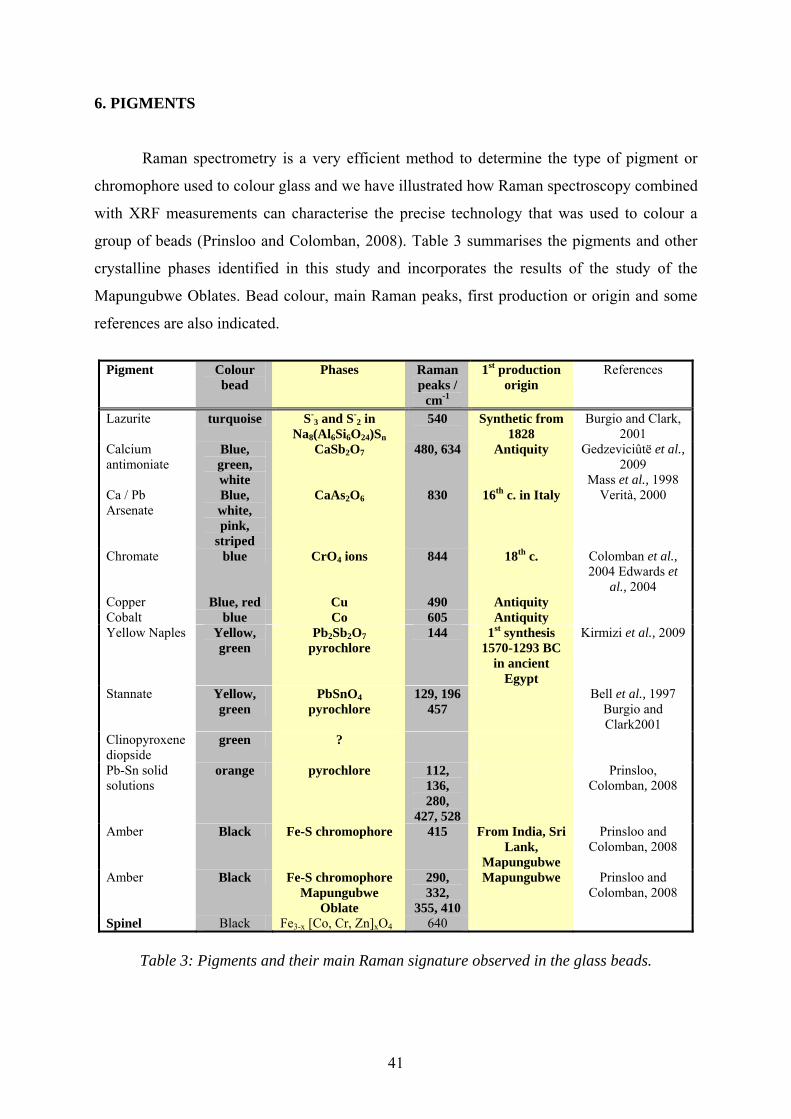
Raman spectrometry is a very efficient method to determine the type of pigment or
chromophore used to colour glass and we have illustrated how Raman spectroscopy combined
with XRF measurements can characterise the precise technology that was used to colour a
group of beads (Prinsloo and Colomban, 2008). Table 3 summarises the pigments and other
crystalline phases identified in this study and incorporates the results of the study of the
Mapungubwe Oblates. Bead colour, main Raman peaks, first production or origin and some
references are also indicated.
Table 3: Pigments and their main Raman signature observed in the glass beads.
Pigment Colour bead
Phases Raman peaks /
cm-1
1st production origin
References
Lazurite turquoise S-3 and S-
2 in Na8(Al6Si6O24)Sn
540 Synthetic from 1828
Burgio and Clark, 2001
Calcium antimoniate
Blue, green, white
CaSb2O7 480, 634 Antiquity Gedzeviciûtë et al., 2009
Mass et al., 1998 Ca / Pb Arsenate
Blue, white, pink,
striped
CaAs2O6 830 16th c. in Italy Verità, 2000
Chromate blue CrO4 ions 844 18th c. Colomban et al., 2004 Edwards et
al., 2004 Copper Blue, red Cu 490 Antiquity Cobalt blue Co 605 Antiquity Yellow Naples Yellow,
green Pb2Sb2O7
pyrochlore 144 1st synthesis
1570-1293 BC in ancient
Egypt
Kirmizi et al., 2009
Stannate Yellow, green
PbSnO4 pyrochlore
129, 196 457
Bell et al., 1997 Burgio and Clark2001
Clinopyroxene diopside
green ?
Pb-Sn solid solutions
orange pyrochlore 112, 136, 280,
427, 528
Prinsloo, Colomban, 2008
Amber Black Fe-S chromophore 415 From India, Sri Lank,
Mapungubwe
Prinsloo and Colomban, 2008
Amber
Black Fe-S chromophore Mapungubwe
Oblate
290, 332,
355, 410
Mapungubwe Prinsloo and Colomban, 2008
Spinel Black Fe3-x [Co, Cr, Zn]xO4 640
42
6.1 Blue
Eight different Raman signatures were observed for the blue beads (Figure 1). The
lazurite signature, due to the sulphide ion chromophore, typical of natural lapis lazuli
(Colomban, 2003b) or of synthetic ultramarine (Picquenard et al., 1993, Burgio and Clark,
2001) is observed for several glass beads (Figure 1, Table 3). Differentiation between lapis
lazuli and ultramarine is not possible from their Raman spectra. Lapis lazuli was identified in
some Iranian ceramic glazes made during the 13th/14th c. (Colomban, 2003b) and is very
common in Mameluk glasses from 13th-15th c., (Colomban et al., to be published, Ward,
1998; Brill, 2000). The use of lapis lazuli in these beads as pigment led us to assign them to
an Islamic (Fustat or Iran) production.
The Raman spectrum of the blue bead with an intense peak at 844 cm-1 is typical of
chromate (CrO4) ions (Figure 1, Table 3) as found in Iznik chromites (Colomban et al.,
2004a) and in some 18th century porcelain pigments (Edwards et al., 2004). The peak at 995
cm-1 is assigned to a Ca/Al silicate (Colomban, 2004). Actually some Iranian and Asian cobalt
sources consist of Co-Cr (Fe) or Co-Mn (Fe) ores (Colomban, 2003b; Colomban et al.,
2004b; Ricciardi et al., 2009b; Gratuze et al., 1992).
In some the spectra of Figure 1 a pair of peaks at 454 and 624 cm-1 appears, which is
typical of calcium antimonate (Gedzeviciûtë et al., 2009; Ricciardi et al., 2009a). This
pigment was used from antiquity (Mass et al., 1998; Ricciardi et al., 2009a) as opacifier or
white pigment in Egypt. In Europe a transition was made from tin-rich to antimony-rich
opacifiers during the 17th century, which was again replaced by arsenic in the 18th and 19th
centuries (Sempowski et al., 2000).
A Raman signature of arsenate was observed (Figure 1, Table 3) for milky blue beads.
The use of arsenate was developed in Italy (Venice) during the 16th c. (Verità, 2000) to make
lattimo glass but the use only spread out during the 19th c. we assign this production to a 19th
c. import. The transition from Sn to Sb to As is then clearly illustrated in the beads found on
Mapungubwe hill (Sempowski et al., 2000) and indicates a long trading period.
The Raman spectrum of a large cobalt blue hexagonal bead shows a narrow peak at
960 cm-1, characteristic of calcium phosphate as observed in Islamic glazes and glazed Medici
porcelain (Colomban et al., 2004a). These beads were produced in Czekoslovakia (Bohemia)
and used during the slave trade. Examples occur at many archaeological sites in Africa and
are popularly known as “Russians”.

43
The Garden Roller (Figures 1, 9) bead analysed in this study are of the light green
variety and some Raman spectrum in Figure 1 shows a sulphate signature (SO4- stretching
peak at ~988 cm-1, Lenoir et al., 2009; Konijnendijk and Buster, 1977) characteristic of a
glass melt that have not been sufficiently annealed. This Raman signature is very close to a
Raman signature of glass containing a high quantity of alumina. It has been shown that the Al
content of the Garden Rollers are more that the small beads that they were made of and it was
attributed to contamination from the clay mould in which the beads were fired (Wood, 2000).
This spectrum is also very similar to that of a corroded glass (Type 3) because of the peaks at
480 and 988 cm-1 previously attributed to corroded glass (Tournié et al., 2008). This spectrum
is not representative of the Garden Roller beads as there is a very large variation in colour and
degree of vitrification between the beads and some spectra closely resembles a Type 3 glass
(Roman) (Prinsloo et al., 2007).
In some spectra of Figure 1 there is no Raman signature of a pigment but only that of
the glass matrix. Spectrum a in Figure 1, characterized by an intense bending band at 548 cm-
1, is observed both for the blue (light, transparent, oblate, Figure 3 c6,9, when Cu ions are
dissolved in the glass, the Raman signature of the glass matrix is preserved) and red beads
(tube and cylinder, Figure 2). The blue beads belong to the K2 series and the red beads to the
Indo-Pacific series according to the Wood classification.
Spectra of the deep cobalt blue beads show an intense bending band at 605 cm-1
(Figure 1). The absence of a pigment signature indicates that the colour was obtained by
dissolution of the Co transition metal ions (Colomban et al., 2001).
The turquoise colour of Mapungubwe oblate beads was obtained by adding CuO to a
small presentation of lead tin yellow type II and cassiterite as opacifier (Prinsloo and
Colomban, 2008).
6.1 Yellow and green
The bright yellow, for the Mapungubwe oblates, was obtained with lead tin yellow
type II, as identified through Raman spectroscopy as well as XRF measurements. The Raman
spectrum has bands at 138 (vs), 324 (m, br), which is very close to that of Naples Yellow
(lead antimonite) (both pigments have the same pyrochlore structure) with bands at 140 (vs),
329 (m, br) and 448 (w, br) (Bell et al., 1997), so it is not possible to distinguish
unambiguously between the two pigments through their Raman spectra. Naples yellow as
pigment was developed during the renaissance but it has been claimed that it was already
present on tiles in Babylon from 16th c. BC (Mass et al., 2002; Burgio and Clark, 2001).
44
Raman signatures of yellow beads are shown in Figure 3 and green beads in Figure 4. The
position of the strongest peak in the spectra varies between 136-144 cm-1 (Figures 3, 4), which
shows that the pigments are all Pb–Sn-based pyrochlore solid solutions (Krimizi et al.,
2010a). Lead (II) stannate, Pb2SnO4 (lead tin yellow Type 1) with two very strong peaks at
129 and 196 cm-1 was not observed.
Another type of Pb-Sn solid solution was identified (Figure 3) for the bright orange
beads that forms part of the Mapungubwe oblates (Prinsloo and Colomban 2008). Raman
bands originating from lead tin yellow type II can be distinguished, but in addition a very
strong signal at 113 cm-1 and a peak at 529 cm-1 are observed (Figure 3). The orange colour
was obtained by adding lead to the mix and the extra peaks occur at wavenumbers very near
to that of red lead oxide (Prinsloo and Colomban, 2008). A similar spectrum has previously
been reported in Islamic ceramics from Dougga in Ifriqiya, one sample dating from the 11th-
12th century (Zirides period), the other from the 17th-18th century (Ottoman period).
(Colomban et al., 2001a)
The bright green of the small opaque Mapungubwe oblates was obtained by a
combination of lead tin yellow type II and copper ions (Prinsloo and Colomban 2008). Two
other Raman signatures were observed for green beads (Figure 4). One is assigned to calcium
antimonate, which confers to the bead a milky aspect, and the colouring element is certainly
copper because copper ions do not form specific phases that can be recognised in a Raman
spectrum.
The second one corresponds to a large wound bead (Figure 4) found on Mapungubwe
hill and the sharp peaks at 326, 363, 391, 669 and 1014 cm-1 is characteristic of the
clinopyroxene diopside. The Raman signature of diopside has previously also been detected
in a glass paste vase from Egypt (6th–5th century BC) (Ricciardi et al., 2009b).
6.3 Black and white
The Raman signatures of black beads are shown in Figure 5. The black pigment of the
thousands (>100 000) of black beads associated with the middle period of Mapungubwe was
identified as a Fe-S chromophore (Prinsloo and Colomban, 2008). The majority of the black
beads are Mapungubwe Oblates ,which vary in shape on different positions on the bead. For
larger cylindrical and round beads the peak at 415 cm-1 (Table 3) is assigned to the resonance
enhanced Fe-S chromophore (Prinsloo and Colomban, 2008), a chromophore used to produce
amber glass. The chemical composition of the round and cylindrical beads differs from the
oblates and therefore have different origins. A similar spectrum of the Fe-S chromophore of
45
the large cylindrical and round beads is also obtained for black South Indian and Sri Lanka
glasses (Prinsloo and Colomban, 2008). In this study we identified another pigment for black
beads corresponding to the spinel Fe3O4 or Co, Cr, Zn-substituted homologues (Colomban et
al., 2008) and this is an indication that the black beads had even a fourth production centre.
Two pigments were detected for the white beads; calcium antimonite and Ca/Pb
arsenate (Figure 6, Table 3). The arsenate were also detected on the pink (Figure 7) and
striped beads (Figure 7) which are typical European beads and in agreement with Gardner’s
classification
7. GLASS MATRIX, PIGMENTS AND PLACE/PERIOD OF PRODUCTION
The glass matrixes of the lazurite coloured beads (glass Types 2 and 3, Figure 11) and
beads containing calcium antimonite are distributed into both the Na2O and Na2O/CaO
(Figure 13) groups. This implies that these blue beads have two different origins or periods of
production. The glass matrixes of the arsenate-based blue beads and copper blue beads fit into
the Na2O groups with a majority displaying the Type 1 Raman signature. The cobalt blue
beads fit in the Na2O/CaO groups (Figure 13) with a majority of Types 1 and 2 and a few of
Type 3 Raman signatures.
The red beads belong in both groups Na2O and Na2O/CaO and the majority of the
Raman spectra is Type 4 (corroded glass, Figure 13). A red coloured glass was obtained from
Neolithic times (Colomban, 2009) by distributing copper nanoparticules in a glass matrix and
very large quantities of red glass was produced during Roman times (Ricciardi et al., 2009a)
and continued in Islamic productions. Copper corrosion is easy and explains the beads
degradation.
The green and yellow beads with Ca antimonate and Naples yellow / lead tin yellow
type 2 belong to the Na2O group except one green bead (Figure 13). For other beads also
coloured with Naples yellow / lead tin yellow type 2, the Raman signature of the green bead is
type 2 and the yellow one is type 4 (Roman like glass corroded).
The white beads coloured with arsenate fit into to the Na2O group while Ca
antimonate white beads belong to the Na2O/CaO group (Type 3). Finally, the black beads
belong to the Na2O/CaO groups.

46
350 420 490 560 6301060
1070
1080
1090
1100
?
?? ?
??
Ca2Sb2O7
Ca2Sb2O7ν m
ax S
i-O4
δmax Si-O4
Na2O / CaONa2O
Blue Red / Cu White Green / Pb2Sb2O7 Yellow / Pb2Sb2O7 Black
Arsenate
CrO4+Ca
2Sb
2O
7
Ca2Sb2O7
Cu
LazuCo
Figure 12: Classification of the glass beads from Mapungubwe hill and K2 sites. The colours and pigments of the beads are indicated.
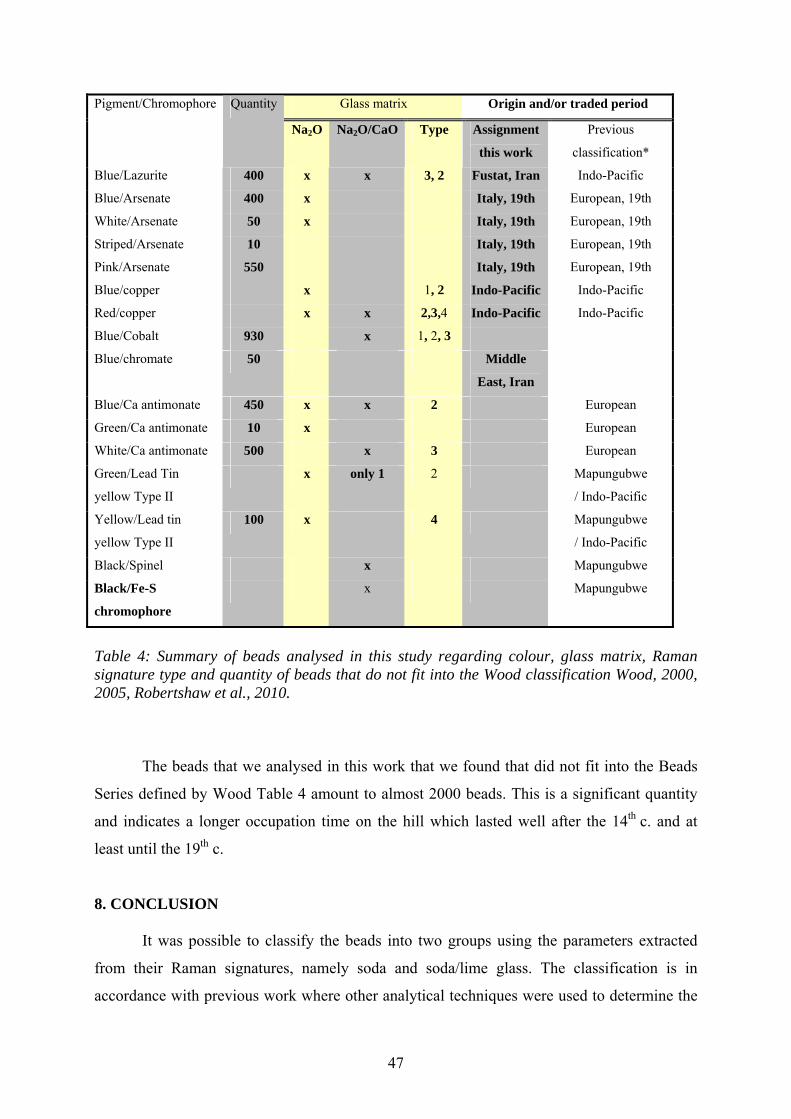
Table 4 summarizes the results of this study according to colouring agent
(pigment/chromophore), the glass matrix, the Raman signature type and when possible the
origin and period of production with the assignment of Wood classification (Wood 2000,
2005). The quantity of beads found in the Mapungubwe Museum collection for the more
modern beads (M3 Gardner) is also reported. Using this Table it is possible to speculate about
the number of possible origin and/or period of production for each colour of Mapungubwe hill
and K2 beads. Concerning the blue beads, 6 pigments were used and among the pigment
some have two different glass matrixes, for example lazurite and blue antimonate. So, in total
there might be approximatly 8 possible origins or periods of production for blue beads spread
between Europe, Indo-Pacific and Middle East. Regarding the white beads, 2 pigments were
observed with Raman spectrometry. Everyone is agreed to say that these bead are modern and
come from Europe. We can guess as well that pink and striped beads made from arsenate
originate from the same location as the white beads containing arsenate.
47
Glass matrix Origin and/or traded period Pigment/Chromophore Quantity
Na2O Na2O/CaO Type Assignment
this work
Previous
classification*
Blue/Lazurite 400 x x 3, 2 Fustat, Iran Indo-Pacific
Blue/Arsenate 400 x Italy, 19th European, 19th
White/Arsenate 50 x Italy, 19th European, 19th
Striped/Arsenate 10 Italy, 19th European, 19th
Pink/Arsenate 550 Italy, 19th European, 19th
Blue/copper x 1, 2 Indo-Pacific Indo-Pacific
Red/copper x x 2,3,4 Indo-Pacific Indo-Pacific
Blue/Cobalt 930 x 1, 2, 3
Blue/chromate 50 Middle
East, Iran
Blue/Ca antimonate 450 x x 2 European
Green/Ca antimonate 10 x European
White/Ca antimonate 500 x 3 European
Green/Lead Tin
yellow Type II
x only 1 2 Mapungubwe
/ Indo-Pacific
Yellow/Lead tin
yellow Type II
100 x 4 Mapungubwe
/ Indo-Pacific
Black/Spinel x Mapungubwe
Black/Fe-S
chromophore
x Mapungubwe
Table 4: Summary of beads analysed in this study regarding colour, glass matrix, Raman signature type and quantity of beads that do not fit into the Wood classification Wood, 2000, 2005, Robertshaw et al., 2010.
The beads that we analysed in this work that we found that did not fit into the Beads
Series defined by Wood Table 4 amount to almost 2000 beads. This is a significant quantity
and indicates a longer occupation time on the hill which lasted well after the 14th c. and at
least until the 19th c.
8. CONCLUSION It was possible to classify the beads into two groups using the parameters extracted
from their Raman signatures, namely soda and soda/lime glass. The classification is in
accordance with previous work where other analytical techniques were used to determine the

48
type of glass matrix. It provides an easy non-destructive method for archaeologist to
discriminate non-destructively between bead types, when it is not possible to differentiate
between beads on morphological factors alone.
The strength of Raman spectroscopy was illustrated in identifying the pigments used
to colour the beads. Many of them was first used after the 13th century some even dating from
the 19th century. This supports our previous results, which found that the celadon shards
excavated on the hill dates from a later period than the original classification and indicates a
later occupation date for the hill. This calls for more research to find a way to reconcile the
carbon dating of the hill with the physical evidence of the modern beads excavated on the hill.
A few pigments were identified that is typical of Islamic productions and is supportive of
previous authors who claimed Fustat to be a possible production site.
The information obtained from identifying both pigments and type of glass matrix of
the beads indicates a large number of production sites and therefore a considerable quantity of
trading partners over a long period of time. Future, more in-depth studies of the beads, where
other parameters extracted from their Raman signatures such as polymerisation index are also
used might even reveal more production origins.
To complement this first study of beads excavated in Africa, which focussed on the
K2 and Mapungubwe sites, we plan to analyse beads from the same period from other sites in
Africa such as Great Zimbabwe. After the Portuguese rounded the Cape of Good Hope and
the scramble for Africa began - millions of beads were brought into Africa as trade goods and
ended up in artefacts made by the various tribes of Africa. Such as initiation dolls, aprons and
every imaginable utensil. We plan to analyse these artefacts, which are part of museum
collections all over the world. In this we hope to trace the beads to the country of origin and
so make a contribution in reconstructing the early history of Africa.
9. ACKNOWLEDGEMENTS
The authors thank Ms Sian Tiley and Ms Isabelle Barrier, Curator and Assitant
Curator of the Mapungubwe Museum for their help and advice. Dr Leskey Cele and the
Tshwane University of Technology are kindly acknowledged for the permission to use their
Raman facilities.
We also thank Dr Alan Carr for the photographs of the bead samples. Dr B. Gratuze
and L. Dussubieux are kindly acknowledged for the glass references.

49
50
10. REFERENCES Beck HC, 1937, The beads of the Mapungubwe District. In: Mapungubwe (ed Fouché, L), p. 104-113, Cambridge University Press, Cambridge. Brill R.H., 2000, in Glass of the Sultan, S. Carboni, D. Whitehouse Eds, Yale University Press, New Haven, CT, 15. Bell I. M., Clark R. J. H and Gibbs P. J. 1997, Raman and spectroscopic library of natural and synthetic pigments (pre- ~ 1850 AD) Spectr. Acta Part A, 53, 2159-2179. Burgio L., Clark R. J. H., 2001, Library of FT-Raman spectra of pigments, minerals, pigment media and varnishes, and supplement to existing library of Raman spectra of pigments with visible excitation, Spectr. Acta PartA, 57, 1491-1521. Colomban Ph., Sagon G., Faurel X., 2001, Differentiation of Antique Ceramics from the Raman Spectra of their Colored Glazes and Paintings, J. Raman Spectr. 32, 351-60. http://onlinelibrary.wiley.com/doi/10.1002/jrs.704/pdf Colomban Ph, Sagon G, Louchi A, Binous H and Ayed N, 2001a, Identification par Microscopie Raman des Tessons et Pigments de Glaçures de l’Ifryqiya (Dougga : XI-XVIIIe sièecles)., Revue d’ Archeometrie; 25: 101-112. Colomban Ph., 2003a, Polymerization degree and Raman identification of ancient glasses used for jewellery, ceramic, enamels and mosaics, J. Non-Cryst. Solids, 323, 180-187, Colomban Ph., 2003b, Lapis Lazuli as unexpected blue pigment in Iranian Lâjvardina ceramics, J. Raman Spectrosc., 34, 420-423. http://onlinelibrary.wiley.com/doi/10.1002/jrs.1014/pdf Colomban Ph., March G., Mazerolles L., Karmous T., Ayed N., Ennabli A.,Slim H., 2003c, Raman Identification of Materials used for Jewellery and Mosaics in Ifriqiya, J. Raman Spectrosc., 34, 205-215. http://onlinelibrary.wiley.com/doi/10.1002/jrs.977/pdf Colomban Ph., 2004, Glasses, glazes and ceramics-Recognition of the ancient technology from the Raman spectroscopy in Archaeology and art history, Edwards H.G.M., Chalmers J.M.(Eds), Royal Society of Chemistry, UK, ch.13, p.192. Colomban Ph., Milande V., Lucas H., 2004a, On- site Raman analysis of Iznik pottery glazes and pigments, J. Raman Spectrosc., 32, 68-72. http://onlinelibrary.wiley.com/doi/10.1002/jrs.1163/pdf Colomban Ph., Sagon G., Huy L.Q., Liem N.Q., Mazerolles L., 2004b, Vietnamese (15th century) blue-and-white, tam thai and “luster” porcelains/stoneware : glaze composition and decoration techniques, Archaeometry, 46, 125-136. Colomban, Ph., 2005, Editor, China-Mediterranean Sea : Routes and Exchange of Ceramics prior to 126th century, Taoci, [4], , SFECO –Editions Findakly, Suilly-la-Tour, ISSN 1624-4842 ISBN 2-86805-128-6.

51
Colomban Ph., Schreiber H., 2005, Raman signature modification induced by copper nanoparticles in silicate glass, J. Raman Spectroscopy 36, 884-890, http://onlinelibrary.wiley.com/doi/10.1002/jrs.1379/pdf Colomban Ph, Tournié A., Bellot-Gurlet L., 2006a, Raman identification of glassy silicates used in ceramics, glass and jewellery: a tentative differentiation guide, J. Raman Spectrosc, 37, 841-852. http://onlinelibrary.wiley.com/doi/10.1002/jrs.1515/pdf Colomban Ph., Etcheverry M.-P., Asquier M., Bounichou M., Tournié A., 2006b, Raman identification of ancient stained glasses and their degree of deterioration, J. Raman Spectrosc., 37, 614-626. http://onlinelibrary.wiley.com/doi/10.1002/jrs.1495/pdf Colomban Ph., Tournié A., 2007, On-site Raman identification and dating of ancient/modern stained glasses at the Sainte Chapelle, J. Cult. Herit., 8, 242-256. Colomban Ph., Cherifi S., Dexpert G., 2008, Raman identification of corrosion products on automotive galvanized steel sheets, J. Raman Spectrosc., 39, 881-886. http://onlinelibrary.wiley.com/doi/10.1002/jrs.1927/pdf Colomban Ph., 2009, The use of metal nanoparticles to produce yellow, red and iridescent colour, from Bronze Age to Present Times in Lustre pottery and glass: Solid state chemistry, spectroscopy and nanostructure., J. Nano Research 8, 109-132. Colomban Ph., G. Fellinger, S. Sakariou, to be published, Raman study of Mameluk Mosquee lamps. Davison, C.C. 1973. Chemical resemblance of garden roller and M1 glass beads. African Studies 32:247-257. Davison CC & Clark JD, 1974. Trade wind beads: an interim report of chemical studies. Azania, 9, 75-86. Davison, C.C. 1979. Three chemical groups of glass beads at the Greefswald sites. In: Eloff, J.F. (ed.) Die kultuur van Greefswald. Unpublished report for the Human Sciences Councils., 2: 1-39. Pretoria: University of Pretoria. Edwards H. G. M., Colomban Ph., Bowden B., 2004, Raman spectroscopic analysis of an English soft-paste porcelain plaque-mounted table, J. Raman Spectrosc., 35, 656-661. http://onlinelibrary.wiley.com/doi/10.1002/jrs.1211/pdf Fouche L. 1937, Mapungubwe: ancient Bantu civilization on the Limpopo. Cambridge University Press: Cambridge, 1. Furukawa T. Fox K.E., White W.B., 1981, Raman spectroscopic investigation of the structure of silicate glasses.III Raman intensities and structural units in sodium silicate glasses, J. Chem. Phys., 75, 3226-3237.
52
Francis, P., Jr. 1990. Bead-making in Asia, Part II, Indo-Pacific beads Asian Perspectives, 29(1), 1-24. Gardner GA, 1963. Mapungubwe, II. P. 1-25, 32-35, 81-92, J. L. van Schaik, Pretoria. Gedzeviciûtë V., Welter N., Schüssler, Weiss C., 2009; Chemical composition and colouring agents of Roman mosaic and millefiori glass, studied by electron microprobe analysis and Raman microspectroscopy, Achaeol. Anthropol. Sci., 1, 15-29. Gratuze B., soulier I., Barrandon J.-N., Foy D., 1992, De l’origine du cobalt dans les verres, Revue d’Archéometrie, 16, 97-108. Kirmizi B., Colomban Ph., Quette B., 2010a, On-site analysis of Chinese Cloisonné enamels from fifteenth to nineteenth centuries, J. Raman Spectrosc., 41, 780-790 Kirmizi B., Colomban Ph., Blanc M., 2010b, On-site analysis of Limoges enamels from sixteenth to nineteenth centuries: on attempt to differantiate between genuine artefacts and copies, J. Raman spectrosc., ., 41, 1240-1247.. Konijnendijk W.L., Buster J.H.J.M., 1977, Raman scattering measurements of silicate glasses containing sulphate, J. Non-Cryst. Solids, 23, 401-418 Lenoir M., Grandjean A., Poissonnet S., Neuville D.R., 2009, Quantitation of sulfate solubility in borosilicate glasses using Raman spectroscopy, J. Non-Cryst. Solids, 355, 1468-1473. Mass J. L., Stone R. E., Wypyski M. T., 1998, The mineralogical and metallurgical origins of roman opaque colored glasses, The prehistory and history of glassmaking technology, KingeryW.D. and P. McGray Eds, Ceramics and Civilization VIII. Westerville, Ohio, 121-144. Mass J. L., Wypyski M. T., Stone R. E., 2002, Malkata and lisht glassmaking technologies: towards a specific link between second millennium BC metallurgists and glassmakers, Archaeometry, 44, 5-29. McMillan P., Piriou B., 1982, The structure and vibrational spectra of crytals and glasses in the silica-alumina system, J. Non-Cryst. Solids, 53, 279-298. Meyer A, 1998, The archeological sites of Greefswald: Stratigraphy and chronology of the sites and a history of investigations. V&R Printing Works (Pty) Ltd. Nassau K., 2001, The physics and chemistry of color: the fifteen causes of color, second ed. John Wiley & Sons, New York. Pereira M., de Lacerda-Aroso T., Gomes M.J.M., Mata A., Alves L.C., Colomban Ph., 2009, Ancient Portuguese Ceramic Wall Tiles (« Ajulejos »): Characterization of the Glaze and Ceramic Pigments, J. Nano Research 8, 79-88. Picquenard E., El Jaroudi O., Corset, 1993, J., Resonance Raman spectra of the S3 molecule in sulphur vapour, J. Raman Spectrosc. 24, 11-19.

53
Prinsloo L. C., Wood N., Loubser M., Verryn S. M. C., Tiley S., 2005, Re-dating of Chinese celadon shards excavated on Mapungubwe Hill, a 13th century Iron Age site in south Africa, using Raman spectroscopy, XRF and XRD, J. Raman spectrosc., 36, 806-816. http://onlinelibrary.wiley.com/doi/10.1002/jrs.1367/pdf Prinsloo L. C, Colomban Ph and Tournié A, 2007 The unique “Garden Roller” beads excavated in the Limpopo valley, South Africa. 4th International Conference on the Application of Raman Spectroscopy in Art and Archaeology, Modena, 3 – 7 Sept. 2007. Prinsloo L. C., Colomban Ph, 2008, A Raman spectroscopic study of the Mapungubwe oblates: glass trade beads excavated at an Iron Age archaeological site in South Africa, J. Raman Spectrosc., 39, 79-90. http://onlinelibrary.wiley.com/doi/10.1002/jrs.1816/pdf Ricciardi P., Colomban Ph., Tournié A., Macchiarola M., Ayed N., 2009a, A non-invasive study of Roman age mosaic glass tesserae by means of Raman spectroscopy, J. Archaeo. Sc., 36, 2551-2559. Ricciardi P., Colomban Ph., Tournié A., Milande V., 2009b, Non-destructive on-site identification of ancient glasses: genuine artefacts, embellished pieces or forgeries? J. Raman Spectrosc., 40, 604-617. http://onlinelibrary.wiley.com/doi/10.1002/jrs.2165/pdf Robertshaw P., Wood M., Melchiorre E., Popelka-Filcoff Rachel S., Glascock M. D., 2010, Southern African glass beads: chemistry, glass sources and patterns of trade, J. Archaeological. Sci., 37, 1898-1912. Saitowitz SJ, 1996. Glass beads as indicators of contact and trade in southern Africa ca. AD 900-AD 1250. Unpub. PhD Thesis, University of Cape Town, Cape Town. Saitowitz SJ, Reid DL & Van der Merwe NJ, South African Journal of Science, 1996; 92: 101 Scanu T., Guglielmi, Colomban Ph., 1994, Ion exchange and hot corrosion of ceramic composites matrices: A vibrational and microstructural study, Solid State Ionics, 70-71, 109-120. Sempowski, S. L., Nohe A. W., Moreau 2000, On the transition from tin-rich to antimony-rich European white soda-glass trade beads for the Senecas of Northeastern North America., Journal of Radioanalytical and Nuclear Chemistry 244 (no. 3) 2, 559-566. Sharma S. K., Simons B., Yoder H. S., 1983, Raman study of anorthite, calcium Tschermak’s pyroxene, and gehlenite in crystalline and glassy states, Am. Mineralogist, 68, 1113-1125. Tite M. S., Freestone I., Mason R., Moleara J., Vendrell-Saz M., Wood N., 1998, Lead glazes in Antiquity-Methods of production and reasons for use, Archaeometry, 40, 241-260. Tournié A., 2009, Analyses Raman sur site de verres et vitraux anciens : modélisation, procedures, lixiviation et caractérisation, Thèse Université Pierre et Marie Curie, Paris http://www.ladir.cnrs.fr/pages/theses/These_Aurelie_Tournie.pdf
54
Tournié A., Ricciardi P., Colomban Ph., 2008, Glass corrosion mechanisms: a multiscale analysis, Solid State Ionics, 179, 2142-2154. Van der Sleen WGN, 1956. Trade-wind beads. Man, 56, 27-9 Van Riet Lowe C, 1955. The Glass Beads of Mapungubwe, Archaeological Series No. 9. Union of South Africa: Archaeological Survey. Verità M., 2000, In Medieval mosaics: light, colour, materials, G.S.F. Borsook E., Pagliarulo G., Florence. Vogel J.C, Radiocarbon dating of the Archaeological sites on Greefswald in Meyer A, 1998, The archaeological sites of Greefswald: Stratigraphy and chronology of the sites and a history of investigations. V&R Printing Works (Pty) Ltd, p. 296-301. Ward R., Ed., 1998, Gilded and enamelled glass from the Middle-East, British Museum Press, London, Wood M., 2000, Making connections: relationships between international trade and glass beads from the Shashe-Limpopo Area. South Africa Archaeological society, Goodwin Series 8, 78-90. Wood M., 2005, Glass beads and Pre-european trade in the Shashe-Limpopo-region, Unpublished MsC Thesis, University of the Witwatersrand, Johannesburg. Woodborne S, Pienaar M and Tiley-Nel S, 2009 Dating the Mapungubwe gold. Journal of African Archaeology, 7(1),