rains overview tfiep workshop on emission projections thessaloniki, greece, 30-31 october, 2006...
TRANSCRIPT
RAINS overview
TFIEP Workshop on Emission ProjectionsThessaloniki, Greece, 30-31 October, 2006
Zbigniew KlimontEMEP Centre for Integrated Assessment Modelling (CIAM)

Content
• Principles and type of analysis
• Method and structure of emission calculation
• Data flow
• Calibration
• Projection data
• Examples of projections and arising issues
• More information?
• No conclusions

Cost-effectiveness needs integration
• Economic/energy development (projections)
• State of emission controls, available technologies, costs
• Atmospheric processes
• Environmental sensitivities

The RAINS model:Scenario analysis mode
Energy/agriculture projections
Emissions
Emission control options
Atmospheric dispersion
Costs
Driving forces
Health & environmental impact indicators

A multi-pollutant/multi-effect framework
Primary PM
Health impacts:- PM
SO2 NOx VOC NH3
via secondary aerosols
Acidification
Eutrophication
- Ozone
Vegetation damage: - Ozone

Multi-pollutant/multi-effect analysisfor identifying cost-effective policy scenarios
SO2 NOx VOCNH3PM
Health AcidificationEutrophication Ozone
Policy targets
IIASA’s RAINScomputer model

Uniform or effect-based scenarios?
REF
G5/3
G5/2
G5/1
UNIFORMPER CAPITAEMISSIONS
UNIFORM% REDUCTION
0
5
10
15
20
200 250 300 350 400 450 500 550 600
Population exposure index (million persons.ppm.hours)
Co
sts
ab
ov
e R
EF
( Bil
lio
n E
UR
O/y
r)

The cost-effectiveness approach
Decision makers
Decide about•Ambition level (environmental targets)
•Level of acceptable risk
•Willingness to pay
Models help to separate policy and technical issues:
Models
Identify cost-effective and robust measures:
• Balance controls over different countries, sectors and pollutants
• Regional differences in Europe
• Side-effects of present policies
• Maximize synergies with other air quality problems
• Search for robust strategies

Emission sources (1)
• Several sectors: – energy
– industrial production
– transport
– solvent use
– agriculture
• Activities– fuels (17)
– processes (~70)
– other (e.g., livestock farming, paint use)

Emission sources (2)Criteria for aggregation
RAINS applies five criteria:
• Importance of source (>0.5 percent in a country)
• Possibility for using uniform activity rates and emission factors
• Possibility of establishing plausible forecasts of future activity levels
• Availability and applicability of “similar” control technologies
• Availability of relevant data
In spite all that effort….about 1500 emission categories included.
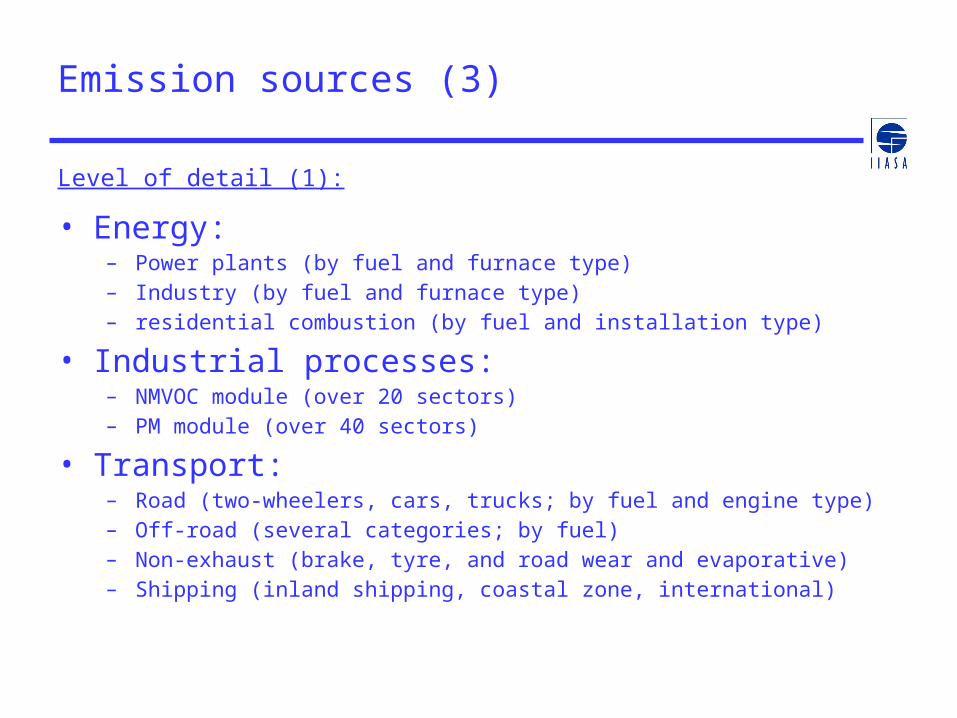
Emission sources (3)
Level of detail (1):
• Energy: – Power plants (by fuel and furnace type) – Industry (by fuel and furnace type) – residential combustion (by fuel and installation type)
• Industrial processes:– NMVOC module (over 20 sectors)– PM module (over 40 sectors)
• Transport:– Road (two-wheelers, cars, trucks; by fuel and engine type)– Off-road (several categories; by fuel)– Non-exhaust (brake, tyre, and road wear and evaporative)– Shipping (inland shipping, coastal zone, international)

Emission sources (4)
Level of detail (2):
• Agriculture: – Animal categories (by housing type)
– N-Fertilizer application (urea and other fertilizers)
– Industry
– Transport
– Other
• Other:– NMVOC module (e.g., evaporative losses from fuel distribution, paint
use, waste burning, etc.)
– PM module (agriculture, waste burning, storage and distribution of fuels and industrial products, etc.)

Emission sources (5)EXAMPLE: VOC processes/sources
Solvent use:• Dry cleaning and degreasing• Decorative paints• Industrial paint application• Vehicle manufacturing and
repair• Printing• Manufacture of paints, inks
and glue• Preservation of wood• Chemical industry• Tyre production• Pharmaceutical industry• Domestic use of solvents• Other
Oil production and use:• Off- and on- shore
exploration• Refineries• Storage of crude and
products• Distribution of products
(e.g., gasoline stations)
Mobile:• Evaporative emissions from
gasoline engines• Exhaust emissions from road
and off-road vehicles

Method - Calculating emissions
mkj
mkjiymykjikjimkj
ymkjiyi XeffefAEE,,
,,,,,,,,,,,
,,,,, )1(
where:
i,j,k,m,y Country, sector, fuel, abatement technology, pollutant Ei,y Emissions in country i and pollutant (species) y A Activity in a given sector ef “Raw gas” emission factor effm Reduction efficiency of the abatement option m Xm Implementation rate of the considered abatement measure m

Method - Information on the level of activity
• Historical (1990,1995,2000) – statistics, communication with national experts, own assessments
• Forecasts (until 2030) – energy models, agricultural models, countries’ submissions

Method – emission factors
• “Unabated” emission factors for anthropogenic sources only
• Country/region specific factors taken into account wherever possible, i.e.:
– For SO2: fuel characteristics
– For PM: fuel and installation characteristics
– For NH3: N-excretion and volatilization, production efficiency, housing period
– For NMVOC: climatic conditions, volatility of fuels, solvent content of products

Method – abatement techniques
• Economic and technical information for “technical” measures
• For most techniques efficiency assessed from literature and communication with experts, however, country/region specific factors taken into account when necessary, i.e.:
– For NH3: geophysical conditions, feeding strategies
– For NMVOC: sector “composition”, solvent content of products
• Introduction of “applicability” parameter, i.e., maximum technically feasible application rate of control option
• Actual and projected penetration rate of control technology

Expert Groups
Data flow
National Inventory
UNECE - LRTAP UNFCCC
EU - NECD
Industrial inventory
EU – Solvent D.
EU – LCPD
EU – IPPC/EPER
EU – Other
Emissions
EMEP (Verification)
Parameters, e.g, abatement efficiencies
RAINS modelNationalExperts
IndustrialExperts
Activity data, emissions, abatement penetration

Changes in national emission inventories for 2000 - NEC vs. earlier assessment (1)
0%
20%
40%
60%
80%
100%
120%
140%
160%
180%
Au
str
ia
Be
lgiu
m
Fra
nc
e
Gre
ec
e
Ma
lta
Ne
the
rla
nd
s
Po
lan
d
Po
rtu
ga
l
Sp
ain
Sw
ed
en
Be
lgiu
m
Cy
pru
s
Cze
ch
Re
pu
blic
Fra
nc
e
Ge
rma
ny
Gre
ec
e
Ire
lan
d
Ma
lta
Po
lan
d
Po
rtu
ga
l
Sw
ed
en
UK
Be
lgiu
m
Fra
nc
e
Ne
the
rla
nd
s
Po
rtu
ga
l
Sw
ed
en
UK
Earlier NEC
SO2 NOx PM
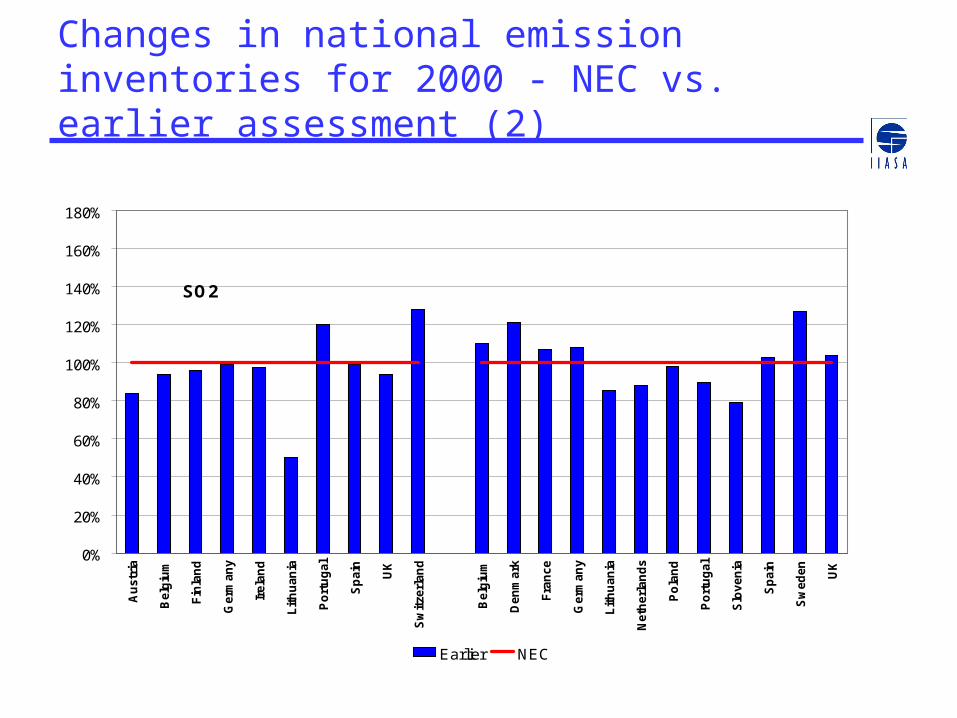
Changes in national emission inventories for 2000 - NEC vs. earlier assessment (2)
0%
20%
40%
60%
80%
100%
120%
140%
160%
180%
Au
str
ia
Be
lgiu
m
Fin
lan
d
Ge
rma
ny
Ire
lan
d
Lit
hu
an
ia
Po
rtu
ga
l
Sp
ain
UK
Sw
itze
rlan
d
Be
lgiu
m
De
nm
ark
Fra
nce
Ge
rma
ny
Lit
hu
an
ia
Ne
therl
an
ds
Po
lan
d
Po
rtu
ga
l
Slo
ve
nia
Sp
ain
Sw
ed
en
UK
Earlier NEC
NH3SO2
VOC

National assessments vs. RAINS estimate for 2000
0%
20%
40%
60%
80%
100%
120%
Au
stri
a
Bel
giu
m
Cyp
rus
Cze
ch R
ep.
Den
mar
k
Est
on
ia
Fin
lan
d
Fra
nce
Ger
man
y
Gre
ece
Hu
ng
ary
Irel
and
Italy
Lat
via
Lith
uan
ia
Lu
xem
bo
urg
Mal
ta
Net
her
lan
ds
Po
lan
d
Po
rtu
gal
Slo
vaki
a
Slo
ven
ia
Sp
ain
Sw
eden U
K
EU
-25
National estimates RAINS estimate
0%
20%
40%
60%
80%
100%
120%
140%
Au
stri
a
Bel
giu
m
Cyp
rus
Cze
ch R
ep.
Den
mar
k
Est
on
ia
Fin
lan
d
Fra
nce
Ger
man
y
Gre
ece
Hu
ng
ary
Irel
and
Ital
y
Lat
via
Lit
hu
ania
Lu
xem
bo
urg
Mal
ta
Net
her
lan
ds
Po
lan
d
Po
rtu
gal
Slo
vaki
a
Slo
ven
ia
Sp
ain
Sw
eden U
K
EU
-25
National estimates RAINS estimate
0%
20%
40%
60%
80%
100%
120%
Au
stri
a
Bel
giu
m
Cyp
rus
Cze
ch R
ep.
Den
mar
k
Est
on
ia
Fin
lan
d
Fra
nce
Ger
man
y
Gre
ece
Hu
ng
ary
Irel
and
Ital
y
Lat
via
Lit
hu
ania
Lu
xem
bo
urg
Mal
ta
Net
her
lan
ds
Po
lan
d
Po
rtu
gal
Slo
vaki
a
Slo
ven
ia
Sp
ain
Sw
eden U
K
EU
-25
National estimates RAINS estimate
SO2 NOx
NH3 NMVOC

PM emissions – national assessment vs. RAINS estimate for 2000
0%
20%
40%
60%
80%
100%
120%
140%
Au
str
ia
Be
lgiu
m
Cy
pru
s
Cze
ch
Re
p.
De
nm
ark
Es
ton
ia
Fin
lan
d
Fra
nc
e
Ge
rma
ny
Gre
ec
e
Hu
ng
ary
Ire
lan
d
Ita
ly
La
tvia
Lit
hu
an
ia
Lu
xe
mb
ou
rg
Ma
lta
Ne
the
rla
nd
s
Po
lan
d
Po
rtu
ga
l
Slo
va
kia
Slo
ve
nia
Sp
ain
Sw
ed
en
UK
EU
-25
National estimates PM2.5 RAINS estimate
PM10TSP

Input data for projections
Driving forces • National information on projected energy (21),
agricultural (18) and other activities• European models:
– Energy and macroeconomic assumptions - PRIMES,– Agriculture - CAPRI, FAO, EFMA,– Transport - TREMOVE
• Other sources, e.g., industry (solvents), CEPMEIP
Parameters• Penetration of abatement techniques• Changes in efficiency of production• Applicability of abatement

Problems and uncertainties(SOx, NOx, PM)
• Transport – Veh-km and vehicle numbers often inconsistent with fuel consumption. Projections of vehicle numbers available only for a few countries
• Differences in reporting transport emissions – fuel sold vs. fuel used. For NEC fuel sold was taken
• PM estimates – some countries don’t report PM2.5 and PM10; often not all sources included
• Poor information on size an chemical speciation for several sources
• Larger uncertainty for un- or poorly regulated sources, i.e., industrial processes, off-road, domestic
• Availability of data on biomass use• ‘Real life’ reduction efficiencies, e.g., NOx-HDT, PM-DPM
Problems and uncertainties(NH3)
• For few countries issue of base year statistical data; inconsistencies between national and international data
• Poor information on housing systems in place and their future evolution
• Contradictory information on how existing legislation is or will be implemented
• Emissions from non-agricultural sources not always reported
• For a number of countries better information on current practices could lead to significant improvements, i.e., development of national emission factors

Changes in ammonia emissions for different activity projections
EU-25
80%
90%
100%
110%
2000 2005 2010 2015 2020
NEC Baseline
CAFE-N
CAP1

Comparison of agricultural activity projectionsExample for Dairy cows
Dairy cows EU15
0.7
0.8
0.9
1.0
1.1
2000 2005 2010 2015 2020
Years
he
ad
s/h
ea
ds
in 2
00
0
Dairy cows - CAFE
Dairy cows - CAP1
Dairy cows - NEC
Dairy cows - CAP2
Dairy cows NMS
0.7
0.8
0.9
1.0
1.1
2000 2005 2010 2015 2020
Years
he
ad
s/h
ea
ds
in 2
00
0Dairy cows - CAFE
Dairy cows - CAP1
Dairy cows - NEC
Dairy cows - CAP2
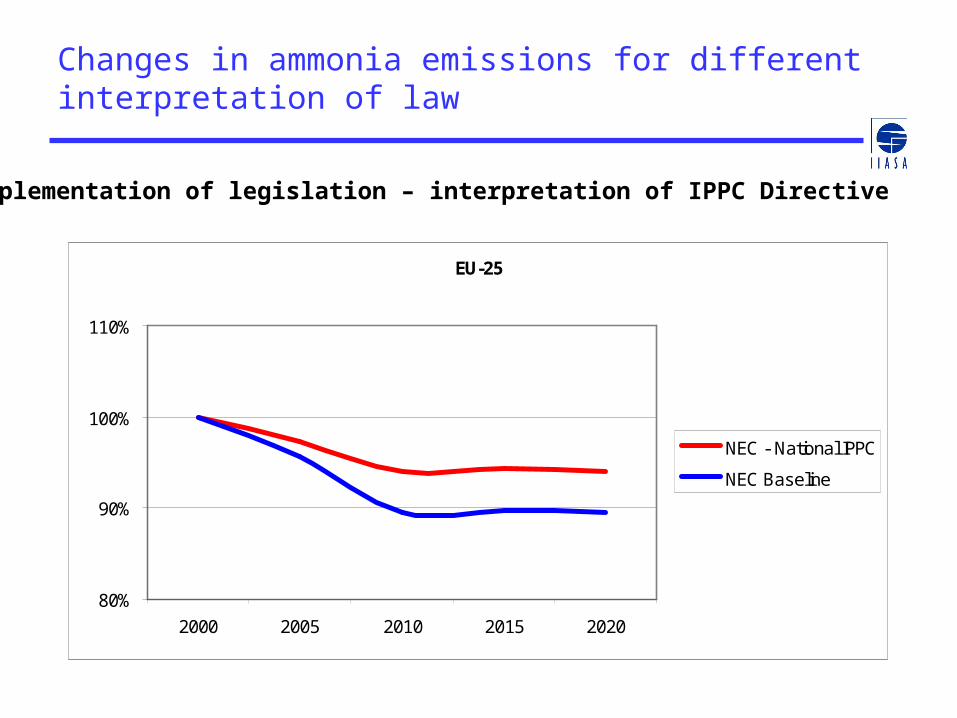
Changes in ammonia emissions for different interpretation of law
Implementation of legislation – interpretation of IPPC Directive
EU-25
80%
90%
100%
110%
2000 2005 2010 2015 2020
NEC - National IPPC
NEC Baseline

Changes in ammonia emissions for different interpretation of law
Implementation of legislation – interpretation of IPPC Directive
ITALY
80%
90%
100%
110%
2000 2005 2010 2015 2020
NEC - National IPPC
NEC Baseline
UNITED KINGDOM
80%
90%
100%
110%
2000 2005 2010 2015 2020
NEC - National IPPC
NEC Baseline
POLAND
80%
90%
100%
110%
2000 2005 2010 2015 2020
NEC - National IPPC
NEC Baseline

Problems and uncertainties(NMVOC)
• Unsatisfactory resolution of emission reporting format does not allow for verification of emissions from solvent use
• Evaporative emissions from cars, residential combustion and solvent use contribute most to the uncertainty of 2000 estimates; the latter two retain their importance for 2020 calculations
• Better information on combustion technology used in residential sector essential for future work
• National projections for emissions from solvent use remain an exception; industry provided their perspective for a number of sectors and MS
• Emissions from open biomass burning often not included• Better collaboration between industrial associations and
national emission experts could lead to significant improvements

NMVOC emission trends (example for coating sector)national vs. industrial perspective
Country A
0%
20%
40%
60%
80%
100%
2000 2005 2010 2015 2020
PAINT - National
PAINT - Industry
Country B
0%
20%
40%
60%
80%
100%
2000 2005 2010 2015 2020
National
Industrial

More information
The background information available from:
• Home of RAINS:http://www.iiasa.ac.at/rains/
• The RainsWeb on line model: http://www.iiasa.ac.at/web-apps/apd/RainsWeb
• The RAINS documentation:http://www.iiasa.ac.at/rains/databases.html
• The RAINS review: http://www.iiasa.ac.at/rains/review