radon gas nature, measurement, and hazards · pdf fileradon gas nature, measurement, and...
TRANSCRIPT

- 0 -
Salman Bin AbdulAziz University
Faculty of Science and
Humanitarian Studies
Physics Department
Radon Gas
Nature, Measurement, and
Hazards
Submitted by
Abdullah Akhatany Adel Elfifi Raied Abdou Elesserie
Advisor
Dr. Ahmed M. Maghraby
1436 H

- 1 -

- 2 -
Abstract
Radon is the only radioactive gas which can be found widely distributed in
nature. In this work, there is a review on the nature of radon gas, isotopes of
radon and sources of radon in nature, its possible hazards, and a brief
account on measurements techniques. Radon also may possess some
beneficial uses in mining and earthquake prediction; some of these
applications were highlighted within the scope of this review. Radon levels in
Alkharj city were evaluated in a recent study, levels of different areas within
Alkharj were presented in this review. It is of much importance to increase
public awareness about radon because of its serious impacts on human life.

- 3 -
Contents
Subject Page
Abstract 2
Contents 3
Chapter one (Introduction) 4
Chapter two (Radon Sources) 9
Chapter three (Radon Hazards and applications) 18
Chapter four (Radon measurements) 26
Conclusion 40
References 41

- 4 -
Chapter One
Introduction 1.1. Radon gas discovery:
In 1899 Pierre and Marie Curie reported about the emanation of a gas
from radium, however, Radon was discovered by Fredrich E. Dorn in Halle,
Germany in 1900 where he had described this gas as a radium emanation
because it rises up from the element radium, and thus it is the fifth radioactive
lement discovered after Uranium, Thorium, Radium, and Polonium. Later on,
William Ramsay and Robert Gray isolated the gas and named it (Niton).
Rutherford also noticed emanation of a radioactive gas from some thorium
compounds and this gas was named later “Thorium Emanation”, similarly,
Andres-Louis Debierne observed such gas from Actinium and called it
“Actinium Emanation”.
Several names were suggested for these three gases, the most famous were in
1920 they were named Radon (Rn), Thoron (Tn), and Actinon (An), these
names were accepted by the International Union of Pure and Applied
Chemistry (IUPAC) in 1923. Later, when isotopes were numbered and were
given the names of the most stable isotopes, the three discovered gases were
named according to the most stable isotope (Radon), while thoron was
renamed as 220
Rn, and action was renamed 219
Rn.

- 5 -
1.2. Physical Properties of Radon:
Radon is an odorless, colorless, and tasteless gas, hence, merely
human senses cannot detect it. Radon gas density is 9.73 kg/m3 at standard
temperature and pressure (STP) which is about 8 times the density of air at
sea level (1.217). Radon which is of atomic number (86) is one of the densest
gases at STP, and is the densest noble gas. Its melting point is 202 K (-71 oC)
and its boiling point is 211.5 K (-61.7 oC). When cooled below its freezing
point, Radon emits a brilliant radioluminescence that turns from yellow to
orange-red as the temperature decreases. Radon is moderately soluble in
water and is more soluble in organic liquids than water.
1.3. Isotopes of Radon:
Since its first discovery in 1900, 39 Radon isotopes were
discovered ranging from 193
Rn to 231
Rn. Although there is no stable isotope
for Rn, the most stable one is 222
Rn which is the decay product of 226
Ra,
within the uranium series where it is of the longest half-life (3.82 day) and
this is the isotope we usually refer to when talking about Radon.

- 6 -
Table (1) presents the known isotopes of Radon gas indicating their historic
names, half life time, the isotopic mass (in atomic mass unit, u), decay mode
and the daughter product of each.
Table (1): Isotopes of Radon and some of their physical properties.
Nuclide
Symbol
Historic
Name Isotopic mass (u)
Half-life
Decay
Mode(s)
Daughter
Isotope(s)
195
Rn
195.00544(5) 6 ms
195mRn
6 ms
196Rn
196.002115(16)
4.7(11) ms α
192Po
[4.4(+13-9) ms] β+ (rare)
196At
197Rn
197.00158(7)
66(16) ms α 193
Po
[65(+25-14) ms] β+ (rare)
197At
197mRn
21(5) ms α 193
Po
[19(+8-4) ms] β+ (rare)
197At
198Rn
197.998679(14) 65(3) ms
α (99%) 194
Po
β+ (1%)
198At
199Rn
198.99837(7) 620(30) ms
α (94%) 195
Po
β+ (6%)
199At
199mRn
320(20) ms
α (97%) 195
Po
β+ (3%)
199At
200Rn
199.995699(14) 0.96(3) s
α (98%) 196
Po
β+ (2%)
200At
201Rn
200.99563(8) 7.0(4) s
α (80%) 197
Po
β+ (20%)
201At
201mRn
3.8(1) s
α (90%) 197
Po
β+ (10%)
201At
IT (<1%)
201Rn
202Rn
201.993263(19) 9.94(18) s
α (85%) 198
Po
β+ (15%)
202At
203Rn
202.993387(25) 44.2(16) s
α (66%) 199
Po
β+ (34%)
203At
203mRn
26.7(5) s
α (80%) 199
Po
β+ (20%)
203At
204Rn
203.991429(16) 1.17(18) min
α (73%) 200
Po
β+ (27%)
204At
205Rn
204.99172(5) 170(4) s
β+ (77%)
205At
α (23%) 201
Po 206
Rn
205.990214(16) 5.67(17) min α (62%) 202
Po

- 7 -
β+ (38%)
206At
207Rn
206.990734(28) 9.25(17) min
β+ (79%)
207At
α (21%) 203
Po 207m
Rn
181(18) µs
208Rn
207.989642(12) 24.35(14) min
α (62%) 204
Po
β+ (38%)
208At
209Rn
208.990415(21) 28.5(10) min
β+ (83%)
209At
α (17%) 205
Po 209m1
Rn
13.4(13) µs
209m2Rn
3.0(3) µs
210Rn
209.989696(9) 2.4(1) h
α (96%) 206
Po
β+ (4%)
210At
210m1Rn
644(40) ns
210m2
Rn
1.06(5) µs
210m3Rn
1.04(7) µs
211Rn
210.990601(7) 14.6(2) h
α (72.6%) 207
Po
β+ (27.4%)
211At
212Rn
211.990704(3) 23.9(12) min
α 208
Po
β+β
+ (rare)
212Po
213Rn
212.993883(6) 19.5(1) ms α
209Po
214Rn
213.995363(10) 0.27(2) µs
α 210
Po
β+β
+ (rare)
214Po
214mRn
245(30) ns
215
Rn
214.998745(8) 2.30(10) µs α 211
Po 216
Rn
216.000274(8) 45(5) µs α 212
Po 217
Rn
217.003928(5) 0.54(5) ms α 213
Po 218
Rn
218.0056013(25) 35(5) ms α 214
Po
219Rn
Actinon
219.0094802(27) 3.96(1) s α 215
Po Actinium
emanation
220Rn
Thoron
220.0113940(24) 55.6(1) s
α 216
Po
Thorium
emanation β
-β
- (rare)
220Ra
221Rn
221.015537(6) 25.7(5) min
β- (78%)
221Fr
α (22%) 217
Po
222Rn
Radon[n 5]
222.0175777(25) 3.8235(3) d α 218
Po
Radium emanation
Emanation
Emanon
Niton 223
Rn
223.02179(32)# 24.3(4) min β-
223Fr
224Rn
224.02409(32)# 107(3) min β
-
224Fr
225Rn
225.02844(32)# 4.66(4) min β
-
225Fr
226Rn
226.03089(43)# 7.4(1) min β
-
226Fr
227Rn
227.03541(45)# 20.8(7) s β
-
227Fr
228Rn
228.03799(44)# 65(2) s β
-
228Fr
229Rn
229.0426536(141) 12 s

- 8 -
Chapter Two
Radon Sources 2.1. Decay chains:
Most radioactive isotopes do not decay directly to a stable product, instead
they follow a long or a short series of transformations through which emission of
radiation occur before reaching the stable isotope, and such transformations are
called decay chains. The most common decay families (or decay chains) are
thorium series, uranium series (sometimes called radium series), actinium series,
and neptunium series.
Figure (1) represents the four series indicating the decay mode, daughter, half life
time.
From these figures, it was found 222
Rn isotope which is the most stable one is a
decay product of radium, 226
Ra within the Uranium series (Uranium -238). On the
other hand, the most stable Radon isotope in Thorium series is 220
Rn which
sometimes called ‘thoron’, its half life time is 55.6 s, while in Actinium series, the
most stable Radon isotope is 219
Rn and is called action with half life time of about
3.96 s. in Neptunium series, no significant Radon isotope can be noticed although
the presence of traces of 217
Rn (http://www.wikipedia.org).

- 9 -
(a) (b)
(c) (d)
Figure (1): the most comon four decay chains, a: Thorium series , b: Uranium (Radium) series, c: Neptonium series, and d: Actinium series.
- 10
-
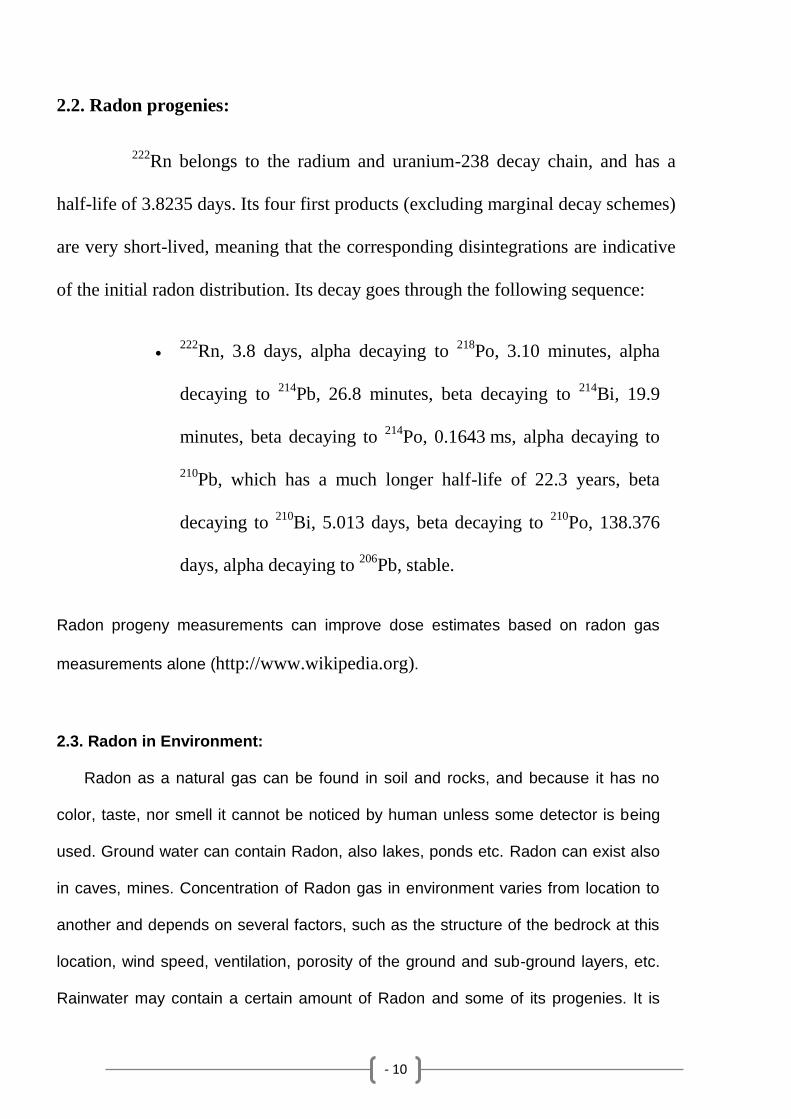
2.2. Radon progenies:
222Rn belongs to the radium and uranium-238 decay chain, and has a
half-life of 3.8235 days. Its four first products (excluding marginal decay schemes)
are very short-lived, meaning that the corresponding disintegrations are indicative
of the initial radon distribution. Its decay goes through the following sequence:
222
Rn, 3.8 days, alpha decaying to 218
Po, 3.10 minutes, alpha
decaying to 214
Pb, 26.8 minutes, beta decaying to 214
Bi, 19.9
minutes, beta decaying to 214
Po, 0.1643 ms, alpha decaying to
210Pb, which has a much longer half-life of 22.3 years, beta
decaying to 210
Bi, 5.013 days, beta decaying to 210
Po, 138.376
days, alpha decaying to 206
Pb, stable.
Radon progeny measurements can improve dose estimates based on radon gas
measurements alone (http://www.wikipedia.org).
2.3. Radon in Environment:
Radon as a natural gas can be found in soil and rocks, and because it has no
color, taste, nor smell it cannot be noticed by human unless some detector is being
used. Ground water can contain Radon, also lakes, ponds etc. Radon can exist also
in caves, mines. Concentration of Radon gas in environment varies from location to
another and depends on several factors, such as the structure of the bedrock at this
location, wind speed, ventilation, porosity of the ground and sub-ground layers, etc.
Rainwater may contain a certain amount of Radon and some of its progenies. It is

- 11
-
believed that Radon concentration in rainwater occurs during thunderstorms,
estimates of the raindrop age could be obtained by evaluating the abundance of
radioisotopes of Radon short lived decay progenies in rainwater. Figure (2)
represents the ratio of Radon compared to other sources of radiation.
Figure (2): Radon comprises 55 % of the total radiation sources on the earth, blue represents the
natural radiation, sources and yellow represents the artificial radiation source.
2.4. Radon in gas and oil industry:
Residues from the oil and gas industry often contain radium and its
daughters. The sulfate scale from wells of oil or gas can be very rich with
radium. Often, water coming out of of oil field is very rich in strontium, barium,
and radium. Hence it is not surprising to find Radon in water, oil, and natural
gas coming out from the wells, all contain Radon which decays to solid
radioisotopes and forms internal layers in pipework, in the oil processing plants,

- 12
-
region of propane is the most contaminated area as the boiling point of propane
similar to that of Radon.
2.5. Radon in mines and caves:
In general, hard rock mining is a dangerous routine where the
possibility of emanation of Radon gas increases, however, the certain and
proved danger is the uranium mining where highly radioactive product
daughters are releases including Radon gas. Now, legislation ensures the level of
Radon in the air of mines by the use of proper ventilation, allowing limited time
exposure of miners and compensation. The unit of exposure to Radon gas
(Working level month, WLM) is derived from the miners work bearing
permitted level in one month (equivalent to 170 hours), more about this unit will
be discussed in a following chapter. In some mines, Radon level can reach 400 –
700 kBq/m3.
2.5. Radon and indoor environment:
Radon was discovered accidentally in dwellings in 1984 where one of
workers in Limerick nuclear power plant in Pennsylvania has notice the high
readings of his Geiger counter in his house, while authorities spent long time
searching for the nuclear plant source, they discovered that the source was
highly increased level of Radon in his basement.
2.5.1. Sources of indoor Radon:

- 13
-
Although variations in Radon levels in dwellings, depending on the type,
ventilation rates, insulations, and other factors, sources of Radon in dwellings
can be summarized briefly in the following points:
2.5.1.1. Soil:
It is the main source of Radon in highly elevated indoor radon levels, the soil
surrounding the dwelling where it comprises about 64 % of indoor Radon
sources. Gas flow through the soil depends on the soil type, gas concentration,
and the sub-slab pressure. One of good practices in this issue is to depressurize
the flowing gas and applying proper insulations.
2.5.1.2. Water:
Since radium is widely distributed in the earth's crust, and it could be
found in minerals that come in contact with groundwater. Subsequently, Radon,
which is soluble in water, is found in groundwater, in some cases, significant
concentrations have been observed.
Use and heating of water containing dissolved Radon and/or radium containing
water results in the release of Radon into indoor air.
2.5.1.3. Outdoor air:
The outdoor air concentration of Radon forms the minimum value of the
indoor Radon concentration, to which other sources may add. Outdoor radon
concentrations have been observed to vary seasonally, diurnally, and according
to the geographical location, altitude. There are daily variations for example
ground floors are the highest in early morning hours when atmosphere is stable

- 14
-
and the lowest in midafternoon as the air temperature varies fast, similar
seasonal variations were noticed. Annual average concentrations at 1-2 meters
above the ground was found to be within the range (0.6 – 28 Bq.m-3
).
2.5.1.4. Building materials:
As radium is widely distributed within the earth crust, it exists in all building
materials on the earth in trace amounts including rocks, gypsum, phosphate slag,
even woods taken from plants were planted in radium rich areas, etc.
2.5.1.5. Natural gas:
Similar to the case of the groundwater, natural gas can accumulate Radon
from surrounding rocks and deposited layers and mixed with it during gas
formation. Almost Radon decays during the transfer of natural gas through
pipes, at the outlet; it is almost decay products can be found. Figure (3)
represents the percentage pie chart contribution of the most important Radon
sources in the indoor environment. Also Figure (4) represents pathways of
Radon to indoors.

- 15
-
Figure (3): Different sources contributing in Radon concentrations inside dwellings.
Figure (4): Pathways of radon to indoor environment.

- 16
-
2.5.2. Reduction of Radon in indoor environment:
If radon level in a house is higher than 4 pCi/L (equivalent to about 148
Bq/m3) then acting on the lowering Radon concentration is recommended by the
Environmental Protection Agency (EPA), USA. There are some techniques for
the reduction of Radon level in indoor environments including but not limited
to: sealing all cracks, openings, and other possible pathways to the dwellings,
implementing system of vents and fans for sub-slab depressurization of Radon
indoors, design of this system may vary according to several factors such as
dwelling type, design, building materials. Increasing smart ventilation
possibilities may help in reduction of Radon level indoors.

- 17
-
Chapter Three
Radon Hazards and Applications 3.1. History:
First description of Radon effect was described in 1530 by Paracelsus as
‘wasting disease of miners’ of unknown cause, afterthought Agricola described
the mountain disease and recommended ventilation for reducing it, later in 1879
that disease was named as lung cancer by Herting and Hesse from Germany.
Significant excess lung cancer deaths were identified within uranium miners
during 1940s and 1950s. Extensive studies were performed in order to estimate
the relation between the incidence probabilities of lung cancer versus Radon
concentrations. However, 2000-6000 Bq/m3 for about 10 years for uranium
miners were enough to show increased frequency of lung cancer.
3.2. Epidemiological studies of lung cancer and Radon:
Health hazards from Radon do not come directly from the gas itself, but due
to the decay products formed, if the gas inhaled, Radon decays inside the air
passages of the lung resulting in the deposition of polonium and lead on nearest
tissues. Lung cancer risk is associated to Radon exposure, and the risk of
malignancy incidence in smokers increases ten folds than that in non-smokers,
however, this ratio increases to twenty folds for heavy smokers. Lung cancer
occurs in multiple histopathological patterns, the most common types of lung

- 18
-
cancer are squamous cell carcinoma, adenocarcinoma, small cell carcinoma, and
large cell carcinoma. The increase of risk in smokers might be attributed to the
possible interaction of Radon progenies with tobacco ingredients smoke; in
addition, particles of smoke may hold decay products of Radon increasing the
possibilities of re-inhalation of such products and in the same time increases the
risk for passively exposed nonsmoking persons.
3.2.1. Studies on miners:
Several studies concerning the relation between the lung cancer incidence
and mining revealed the strong non-linear proportional relationship; most of risk
was estimated in uranium mines, however, other mines of Iron, Magnetite,
Fluorspar, Zinc-lead, Tin, and Niobium. The exposure-response relationship
over a wide range was presented up to 10,000 WLM (Working Level Month,
details of this unit will be presented in the following chapter). Non-linear
response at high concentration values of Radon was attributed to the killing of
the exposed cell by alpha particles, in addition, after leaving the mines
associated risk decreases.
3.2.2. Studies on general population:
In general public, death due to Radon is the main cause in several places in
the world, Figure (5) represents the annual mortality causes in USA in one year,
the Figure clarifies that Radon exposure (leading to about 21,000 deaths per
year) is much a leading cause compared to drowning, drunk driving, etc.

- 19
-
Figure (5): A histogram representing main factors leading to death in one year, USA.
Although it is difficult to investigate the exposure to Radon in dwellings due to
the variations in life style even within the same region, category, or family,
several studies were performed and modelled for confirming the response-
exposure relationship. In on study in Sweden, in a rural area and it was proved
that people who live in a stone houses were assumed to be most exposed and
those who live in wooden houses are least exposed. Other studies were
performed considering age, sex, and smoking were performed.
3.2.3. Studies on Animals:

- 20
-
Animal studies enable intentional exposure of experimental animals to
different Radon levels with different exposure planning considering several
factors in the study which cannot be controlled in cases of human exposure to
Radon.
In a study using Swiss albino rats, rats received Radon doses in the range (13.01
– 65.05) WLM, cytogenetic effects due to inhalation of Radon clarified the
formation of different type of chromosomal aberrations where chromosome and
chromatin breaks dominates in bone marrow mitotic cells.
3.2.4. Risk assessment:
United Nations Scientific Committee on the Effects of Atomic Radiation
(UNSCARE) recommended the limit of 9 nSv (corresponding to 1 Bq h/m3),
while living permanently (8760 h per year) in a high level Radon area (1000
Bq/m3) resulting in receiving about 80 mSv. Several models were proposed for
estimating risks from Radon such as UNSCARE, ICRP65 (produced by the
International Committee of Radiation Protection), and BEIR VI model which
was produced by the National Academy of Science (NAS, USA) which is the
most sophisticated model considering sexual differences, smoking habits, age,
and time elapsed since exposure. According to BEIR VI model, the absolute risk
of lung cancer for age of 75 at normal Radon concentrations of 0, 100, and 400
Bq/m3 would be about 0.4%, 0.5%, and 0.7%, respectively, for lifelong
nonsmokers, and about 25 times greater (10%, 12%, and 16%) for smokers.
3.2.5. Other health effects:

- 21
-
Radon impacts on human health is not limited to the risk of lung cancer,
other organs/systems might be affected: lung cancer at other sites, nonmalignant
respiratory diseases, renal diseases, and fertility. Because it is difficult to
correlate these effects to over exposure to Radon experimental animals were
used to provide evidences. Radon itself can be absorbed by blood but it can not
result in a significant dose to nonpulmonary tissues, however, radon decay
products deliver their alpha energy to the pulmonary tissues and even can be
translocate from the lungs causing adverse effects at distant sites. Few studies
related the incidence of skin cancer to radon exposure, others reported the
induction of stomach cancer.
3.3. Applications of Radon:
There are several benefits of Radon gas; these benefits can be summarized in
the following points:
3.3.1. Earthquake prediction:
Real-time monitoring of Radon was found to give signs prior to
earthquakes. Some movements and strain change within or beneath the earth
crust prior or during earthquakes lead to enhance emanation of Radon in soil gas
and groundwater. It is believed that the Radon is released from cavities and
cracks as earth’s crust is strained prior to the sudden slip of the earthquakes.
Figure (6) represents a typical station structure used for radon measurements in
soil, and Figure (7) represents a chart of radon concentration close to Marmara,
turkey before some seismic activities (Hussein, A. S. 2008).

- 22
-
3.3.2. Geothermal energy may be defined as the natural heat of earth trapped
close to the earth’s surface to be extracted. Geothermal energy might be related
to volcanic activities where some signs may refer to which such as hot springs,
vapors or high Radon levels which indicates the possible existence of a
geothermal energy sources underneath the earth’s surface (Hussein, A. S. 2008).
3.3.3. Radon in medicine:
The stimulation of DNA repair was observed upon radon exposure,
similar DNA repair was noticed in lymphocytes of people living in increased
radon concentrations. Therapy uses of radon may involve the intake of radon gas
either through inhalation or by transcutaneous resorption of radon dissolved in
water. Most of the radon is subsequently discharged through exhalation, but a
small amount remains in the body as radioactive radon progeny, which are
physiologically active through their continued decay. In USA, radon therapy can
be obtained only by inhalation in four old mines near the small towns of Boulder
and Basin, Montana. In Europe, radon therapy is available in multiple forms,
including baths, steam, and inhalation in curative tunnels and mines. Spas
evidently containing radon have been used with success for hundreds of years
for special illnesses mainly in the pain therapy of chronic rheumatic illnesses
(Barbra E. Erickson, 2007). There should be a balance about how much the
radon impacts or damages the tissue, so that any radon spa treatments should be
given by a medical practitioner.

- 23
-
Figure (6): A station of collecting radon as an indicator of earthquakes (Hussein, A. S. 2008).
Figure (7): Record of radon concentration close to the active tectonic fault in Marmara
region of Turkey before several seismic activities.

- 24
-
3.3.4. Geological and atmospheric studies:
The physical characteristics of radon make it a reliable indicator of the air
mass which is in contact with earth. Simulation of radon transport is currently
one of the best tools for the evaluation of transport schemes in regional and
global models. Measurements of radon concentration in the "soil gas' and in
ground water can yield a information regarding the subsurface geological
features and the presence of mineral and oil and gas reserves.

- 25
-
Chapter Four
Measurements of Radon 4.1. Measurement Unit:
SI unit of radon concentration is (Bq/m3) which represents the activity unit
(Bq) in one cube meter, however, the unit for radon decay product exposure rate
is called (working level month, WLM) and can be defined as Any combination
of short-lived radon decay products in one liter of air that will result in the
ultimate emission of 130,000 MeV of potential alpha energy, WLM equal to one
WL for 170 hours and is approximately equal to the total alpha energy released
from the short-lived decay products in equilibrium with 100 pCi of Rn-222 per
liter of air (Niren L. Nagda, 1994).
4.2. Equilibrium Factor:
This factor can be defined as “Ratio of the activity of all the short-lived
radon daughters to the activity of the parent radon gas”; radon daughter
activities are usually less than the radon activity.
The equilibrium factor F is a very important parameter to calculate the dose
equivalent from radon and its daughters.
(1)

- 26
-
Where Ci stands for the ith radon daughter. At secular equilibrium (F=1) which
means that the concentration of all daughters have the same value of
concentrations equal to the radon concentration. In this case all daughters
present in air and do not deposit on the surface of the container or escape from
it. Otherwise, F deviates from unity and 3700 Bq/m-3
of radon gas do not give
the total potential α-energy of 1.3 X 10⁵ MeV and hence the number of WL
decrease by the factor F,
(2)
4.3. Techniques of measurements:
4.3.1 Active Techniques
Active dosimeters are instruments for measuring the concentration in
real time where air is usually pumped through a filter. The active methods are
practically useful for short-term measurements and for detailed investigation of
individual dwelling. These dosimeters can be classified into three techniques
(Ionization, Scintillation and Spectroscopy techniques) that will be discussed in
the following sections.
4.3.1.1 Ionization technique
Ionization chamber is the widely used radiation measurement
technique applied to radon determination by sampling it from atmosphere. This
based on the phenomena that when a charged particle (like alpha particle from

- 27
-
radon ) passes through a gaseous chamber containing a cathode and a collector
anode it leaves large number of ion pairs along its trajectory. The electrons drift
with very large velocity toward the anode and the positive ions drift toward the
cathode forming the ionization current. This current produces a potential drop
across the resistor in the electronic circuit, which is detected and amplified
electronically.
4.3.1.2 Scintillation technique
The tiny light flashes produced by Alpha-particles fitting the phosphor
are collected by a photo-multiplier tube. The photo-multiplier tube translate the
light into an electrical signal which is proportional to the number of incident
alpha particles. Scintillation depends mainly on the length of the counting
period. It improves slightly by the volume of the flask. Lucas cell is one of the
oldest and more reliable techniques, which is based on the scintillation
phenomena.
The equipment in general is a glass vessel internally covered with a scintillating
material such as ZnS. The multiplicity of design and conception is very large.
Shape, size, voltage, external polarized grid, type of amplifying set up, field
strength, etc , are amongst parameters that are found to change from one model
to another. Figure (8) represents a schematic diagram for one of possible designs
of radon monitors.

- 28
-
Figure (8): Schematic diagram of a radon monitor.
4.3.1.3 Spectroscopy technique
Indirect radon determination can be achieved by spectroscopic
technique. Alpha spectrometer is more generally the so called Alpha gross
counting. This method is sensitive to the presence of long lived thoron
daughters, which can be corrected by taking more counts and solving a set of
linear equations. Many hours are required to complete the measurements.
Gamma-spectroscopy allows discrimination between products of Uranium and
Thorium series, which is based on the interaction of Gamma-rays with matter.
The more complex advantage method is the “combined Alpha and Beta particles
spectroscopy” in which the counting of Beta particles from 214
pb and 214
Bi in
scintillator along with Alpha particles spectroscopy with a surface barrier

- 29
-
detector determines the three daughters concentration during a single count
period.
4.3.2 Passive Technique
Passive dosimeter is an instrument for measuring the radon
concentration, where air diffuses to the detector or radiation falls naturally on it.
Passive monitors are of two types: real time and time integrating. Real time
monitors are designed to measure varying radon concentration, usually on an
hourly basis, while the time-integrating monitors yield a single value
representing the average concentration during the exposure period.
With one exception, passive monitors for the detection of 222
Rn are based on the
measurements of the gas and its short-lived daughter products alone. The
passive technique can be used for long periods of monitoring, usually several
months, and the recorded events constitute an integration of the Alpha particle
decays, which have occurred over the full monitoring period. This technique
includes also an intermediate case, which is the adsorption of radon on charcoal
canisters where integration periods of several days are used and the activity is
counted before the decay of 222
Rn, with a half-life of 3.8 days, has progressed so
far (IAEA 2012).
4.3.2.1 Solid State nuclear track detector (SSNTD)
Any detectable Alpha particle produces a single trail of damage in
solid state nuclear track detector SSNTD which turns into a narrow channel after

- 30
-
chemical enlargement to be visible under the microscope. SSNTDs exhibit
different sensitivities to the energy of the Alpha particles emitted by radon. A
concentration as low as 1 pci/l can be assessed by SSNTD exposed to this
concentration for one month. SSNTDs mostly are cellulose ester (nitrate (LR) or
acetate (CN) ) and polycarbonate like bis-phenol-A polycarbonate (Lexan and
Macrofol), polyallyldiglecol carbonate (CR-39), polyethylene, polyvenile
chloridepoly, phenoxide, polyamide and Amber. SSNTDs are insensitive to Beta
and Gamma rays which can’t produce any etchable track but it can be used to
increase the sensitivity and the etching speed. The most drawbacks in the use of
SSNTDs are that they only integrate the record flux of particles and therefore
don’t produce time dependent response. This shortcoming is overcome by
moving the detector step by step by means of an electrical motor, where each
part of the detector strip was irradiated to radon atmosphere for a certain time
period.
SSNTDs have a specific nature led to rapid applications in a wide variety of
fields and have the following advantages:
1. The simplicity of use and of construction compared with Cloud, Bubble and
Spark chambers and even nuclear emulsion.
2. The durability, which makes them particularly valuable for the remote use.
3. Do not need power supply and therefore low in cost.
4. Robustness with minute dimension enables them to use in personal dosimeter.

- 31
-
5. Can be retaining their record after read-out, where their records are stable
when subjected to light or high doses of X-rays, Beta particles, UV radiation,
etc. Figure (10) clarifies tracks of alpha particles in CR-39 (IAEA 2012).
Figure (9): Set-up for measuring radon indoors using SSNTD, (IAEA 2012).
Figure (10): Alpha particles tracks in CR-39.

- 32
-
4.3.2.2 Thermoluminescence detector (TLD).
When an ionizing particle travels within a crystal it ejects some
electrons from their normal position into the conduction band, leaving a hole in
the valence band. The electrons are then trapped into defects of the crystal and
stored there in a very stable position. If, later on, the crystal is heated, the energy
given to the electrons allow them to escape from their traps. They then
recombine with the hole in the valence band, or with recombination centers, by
means of a radiative process: light is emitted which is proportional to the
number of electrons ejected by the incident radiation and hence is proportional
to the concentration or the dose to be determined.
An electrically charged plate is placed at a short distances from the TLD to let
radon daughters deposited on it and decay, this producing energy storage in the
TLD. After a proper exposure to radon rich atmosphere, the TLD is recovered
and ‘read’ in a TLD apparatus. This apparatus is a tiny oven where the
temperature is raised under a very well controlled rate (Niren L. Nagda, 1994).
The amount of light emitted by the TLD falls on the photo-cathode of a photo-
multiplier and is converted into an electrical signal. Each peak of the recorded
spectra corresponding to a particular trap. The amplitude and / or the peak area
is proportional to the irradiation dose. By this technique radon levels as low as
0.02 pCi /l can be measured for sampling carried on over one-week with air
drawn at a rate of one liter per minute.

- 33
-
4.3.2.3 Activated charcoal
Adsorption technique is a radon measurement system based upon the
adsorption of the gas on an adsorbing medium, such as charcoal. The trapped
daughters 214
Bi and 214
Pb can be measured from its Gamma activity.
Adsorption technique employs a plastic Can containing a few grams of activated
charcoal covered with a lid. During the exposure, the lid of the Can is opened
and left in a place for few days (from 4 to 12 days). After exposure the lid is
closed and counting its Gamma activity by means of a NaI scintillation counter.
After a proper calibration of NaI counter, one can determine the radon
concentration from the decay activity curves (Niren L. Nagda, 1994).
It has been found that the amount of adsorbed radon depends on the relative
humidity and the calibration depends on the amount of adsorbed water, water
vapor can be removed by adding a desiccant. The charcoal canister can be
reused with almost zero back ground if it is ‘rinsed’ in an atmosphere of 100
liters of air (kept at about 100 oC). The advantage of such device is the
simplicity of construction and better reproducibility. The exposure of Charcoal
for one week gives better accuracy than the exposure of SSNTD for the same
time period i.e. it can measure a concentration of 1 pCi/l if it is exposed to this
concentration for one week (Niren L. Nagda, 1994).
4.3.2.4 Electret detector
An electret is a piece of dielectric material that exhibit an almost
permanent electrical charge if it is otherwise perturbed. This charge produces a

- 34
-
strong electrostatic field, which is able to collect ions of opposite sign and then
the total charge of the electret decreases. An electret radon monitor is basically
made of steel can, on the inside top of which the electret dosimeter is fixed. At
the bottom of the Can a small inlet allows the radon gas to enter the assembly
through a filter. Decaying away, radon producing ionizing particles that in turn
produce ions within the volume of the device. Such ions are collected and
change the total charge of the electret, where the surface potential is measured.
After a proper calibration, the electret dosimeter can deliver a dose response
curve. The sensitivity and the dynamic range of the detector depend on the
volume of the device chamber and on the thickness of the sensitive material
(Niren L. Nagda,. 1994).
Figure (11): Electret ion chamber (Niren L. Nagda, 1994).
4.4. Radon in Alkharj:
Indoor radon levels and the annual effective dose are measured in Al-kharj
city, Saudi Arabia dwellings using CR-39 detector. The dwellings were
classified according to their types (schools, homes and working area). The

- 35
-
influence of some factors like height and ventilation conditions on indoor radon
levels, equilibrium factor and radon effective doses were studied. Can and bare
method was used for determine the equilibrium factor between radon and its
daughters. The average radon concentration varies from 76 ± 38 Bq m3 in work
places to 114 ± 41 Bq m3 in homes. About 77% of the studied dwellings give
radon concentration in the range from50 to 150 Bqm3. The overall weighted
mean of radon level is equal to 94 ± 41 Bq m3 which is about 2.5 times the
global average. The equilibrium factor has a wide range from 0.1 to 0.6 with
overall weighted average equal to 0.308 ± 0.13. The variety of living style,
constructed materials and ventilation rates are responsible for this wide range
and subsequently the obtained high uncertainty (42%). Homes showed larger
annual effective dose (3.186 ± 0.75 mSv) than other dwellings which locate in
the range of the recommended action level but about three times the global
average. The result shows that the ventilation condition is the major but not the
only factor affects the results. Poor ventilated dwellings showed the maximum
annual effective dose on the other hand the number of floor has insignificant
difference (Ahmed M. Maghraby et al., 2014).
Numbers of tracks recorded, Do, for the filtered detector were converted into the
corresponding radon concentration levels, Co, using the following equation:
tK
DC
T
o
o
(3)

- 36
-
Where t is the exposure time in days and KT is the CR-39 detector calibration
factor for radon measurements. KT was determined by exposing the detector
itself to a standard radon concentration in a radon chamber. Calibration factor
for the used cup dimension was equal to 0.2 0.02 track cm-2
per Bq m-3
d.
Can and bare method is a widely used passive method for evaluation of the
equilibrium factor F. (Planinic et al., 1997) derived many equations of F as a
function of the track-density ratios D/Do, where D and Do are the track density
of bare and diffusion (filtered) detectors respectively, one of the suitable
functions takes the following form:
53.05.0
oD
DF (4)
This equation applies within certain conditions where 1.2 < D/Do< 3. This
function gives no comment about the used diffusion chamber dimension,
although measurement of the indoor radon level is of much importance as
radiation doses received by the human population due to the inhalation of radon
and its progeny constitute more than 50% of total doses from natural radioactive
sources (UNSCEAR, 2000). Different cup dimensions gives different values of
Do (Abo-Elmagd et al., 2006) which affects the value of D/Do, For this reason,
high uncertainty was expected in the measured values of ‘F’ using diffusion
chambers with different dimensions.

- 37
-
For this reason, the following equation for F as a function of D/Do and V/A (cup
volume to internal area) was derived and takes the following form (Abo-Elmagd
and Soliman, 2009):
277.026.0)(15.0
oD
D
AVF (5)
Equation 5 is valid for CR-39 with a critical angle equal to 20o equipped in a
diffusion chamber satisfies the following conditions:
The radii r 3.5 cm.
The height h 10 cm.
0.4 cm ≤ V/A 1.3 cm.
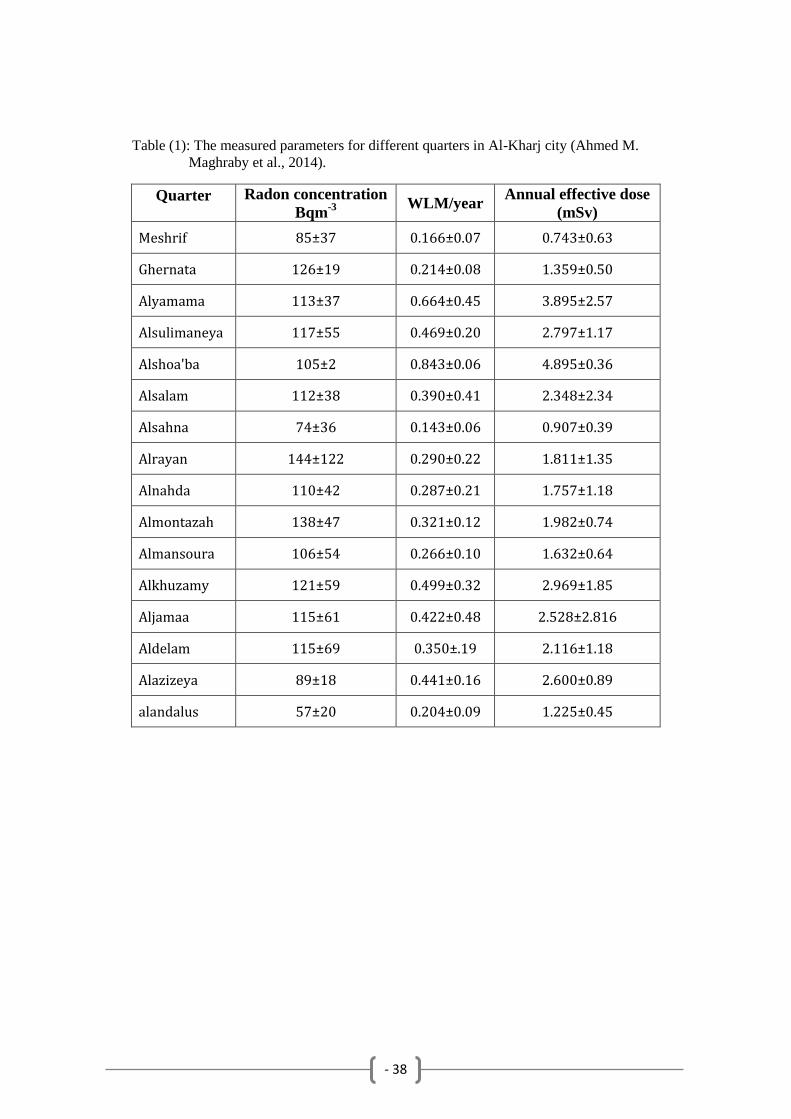
The following table represents radon levels values obtained through radon
survey in Alkharj:
- 38
-
Table (1): The measured parameters for different quarters in Al-Kharj city (Ahmed M.
Maghraby et al., 2014).
Quarter Radon concentration
Bqm-3
WLM/year
Annual effective dose
(mSv)
Meshrif 85±37 0.166±0.07 0.743±0.63
Ghernata 126±19 0.214±0.08 1.359±0.50
Alyamama 113±37 0.664±0.45 3.895±2.57
Alsulimaneya 117±55 0.469±0.20 2.797±1.17
Alshoa'ba 105±2 0.843±0.06 4.895±0.36
Alsalam 112±38 0.390±0.41 2.348±2.34
Alsahna 74±36 0.143±0.06 0.907±0.39
Alrayan 144±122 0.290±0.22 1.811±1.35
Alnahda 110±42 0.287±0.21 1.757±1.18
Almontazah 138±47 0.321±0.12 1.982±0.74
Almansoura 106±54 0.266±0.10 1.632±0.64
Alkhuzamy 121±59 0.499±0.32 2.969±1.85
Aljamaa 115±61 0.422±0.48 2.528±2.816
Aldelam 115±69 0.350±.19 2.116±1.18
Alazizeya 89±18 0.441±0.16 2.600±0.89
alandalus 57±20 0.204±0.09 1.225±0.45

- 39
-
Conclusion Radon gas is the most abundant natural radioactive materials. Radon
possesses serious hazards to human health where it is considered as the second
cause of lung cancer, this is in addition to other health impacts. Indoor radon
may be of several sources, air, water, soil, building materials, mitigation of
indoor radon is important for high radon levels. Radon can be used for
earthquake prediction, geological explorations and uranium mining, and other
useful applications. Measurements of radon and its daughters can be performed
either by active or passive techniques, however, the most usable technique is
registration of alpha tracks because of its accuracy, efficiency, and low cost.
Radon levels in Alkharj city are very high compared to the international average
which reflects the abundance of the bedrock in Alkharj with uranium. It is
recommended to increase awareness in Alkharj about radon hazards and
mitigation procedures.

- 40
-
References
Abo-Elmagd, M., & Soliman, H. A. (2009). Measurement of the equilibrium factor
between radon and its short-lived products using CR-39 detector. Isotopes and Radiation
Research, 41(4), 823-831.
Abo-Elmagd, M., Metwally, S. M., Elmongy, S. A., Salama, E., & El-Fiki, S. A. (2006).
External and internal exposure to natural radiation inside ancient Egyptian tombs in
Saqqara. Radiation Measurements, 41(2), 197-200.
Ahmed M. Maghraby, K. Alzimami, M. Abo-Elmagd. (2014). Estimation of the
residential radon levels and the population annual effective dose in dwellings of Al-kharj,
Saudi Arabia. Journal of Radiation Research and Applied Sciences. 7 (4), 577–582.
Barbra E. Erickson. (2007). The therapeutic use of radon: a biomedical treatment in
Europe; an “alternative” remedy in the united states. Dose-Response, 5:48–62.
EPA (2003). EPA Assessment of Risks from Radon in Homes. Office of Radiation and
Indoor Air. United States Environmental Protection Agency, Washington, DC 20460.
Hussein, A. S. (2008). Radon in the environment: friend or foe? Proceedings of the 3rd
Environmental Physics Conference, 19-23 Feb. 2008, Aswan, Egypt.
IAEA. (2012). Sources and measurements of radon and radon progeny applied to climate
and air quality studies. IAEA proceeding series. International Atomic Energy Agency,
Vienna, Austria.
Niren L. Nagda. 1994. Radon: Prevalence, measurements, health risks and control. ASTM
Manual Series: MNL 15 ASTM Publication Code Number (PCN), ASTM, 28-015094-17 Omega Physics (http://omega.physics.uoi.gr)
Planinic, J., Rdolic, V., Faj, Z., & Suvelajak, B. (1997). Radon equilibrium factor and
aerosols. Nucl. Instr. Methods, A396, 414-417.
UNSCEAR. (2000). Sources and effects of ionizing radiation. Report to the general
assembly, with scientific annexes; New York.
Wikipedia, (http://www.wikipedia.org)