radiological imaging in the investigation of marfan syndrome
TRANSCRIPT

Radiological imaging in the investigation of Marfan syndrome
Rigmor Lundby
Doctoral Thesis
Faculty of Medicine, University of Oslo
2011
Department of radiology and nuclear medicine
Division of diagnostics and intervention
Oslo University Hospital
Norway

© Rigmor Lundby, 2012 Series of dissertations submitted to the Faculty of Medicine, University of Oslo No. 1279 ISBN 978-82-8264-192-0 All rights reserved. No part of this publication may be reproduced or transmitted, in any form or by any means, without permission. Cover: Inger Sandved Anfinsen. Printed in Norway: AIT Oslo AS. Produced in co-operation with Unipub. The thesis is produced by Unipub merely in connection with the thesis defence. Kindly direct all inquiries regarding the thesis to the copyright holder or the unit which grants the doctorate.


2
Contents 1. Acknowledgements ......................................................................................................................... 4
2. List of papers ................................................................................................................................... 6
3. Abbreviations .................................................................................................................................. 7
4. Introduction and background .......................................................................................................... 8
4.1 Historical background for the MFS diagnosis ............................................................................. 10
4.2 Etiology ....................................................................................................................................... 10
4.3 Manifestations and Diagnosis .................................................................................................... 11
4.4 Epidemiology .............................................................................................................................. 13
4.4.1 Prevalence ............................................................................................................................ 13
4.4.2 Survival ................................................................................................................................ 13
4.4.3 Treatment ............................................................................................................................ 13
4.5 Radiology in MFS ........................................................................................................................ 14
4.5.1 Imaging of the ascending aorta and pulmonary artery ....................................................... 15
4.5.2 Imaging of the lumbosacral column and dural sac .............................................................. 17
4.5.3 Imaging of scoliosis .............................................................................................................. 19
4.5.4 Imaging of the hips .............................................................................................................. 19
4.5.5 Imaging of the thoracic cage and lungs ............................................................................... 20
5. Aims of the study ........................................................................................................................... 22
6. Materials and methods ................................................................................................................. 22
6.1 Study population ........................................................................................................................ 22
6.2 Radiological examinations .......................................................................................................... 23
6.3 Statistical approach .................................................................................................................... 24
7. Summary of papers ....................................................................................................................... 25
7.1 Paper I. Prevalence data on all Ghent features in a cross-sectional study of 87 adults with proven MFS. ...................................................................................................................................... 25
7.2 Paper II. Dural ectasia in Marfan syndrome. A case control study. ........................................... 26
7.3 Paper III. CT of the hips in the investigation of protrusio acetabuli in Marfan syndrome. A case control study. .................................................................................................................................... 27
7.4 Paper IV. The pulmonary artery in Marfan syndrome patients. A cross-sectional study. ......... 28
8. Discussion ...................................................................................................................................... 30
8.1 Study and control populations ................................................................................................... 30
8.2 Radiological methods ................................................................................................................. 31

3
8.3 Prevalence data on all Ghent features (paper I) ........................................................................ 32
8.4 Dural ectasia (paper II) ............................................................................................................... 34
8.5 Protrusio acetabuli (paper III) ..................................................................................................... 36
8.6 Pulmonary artery (paper IV) ....................................................................................................... 37
9. Conclusions .................................................................................................................................... 40
10. Errata ......................................................................................................................................... 41
11. References ................................................................................................................................. 42
12. Papers I - IV ................................................................................................................................ 46

4
1. Acknowledgements This theses was carried out at the University of Oslo and at the Department of Radiology and
Nuclear Medicine, Oslo University Hospital, Rikshospitalet, from 2005-2011 with
contributions from and cooperation with professionals and staff at TRS National Resource
Centre for Rare Disorders at Sunnaas Rehabilitation Hospital, Diakonhjemmet Hospital and
professionals from different departments at Oslo University Hospital.
During these years I have been employed as a research fellow at the University of Oslo and
engaged part time as a practitioner of radiology at the Neuroradiology unit, Department of
Radiology and Nuclear Medicine, Oslo University Hospital, Rikshospitalet.
First of all I want to thank the participating patients for their personal contribution to our
research project.
I also want to express my sincere gratitude to:
My main supervisor, Professor Hans-Jørgen Smith, MD, PhD. I could not have done this
work without you! To me you are the best and most inspiring supervisor I can imagine. Your
ability to share your knowledge and your capacity to solve problems have been priceless. I am
grateful for your staying power to answer questions and requests from me. In addition you
have worked weekends and late evenings to comment on and make improvements to our
manuscripts.
Special thanks go to my co-supervisor, John K. Hald, MD, PhD. You taught me a lot of
neuroradiology. Together we evaluated the MR/CT examinations of the spine, and you
advised me in writing articles and presentations. Your reviews greatly improved their quality
and stringency.
Many thanks also go to my close co-worker and co-author, Svend Rand-Hendriksen, MD,
PhD who invented the “Norwegian Marfan Study”. You helped me through all my questions
and doubts during this work, and taught me about Marfan syndrome. I have greatly enjoyed
our brain storming sessions, our studying of test results and cake- eating endeavors.
My co-authors in radiology have contributed hugely and deserve my gratitude:
Finn G. Lilleås, MD. You constructed the radiological protocols and made this study possible
by allocating recourses for the radiological tests to be executed.

5
Sigrun Skaar Holme, MD. In the evenings after regular working time you re-read all
investigations of the lumbo-sacral spine for the interobserver part of the dural study, and you
helped me with the PowerPoint presentations.
Eva Kirkhus, MD. You read the hip examinations together with me in the study of protrusio
acetabuli. We had lots of inspiring discussions to find the best methods for the evaluation of
the hip examinations. You refined our many attempts into the “circle method”.
My co-authors from different departments have done a considerable amount of work:
My thanks go to my statistician, Are Hugo Pripp, PhD. You had always patience with me
when I did not understand the statistics, and you were the amazing source of complicated
statistical methods.
Professor Odd Geiran, MD, PhD, Benedicte Paus, MD, PhD, Kai Andersen, MD, PhD, Jon
Ofstad, MD, PhD, Lena Tjeldhorn, PhD and Svein Ove Semb, MD, PhD. It has been a
pleasure working with so many skilled scientists.
I want to thank my colleges at the Neuroradiology unit at Oslo University Hospital,
Rikshospitalet, for advices and support through these years.
In addition, I want to thank my lovely friends for giving me mental support through this
endeavor.
Finally, I want to thank my family, my deepest gratitude goes to:
My mother and father who always supported me and gave me love and care!
Tone, you and your family have always been there for me, not least your dear Øystein.
Anders, Berit, Mari Ann, Khanh Thanh, Hallvard, Britt Ragnhild: thank you for your
encouragement and inspiration to complete this work.
To my beloved husband Halvdan: I want to thank you for having faith in me and for support
through these years filled with hard work and less leisure. Thank you for always taking care
of our three wonderful children through these challenging and tough times in our family. You
Are My Man!
To my children Eivind, Erlend Torje and Åshild Birgitte: You are my hope, my joy and faith
in life, you are my everything!

6
2. List of papers This thesis is based on the following papers, which will be referred to by their Roman
numerals:
I. Rand-Hendriksen S, Lundby R, Tjeldhorn L, Andersen K, Offstad J, Semb SO, Smith
H-J, Paus B, Geiran O. Prevalence data on all Ghent features in a cross-sectional study
of 87 adults with proven Marfan syndrome. Eur J Hum Genet 2009;17:1222-30.
Erratum in Eur J Hum Genet 2009;17:1526
II. Lundby R, Rand-Hendriksen S, Hald JK, Lilleås FG, Pripp AH, Skaar S, Paus B,
Geiran O, Smith H-J. Dural Ectasia in Marfan Syndrome: A Case Control Study.
AJNR 2009;30:1534-40
III. Lundby R, Kirkhus E, Rand-Hendriksen S, Hald JK, Pripp AH, Smith H-J. CT of the
hips in the investigation of protrusio acetabuli in Marfan syndrome. A case control
study. Eur Radiol 2011;21:1485-91
IV. Lundby R, Rand-Hendriksen S, Hald J, Pripp AH, Smith H-J. The pulmonary artery in
Marfan syndrome patients. A cross-sectional study. (Submitted)

7
3. Abbreviations AM = anterior meningocele
AP = anteroposterior
CI = confidence interval
CT = computed tomography
CTA = computed tomography angiography
CWD = circle-wall distance
DE = dural ectasia
DSD = dural sac diameter
DSR = dural sac ratio
FBN1 = human gene encoding the protein fibrillin 1
HRCT = high resolution computed tomography
ICC = inter class correlation coefficient
MASS syndrome/MASS phenotype = requires at least two of the following manifestations:
myopia, mitral valve prolapse, aortic root diameter at the upper limits of normal for body size,
skin stretch marks (striae), and minor skeletal features of Marfan syndrome
MDCT = multi detector computed tomography
MFS = Marfan syndrome
MRI = magnetic resonance imaging
MRA = magnetic resonance angiography
PA = protrusio acetabuli
PACS = picture archiving and communication system
ROC = receiver operating characteristic
R-R interval = interval between heartbeats
SD = standard deviation
TE = echo time
TEE = transesophagial echocardiography
TGFBR1
TGFBR2 = human gene encoding the protein transforming growth factor,
TR = repetition time
VBD = vertebral body diameter, measured at mid-corpus level

8
4. Introduction and background Marfan syndrome (MFS) is an autosomal dominant disorder of connective tissue. Life
expectancy is generally reduced in MFS patients, mainly due to progressive dilation and
dissection of the aorta. Other manifestations include dislocation of the lens and skeletal
deformities. Early diagnosis, follow-up, and treatment are important to prolong life and
reduce disability.
"Radiological Imaging in the Investigation of Marfan Syndrome" is a spin-off project derived
from the “Norwegian Marfan Study”, a collaborative project between the Norwegian user
organisation (“The Norwegian organisation for Marfan Syndrome (MFS) and other Marfan-
like disorders”), TRS - a national resource center for seven rare disorders, and co-workers
from different hospital departments, representing specialists in thoracic and vascular surgery,
cardiology, ophthalmology, radiology, medical genetics, clinical chemistry and physical
medicine and rehabilitation at Oslo University Hospital.
The main project was initiated by Svend Rand-Hendriksen, MD, PhD, who aimed to explore
the MFS genotype and phenotype in accordance with the diagnostic system used at that time,
the “Ghent 1 criteria” (1). He also intended to “investigate the prevalence of the phenotypic
features and their consequences for perceived health-related quality of life” (2).
In the “Norwegian Marfan Study” all patients were assessed for all parts of the diagnostic
system, the “Ghent 1” criteria, by the same group of physicians (Table 1). Medical imaging
technologies have become immeasurably important tools in many medical disciplines; so also
in the diagnostic process of the pleiotropic disorder MFS. The need for radiological imaging
examinations was the starting point of this project. Radiological imaging according to the
Ghent criteria is required to assess dural ectasia, scoliosis, spondylolisthesis, protrusio
acetabuli, calcification of the mitral annulus, pulmonary artery dilatation, and apical blebs in
the lungs. In addition radiological imaging gives better visualization of the aortic arch and
descending aorta than echocardiography. Different radiological methods have been used in
the diagnostic process of MFS, and there is an ongoing discussion on which methods are
necessary to include in this process. Through this thesis, I hope to participate in the debate on
which radiological methods are important in the diagnostic process of MFS.

9
Table 1. Diagnostic criteria for Marfan syndrome (MFS) according to the Ghent 1 nosology
Major criteria Criterion for involvement
Skeletal Requires four of the eight manifestations listed belowManifestations
Pectus carinatumPectus excavatum requiring surgeryReduced upper to lower segment ratiogreater than 1.05Wrist and thumb signsScoliosis ofReduced extension at the elbows (< 170°)Medial displacement of the medial malleolus causing pes planusProtrusio acetabuli of any degree
Requires two of the eight manifestations in the left column or one manifestation plus two of the four minor criteria listed belowMinor criteria
Pectus excavatum of moderate severityJoint hypermobility (Beighton scoreHighly arched palate with crowding of teethFacial appearance (dolicocephaly, malar hypoplasia, enopthalmos, retrognathia, down-slanting palpebral fissures)
Ocular Ectopia lentis Requires two of the following three minor criteriaMinor criteria
Abnormally flat cornea (< 41,5 dioptres)Increased axial length of the ocular globe (>23,5 mm)
Hypoplastic iris or ciliary bodyCardiovascular Dilatation of the ascending aorta with or
without aortic regurgitation and involving at least the sinuses of ValsalvaDissection of the ascending aorta
Requires the presence of at least one major criterion or one minor criterionMinor criteria
Mitral valve prolapse with or without mitral valve regurgitationDilatation of the main pulmonary artery in the absence of valvular or peripheral pulmonic stenosis or any other obvious cause below the age of 40 yearsCalcification of the mitral annulus before the age of 40 yearsDilatation or dissection of the descending thoracic or abdominal aorta below the age of 50 years
Pulmonary None Requires at least one minor criterionMinor criteria
Spontaneous pneumothoraxApical blebs
Skin and integument
None Requires at least one minor criterionMinor criteria
Striae atrophicae (stretch marks) not associated with marked weight changes, pregnancy or repetitive stressRecurrent or incisional hernia
Dura mater Lumbosacral dural ectasia None
Genetic Having a parent, child or sib who meets these diagnostic criteria independentlyPresence of a mutation in FBN1 known to cause the Marfan syndromePresence of a FBN1 haplotype around FBN1, inherited by descent, known to be associated with unequivocally diagnosed Marfan syndrome in the family
None

10
4.1 Historical background for the MFS diagnosis
In 1896, the Parisian pediatrician Antoine Marfan, described Gabrielle P, a 5 year old girl who
was unusually tall, and had long and slender fingers and toes. This was the first description of
the syndrome which was later named after him (3). However, whether the girl actually was
affected by Marfan syndrome or not, has never been clarified.
In 1956, MFS was described by Victor A. McKusick as an example of “heritable disorders of
connective tissue” (4), and in 1979 criteria for MFS were proposed by Pyeritz and McKusick
(”The Marfan syndrome: diagnosis and management”) (5). A committee of international
consultants suggested standards for the diagnosis of common heritable disorders of
connective tissue in 1986, also including MFS (the Berlin nosology) (6).
In 1991, a mutation in the gene encoding for fibrillin (FBN1) was reported as the cause of
MFS for the first time (7). One hundred years after the first description of this disease, in
1996, the revised criteria for MFS (Ghent 1) were presented by DePaepe et al. in the article
“Revised diagnostic criteria for the Marfan syndrome” (1) (Table 1).
In 2010, the most recent nosology for MFS was published by Loeyz et al. in the paper “The
revised Ghent nosology for the Marfan syndrome” (8) (Ghent 2). This nosology will be
briefly presented only, since all examinations and evaluations in the “Norwegian Marfan
study” were performed according to Ghent 1.
4.2 Etiology
The only gene mentioned in the Ghent 1 criteria for MFS is the FBN1 gene at 15q21 (1).
There are, however, found numerous different mutations in this gene in different MFS
patients, and it is said that many families carry their own private mutation (9;10). FBN1
mutations are found in individuals fulfilling the Ghent 1 criteria for MFS as well as in persons
not fulfilling the Ghent 1 criteria (10;11). FBN1 mutations can lead to a variety of conditions
that are related to MFS, including the MASS phenotype (myopia, mitral valve prolapse, aortic
dilatation, skin and skeletal involvement), familial ectopia lentis, familial Marfan-like habitus,
familial thoracic aortic aneurysms and dissections, Weill–Marchesani syndrome and
Shprintzen–Goldberg syndrome.
All persons exhibiting an FBN1 mutation independent of whether they fulfill the Ghent
criteria or not are said to belong to a “Type 1 fibrillinopathy” (12). Hundreds of different
mutations have been identified till now, and according to Stheneur et al. the great majority

11
(79.1%) of all FBN1
In addition to the finding of different fibrillin 1 mutations in Ghent positive patients,
mutations in TGFBR1 and TGFBR2 have recently been reported in individuals fulfilling the
Ghent 1 criteria (2;14;15). These patients (previously given the diagnosis MFS 2) are now
defined as having Loeys-Dietz syndrome.
mutations described today (more than 1750, data not published) come
from the European laboratories and especially Western Europe (13).
Mutations of FBN1 may cause abnormal microfibrils, and either alone or in association with
elastin in the elastic fibers, these abnormal microfibrils can induce fragmentation of elastic
fibers, and impairment of elastic tissue homeostasis. Manifestations in the connective tissue
like ectopia lentis, protrusio acetabuli and dural ectasia can be explained by these changes in
the elastic tissue.
Mutation of FBN1 also affects the regulation of tissue growth factor signaling (TGF-
signaling), which is related to the pathogenesis of bone overgrowth, pulmonary
manifestations, valve changes, and aortic dilatation (16-19). Research on mouse models has
revealed that dysregulation in TGF-
developmentally and acquired states of elastic tissue deficiency in MFS. Part of the control of
fibrillin-1 over connective tissue homeostasis is mediated by limiting activation of TGF- .
Fibrillin-1–deficient lung tissue has been shown to have increased presence of activated TGF-
(16).
4.3 Manifestations and Diagnosis
As already stated, MFS includes manifestations in many organ systems, with diverse features
in different organs arising from a single mutation. There are several different phenotypes of
this disease, and in the “Norwegian Marfan study” 87 patients fulfilled the Ghent 1 criteria in
56 different ways.
In the cardiovascular system, progressive dilatation of the aorta, usually maximal at the sinus
of Valsalva is associated with aortic valve incompetence, and aortic dissection or rupture. The
aortic pathology represents the main cause of morbidity and mortality in Marfan syndrome
(20). Other cardiovascular signs are mitral valve prolapse, with or without regurgitation,
descending aorta dissection, and dilatation of the main pulmonary artery. Dilated
cardiomyopathy in the absence of severe valvular dysfunction may also be found (21).

12
In the musculoskeletal system, tall stature, and long arms, legs, fingers and toes are common,
(dolichostenomelia, arachnodactyly). Pectus excavatum or carinatum, scoliosis of the
vertebral column, and protrusio acetabuli are also among the features.
In the ocular system, ectopia lentis is the most serious affection, but myopia and retinal
detachment may also be present.
In the lungs, apical blebs may be found, and pneumothorax is a possible complication to this.
In the skin and integument, striae not related to pregnancy, and hernias are seen. In the
nervous system, dural ectasia is found in a high percentage of patients.
The diagnosis of MFS is based on the identification of a combination of the manifestations
listed in Table 1. Confirmation of the diagnosis in an individual requires the presence of
major clinical manifestations in at least two organ systems associated with involvement of a
third organ system. In the presence of an FBN1 mutation known to cause MFS, or in relatives
of an affected proband, major involvement of one organ system and involvement of a second
organ system confirms the diagnosis (1).
In the revised Ghent criteria published in 2010 (Ghent 2 criteria) more weight is given to
aortic root aneurysm/dissection and ectopia lentis. The combination of ectopia lentis and
aortic root enlargement/dissection are sufficient for diagnosis of MFS alone. Features in the
cardiovascular, ocular, skeletal, dura, integument, and skin, contribute to the diagnosis as
systemic signs. Some findings are weighted more than they were in the Ghent 1 criteria, for
instance protrusion of the acetabulum; others are weighted less, for instance dural ectasia.
Pulmonary artery dilatation is not counting as a sign of MFS according to these new criteria
(8).
The Ghent 2 nosology was published subsequent to the time when we completed clinical
examinations and most of the analysis of this study. Our study population was diagnosed
according to the Ghent 1 nosology.

13
4.4 Epidemiology
4.4.1 Prevalence
The prevalence of MFS is difficult to estimate because the reported prevalence is dependent
on the inclusion criteria being used for the diagnosis. Changing diagnostic systems have
entailed that some patients fulfilling the diagnosis according to one system, do not fulfill
another. Radonic et al. examined patients for both Ghent 1 and Ghent 2 criteria, and some of
the patients fulfilled the Ghent 1 but not the Ghent 2 criteria (22). Some of the signs for MFS
also do not develop until adolescence or adulthood, and this makes the diagnosis even more
difficult to assess.
A study in Scotland published in 1994, found a minimal prevalence of MFS to be 1:14,217
(23). In 2007 von Kodolitsch et al. reported an estimated prevalence for MFS of 1 in 5,000
individuals (24), while in 2008 Rybczynski et al. reported a prevalence of “MFS and Marfan-
like syndromes” to be 7 in 100,000 people (25).
Men and women are said to be affected equally often by MFS (24), and approximately 25%
of cases are caused by de novo mutations (26). Gray found that 26.7% of their MFS patients
were de novo mutations (23).
4.4.2 Survival
Mean age at death (± SD) was found to be 41 (± 18) years in a study by Silverman et al.,
published in 1995 (27). This was significantly increased compared with mean age at death in
1972 which was 32 (± 16) years (p = 0.0023) (28).
4.4.3 Treatment
Treatment decisions concerning MFS depend on manifestations in the single patient. Marfan
syndrome and Marfan-related syndromes are diseases which may involve several organ
systems and therefore require coordinated medical care from specialists in different areas.
Complete management requires team work, including a geneticist, cardiologist,
ophthalmologist, orthopedist, and cardiothoracic surgeon, and a radiologist.
When the maximum diameter of the aorta exceeds 5.0 cm, surgical repair is needed. When the
rate of increasing aortic diameter approaches 1.0 cm per year, or progressive aortic
regurgitation occurs, surgery is also needed. Patients with a family history of early dissection
of the aorta may need more aggressive therapy (7). In the latest guidelines for treatment of

14
patients with thoracic aortic disease, it is recommended that a ratio between the maximal
cross-sectional area in square centimeters of the ascending aorta or root and the patient’s
height in meters should be used; if this ratio exceeds 10, surgical repair is reasonable. This is
because shorter patients have dissection at a smaller aortic size, and 15% of patients with
Marfan syndrome have dissection at an aortic diameter less than 5.0 cm (29).
Use o -adrenergic blockade to reduce hemodynamic stress on the proximal aorta in Marfan
syndrome was first suggested in 1971 (21), and in a study published in 2006 by Ladoceur et
al., where treatment with -adrenergic blockade was tried on children, there was a trend
towards lower mortality, less preventive surgery for aortic dilatation, and fewer cases of
dissection (30).
Losartan is an angiotensin II type 1 receptor blocker, and this substance was found to be
potentially useful in MFS because it lead to antagonism of TGF-
chronic renal insufficiency and cardiomyopathy (31). In a small observational study using
losartan in children with severe MFS, preliminary results on aortic dilatation inhibition have
been promising (32). The COMPARE study (COzaar in Marfan Patients Reduces aortic
Enlargement) is an open-label, randomized, controlled trial with blinded end-points.
Treatment with losartan will be compared with no additional treatment after 3 years of follow-
up (22).This has yet to be done.
4.5 Radiology in MFS
To image all the “radiological” features of MFS according to the Ghent 1 criteria, we did the
following examinations.
MRI (or CT) to assess the ascending aorta (examined also by echocardiography),
descending aorta and pulmonary artery
MRI (or CT) to assess dural ectasia and spondylolisthesis in the lumbosacral region
scout view from CT to assess scoliosis
CT to assess protrusio acetabuli
HRCT to assess apical blebs in the lungs, and calcification of the mitral annulus

15
4.5.1 Imaging of the ascending aorta and pulmonary artery
The ascending aorta is an important structure to examine in this patient group to verify or
exclude dilatation and dissection, and different methods have been used in the diagnostic
process.
Transthoracic echocardiography is commonly used in the examination of the ascending aorta.
In 1979 Pyeritz and McKusick wrote: “Echocardiography has greatly enhanced the detection
of the cardiovascular abnormalities, and improved both diagnosis and management of MFS”
(33). Weaknesses of this method are high dependability on appropriate acoustic window and
skilled operator, and inability to visualize the descending aorta. The descending aorta may be
imaged in detail with transesophagial echocardiography (TEE), but this is a more invasive and
less available method.
Today, contrast-enhanced computed tomography (CT) is the most commonly used
radiological method for imaging of the aorta. CT imaging has been used in many years as a
tool for the diagnosis of thoracic aortic diseases, and it has the advantages of being available
in most hospitals. This method is exact in displaying details from aorta, and the examination
is executed in a short time. CT of the ascending aorta as opposed to echocardiography can
depict both thoracic aortic disease, and other diseases that can mimic aortic disease.
Especially after intervention on the aorta CT is preferred to detect asymptomatic
postprocedural leaks or pseudo aneurysms, because of the presence of metallic closure
devices and clips (29). Historically CT images were generated in the axial or transverse plane,
orthogonal to the long axis of the body. However, non-gated axial CT examinations of the
chest do not take into account the obliquity of the aorta, nor the systolic expansion or the non
axial movements during the cardiac cycle (34). Modern multi detector CT (MDCT) scanners
have revolutionized medical imaging. Imaging with isovolumetric voxels enables
reformations in any plane without loss of spatial resolution, and combined with ECG-trigging,
true short axis depiction of any part of the aorta or pulmonary artery is possible without
pulsatory artefacts, allowing a more exact measurement of either systolic or diastolic vessel
diameter or vessel cross-sectional area. Vessel tortuosity is easily shown by three-dimensional
(3D) reconstructions.

16
MR imaging is a good alternative to CT in imaging of the aorta and pulmonary artery. Being
free of ionizing radiation, it should be the method of choice in children and when repeated
examinations are indicated, especially in young patients. Drawbacks of the method as
compared to echocardiography and CT are cost and less availability. There are several MR
methods available for imaging of the aorta and pulmonary artery. ECG-triggered two-
dimensional (2D) “black blood imaging” using non-enhanced spin-echo (SE) or turbo spin-
echo (TSE) pulse sequences may be performed with or without breath-holding (to eliminate
respiratory artifacts). These 2D techniques have the advantage of showing the vessel wall,
including vessel wall thickening due to inflammation. 3D gradient-echo (GRE) techniques are
generally faster and allow true short axis reformations of vessel lumina or 3D angiographic
reconstructions. Both contrast-enhanced and non-enhanced methods are available. Contrast-
enhanced 3D MR angiography (MRA) with breath-hold but without ECG-trigging, is superior
in visualizing the entire aorta with side-branches, while the somewhat slower non-enhanced
3D steady state techniques such as trueFISP with ECG-trigging and respiratory gating with
navigator echo, allow high resolution short axis depiction of the great thoracic vessels free of
pulsatory blurring.
According to a publication in 1996, CT had a sensitivity and specificity of 100% for
identification of aortic dissection, while transesophageal echocardiography (TEE) and MR
imaging both had a sensitivity of 100% and specificity of 94% (35). The authors concluded
that CT, TEE and MR imaging are all valuable methods in the detection of thoracic aortic
dissection. However, they found that for the assessment of the supraaortic arterial branches,
CT was superior (35).
In 2005, Milewicz et al. claimed that “the initial evaluation of an individual with MFS should
include an echocardiogram to assess the ascending aorta and cardiac valves” (36). They
emphasized, however, that the results of echocardiography are dependent on the sonographer
and the equipment, and that spiral thin-slice CT angiography (CTA) or MR angiography
(MRA) with 3D reconstructions are precise, and should be used if echocardiography does not
provide good quality images of the aorta. They recommended routine CTA or MRA of the
entire distal aorta if the descending thoracic aorta is large or has dissected.
In 2010, Hiratzka et al. (“Guidelines for the Diagnosis and Management of Patients With
Thoracic Aortic Disease 2010”) still recommended echocardiography as the imaging modality

17
of choice as a start in the diagnostic process of the cardiovascular system in proposed MFS
patients, and also in the follow up of the aortic sinus of Valsalva if the diameter is stable.
They stress, however, that definitive identification or exclusion of thoracic aortic disease
requires dedicated aortic imaging, and that selection of the most appropriate imaging study
may depend on patient-related factors like hemodynamic stability, renal function, contrast
allergy, and institutional capabilities. Transthoracic echocardiography has according to
Hiratzka et al. a sensitivity of 77% to 80%, and a specificity of 93% to 96% for identification
of proximal aortic dissection (29).
The Ghent 1 criteria from 1996 stated that echocardiography, CT or MRI may all be used to
diagnose dilatation of the aortic root or pulmonary artery diameter, while dissection should be
documented by contrast angiography, TEE, CT or MRI (1). English-language reports on the
diagnosis of thoracic aortic dissection by TEE, helical CT, or MRI were identified from
electronic databases by Shiga et al., 2006. Sixteen studies involving 1139 patients were
selected. Sensitivity, specificity, and positive and negative likelihood ratios were pooled in a
random-effects model. Pooled sensitivity (98%-100%) and specificity (95%-98%) were
comparable between the three imaging techniques (37).
For both contrast-enhanced CT, conventional angiography and MRI consideration should be
given to patients with reduced renal function. Iodinated contrast media injection in CT
examinations and conventional angiography may induce nephropathy. Gadolinium based
contrast agents, used for MRA, imply a risk of nephrogenic systemic fibrosis (29).
4.5.2 Imaging of the lumbosacral column and dural sac
Dural ectasia (DE) is a major criterion for MFS in the Ghent 1 nosology, and is one of the
systemic signs of Ghent 2. It is present in a high percentage of patients with MFS. Several
articles have been published on how to diagnose this feature.
Conventional radiography was the first method where signs of DE could be found, and as
early as in 1958, Nelson et al. reported posterior scalloping seen on a conventional radiograph
of the lumbar region of an MFS patient; he stated that “this widening of the spinal canal is
different from other causes of spinal canal enlargement because it has different stigmata, and
absence of neurological abnormalities”(38). In 1989, Janjua MZ and Muhammad F measured
the vertebral body diameter and the estimated dural sac diameter on sagittal, conventional

18
radiographs in normal persons, and calculated the proportion between these measurements,
the C/B (canal/vertebral body) ratio. They found that the ratio varied between 1/2 and 1/5, and
that a ratio >1/2 indicated a widened dural sac and <1/5 would be conclusive of stenosis (39).
In 2003, Oosterhof et al. used this article as their reference for a ratio calculated from the
proportion between the vertebral diameter and the dural sac diameter, the dural sac ratio,
(DSR), measured on sagittal MR images. An increased DSR was used as a sign of DE (40).
Since the publication of Oosterhof´s article several papers have used DSR as a feature of DE,
including paper I and II in this thesis.
Most recent papers on DE have used either CT or MR imaging for assessment of this feature.
However, conventional radiography has been published as a plausible method for detection of
DE by some authors also the last years (41;42).
Myelography is another possible method to visualize DE. Myelography was introduced in the
early nineteen forties, first with air (as a negative x-ray contrast medium) injected in the
subarachnoid space, and later with positive contrast media, first with oil based contrast media,
and later with water-soluble substances injected into the subarachnoid space. The oil based
contrast media and ionic water-soluble contrast media were reported to give epileptic activity
and adhesive arachnoiditis. Non-ionic iodine contrast medium was introduced in the early
nineteen seventies, and this gave much less side effects (43). Myelography visualize the dural
sac much better than does conventional radiography, which only shows a projection of the
bony canal. Injection of contrast agents into the subarachnoid space, also non-ionic water-
soluble substances, does however include a risk of complications.
Compared to conventional radiography, MRI and CT give considerably more information on
the dural sac, and compared to myelography these methods in general include no contrast
medium injection into the subarachnoid space. In 1983, Fishman et al. published an article
where CT was performed in 5 MFS patients for examination of the lumbar spine and sacrum,
and DE was found (44). Since then a number of articles about MFS have presented methods
on how to assess DE by using conventional x-ray films, CT, and MR imaging, but no gold
standard for the diagnosis of DE has emerged (40;45-52). Compared to CT, MRI is superior in
depicting the soft tissues of the spinal canal, including the dural sac and dural sac herniations.
Showing also bony scalloping, it may therefore be considered the best method in the
diagnosis of DE.

19
4.5.3 Imaging of scoliosis
“Scoliosis > 20 degrees or spondylolisthesis” is one of the eight manifestations that may
contribute to a major skeletal criterion in the Ghent 1 criteria. Scoliosis is an abnormal side-
to-side curve of the spine with associated vertebral rotation, that affects as many as 4% of all
adolescents (53). The scoliosis curve should optimally be imaged in a way that shows the
effect of gravity on the curve’s magnitude, i.e. with the patient erect. Also useful in assessing
scoliosis in patients, are posteroanterior or anteroposterior side-to-side bending images (53).
Spondylolisthesis is depicted with conventional radiography and CT, and may also be visible
on MRI.
4.5.4 Imaging of the hips
Protrusio acetabuli (PA) was counted as a one of eight skeletal manifestations for MFS in the
Ghent 1 nosology, and is assigned a systemic feature for the disease in Ghent 2. PA is found
in quite a high proportion of MFS patients, varying in different studies based on study group
and method of assessment. PA is an inward protrusion of the acetabulum as a rounded mass
into the pelvis (54), and is seen in different disorders including primary idiopathic cases and
secondary to neoplastic, infectious, metabolic, inflammatory, traumatic, congenital and
genetic disorders (55).
Radiographic criteria for PA include the acetabular line abnormally positioned, a center-edge
angle (CEA) of Wiberg of > 40° (Steel’s method, CEA > 50°) (Fig. 1) and crossing of the
“teardrop” by the ilioischial line (56;57). According to Armbuster et al., “the diagnosis of
protrusio acetabuli is warranted if the acetabular line projects medial to the ilioischial line by
3 mm or more in men and by 6 mm or more in women (57) (Fig. 1).
Figure 1. AP radiograph of left hip with protrusio
acetabuli showing the acetabular line projecting
medial to the ilioischial line by more than 6 mm
(double arrow). The center-edge angle is 75º.
Eighteen-year-old male patient.

20
Based on the various methods for assessing PA in conventional radiographs, authors have
reported different prevalences of PA. Sponseller et al. (58) found that 16% of MFS patients
had PA according to the Armbuster method (57), and 27% using Steel´s method (59). Yule et
al. found a prevalence of 60% in their population of MFS patients using Kulman´s method for
PA, which is a combination of an abnormally positioned acetabular line and either the center-
edge angle of Wiberg of the teardrop by the ilioischial line (60).
PA has mostly been examined by conventional radiography, and the varying results in
different studies illustrate the problems with this method. In the article “A new tilt on pelvic
radiographs: a pilot study”, Richards et al. discuss how the different methods will give
different results depending on the degree of pelvic tilt (61).
MRI has been advocated as a modality for examining PA in an article by Chen et al. (62), and
their method for assessment of PA is further studied in our article “CT of the hips in the
investigation of protrusio acetabuli in Marfan syndrome. A case control study” (paper III).
Both MR and CT can give detailed sectional images of the hips, and direct depiction of
acetabular protrusion is not hampered by changes in pelvic tilt. CT is superior to MR in
visualizing cortical bone, and although not free of ionizing radiation, high-quality CT of bony
structures may be performed with low radiation doses.
4.5.5 Imaging of the thoracic cage and lungs
Emphysematous air filled expansions or blebs have been found in MFS patients, and are
counted as features of the disease in the Ghent 1 nosology (Fig. 2). In the revised criteria for
MFS from 2010 (Ghent 2), sole emphysematous blebs in the lungs do not count as features of
MFS, but spontaneous pneumothorax is still reckoned a sign of MFS. Large blebs, especially
in the apical part of the lungs can cause spontaneous pneumothorax. Abnormalities of the
thoracic cage such as pectus excavatum and/or carinatum are also present in many MFS
patients, and are features for MFS in Ghent 1 and 2 (Fig. 3).
Conventional radiography of the chest has been used to examine the heart, lungs and thoracic
cage for more than 100 years, and is still the most commonly used method for chest imaging.
CT gives, however, a much more detailed picture of the thoracic cage, and different methods
of CT (for instance CT angiography, CTA, or high resolution CT, HRCT) are used for
different indications.

21
HRCT is a special application of computed tomography where imaging parameters are chosen
to maximize spatial resolution, and this method is excellent for evaluation of the lung
parenchyma. HRCT scanning is a valuable device allowing identification of the presence,
extent and severity of interstitial lung disease (63). A narrow slice width (usually 1–2 mm) is
used together with high spatial resolution image reconstruction algorithm. In addition, the
field of view is minimized to make each pixel small.
Figure 2. HRCT of MFS patient with
emphysematous blebs in the left lung, and
centrilobular emphysema in especially the right
lung.
Figure 3. HRCT of MFS patient with pectus
excavatum and aortic valve replacement.

22
5. Aims of the study General aims were:
To explore the prevalence of different manifestations of Marfan syndrome by using
radiological methods in the investigation of this disease. To evaluate different imaging
methods in each organ system examined by radiological methods.
Specific aims were:
1. To explore the phenotype, the prevalence of each ‘major criterion' and ‘organ
involvement' through a prospective and complete investigation of all features of the Ghent
1 criteria in an adult group of patients with a proven diagnosis of MFS (paper I).
2. To establish the prevalence of dural ectasia (DE) in an adult population fulfilling the
Ghent 1 criteria for MFS, and to assess definitions of DE by MR or CT examinations
(paper II).
3. To establish the prevalence of protrusio acetabuli (PA) in adults fulfilling the Ghent 1
criteria for MFS by using CT examinations (paper III).
4. To establish the prevalence of pulmonary artery dilatation in MFS by MRI or CT, to
correlate diameter of the vessel with aortic disease, and explore predictors of pulmonary
artery dilatation in MFS (paper IV).
6. Materials and methods
6.1 Study population
The “Norwegian Marfan study” was a cross-sectional study of adults with presumed MFS
living in Norway. The study patients were recruited either by an advertisement requesting
adult MFS patients to participate (Journal of the Norwegian association for MFS and MFS-
like disorders), by a letter sent to adults (> 18 years) registered as having MFS in a national
database of MFS patients (National Resource Center for Rare Disorders, Sunnaas
Rehabilitation Hospital), or through an invitation to patients suspected of having MFS,
distributed by the Department of Thoracic and Cardiovascular Surgery, Rikshospitalet, Oslo
University Hospital.
One hundred and nine patients gave informed consent to participate, but only 105 attended the
whole study. The 105 patients consisted of 67 women aged 20–69 years, mean 41.2 (SD 13.6)

23
years, and 38 men aged 19–62 years, mean 35.1 (SD 11.3) years. Of the 105 study patients 90
had been given the diagnosis of MFS previously, and 15 were suspected of having MFS.
The present substudy "Radiological Imaging in the Investigation of Marfan Syndrome" also
comprises two control populations. In our assessment of dural ectasia (paper II), control
subjects were chosen from the pool of patients in the radiologic archive (PACS) of the
Department of radiology, Oslo university hospital, on the basis of the following criteria: sex-
and age-matched asymptomatic persons with respect to the lumbosacral spine and without any
known connective tissue disease or compression fractures, screened with MR imaging for
malignancy in the lumbosacral spine, but with no evidence of malignant disease in this area.
The controls included 101 subjects, 64 women aged 18-65 years, mean 39.6 (SD 12.9) years
and 37 men aged 18–70 years, mean 35.7 (SD 12.3) years.
In our investigation of acetabular protrusion in MFS (paper III), the control cases were also
chosen from the radiological archive (PACS) of the Department of radiology, Oslo university
hospital, based on the following criteria: sex- and age-matched asymptomatic persons with
respect to the hips and without any known connective tissue disorder, examined by CT of the
abdominal and/or pelvic area due to symptoms from the abdominal area or with suspected
vessel disease in the pelvic or abdominal region. Patients with liver or kidney transplants were
excluded. The controls included 107 subjects, 68 women aged 19-69 years, mean 40.9 (SD
13.7) years, and 39 men aged 19-64 years, mean 35.8 (SD 12.1) years.
6.2 Radiological examinations
MRI of the thoracic aorta, the pulmonary artery, and the lumbosacral column was performed
in one session unless contraindicated, when CT examinations were obtained instead.
CT was used for tomographic imaging of the thoracic cage and the hip joints, and for
projection imaging of the vertebral column (scout view).
MRI of the thoracic aorta and the pulmonary artery was performed using a 1.5 T unit (Signa
LX, GE Healthcare, Milwaukee, Wisconsin) in axial and oblique sagittal planes using a
standard ECG-gated T1-weighted SE sequence without intravenous contrast medium
injection. Repetition time equalled the R–R interval, echo time was minimum 9.32 ms to
maximum 39.976 ms, slice thickness was 7 mm in the axial plane, and 4 mm in the oblique
sagittal plane.

24
CT of the thoracic aorta and the pulmonary artery was obtained on a ProSpeed SX scanner
(GE Healthcare, Milwaukee, Wisconsin) with 5 mm slice thickness in patients in whom MRI
was contraindicated.
HRCT of the lungs was performed on a ProSpeed SX scanner (GE Healthcare, Milwaukee,
Wisconsin) with 1 mm slice thickness and 10 mm distance between slices.
MR imaging of the lumbosacral spine in the study group was performed using a 1.5 T unit
(Signa LX, GE Healthcare, Milwaukee, Wisconsin). T1-weighted (TR/TE = 375/9 ms) and
T2-weighted (TR/TE = 3500/120 ms) turbo spin-echo sequences were obtained in the sagittal
plane with 4 mm section thickness. The T2-weighted sequence was repeated in the coronal
plane and in 5 angulated axial planes parallel to the 5 lumbar intervertebral disks.
MR imaging of the lumbosacral spine in the control patients was performed with a 1.5 T unit
(Signa, GE Healthcare, Milwaukee, Wisconsin) with sagittal and coronal T1-weighted fast
spin-echo sequences (TR/TE = 500/9–13 ms) and sagittal and coronal short-inversion-time
inversion recovery sequences (TR/TI/TE = 4300/150/34 ms). Section thickness and interslice
gap were 4 and 0.5 mm for sagittal images and 7 and 1 mm for coronal images, respectively.
CT imaging of the hips in the study patients was performed by a ProSpeed SX scanner (GE
Healthcare, Milwaukee, Wisconsin) with 3 mm slice thickness.
CT imaging of the hips in the control patients was performed on different scanners with slice
thickness 3 mm or less.
6.3 Statistical approach
All statistical analyses were performed by SPSS versions 13-18 (SPSS, Chicago, Il).
Significance level was set to 5%. Continuous data were described as mean and standard
deviation or median and range for normally distributed or skewed data, respectively.
Categorical data were described as frequency and percentage.
Univariate statistical analyses on differences between groups were analyzed with independent
sample t-test or chi-square, as appropriate, and correlation assessed with Pearson correlation

25
coefficient. Skewed data were analyzed with a non-parametric Kruskal-Wallis test. For
continuous data, difference in mean between the study groups was analyzed with one-way
ANOVA, and for multiple comparisons Tukey or Bonferroni post hoc test was done.
Pearson’s chi-square test was used for categorical data. Odds ratios were calculated for nerve
root sleeve herniations. Multivariate analysis on factors influencing pulmonary artery
diameter was done with a multiple linear model. Statistical analysis of dural sac diameter
between the groups was adjusted for sex and age using a general linear model.
7. Summary of papers
7.1 Paper I. Prevalence data on all Ghent features in a cross-sectional study of 87 adults with proven MFS.
In order to investigate the phenotype, i.e. to explore the prevalence of each “major criterion”
and “organ involvement” in an adult cohort with proven Marfan syndrome, we investigated
105 adults with suspected MFS for all the features of the Ghent 1 criteria. Eighty seven (83%)
fulfilled the different features through 56 different combinations of the major criteria and
organ involvement.
Using the full version of the Ghent 1
criteria on 105 individuals refuted
the MFS diagnosis in 13 out of 90
patients who had been diagnosed
earlier, and verified the diagnosis in
10 of 15 persons with suspected
MFS. Figure 4 gives an overview of
the diagnostic results.
Figure 4. Diagnostic results for entire study group (n=105). Reproduced with permission from
Svend Rand-Hendriksen (2).
The major dural criterion (DE) was fulfilled in 91% of the Ghent positive cohort, a major
genetic criterion (positive family history and/or FBN1 mutation) was found in 89%, a major
ocular criterion in 62%, and a major cardiovascular criterion in 53% of the MFS patients. The

26
major skeletal criterion was fulfilled in 38% of the Ghent positives. As much as 16% (14
persons) of the Ghent positive cohort were dependent of DE to fulfill the diagnosis of MFS.
In spite of the great diversity of combinations to fulfill the diagnosis according to the Ghent
nosology, a combination of the dural major criterion and the presence of genetic major criteria
could identify 69 (79%) out of 87 affected individuals with MFS in our cohort. This indicates
an early investigation of those systems when suspicion of MFS has been raised in adults.
7.2 Paper II. Dural ectasia in Marfan syndrome. A case control study.
In order to investigate the prevalence of dural ectasia in a cohort of patients fulfilling the
Ghent criteria for MFS, and to find the best criteria for assessment of dural ectasia, we studied
the lumbosacral spine of 105 adults suspected of having MFS with MR imaging at 1.5 T
(unless contraindicated, when CT was obtained instead). One-hundred and one sex and age-
matched persons screened for malignancy by MR imaging constituted the control group.
Dural ectasia (DE) is one of the major criteria of MFS in the Ghent 1 nosology and has been
defined as "enlargement of the neural canal anywhere along the spinal column, but nearly
always in the lower lumbar and sacral regions; thinning of the cortex of the pedicles and
laminae of the vertebrae; widening of the neural foramina; or an anterior meningocele”. A
number of articles about MFS have presented methods on how to assess DE by using
conventional x-ray films, CT, and MR imaging, but no gold standard for the diagnosis of DE
has emerged.
We measured lumbosacral anteroposterior vertebral body diameters (VBD) and dural sac
diameters (DSD). Dural sac ratios (DSR = DSD/VBD) at levels L3 through S1 were
calculated. Anterior meningoceles, herniations of nerve root sleeves, and scalloping were
characterized.
Three patient groups were identified: 1) fulfilling Ghent criteria independent of DE (n = 73),
2) fulfilling Ghent criteria dependent on DE (n = 14), and 3) suspected MFS, not fulfilling
Ghent criteria (n = 18). The control and study populations were compared in aggregate, and
consensus readings in addition to interobserver agreement were studied.

27
We found that:
1) Anterior meningoceles were present in Ghent-positive patients only.
2) Herniations of the nerve root sleeves were frequently present in Ghent-positive patients, in
73% of group 1 (MFS independent of DE), and in 71% of the patients in group 2 (MFS
dependent on DE). Only one person (1%) of the controls had herniation of a nerve root
sleeve.
3) DSD sacrum > DSD L4 was found in 52% of group 1, and in 29% of group 2. Five
percent of the controls had this finding.
4) DSR S1 > 0.59 was present in 59% of group 1, and in 85% of group 2, while 7% of the
controls had this feature.
On the basis of the ROC analysis, a cut-off value of 0.59 for DSR at level S1 was suggested,
giving a sensitivity of 70.5% and a specificity of 92.7% as a marker for MFS. A total of 86%
of our Ghent-positive patients independent of DE fulfilled the combined signs of DE
described above.
We concluded that the above mentioned features (1-4) for DE should be the basis for the
diagnosis of DE. MR imaging of the spine is encouraged to identify DE and thus strengthen a
potential diagnosis of MFS.
7.3 Paper III. CT of the hips in the investigation of protrusio acetabuli in Marfan syndrome. A case control study.
In order to establish the prevalence of protrusio acetabuli (PA) in adult persons fulfilling the
Ghent 1 criteria for MFS, and to find the best criteria for the assessment of PA, we studied CT
of the hips in 105 adults with suspected MFS, and 107 sex- and age-matched controls.
Asymptomatic persons with respect to the hips, and without any known connective tissue
disorder, examined by CT of the abdominal and/or pelvic area chosen from the radiological
archive in our department, constituted the control group. Eighty-seven of the 105 persons
suspected of having MFS fulfilled the Ghent 1 criteria (= Ghent positive).
PA is an inward protrusion of the acetabulum as a rounded mass into the pelvis, and varies
from a few millimeters to five centimeters, and is seen in different disorders including
primary idiopathic cases or secondary to neoplastic, infectious, metabolic, inflammatory,
traumatic, congenital and genetic disorders.

28
PA is one of the eight manifestations that may contribute to the major skeletal criterion for
Marfan syndrome (MFS) according to the Ghent 1 nosology, and is included as one of the
features of the “systemic score” in the newly revised Ghent 2 criteria. Diagnosing PA has
been a point of discussion since the accuracy of measurements on conventional pelvic
radiographs is uncertain and may vary with pelvic tilt. Few authors have assessed the different
radiological methods in a validated way, and the definition of PA has varied depending on the
radiological method.
A qualitative assessment of PA was performed. A new method for estimating the degree of
PA was introduced with measurement of the parameter CWD (circle-wall distance), where a
circle with 10 cm radius was fitted to the inner pelvic wall at the level of the acetabulum.
PA was diagnosed qualitatively in 74.7% of Ghent positive persons, in 27.8% of Ghent
negative persons (the 18 persons suspected of MFS without fulfilling the Ghent 1 criteria),
and in 3.7% of the controls. PA was bilateral in 81.5% of Ghent positive persons, and in 50%
of controls. CWD was significantly different between the three groups (p<0.001). ROC
analysis of CWD vs. qualitative diagnosis of PA showed an area under the curve of 0.99 (95%
CI 0.98–1.0); a CWD cut-off value of 1.25 mm resulted in a sensitivity and specificity for PA
of 95.5% and 97.6%, respectively. Interobserver agreement for assessing PA qualitatively was
–0.95) for the right hip and 0.92 (CI 0.81–
1.0) for the left hip. The circle method had an interclass correlation coefficient (ICC) of 0.91
(95% CI 0.89–0.95) and 0.89 (95% CI 0.81–0.93) on the right and left side, respectively.
We concluded that PA was found significantly more often in MFS persons than in controls.
Both our CWD and qualitative method was found to be robust and highly reproducible, giving
a direct assessment of pelvic protrusion irrespective of pelvic shape or tilt.
7.4 Paper IV. The pulmonary artery in Marfan syndrome patients. A cross-sectional study.
In order to establish the prevalence of pulmonary artery dilatation in Marfan syndrome (MFS)
by radiological methods, to correlate diameter of the vessel with aortic disease, and explore
predictors of pulmonary artery dilatation in MFS, we performed MR or CT imaging of the
pulmonary artery and aorta in 87 patients with proven MFS. According to the Ghent 1
nosology “dilatation of the main pulmonary artery, in the absence of valvular or peripheral

29
pulmonary stenosis or any other obvious cause, below the age of 40 years”, is considered a
minor cardiovascular criterion of MFS.
Axial diameters of the pulmonary artery root and trunk were measured perpendicular to the
long axis of the vessel on axial images. Aortic root diameters were measured on oblique
sagittal images perpendicular to the long axis of the vessel. Measurements were compared to
normal values based on MR and CT in the literature.
MR and CT measurements of the pulmonary artery showed mean (SD) diameters of the
pulmonary artery root and trunk of 35.0 (4.6) mm and 29.8 (3.8) mm, respectively. According
to Ghent 1 criteria for pulmonary artery dilatation, which are based on nomograms of the
aortic root, 7 out of 39 patients (17.9%) under 40 years of age had dilated pulmonary artery
root, while none had dilatation of the pulmonary artery trunk. Compared to published normal
values for adult pulmonary artery trunk diameters, 47 (54%) of the 87 patients had dilated
pulmonary artery trunk, i.e. mm.
Thirty (34.5 %) of the 87 Ghent positive patients had previous surgery on the ascending aorta.
The remaining 57 MFS patients without previous aortic surgery had echocardiographic
measurements indicating that 16 had dilated aortic root according to the Ghent 1 criteria
(nomograms by Roman et al.). However, when the aortic root diameters were reassessed with
MR or CT, 40 of these 57 patients had dilated aortic roots according to the same criteria.
Thus, based on MR or CT a total of 70 (80.5%) patients fulfilled the major cardiovascular
criterion for MFS, i.e. had an operated or dilated ascending aorta.
Pulmonary artery root and trunk diameters were significantly larger in patients with previous
surgery on the ascending aorta compared to those without such surgery (p=0.041 and
p=0.027, respectively). Pulmonary artery trunk diameters were significantly larger in patients
with ascending aortic disease (dilatation or previous surgery) than in those without (p=0.018),
but the pulmonary artery root diameters were not significantly larger in this patient group
(p=0.104). A multivariate analysis suggested that previous surgery on the ascending aorta was
a significant predictor of pulmonary artery trunk dilatation, but not of pulmonary artery root
dilatation.

30
Seven (14.9%) of the 47 patients with dilated pulmonary artery trunk diameter ( ) had
normal diameter of the aortic root, while 20 (42.6%) had a dilated native aortic root, and 20
(42.6%) had previous surgery on the ascending aorta.
We concluded that pulmonary artery dilatation is a common finding in MFS (54%), and
should be assessed using cut-off values based on pulmonary artery diameter measurements in
the normal population. MR or CT imaging seems to provide more reliable results for
pulmonary artery dimensions than echocardiography. Severe disease of the ascending aorta is
a significant predictor of pulmonary artery trunk dilatation in MFS patients, but such
dilatation may occur even in the absence of visible aortic disease.
8. Discussion
8.1 Study and control populations
The Norwegian Marfan study intended to be a cross-sectional study of the adult Norwegian
MFS population. All criteria for the syndrome were examined according to the Ghent 1
criteria. One hundred and five persons were included, and 87 of these fulfilled the Ghent 1
criteria for MFS. Through the invitation letters sent to patients with proposed MFS, and
through the advertisement in the Journal of the Norwegian association of MFS and MFS-like
disorders, we believe that the majority of the genuine patient group was informed. Despite the
fact that MFS affects men and women equally often, there was a skewed gender
representation in our study, 64% of the participants being women. This might be accidental,
but could also reflect a gender difference in the willingness to participate in studies. In
addition, the men as a group were younger than the women, and these facts together may
constitute a bias selection.
Control patients were included in our assessment of dural ectasia and acetabular protrusion in
MFS. The prevalence of dural ectasia in the general population was not known, and previous
case control studies addressing this topic were few and had control groups that (with one
exception) tended to be small. The control groups had furthermore not been sex- or age-
matched, and they included patients with low back symptoms (40;45;47-49). Our control
group for DE included 101 sex- and age-matched controls without low back symptoms,
giving us reason to assume that our findings in that group would be representative for a

31
normal population. Our results indicate that DE is a common finding in MFS, but present in
only a few percent of healthy persons without back pain.
Our main reason for including controls in our examination of acetabular protrusion was lack
of knowledge concerning the prevalence and degree of protrusion in the normal population
when assessed with CT. No previous studies on this topic were found. To avoid radiation
exposure to healthy persons by CT, no healthy volunteers were included; all 107 sex- and age-
matched controls were chosen from the radiological archive of our hospital.
8.2 Radiological methods
In our investigation of the study population we intended to use radiological methods
described by the Ghent 1 article published in 1996 (1). However, we did a pilot study of 23
patients with suspected MFS, 18 fulfilled the Ghent 1 criteria for MFS, and based on this pilot
study it was decided that some radiological examinations could be exchanged with more
modern methods. For examination of the hips for protrusio acetabuli radiography was
exchanged with CT because the latter method gives much more detailed information of the
acetabular shape than does conventional radiography. MR imaging of the vertebral column in
the investigation of DE was chosen instead of CT or radiography because this method depicts
soft tissue as the dural sac, better than does CT or radiography, and in addition it does not
include ionizing radiation. CT of the thoracic cage depicts blebs in the lungs far better than
radiography. To optimize examination of the ascending aorta, MR imaging was chosen in
addition to echocardiography.
The examinations in our study were performed in the period of 2003-2005, and since then MR
and CT techniques have improved substantially. To reduce possible side-effects to a
minimum, contrast-enhanced imaging was not included, resulting in less than optimum
imaging of the aorta and pulmonary artery. Today, non-enhanced 3D MRI using a balanced
gradient echo sequence with ECG and respiratory gating would have been used for imaging of
the great thoracic vessels, but although our ECG-triggered 2D TSE sequences are far from
today’s state of the art, they are still adequate for diameter measurements.

32
8.3 Prevalence data on all Ghent features (paper I)
In this cross-sectional study of 105 adults suspected of having MFS, all patients were
examined by the same group of investigators with standardized and complete assessment of
all features in the Ghent 1 criteria. Eighty-seven patients fulfilled the criteria in as much as 56
different combinations of criteria and involvement. That confirms the need for the complete
Ghent criteria to be identified in studying MFS, although the majority of them could have
been identified by combined assessment of dura and the family history, supplemented with
DNA analysis in family-negative cases.
Dural ectasia was found in 91% of the MFS patients, and DE was the sign most prevalent of
all the Ghent criteria, followed by the major genetic criterion (89%), and ectopic lenses
(62%). We based our diagnostic criteria for DE on a combination of findings from our own
case control study of DE and proposed signs of DE from the literature. In addition to
qualitative signs for DE and DSD sacrum > DSD L4, cut-off values of DSR at level L5 and
S1 according to Oosterhof et al. (40) were used as diagnostic criteria for DE. However,
Oosterhof et al. proposed a combination of elevated DSR at level L3 and S1 as a specific
indicator to identify MFS (40). In our study, DSR at level L3 had no discriminating value for
the presence of MFS because we found no significant differences between Ghent-positive
patients independent of DE and the controls.
The prevalence of DE in our study was among the highest found in the literature, but it was
comparable to studies by Oosterhof et al. (95%) and Fattori et al. (92%) (40;49). Pyeritz et al.
found a lower prevalence of DE (63%) in 1988 (46), and Radonic et al. found DE in 76% of
their patients in an article published in 2011 (22). As much as 16% (14 persons) of the Ghent
positive patients were dependent of DE to fulfill the diagnosis of MFS. This underscores the
importance of investigating this feature of MFS. In the Ghent 2 criteria DE is given less
significance than in the Ghent 1 nosology. In a newly published study by Radonic et al. (22)
180 Ghent 1 positive patients were tested for the Ghent 2 nosology; three patients with dilated
ascending aorta according to the new z-score system used by the Ghent 2 nosology, had their
diagnosis of MFS rejected because of low systemic score according to Ghent 2. None of these
three were found to have any other connective tissue diseases. These patients fulfilled Ghent 1
based on two major criteria, dilatation of the aortic root and DE in addition to involvement of
another system. Because of the reduced significance of DE in Ghent 2, the criteria for MFS
were not fulfilled.

33
Protrusio acetabuli (PA) is regularly found in MFS patients, and CT of the hips was chosen
instead of conventional radiography, partly because previous studies had given varying results
dependent on method for assessment of PA by conventional radiography, and also because
CT is a superior method to depict bony structures. We used an ellipse to assist us in the
qualitative evaluation PA, and defined PA as present when the bottom of the acetabulum
protruded into the ellipse. We found protrusio acetabuli in 52 (59.8%) of the 87 MFS patients.
Our evaluation of the radiological findings was later refined, leading to an even higher
prevalence of PA in our MFS patients, 74.7% (paper III).
HRCT was chosen to study blebs in the lungs, a criterion of the Ghent 1 nosology. We found
apical blebs in 16 out of 87 MFS patients. In a study by Wood et al. in 1984, only 5 out of
hundred MFS patients had apical blebs based on conventional radiography examinations (64).
Our findings probably reflect the much higher sensitivity of HRCT compared with
conventional radiography in detecting changes in the lung parenchyma. In addition to blebs in
the lungs the HRCT study made it possible to depict pectus excavatum and carinatum. Pectus
carinatum was found in 57 (65.5%) of our MFS patients.
We assessed scoliosis based on scout views from the CT examinations performed. Additional
conventional radiography in the erect position would have been a better method to study
scoliosis, but emphasis was put on minimizing radiation to the patient. Scoliosis and/or
spondylolisthesis were found in 26.4% of the MFS patients.
The ascending aorta was measured by echocardiography and MRI in our study, but in paper I
results were based on echocardiography only, in accordance with the Ghent 1 nosology
(1;65). The prevalence of ascending aortic disease (major cardiovascular criterion) was 53%,
and that of mitral valve prolapse 14% in our study, and was among the lowest reported in
individuals fulfilling the Ghent 1 criteria. As most studies that were found in the literature
emerged from specialized 4th level cardiovascular centres serving individuals with severe
aortic or cardiovascular disease, patient selection may explain the high prevalence of
cardiovascular pathology in other reports. In the hindsight's light, another explanation of why
the number of patients with affected ascending aorta was relatively low, could be that our
echocardiographic measurements underestimated aortic diameters. There was a large
discrepancy between the echocardiographic and the MR/CT results on diameter of the

34
ascending aorta, where MR/CT gave a much higher prevalence of ascending aorta disease
(paper IV).
According to the Ghent 1 criteria none of our MFS patients had dilated pulmonary artery. In
the discussion of paper I we wrote: “Using Nollen's upper limit of normality for the
pulmonary artery trunk, 34.8 mm, 13 out of 87 persons fulfilling Ghent had enlarged
pulmonary trunk (median diameter 30 mm; range 23–38 mm)”. The problem with this
statement is that the wrong cut-off value, the cut-off value for the pulmonary artery root
instead of the trunk, was used. The cut-off value proposed by Nollen et al. for the trunk was
28 mm, which would have given a much higher prevalence of dilatation of the pulmonary
artery (66). Also De Backer et al. used Nollen´s cut-off values wrong in their article on minor
cardiovascular signs in MFS (67). So there has been a general confusion in the literature on
the pulmonary artery in MFS patients. MRI with modern sequences should be used for
assessment of the pulmonary artery trunk diameter, and pulmonary artery cut-off values must
be used instead of aortic cut-off values.
8.4 Dural ectasia (paper II)
Dural ectasia is found in a high percentage of MFS patients, and was according to the Ghent 1
nosology a major criterion for this disease. A proportion of the MFS patients are dependent of
DE to fulfill the diagnostic criteria for MFS. In our study 14 (16%) out of the 87 MSF patients
were dependent on the finding of DE to get the diagnosis. This was in line with the result in a
study by Sznajder et al., 2010 (42) where 10% of their MFS patients were dependent of DE to
fulfill the criteria for MFS. This strengthens the proposal that the lumbosacral spine should be
imaged when MFS is suspected.
We divided the study patients in three groups: (1) fulfilling Ghent 1 independent of DE, (2)
fulfilling Ghent 1 dependent of DE, and (3) not fulfilling Ghent 1. By adding a large control
group, the prevalence of DE in the healthy population could also be assessed.
Assessment of DE in our study included qualitative and quantitative signs. Qualitative signs
were anterior meningoceles (i.e. spinal fluid collection covered by dura inside the pelvic
cavity) or herniation of dura along the nerve root sleeves. Quantitative signs included DSD
sacrum > DSD L4 suggested by Ahn et al. (51), and cut-off values for DSR at level L5 and S1
suggested by Oosterhof et al. (40). Oosterhof et al. found that a combination of DSR at level

35
L3 and DSR at level S1 had a high diagnostic sensitivity and specificity for MFS (40). As a
marker of MFS, DSR at level S1 had the highest sensitivity and specificity in our study. DSR
at level L5 gave the second best results. No significant differences at level L3 between DSR
of Ghent positive patients independent of dura and controls were found. By including
qualitative findings, and replacing the cut-off values for DSR proposed by Oosterhof et al. at
level L5 and S1 by a cut-off value at level S1 of 0.59, the prevalence of DE was found to be
86% in group 1 (MFS patients not dependent on DE for their diagnosis), and 9% in the
controls. Söylen et al. found in their case control study of MFS patients that according to the
method of Oosterhof et al. 88% of MFS patients and 47% of controls had dural ectasia
(40;68).
Some recent reports about DE in MFS have postulated that quantitative signs of DE have
major advantages over qualitative assessments because cut-off values can be used more
uniformly than qualitative signs (40;48). We found qualitative signs as nerve root sleeve
herniation and anterior meningocele very useful because they are highly specific for DE. Ten
of our patients would not have been assigned the major criterion DE if nerve root sleeve
herniation had not been a sign of that feature. The presence of nerve root sleeve herniation at
at least one vertebral level had a sensitivity of 72.6% (95% confidence interval [CI], 67.6%–
77.6%) and a specificity of 99.0% (95% CI, 95.4%–99.8%) in diagnosing MFS.
Although the dural sac is a soft-tissue structure, DE has been defined to include bony changes
of the spine, such as thinning of the cortex of the posterior vertebral elements, widening of the
neural foramina, and vertebral scalloping in addition to the presence of a patulous dural sac
and anterior meningoceles (1;69). MR imaging, like CT and conventional radiographs,
identifies the secondary osseous changes associated with DE, but MR imaging also allows the
direct visualization of the soft tissues of the entire spine. In the ongoing discussion on which
methods are necessary to depict DE, Sznajder et al. have recently suggested that conventional
radiography should be used as first line screening for suspected MFS patients, and that CT or
MRI should be reserved for unresolved cases (42). Conventional radiography was found to
have a low sensitivity (35.3%), but very high specificity (100%), indicating that the majority
of DE cases would remain undetected using radiography alone (42).
The Ghent 2 nosology regards DE as a sensitive but unspecific sign of MFS (8). It is argued
that no preferred methods (CT or MRI) or uniformly accepted cut-off values for DE have

36
emerged from the literature. In our study using MR imaging, we compared MFS patients
independent of DE to controls, and found that the presence of nerve root sleeve herniation at
one or more levels had high specificity for MFS compared to controls. In line with this, DE
was not identified as an incidental finding in a study concerning MR imaging of the lumbar
spine in persons without back pain (70). On the basis of our ROC analysis, a cut-off value of
0.59 for dural sac ratio at level S1 was suggested, giving a sensitivity of 70.5% and a
specificity of 92.7% as a marker for MFS.
We recognize that DE is found in other connective tissue diseases, such as neurofibromatosis
1, Ehlers-Danlos syndrome and Loeys-Dietz syndrome, and it may be argued that DE is a sign
of inherited connective tissue disorders. Based on our study we believe that DE is sensitive
and specific for connective tissue diseases, including MFS. It is a well documented sign for
these diseases, and its detection should be given preference in the diagnostic process of MFS.
8.5 Protrusio acetabuli (paper III)
Protrusio acetabuli (PA) is regularly described in MFS patients, but we found only one study
based on MR examinations (62) in the literature, and none based on CT. Radiography of the
hips on this indication is described in many papers (55;58-60;71). The reported prevalence of
PA in MFS based on conventional radiography has varied in different studies (56). Sponseller
et al. studied PA in children and adults with MFS and found different percentages of PA
depending on the method of assessment; Steel´s method (59) gave 27% of the patients the
diagnosis of PA, while the method by Armbuster (57) gave 16% (58).
A newly published study by Richards et al. concludes that as pelvic tilt increases, classic
radiographic measurements of PA become unreliable (61). The authors found too much
variation in the results to recommend any standard radiographic test. They claim that despite a
variety of radiological measurements, few authors have assessed the different methods of
radiological analysis in a validated way.
In our case control study CT was chosen due to its direct visualization of the acetabular shape
and its superior depiction of cortical bone. Qualitative assessment of PA in our study was
defined as any degree of intrapelvic protrusion of the medial pelvic wall at the level of the
acetabulum. Using this criterion, we found a very high percentage of PA in our MFS persons
(74.7%) as compared to the controls (3.7%). The finding of PA in 27.8% of the persons

37
suspected of having MFS but not fulfilling the Ghent criteria probably reflects that several of
these persons had other connective tissue diseases that might predispose for PA. For
quantification of PA we introduced a circle with 10 cm radius and measurement of the circle-
wall distance (CWD). The circle was fitted to the inner pelvic wall at the level of the
acetabulum, and CWD was measured as the distance from the circle to the most medial point
of the inner acetabular wall. Measurement of CWD was easily performed with a high
interobserver reproducibility. ROC analysis of CWD vs. qualitative diagnosis of PA showed
an area under the curve of 0.99 (95% CI 0.98–1.0); a CWD cut-off value of 1.25 mm resulted
in a sensitivity and specificity for PA of 95.5% and 97.6%, respectively. ROC analysis of
CWD in differentiating MFS patients from controls showed a sensitivity and specificity in
diagnosing MFS of 68.8% and 97.2%, respectively, when using a CWD cut-off value of 1.25
mm. Measurement of CWD appears to be a useful method in estimating the degree of PA, but
the simplest way to determine whether PA is present is to evaluate the shape of the inner
acetabular wall at CT (or MRI); any inward protrusion should be termed PA.
In our assessment of PA, we also evaluated an MRI-based method published by Chen et al.
(62). Measurement of acetabular protrusion according to Chen et al. was possible in 68.9% of
all study persons and controls. Chen’s method requires that the ischial spine is depicted in the
same axial image as the medial most point of the acetabular fossa, and this was often not the
case. When the method could be used, it had a high interobserver reproducibility, but a low
accuracy in detecting PA. No statistically significant differences were found between
controls, Ghent positive patients, and Ghent negative persons suspected of having MFS.
Our study indicates that CT is a reliable method that should replace conventional radiography
in the diagnosis of PA. CT of the hips may be performed with low radiation dosage, but if
radiation dosage is a concern (young patients, repeated examinations), MRI may be
performed instead, most likely with the same accuracy as CT.
8.6 Pulmonary artery (paper IV)
Our study showed that when compared to normal values in healthy adult persons (72), more
than half (54%) of our adult patients with proven MFS had dilatation of the pulmonary artery
trunk, some (approx. 15%) even in the absence of dilatation of the aortic root or ascending
aorta.
38
The Ghent 1 criteria of 1996 (1;72) included dilatation of the pulmonary artery as a sign
(minor vascular criterion) of MFS, but in the revised criteria (Ghent 2) published in 2010 (8),
this criterion was omitted. Reasons given were that pulmonary artery dilatation is not specific
to the diagnosis of MFS, that complications of pulmonary artery disease are rarely seen, and
that further research is needed regarding thresholds and the diagnostic utility of this finding
(8). The uncertainty regarding threshold values for pulmonary artery dilatation is partly
caused by the vagueness of the Ghent 1 criteria with respect to the pulmonary artery. The
authors state that “until normal values for pulmonary artery diameter are available, dilatation
can be detected provisionally by echocardiography, CT or MRI using nomograms for the
aorta” (1). Furthermore, the Ghent 1 criteria do not specify which part of the pulmonary artery
should be measured, the root or the trunk. In search for literature on the pulmonary artery
diameter we found that most papers addressing upper normal values for the pulmonary artery
have considered the pulmonary artery trunk only, and among those performed with axial
imaging (66;72-75), only three have included an adequate number of subjects (72;74;75). The
126 subjects studied by Bozlar et al. (72) were imaged with nearly the same slice thickness as
our MFS patients, and the age distribution was furthermore similar, 30.6 ± 7.9 years and 35.1
± 11 years, respectively. Pulmonary hypertension and thoracic pathology had been excluded.
We therefore consider this group of healthy adults as an adequate control group for our study.
In our study “Prevalence data on all Ghent features in a cross-sectional study of 87 adults with
proven Marfan syndrome” (paper I) we found no MFS patients with dilated pulmonary artery
based on the Ghent 1 criteria. The large discrepancy between the findings of pulmonary artery
dilatation using nomograms for the aorta as recommended by Ghent 1 (1) and when using cut-
off values based on 2 SD above the mean value in healthy volunteers, suggests that
nomograms for the aorta are not suited for assessment of pulmonary artery dilatation.
Our preliminary measurements of native (not operated) aortic root diameters were performed
with echocardiography and resulted in 16 out of 57 MFS patients having dilated aortic root.
When remeasured with MR or CT, the number increased to 40 of 57. All aortic diameter
measurements (echocardiography, MR, CT) were plotted into a nomogram based on
echocardiographic measurements and included in the Ghent 1 criteria (1;65). The unusually
low prevalence of aortic root dilatation when measured with transthoracic echocardiography,
suggests that aortic root diameters were underestimated using this method. Echocardiographic
measurement of the aortic root is commonly performed using a parasternal long-axis view of

39
the aortic root and measuring from “leading edge to leading edge”, i.e. including the anterior
wall but not the posterior wall in the diameter measurement. The acoustic window is
restricted, and the maximum diameter of the vessel may not be included in the scan plane.
Aortic aneurysms are defined by their maximum outer diameter, and assessment of aortic
diameters with MRI or CT therefore usually includes the vessel wall on both sides of the
lumen. In addition, axial MRI and CT may overestimate vessel diameter due to obliquity of
the vessel with respect to the axial plane. Such overestimation will increase with increasing
slice thickness due to partial volume effects. A source of error is also the pulsatile variation in
aortic diameter from diastole to systole. With the multislice ECG-triggered MR technique
used in our study, the different slices will be imaged at different time points throughout the
cardiac cycle. The above mentioned factors may all have contributed to the discrepancies
between echocardiographic and MRI/CT measurements. The major differences in imaging
techniques also underscores the importance of using nomograms based on the same imaging
modality as the one used for measurements.
The Ghent 2 criteria suggest that a recent ECG-gated 64 channel MDCT study by Lin et al.
(34) should be used as reference material for CT examinations of the aorta. Here reference
values in adults for end-diastolic true short axis luminal diameters and areas of the aortic root
are presented. Lin et al. have also published reference values for the pulmonary artery using
the same MDCT technique (76). Due to the oval shape of the pulmonary artery in true short
axis view, averaged pulmonary artery diameters are presented as reference values.
Unfortunately, these reference materials could not be used in our study due to the differences
in examination techniques.
Although a large majority of the patients with dilated pulmonary artery trunk also had aortic
disease (40 out of 47 or 85.1%), a few of these patients (7 out of 47, 14.9%) had no sign of
ascending aortic disease, suggesting that pulmonary artery dilatation may be an early marker
of vascular disease in MFS patients.
The clinical implications of our findings are important. Pulmonary artery trunk dilatation is
common in MFS patients, and does not by itself imply pulmonary hypertension. Dilatation of
this vessel in an MFS patient may suggest MFS-related vascular affection even in the absence
of visible ascending aortic disease.

40
9. Conclusions
The general aim of this thesis was to explore the prevalence of different manifestations of
Marfan syndrome by using radiological methods, and to evaluate different imaging methods
in each organ system examined by radiological methods.
We found that in spite of a great diversity of combinations in fulfilling the diagnosis
according to the Ghent nosology, a combination of the dural major criterion and the
presence of genetic major criteria could identify a high percentage (79%) of all affected
individuals with MFS in our study population. This indicates an early investigation of
dura and genetic major criteria when suspicion of MFS has been raised in adults.
MR imaging of the lumbosacral spine is encouraged to identify DE and thus strengthen a
potential diagnosis of MFS. DE was found in a high percentage of our MFS patients (89%
of patients diagnosed as MFS without use of the criterion DE), and has a high specificity
for MFS. As much as 16% of the Ghent-positive patients were dependent of DE to fulfill
the diagnosis of MFS.
We suggest that the diagnosis of dural ectasia should be based on the presence of at least
one of the following criteria: 1) an anterior meningocele or nerve root sleeve herniation, 2)
DSD at level S1 or below larger than DSD at level L4, 3) DSR at level S1 > 0.59.
CT should be preferred to radiography in the diagnosis of PA. If radiation is a concern,
MRI may be used instead of CT. PA was found in more than two thirds of patients with
MFS. It has a low sensitivity, but a high specificity for the diagnosis of MFS. Our
measurement method CWD for assessment of degree of PA, was found to be robust and
highly reproducible, giving a direct measurement of pelvic protrusion irrespective of
pelvic shape.
Pulmonary artery dilatation is a common finding in MFS (54%), and should be assessed
using cut-off values based on pulmonary artery diameter measurements in the normal
population, and not on nomograms intended for the aorta. MR or CT imaging seems to
provide more reliable results for pulmonary artery dimensions than echocardiography.
Severe disease of the ascending aorta is a significant predictor of pulmonary artery trunk
dilatation in MFS patients, but such dilatation may occur even in the absence of visible
aortic disease.

41
10. Errata
Paper I, “Prevalence data on all Ghent features in a cross-sectional study of 87 adults
with proven Marfan syndrome”, Discussion, page 1227, second column: It is stated that
“Nollen’s upper limit of normality for the pulmonary trunk” was 34.8 mm. This is
incorrect; it should have been 28.0 mm.
Paper II, “Dural Ectasia in Marfan Syndrome: A Case Control Study”. Two errors occur:
1) “Study Population”, page 1535, first column: the mean (SD) ages are incorrect, it
should have been: mean (SD) age in men 35.1 (11.1) years, and in female 42.1 (13.5)
years. 2) “MR Imaging or CT of patients in the Study Population”, page 1535, first
column: incorrect name of MR unit, it should have been: “Signa LX, GE Healthcare,
Milwaukee, Wisconsin”.
Paper III, “CT of the hips in the investigation of protrusio acetabuli in Marfan syndrome.
A case control study”. Discussion, page 1490, first column: It is stated that “Steel et al.
studied PA in children and adults with MFS and found different percentages of PA
depending on the method of assessment; Steel´s method [12] gave 27% of the patients the
diagnosis of PA while the Armbuster method [13] gave 16%”. It should have been
“Sponseller et al. studied PA in children....”

42
11. References (1) De Paepe A., Devereux RB, Dietz HC, Hennekam RC, Pyeritz RE. Revised diagnostic criteria
for the Marfan syndrome. Am J Med Genet 1996 Apr 24;62(4):417-26. (2) Rand-Hendriksen S. Marfan Syndrome - A Diagnostic Challenge, aspects of a Norwegian
cohort study. University of Oslo, Norway, Clinical medicine; 2010. (3) Marfan AB. Un cas de déformation congénital des quatre membres plus prononcée aux
extrémities caractérisée par l`allongement des os avec un certain degré d`amincissement. Bull Mém Soc Méd Hôp 1896;13:220-6.
(4) McKusick VA. The cardiovascular aspects of Marfan's syndrome: a heritable disorder of connective tissue. Circulation 1955 Mar;11(3):321-42.
(5) Pyeritz RE. The Marfan syndrome. Annu Rev Med 2000;51:481-510. (6) Beighton P, De Paepe AM, Danks D, Finidori G, Gedde-Dahl T, Goodman R, et al.
International Nosology of Heritable Disorders of Connective Tissue, Berlin, 1986. Am J Med Genet 1988 Mar;29(3):581-94.
(7) Dietz HC, Cutting GR, Pyeritz RE, Maslen CL, Sakai LY, Corson GM, et al. Marfan syndrome caused by a recurrent de novo missense mutation in the fibrillin gene. Nature 1991 Jul 25;352(6333):337-9.
(8) Loeys BL, Dietz HC, Braverman AC, Callewaert BL, DeBacker J., Devereux RB, et al. The revised Ghent nosology for the Marfan syndrome. J Med Genet 2010 Jul;47(7):476-85.
(9) Rand-Hendriksen S, Tjeldhorn L, Lundby R, Semb SO, Offstad J, Andersen K, et al. Search for correlations between FBN1 genotype and complete Ghent phenotype in 44 unrelated Norwegian patients with Marfan syndrome. Am J Med Genet A 2007 Sep 1;143A(17):1968-77.
(10) Collod-Beroud G, Le Bourdelles S, Ades L, Ala-Kokko L, Booms P, Boxer M, et al. Update of the UMD-FBN1 mutation database and creation of an FBN1 polymorphism database. Hum Mutat 2003 Sep;22(3):199-208.
(11) Collod-Beroud G, Boileau C. Marfan syndrome in the third Millennium. Eur J Hum Genet 2002 Nov;10(11):673-81.
(12) Robinson PN, Arteaga-Solis E, Baldock C, Collod-Beroud G, Booms P, De Paepe AM, et al. The molecular genetics of Marfan syndrome and related disorders. J Med Genet 2006 Oct;43(10):769-87.
(13) Stheneur C, Collod-Beroud G, Faivre L, Buyck JF, Gouya L, Le Parc JM, et al. Identification of the minimal combination of clinical features in probands for efficient mutation detection in the FBN1 gene. Eur J Hum Genet 2009 Sep;17(9):1121-8.
(14) Disabella E, Grasso M, Marziliano N, Ansaldi S, Lucchelli C, Porcu E, et al. Two novel and one known mutation of the TGFBR2 gene in Marfan syndrome not associated with FBN1 gene defects. Eur J Hum Genet 2006 Jan;14(1):34-8.
(15) Singh KK, Rommel K, Mishra A, Karck M, Haverich A, Schmidtke J, et al. TGFBR1 and TGFBR2 mutations in patients with features of Marfan syndrome and Loeys-Dietz syndrome. Hum Mutat 2006 Aug;27(8):770-7.
(16) Neptune ER, Frischmeyer PA, Arking DE, Myers L, Bunton TE, Gayraud B, et al. Dysregulation of TGF-beta activation contributes to pathogenesis in Marfan syndrome. Nat Genet 2003 Mar;33(3):407-11.
(17) Dietz HC, Loeys B, Carta L, Ramirez F. Recent progress towards a molecular understanding of Marfan syndrome. Am J Med Genet C Semin Med Genet 2005 Nov 15;139C(1):4-9.
(18) Jones KB, Myers L, Judge DP, Kirby PA, Dietz HC, Sponseller PD. Toward an understanding of dural ectasia: a light microscopy study in a murine model of Marfan syndrome. Spine 2005 Feb 1;30(3):291-3.

43
(19) Ha HI, Seo JB, Lee SH, Kang JW, Goo HW, Lim TH, et al. Imaging of Marfan syndrome: multisystemic manifestations. Radiographics 2007 Jul;27(4):989-1004.
(20) Dean JC. Marfan syndrome: clinical diagnosis and management. Eur J Hum Genet 2007 Jul;15(7):724-33.
(21) Keane MG, Pyeritz RE. Medical management of Marfan syndrome. Circulation 2008 May 27;117(21):2802-13.
(22) Radonic T, De Witte P, Groenink M, de Bruin-Bon R, Timmermans J, Scholte A, et al. Critical appraisal of the revised Ghent criteria for diagnosis of Marfan syndrome. Clin Genet 2011 Feb 17.
(23) Gray JR, Bridges AB, Faed MJ, Pringle T, Baines P, Dean J, et al. Ascertainment and severity of Marfan syndrome in a Scottish population. J Med Genet 1994 Jan;31(1):51-4.
(24) von Kodolitsch Y, Robinson PN. Marfan syndrome: an update of genetics, medical and surgical management. Heart 2007 Jun;93(6):755-60.
(25) Rybczynski M, Bernhardt AM, Rehder U, Fuisting B, Meiss L, Voss U, et al. The spectrum of syndromes and manifestations in individuals screened for suspected Marfan syndrome. Am J Med Genet A 2008 Dec 15;146A(24):3157-66.
(26) Ramirez F, Dietz HC. Marfan syndrome: from molecular pathogenesis to clinical treatment. Curr Opin Genet Dev 2007 Jun;17(3):252-8.
(27) Silverman DI, Burton KJ, Gray J, Bosner MS, Kouchoukos NT, Roman MJ, et al. Life expectancy in the Marfan syndrome. Am J Cardiol 1995 Jan 15;75(2):157-60.
(28) Murdoch JL, Walker BA, Halpern BL, Kuzma JW, McKusick VA. Life expectancy and causes of death in the Marfan syndrome. N Engl J Med 1972 Apr 13;286(15):804-8.
(29) Hiratzka LF, Bakris GL, Beckman JA, Bersin RM, Carr VF, Casey DE, Jr., et al. 2010 ACCF/AHA/AATS/ACR/ASA/SCA/SCAI/SIR/STS/SVM guidelines for the diagnosis and management of patients with Thoracic Aortic Disease: a report of the American College of Cardiology Foundation/American Heart Association Task Force on Practice Guidelines, American Association for Thoracic Surgery, American College of Radiology, American Stroke Association, Society of Cardiovascular Anesthesiologists, Society for Cardiovascular Angiography and Interventions, Society of Interventional Radiology, Society of Thoracic Surgeons, and Society for Vascular Medicine. Circulation 2010 Apr 6;121(13):e266-e369.
(30) Ladouceur M, Fermanian C, Lupoglazoff JM, Edouard T, Dulac Y, Acar P, et al. Effect of beta-blockade on ascending aortic dilatation in children with the Marfan syndrome. Am J Cardiol 2007 Feb 1;99(3):406-9.
(31) Lavoie P, Robitaille G, Agharazii M, Ledbetter S, Lebel M, Lariviere R. Neutralization of transforming growth factor-beta attenuates hypertension and prevents renal injury in uremic rats. J Hypertens 2005 Oct;23(10):1895-903.
(32) Brooke BS, Habashi JP, Judge DP, Patel N, Loeys B, Dietz HC. Angiotensin II blockade and aortic-root dilation in Marfan's syndrome. N Engl J Med 2008 Jun 26;358(26):2787-95.
(33) Pyeritz RE, McKusick VA. The Marfan syndrome: diagnosis and management. N Engl J Med 1979 Apr 5;300(14):772-7.
(34) Lin FY, Devereux RB, Roman MJ, Meng J, Jow VM, Jacobs A, et al. Assessment of the thoracic aorta by multidetector computed tomography: age- and sex-specific reference values in adults without evident cardiovascular disease. J Cardiovasc Comput Tomogr 2008 Sep;2(5):298-308.
(35) Sommer T, Fehske W, Holzknecht N, Smekal AV, Keller E, Lutterbey G, et al. Aortic dissection: a comparative study of diagnosis with spiral CT, multiplanar transesophageal echocardiography, and MR imaging. Radiology 1996 May;199(2):347-52.
(36) Milewicz DM, Dietz HC, Miller DC. Treatment of aortic disease in patients with Marfan syndrome. Circulation 2005 Mar 22;111(11):e150-e157.
(37) Shiga T, Wajima Z, Apfel CC, Inoue T, Ohe Y. Diagnostic accuracy of transesophageal echocardiography, helical computed tomography, and magnetic resonance imaging for suspected thoracic aortic dissection: systematic review and meta-analysis. Arch Intern Med 2006 Jul 10;166(13):1350-6.

44
(38) Nelson JD. The Marfan syndrome, with special reference to congenital enlargement of the spinal canal. Br J Radiol 1958 Oct;31(370):561-4.
(39) Janjua MZ, Muhammad F. Measurements of the normal adult lumbar spinal canal. J Pak Med Assoc 1989 Oct;39(10):264-8.
(40) Oosterhof T, Groenink M, Hulsmans FJ, Mulder BJ, van der Wall EE, Smit R, et al. Quantitative assessment of dural ectasia as a marker for Marfan syndrome. Radiology 2001 Aug;220(2):514-8.
(41) Ahn NU, Nallamshetty L, Ahn UM, Buchowski JM, Rose PS, Garrett ES, et al. Dural ectasia and conventional radiography in the Marfan lumbosacral spine. Skeletal Radiol 2001 Jun;30(6):338-45.
(42) Sznajder M, Krug P, Taylor M, Moura B, Leparc JM, Boileau C, et al. Spinal imaging contributes to the diagnosis of Marfan syndrome. Joint Bone Spine 2010 Oct;77(5):445-50.
(43) Skalpe IO, Amundsen P. Thoracic and cervical myelography with metrizamide. Clinical experiences with a water-soluble, non-ionic contrast medium. Radiology 1975 Jul;116(1):101-6.
(44) Fishman EK, Zinreich SJ, Kumar AJ, Rosenbaum AE, Siegelman SS. Sacral abnormalities in Marfan syndrome. J Comput Assist Tomogr 1983 Oct;7(5):851-6.
(45) Villeirs GM, Van Tongerloo AJ, Verstraete KL, Kunnen MF, De Paepe AM. Widening of the spinal canal and dural ectasia in Marfan's syndrome: assessment by CT. Neuroradiology 1999 Nov;41(11):850-4.
(46) Pyeritz RE, Fishman EK, Bernhardt BA, Siegelman SS. Dural ectasia is a common feature of the Marfan syndrome. Am J Hum Genet 1988 Nov;43(5):726-32.
(47) Knirsch W, Kurtz C, Haffner N, Binz G, Heim P, Winkler P, et al. Dural ectasia in children with Marfan syndrome: a prospective, multicenter, patient-control study. Am J Med Genet A 2006 Apr 1;140(7):775-81.
(48) Habermann CR, Weiss F, Schoder V, Cramer MC, Kemper J, Wittkugel O, et al. MR evaluation of dural ectasia in Marfan syndrome: reassessment of the established criteria in children, adolescents, and young adults. Radiology 2005 Feb;234(2):535-41.
(49) Fattori R, Nienaber CA, Descovich B, Ambrosetto P, Reggiani LB, Pepe G, et al. Importance of dural ectasia in phenotypic assessment of Marfan's syndrome. Lancet 1999 Sep 11;354(9182):910-3.
(50) Altman A, Uliel L, Caspi L. Dural ectasia as presenting symptom of Marfan syndrome 1. Isr Med Assoc J 2008 Mar;10(3):194-5.
(51) Ahn NU, Sponseller PD, Ahn UM, Nallamshetty L, Rose PS, Buchowski JM, et al. Dural ectasia in the Marfan syndrome: MR and CT findings and criteria. Genet Med 2000 May;2(3):173-9.
(52) Ahn NU, Sponseller PD, Ahn UM, Nallamshetty L, Kuszyk BS, Zinreich SJ. Dural ectasia is associated with back pain in Marfan syndrome. Spine 2000 Jun 15;25(12):1562-8.
(53) Anderson SM. Spinal curves and scoliosis. Radiol Technol 2007 Sep;79(1):44-65. (54) Pomeranz MM. Intrapelvic protrusion of the acetabulum (Otto pelvis). 1932. Clin Orthop
Relat Res 2007 Dec;465:6-15. (55) McBride MT, Muldoon MP, Santore RF, Trousdale RT, Wenger DR. Protrusio acetabuli:
diagnosis and treatment. J Am Acad Orthop Surg 2001 Mar;9(2):79-88. (56) Van de Velde S, Fillman R, Yandow S. Protrusio acetabuli in Marfan syndrome. History,
diagnosis, and treatment. J Bone Joint Surg Am 2006 Mar;88(3):639-46. (57) Armbuster TG, Guerra J, Jr., Resnick D, Goergen TG, Feingold ML, Niwayama G, et al. The
adult hip: an anatomic study. Part I: the bony landmarks. Radiology 1978 Jul;128(1):1-10. (58) Sponseller PD, Jones KB, Ahn NU, Erkula G, Foran JR, Dietz HC. Protrusio acetabuli in
Marfan syndrome: age-related prevalence and associated hip function. J Bone Joint Surg Am 2006 Mar;88(3):486-95.
(59) Steel HH. Protrusio acetabuli: its occurrence in the completely expressed Marfan syndrome and its musculoskeletal component and a procedure to arrest the course of protrusion in the growing pelvis. J Pediatr Orthop 1996 Nov;16(6):704-18.

45
(60) Yule SR, Hobson EE, Dean JC, Gilbert FJ. Protrusio acetabuli in Marfan's syndrome. Clin Radiol 1999 Feb;54(2):95-7.
(61) Richards PJ, Pattison JM, Belcher J, Decann RW, Anderson S, Wynn-Jones C. A new tilt on pelvic radiographs: a pilot study. Skeletal Radiol 2009 Feb;38(2):113-22.
(62) Chen L, Boonthathip M, Cardoso F, Clopton P, Resnick D. Acetabulum protrusio and center edge angle: new MR-imaging measurement criteria--a correlative study with measurement derived from conventional radiography. Skeletal Radiol 2009 Feb;38(2):123-9.
(63) Gotway MB, Freemer MM, King TE, Jr. Challenges in pulmonary fibrosis. 1: Use of high resolution CT scanning of the lung for the evaluation of patients with idiopathic interstitial pneumonias. Thorax 2007 Jun;62(6):546-53.
(64) Wood JR, Bellamy D, Child AH, Citron KM. Pulmonary disease in patients with Marfan syndrome. Thorax 1984 Oct;39(10):780-4.
(65) Roman MJ, Devereux RB, Kramer-Fox R, O'Loughlin J. Two-dimensional echocardiographic aortic root dimensions in normal children and adults. Am J Cardiol 1989 Sep 1;64(8):507-12.
(66) Nollen GJ, van Schijndel KE, Timmermans J, Groenink M, Barentsz JO, van der Wall EE, et al. Pulmonary artery root dilatation in Marfan syndrome: quantitative assessment of an unknown criterion. Heart 2002 May;87(5):470-1.
(67) DeBacker J, Loeys B, Devos D, Dietz H, DeSutter J., DePaepe A. A critical analysis of minor cardiovascular criteria in the diagnostic evaluation of patients with Marfan syndrome. Genet Med 2006 Jul;8(7):401-8.
(68) Soylen B, Hinz K, Prokein J, Becker H, Schmidtke J, Arslan-Kirchner M. Performance of a new quantitative method for assessing dural ectasia in patients with FBN1 mutations and clinical features of Marfan syndrome. Neuroradiology 2009 Jun;51(6):397-400.
(69) Moore K R. Dural Dysplasia. In: Ross J.S, Brant Zawadski, Moore K R, Crim J, Chen M Z, Katzman G L, editors. Diagnostic Imaging Spine. Salt Lake City: Amirsys; 2004. p. 118-20.
(70) Jensen MC, Brant-Zawadzki MN, Obuchowski N, Modic MT, Malkasian D, Ross JS. Magnetic resonance imaging of the lumbar spine in people without back pain. N Engl J Med 1994 Jul 14;331(2):69-73.
(71) Van de Velde S, Fillman R, Yandow S. Protrusio acetabuli in Marfan syndrome: indication for surgery in skeletally immature Marfan patients. J Pediatr Orthop 2005 Sep;25(5):603-6.
(72) Bozlar U, Ors F, Deniz O, Uzun M, Gumus S, Ugurel MS, et al. Pulmonary Artery Diameters Measured by Multidetector-Row Computed Tomography in Healthy Adults. Acta Radiol 2007 Oct 24;1-6.
(73) Choe KO, Hong YK, Kim HJ, Joo SH, Cho BK, Chang BC, et al. The use of high-resolution computed tomography in the evaluation of pulmonary hemodynamics in patients with congenital heart disease: in pulmonary vessels larger than 1 mm in diameter. Pediatr Cardiol 2000 May;21(3):202-10.
(74) Edwards PD, Bull RK, Coulden R. CT measurement of main pulmonary artery diameter. Br J Radiol 1998 Oct;71(850):1018-20.
(75) Karazincir S, Balci A, Seyfeli E, Akoglu S, Babayigit C, Akgul F, et al. CT assessment of main pulmonary artery diameter. Diagn Interv Radiol 2008 Jun;14(2):72-4.
(76) Lin FY, Devereux RB, Roman MJ, Meng J, Jow VM, Simprini L, Jacobs A, Weinsaft JW, Shaw LJ, Berman DS, Callister TQ, Min JK. The right sided great vessels by cardiac multidetector computed tomography: normative reference values among healthy adults free of cardiopulmonary disease, hypertension, and obesity. Acad Radiol 2009 Aug;16(8):981-987.

46
12. Papers I - IV

Paper IPrevalence data on all Ghent features in a cross-sectional study of 87
adults with proven Marfan syndrome


Paper IIDural Ectasia in Marfan syndrome: A case control study


Paper IIICT of the hips in the investigation of protrusio acetabuli in Marfan
syndrome. A case control study


MUSCULOSKELETAL
CT of the hips in the investigation of protrusio acetabuliin Marfan syndrome. A case control study
Rigmor Lundby & Eva Kirkhus &
Svend Rand-Hendriksen & John Hald &
Are Hugo Pripp & Hans-Jørgen Smith
Received: 28 September 2010 /Revised: 10 December 2010 /Accepted: 6 January 2011 /Published online: 14 February 2011# The Author(s) 2011. This article is published with open access at Springerlink.com
AbstractObjectives To establish the prevalence of protrusio acetabuli(PA) in adults fulfilling the Ghent criteria for Marfansyndrome (MFS), and in a normal adult population.Methods 105 adults with probable MFS and 107 controlswere included. CT of the hips was obtained. A qualitativeassessment of PA was performed. A new method forestimating the degree of PA was introduced with measure-ment of the parameter CWD (circle-wall distance). Resultswere compared to an alternative method based on MRI [1].Results 87 of the study group fulfilled the Ghent criteria ofMFS (Ghent positives), and 18 did not (Ghent negatives).PA was diagnosed qualitatively in 74.7% of Ghent positivepersons, in 27.8% of Ghent negative persons, and in 3.7%of the controls. CWD was significantly different betweenthe three groups (p<0.001). A slight but significant genderdifference was found in Ghent positive persons only. Thealternative method did not differentiate between the groups
with respect to PA, but showed a significant differencebetween genders.Conclusions PAwas found significantly more often in MFSpersons than in controls. Our method was found to be robustand highly reproducible, giving a direct measurement ofpelvic protrusion irrespective of pelvic shape.
Keywords Marfan Syndrome . Computed tomography(CT) . Hip joint . Pelvic bones . Connective tissue diseases
Introduction
Protrusio acetabuli (PA) is an inward protrusion of theacetabulum as a rounded mass into the pelvis [2]. Pelvicintrusion and acetabular protrusion seem to be usedsynonymously. The degree of protrusion varies from afew millimetres to five centimetres [2]. PA is seen indifferent disorders including primary idiopathic cases andsecondary to neoplastic, infectious, metabolic, inflammato-ry, traumatic, congenital and genetic disorders [3].
PA is one of the eight manifestations that may contributeto the major skeletal criterion for Marfan syndrome (MFS)according to the Ghent nosology [4] (Table 1), and isincluded as one of the features of the “systemic score” inthe newly revised Ghent criteria [5].
A number of radiological features of PA have beensuggested, but no gold standard has emerged [6–8]. Anewly published study concludes that as pelvic tiltincreases, classic radiographic measurements of PAbecome unreliable, and that computed tomography ormagnetic resonance (MR) imaging probably will be morereliable [9].
In this case control study the aims were to establish theprevalence of PA in adult persons fulfilling the Ghent criteria
R. Lundby : S. Rand-Hendriksen :H.-J. SmithFaculty of Medicine, University of Oslo,Oslo, Norway
R. Lundby (*) : E. Kirkhus : J. Hald :H.-J. SmithDepartment of Radiology and Nuclear Medicine,Oslo University Hospital, Rikshospitalet,Sognsvannsvn. 20,0027 Oslo, Norwaye-mail: [email protected]
S. Rand-HendriksenTRS National Resource Centre for Rare Disorders,Sunnaas Rehabilitation Hospital,Nesoddtangen, Norway
A. H. PrippBiostatistics and Epidemiology Unit, Oslo University Hospital,Oslo, Norway
Eur Radiol (2011) 21:1485–1491DOI 10.1007/s00330-011-2073-y

Table 1 Diagnostic Criteria for Marfan syndrome (MFS) according to the Ghent nosology
System Major criteria Criterion for involvement
Skeletal Requires four of the eight manifestationslisted below
Requires two of the eight manifestations in the leftcolumn or one manifestation plus two minor criteria
Manifestations: Minor criteria
• Pectus carinatum • Pectus excavatum of moderate severity
• Pectus excavatum requiring surgery • Joint hypermobility (Beighton score≥4)• Reduced upper to lower segment ratio<0.85or Arm span to height ratio greater than 1.05
• Highly arched palate with crowding of teeth
• Wrist and thumb signs • Facial appearance (dolicocephaly, malar hypoplasia,enopthalmos, retrognathia, down-slantingpalpebral fissures)
• Scoliosis of>20° or spondylolisthesis
• Reduced extension at the elbows (< 170°)
• Medial displacement of the medialmalleolus causing pes planus
• Protrusio acetabuli of any degree
Ocular Ectopia lentis Requires two of the following three minor criteria
Minor criteria
• Abnormally flat cornea (< 41,5 dioptres)
• Increased axial length of the ocular globe (>23,5 mm)
• Hypoplastic iris or ciliary body
Cardiovascular • Dilatation of the ascending aorta with or withoutaortic regurgitation and involving at least thesinuses of Valsalva
Requires the presence of at least one major criterion orone minor criterion
• Dissection of the ascending aorta Minor criteria
• Mitral valve prolapse with or without mitral valveregurgitation
• Dilatation of the main pulmonary artery in the absenceof valvular or peripheral pulmonic stenosis or anyother obvious cause below the age of 40 years
• Calcification of the mitral annulus before the ageof 40 years
• Dilatation or dissection of the descending thoracicor abdominal aorta below the age of 50 years
Pulmonary None Requires at least one minor criterion
Minor criteria
• Spontaneous pneumothorax
• Apical blebs
Skin and Integument None Requires at least one minor criterion
Minor criteria
• Striae atrophicae (stretch marks) not associated withmarked weight changes, pregnancy or repetitive stress
• Recurrent or incisional herniae
Dura mater Major Criterion: None• Lumbosacral dural ectasia
Genetic • Having a parent, child or sib who meetsthese diagnostic criteria independently
None
• Presence of a mutation in FBN1 knownto cause the Marfan syndrome
• Presence of a FBN1 haplotype around FBN1, inheritedby descent, known to be associated with unequivocallydiagnosed Marfan syndrome in the family
Confirmation of the diagnosis requires the presence of at least two Major Criteria in two different organ systems and involvement of third organsystem. Family history / genetic is counted as an organ system
1486 Eur Radiol (2011) 21:1485–1491
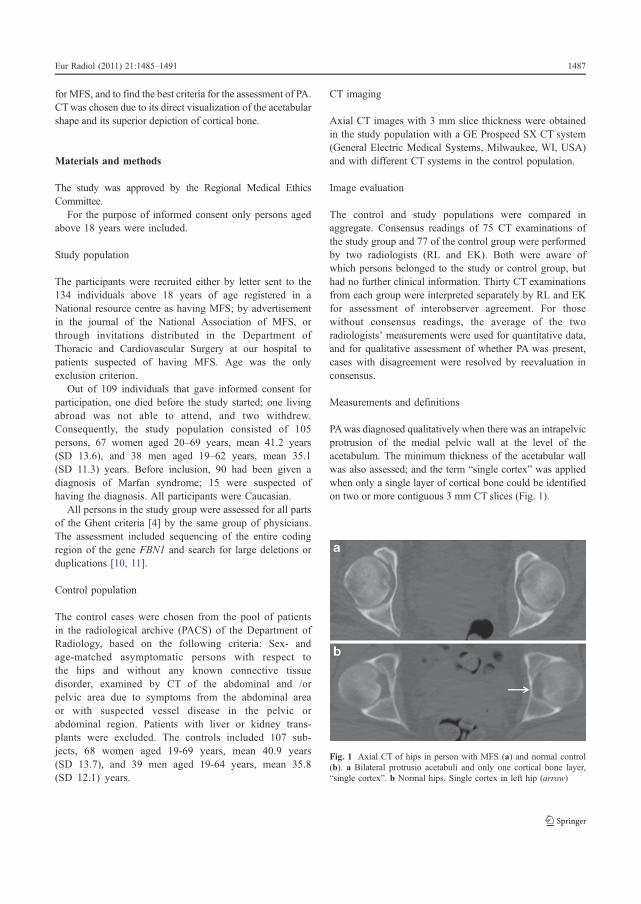
for MFS, and to find the best criteria for the assessment of PA.CTwas chosen due to its direct visualization of the acetabularshape and its superior depiction of cortical bone.
Materials and methods
The study was approved by the Regional Medical EthicsCommittee.
For the purpose of informed consent only persons agedabove 18 years were included.
Study population
The participants were recruited either by letter sent to the134 individuals above 18 years of age registered in aNational resource centre as having MFS; by advertisementin the journal of the National Association of MFS, orthrough invitations distributed in the Department ofThoracic and Cardiovascular Surgery at our hospital topatients suspected of having MFS. Age was the onlyexclusion criterion.
Out of 109 individuals that gave informed consent forparticipation, one died before the study started; one livingabroad was not able to attend, and two withdrew.Consequently, the study population consisted of 105persons, 67 women aged 20–69 years, mean 41.2 years(SD 13.6), and 38 men aged 19–62 years, mean 35.1(SD 11.3) years. Before inclusion, 90 had been given adiagnosis of Marfan syndrome; 15 were suspected ofhaving the diagnosis. All participants were Caucasian.
All persons in the study group were assessed for all partsof the Ghent criteria [4] by the same group of physicians.The assessment included sequencing of the entire codingregion of the gene FBN1 and search for large deletions orduplications [10, 11].
Control population
The control cases were chosen from the pool of patientsin the radiological archive (PACS) of the Department ofRadiology, based on the following criteria: Sex- andage-matched asymptomatic persons with respect tothe hips and without any known connective tissuedisorder, examined by CT of the abdominal and /orpelvic area due to symptoms from the abdominal areaor with suspected vessel disease in the pelvic orabdominal region. Patients with liver or kidney trans-plants were excluded. The controls included 107 sub-jects, 68 women aged 19-69 years, mean 40.9 years(SD 13.7), and 39 men aged 19-64 years, mean 35.8(SD 12.1) years.
CT imaging
Axial CT images with 3 mm slice thickness were obtainedin the study population with a GE Prospeed SX CT system(General Electric Medical Systems, Milwaukee, WI, USA)and with different CT systems in the control population.
Image evaluation
The control and study populations were compared inaggregate. Consensus readings of 75 CT examinations ofthe study group and 77 of the control group were performedby two radiologists (RL and EK). Both were aware ofwhich persons belonged to the study or control group, buthad no further clinical information. Thirty CT examinationsfrom each group were interpreted separately by RL and EKfor assessment of interobserver agreement. For thosewithout consensus readings, the average of the tworadiologists’ measurements were used for quantitative data,and for qualitative assessment of whether PA was present,cases with disagreement were resolved by reevaluation inconsensus.
Measurements and definitions
PAwas diagnosed qualitatively when there was an intrapelvicprotrusion of the medial pelvic wall at the level of theacetabulum. The minimum thickness of the acetabular wallwas also assessed; and the term “single cortex” was appliedwhen only a single layer of cortical bone could be identifiedon two or more contiguous 3 mm CT slices (Fig. 1).
Fig. 1 Axial CT of hips in person with MFS (a) and normal control(b). a Bilateral protrusio acetabuli and only one cortical bone layer,“single cortex”. b Normal hips. Single cortex in left hip (arrow)
Eur Radiol (2011) 21:1485–1491 1487

For quantification of PA we introduced a circle with10 cm radius. The circle was fitted to the inner pelvicwall at the level of the acetabulum where the cranialborder of the superior pubic ramus fuses with theanterior column of the acetabulum (Fig. 2). This levelusually also includes the fovea of the femoral head. Thecircle was adjusted to a best fit with the concavities of theinner walls of the anterior and posterior column of theacetabulum. The distance between the line of the circleand the medial most point of the inner pelvic wall of theacetabular fossa (circle-wall distance, CWD) was mea-sured (Fig. 2). A positive distance indicates that thismedial most point is medial to the circle, and a negativedistance that the inner acetabular wall extends lateral tothe circle. Increasing degrees of PA have increasingpositive values of CWD.
Quantification of PA was also done according to themethod described by Chen et al. [1]. In compliance withthis method, the “distance between the medial most point ofthe acetabular fossa and a line perpendicular to thehorizontal axis that passes through the lateral most pointof the posterior inner pelvic wall” was measured at the levelof the ischial spine. We named this distance the “fossa-linedistance” (FLD). For easier comparison of the twomethods, we decided to let positive values indicate PA, incontrast to Chen et al. who used negative values to indicateprotrusion.
Statistics
Continuous data were described as mean and standarddeviation or median, interquartile range and range for
normally distributed or skewed data, respectively. Categor-ical data were described as frequency and percentage.Differences between the study groups were analyzed withone-way ANOVA with post hoc multiple comparison usingBonferroni correction or Pearson chi-square tests asappropriate. Skewed data were analyzed with a non-parametric Kruskal-Wallis test. Interobserver agreementwas evaluated with intraclass correlation coefficient forcontinuous data and kappa statistics for categorical data.Receiver operating characteristic (ROC) curves were con-structed to assess the ability of CWD to differentiate MFSfrom controls and PA from normal hips. Significance levelwas set to 5%. All statistical analyses were performed bySPSS version 16.0 (SPSS, Chicago, Il).
Results
The study population was divided into two groups throughthe clinical assessment for MFS: 1) persons fulfilling theGhent criteria (Ghent positive, n=87), and 2) personssuspected of having MFS, but not fulfilling the Ghentcriteria (Ghent negative, n=18). The control populationconstituted the third group (n=107).
PA was diagnosed qualitatively on one or both sides in74.7% of Ghent positive persons, in 27.8% of Ghentnegative persons, and in 3.7% of the controls (Table 2).None of the participants were dependent on a diagnosis ofPA to become Ghent positive. PA, when present, wasbilateral in 81.5% of Ghent positive persons, in 100% ofGhent negative persons, and in 50% of controls.
Quantitative assessment of acetabular protrusion using the10 cm circle was possible in all study persons and controls.Measurement of CWD showed statistically significant differ-ences between the three groups (Table 2). The median CWDwas 3 mm (range 0.0–9.0 mm) in Ghent positive persons,0 mm (range -0.5–5.0 mm) in Ghent negative persons, and0 mm (range -3.0–2.0 mm) in controls. ROC analysis ofCWD vs. qualitative diagnosis of PA showed an area underthe curve of 0.99 (95% CI 0.98–1.0); a CWD cut-off valueof 1.25 mm resulted in a sensitivity and specificity for PA of95.5% and 97.6%, respectively. ROC analysis of CWD indifferentiating MFS from controls showed a sensitivity andspecificity in diagnosing MFS of 68.8% and 97.2%,respectively, when using a CWD cut-off value of 1.25 mm(Fig. 3).
Measurement of acetabular protrusion according to Chenet al. [1] was possible in 146 (68.9%) of all study personsand controls. No statistically significant differences be-tween the three groups were found. The median FLD was0.0 mm (range -7.0–8.0 mm) in Ghent positive persons,0.25 mm (range -3.0–3.0 mm) in Ghent negative persons,and 0.0 mm (-7.0–6.0 mm) in controls.
Fig. 2 Axial CT of hips in a case of MFS with bilateral PA. A 10 cmradius circle is adapted to the inner acetabular wall of the right hip,and measurement of CWD is indicated. Osteoarthritis in left hip
1488 Eur Radiol (2011) 21:1485–1491

Statistically significant differences between women andmen were found in all three groups when using the Chenmethod (Fig. 4). Median FLDs in women and men,respectively, were 1.0 and 0.0 mm in Ghent positivepersons; 1.0 and −2.0 mm in controls. Relatively largepositive values of FLD could be found in women also in theabsence of PA (Fig. 5).
With our circle method, significant gender differenceswere not found, except for the Ghent positive personswhere women had slightly larger median CWDs than men(3.0 vs. 2.0 mm).
“Single cortex” was found on at least one side in 94.3%of Ghent positive persons, in 83.3% of Ghent negativepersons, and in 57% of the controls. When presence of“single cortex” was calculated as percentage of number ofhips, the figures for these three groups were 93.5%, 69.4%,
and 50.9%, respectively. These differences between thegroups were statistically significant (Table 2).
Interobserver study
The interobserver agreement for assessing PA qualitativelywas high with a kappa value (κ) of 0.88 (95% CI 0.81–0.95) for the right hip and 0.92 (CI 0.81–1.0) for the lefthip. The circle method had an interclass correlationcoefficient (ICC) of 0.91 (95% CI 0.89–0.95) and 0.89(95% CI 0.81–0.93) on the right and left side, respectively.For the Chen method, ICC was 0.95 (95% CI 0.91–0.97)and 0.94 (95% CI 0.90–0.97) on the right and left side,respectively. The kappa value (κ) for assessment of singlecortex was 0.84 (CI 0.69–0.99) for the right hip and 0.83(CI 0.67–0.99) for the left hip.
Method Gender
Chen (female)Chen (male)Circle (female)Circle (male)
Cir
cle
Wal
l Dis
tan
ce (
mm
)
10.00
5.00
0.00
-5.00
-10.00
Fo
ssa -Lin
e Distan
ce (mm
)
10.00
5.00
0.00
-5.00
-10.00
Not fulfilling GhentFulfilling GhentControl group
Fig. 4 Boxplots showing median, interquartile distance and range ofcircle-wall distance (CWD) measured with Circle method and fossa-line distance (FLD) measured with Chen’s method [1], for males andfemales, respectively
Fig. 3 ROC curve of CWD as a marker of MFS when comparingGhent positive patients and controls
Table 2 Characteristics of the Ghent positive persons, Ghent negative persons, and controls, in total 212 persons and 420 assessable hips(4 total hip prostheses)
Characteristics Ghent positives Ghent negatives Controls P value
No. of hips (persons) 170 (87) 36 (18) 214 (107)
Age [mean (SD)] 39.6 (13.0) 36.1 (13.4) 39.0 (13.3) 0.592
Females [n (%)] 56 (64.4%) 11 (61.1%) 68 (63.6%) 0.966
PA qualitative method, number (percent)of group
65 (74.7%) 5 (27.8%) 4 (3.7%) < 0.001
PA qualitative method, number (percent) of hips 116 (68.2%) 10 (27.8%) 6 (2.8%) < 0.001
Single cortex, number (percent) of hips 159 (93.5%) 25 (69.4%) 109 (50.9%) < 0.001
CWD, Circle method on hips, mm[median (min, max)]
3.0 (0.0, 9.0) 0.0 (−0.5, 5.0) 0.0 (−3,0 2.0) < 0.001
FLD, Chen method on hips, mm [median (min, max)] 0.0 (−7.0, 8.0) n=116 0.25 (−3.0, 3.0) n=20 0.0 (−7.0, 6.0) n=144 0.322
If n is specified in a cell, the number of hips included in that measurement is different from the number included in the study. PA protrusioacetabuli, CWD circle-wall distance, FLD fossa-line distance
Eur Radiol (2011) 21:1485–1491 1489

Discussion
PA is one of the manifestations that may contribute to thediagnosis of MFS [4], however, diagnosing PA has been apoint of discussion since the accuracy of measurements onplain pelvic radiographs is uncertain and may vary withpelvic tilt [9]. Few authors have assessed the differentradiological methods in a validated way [9], and thedefinition of PA has varied depending on the radiologicalmethod used [8].
The reported prevalence of PA inMFS has varied in differentstudies [7]. Steel et al. studied PA in children and adults withMFS and found different percentages of PA depending on themethod of assessment; Steel´s method [12] gave 27% of thepatients the diagnosis of PAwhile the Armbuster method [13]gave 16%. Yule et al. [6] found that 60% of their MFSpatients had PA using the relationship of the acetabular line tothe ilioischial line as the sole criterion of PA. In their study,7% of the controls had PA based on this method.
Qualitative assessment of PA in our study was defined asany degree of intrapelvic protrusion of the medial pelvicwall at the level of the acetabulum. Using this criterion, wefound a very high percentage of PA in our MFS persons(74.7%) as compared to the controls (3.7%). The finding ofPA in 27.8% of the persons suspected of having MFS butnot fulfilling the Ghent criteria, probably reflects thatseveral of these persons had other connective tissuediseases that might predispose for PA. Of the 18 persons,five had Loeys-Dietz syndrome; one vascular Ehlers-Danlos syndrome, and one homocystinuria [11].
For quantitative assessment of differences in medialprotrusion of the acetabulum we developed the “circlemethod” with a standard radius. The method was quick andeasy to apply, with a high interobserver reproducibility. Wefound a 10 cm radius circle to have an arc similar to the
concavity of the inner pelvic wall at the acetabulum in mostnormal adults. The vast majority of the controls thereforehad no distance between the circle and the medial pelvicwall at this level, i.e. a CWD of 0 mm. A threshold valuefor CWD with respect to PA occurs when the inner pelvicacetabular wall is flat. The actual CWD in these cases willvary slightly with the anteroposterior size of the acetabulum,i.e. with the distance between the two points where the circlecrosses the acetabular wall anteriorly and posteriorly. Wefound this distance to be in the order of 3–3.5 cm,corresponding to a CWD of 1.1–1.5 mm. Our ROC analysissuggested a cut-off value of 1.25 mm.
Measurement of CWD with our circle method confirmeda statistically significant difference between the threegroups, PA being both more frequent and more severe inGhent positive persons, with a maximum CWD of 9.0 mmas compared to 5.0 mm and 2.0 mm in Ghent negativepersons and controls, respectively. Due to the fact thatapproximately 25% of the Ghent positive persons did nothave PA, CWD was not a very sensitive marker of MFS(Fig. 3). The less than 100% specificity with the optimumcut-off value of CWD reflects the finding that evenpresumed normals may have a slight degree of PA.
The quantitative method for assessment of PA as describedby Chen et al. [1] could be applied in approximately twothirds of the cases, the main reason for failure beingconsiderable asymmetry and pelvic tilt. Chen’s methodrequires that the ischial spine is depicted in the same axialimage as the medial most point of the acetabular fossa, andthis was often not the case. When the method could be used,it had a high interobserver reproducibility, but a low accuracyin detecting PA. Somewhat unexpectedly, Chen’s methodshowed significant gender differences not shown by our circlemethod (except in the Ghent positive persons). This may beexplained by a difference in pelvic shape between genders.The pelvic outlet in women tends to be wider than in men,resulting in a higher degree of convergence of the anteriorpelvic walls. In addition, women have increased backwardsacral tilt compared to men [14], which will enhance anteriorconvergence. A high anterior convergence can make theacetabulum project medial to the inner pelvic wall of theposterior column (Fig. 5), giving a false impression of PA.
Our circle method is not influenced by anterior conver-gence of the pelvic walls, and the slight gender differencein CWD found with this method in Ghent positive persons,may therefore reflect a real difference between the sexeswith respect to development of PA in MFS.
We found bilateral PA more often in Ghent positivepersons than in the controls, probably reflecting that MFS isa systemic disorder which is likely to affect both hips withthe same frequency.
The finding of “single cortex” for the acetabulum wasalways present in cases of PA. It seems likely that the same
Fig. 5 Axial CT of the hips in female control. Relatively large FLD(5.5 mm), but no protrusio acetabuli. Lines drawn according tomethod by Chen et al [1]
1490 Eur Radiol (2011) 21:1485–1491

mechanism that leads to inward protrusion of the acetabularwall also will result in thinning of the wall. “Single cortex”was however observed also in hips without PA as more thanhalf of our normal controls (57%) had “single cortex” of theacetabulum, but in a smaller part of the acetabular wallcompared to hips with PA (Fig. 1).
Our study has several limitations. The choice of a 10 cmradius circle for measuring the degree of protrusion wassomewhat arbitrary, adjusted to the concavity of the inneracetabular wall of most adult hips. This inner concavity is notalways uniform; the curvature of the arc may change fromanterior to posterior. In cases of PA, when the circle crossesthe inner pelvic acetabular wall at two points, the value ofCWD is not only dependent on the degree of PA, but also onthe distance between the crossing points, which again isdetermined by the placement of the circle. Our interobserverstudy indicates, however, that placement of the circle andmeasurement of CWD could be done with high reproducibil-ity. Using a somewhat larger circle in adults would have hadminor influence on the results. Replacing the 10 cm circlewith e.g. a 12 cm circle would have changed the thresholdvalues of CWD (a flat inner pelvic acetabular wall) from 1.1–1.5 mm (see above) to 1.0–1.3 mm. A smaller circle wouldhave to be used for similar measurements in children. Whentesting a new method for accuracy, it should ideally becompared to an independent and established gold standard. Inthis case, there was no such gold standard, and the sensitivityand specificity of the circle method in diagnosing PA, wastherefore calculated using qualitative assessment of PA withCT as gold standard.
CT of the hips can be performed with low radiationdosage, but persons with hereditary connective tissuediseases are often subject to diagnostic procedures, andmethods using ionizing radiation should be kept to aminimum. MR imaging would probably have given similarresults with respect to assessment of PA.
Conclusions
PAwas found significantly more often in MFS persons thanin controls. Our circle method was found to be robust andhighly reproducible, giving a direct measurement of thedegree of pelvic protrusion irrespective of pelvic shape. CTgives an excellent view of the hips, and should be preferredto radiography in the diagnosis of PA.
Acknowledgement We thank Finn G. Lilleås, MD, Curato, for hiscontribution to this work.
Open Access This article is distributed under the terms of theCreative Commons Attribution Noncommercial License which per-mits any noncommercial use, distribution, and reproduction in anymedium, provided the original author(s) and source are credited.
References
1. Chen L, Boonthathip M, Cardoso F, Clopton P, Resnick D (2009)Acetabulum protrusio and center edge angle: new MR-imagingmeasurement criteria–a correlative study with measurementderived from conventional radiography. Skeletal Radiol 38:123–129
2. Pomeranz MM (2007) Intrapelvic protrusion of the acetabulum(Otto pelvis) (1932) Clin. Orthop Relat Res 465:6–15
3. McBride MT, Muldoon MP, Santore RF, Trousdale RT, WengerDR (2001) Protrusio acetabuli: diagnosis and treatment. J AmAcad Orthop Surg 9:79–88
4. De Paepe A, Devereux RB, Dietz HC, Hennekam RC, Pyeritz RE(1996) Revised diagnostic criteria for the Marfan syndrome. Am JMed Genet 62:417–426
5. Loeys BL, Dietz HC, Braverman AC, Callewaert BL, De BJ,Devereux RB, Hilhorst-Hofstee Y, Jondeau G, Faivre L, MilewiczDM, Pyeritz RE, Sponseller PD, Wordsworth P, De Paepe AM(2010) The revised Ghent nosology for the Marfan syndrome. JMed Genet 47:476–485
6. Yule SR, Hobson EE, Dean JC, Gilbert FJ (1999) Protrusioacetabuli in Marfan's syndrome. Clin Radiol 54:95–97
7. Van deVelde S, Fillman R, Yandow S (2006) Protrusio acetabuliin Marfan syndrome. History, diagnosis, and treatment. J BoneJoint Surg Am 88:639–646
8. Armbuster TG, Guerra J Jr, Resnick D, Goergen TG, FeingoldML, Niwayama G, Danzig LA (1978) The adult hip: an anatomicstudy. Part I: the bony landmarks. Radiology 128:1–10
9. Richards PJ, Pattison JM, Belcher J, Decann RW, Anderson S,Wynn-Jones C (2009) A new tilt on pelvic radiographs: a pilotstudy. Skeletal Radiol 38:113–122
10. Rand-Hendriksen S, Tjeldhorn L, Lundby R, Semb SO, Offstad J,Andersen K, Geiran O, Paus B (2007) Search for correlationsbetween FBN1 genotype and complete Ghent phenotype in 44unrelated Norwegian patients with Marfan syndrome. Am J MedGenet A 143A:1968–1977
11. Rand-Hendriksen S, Lundby R, Tjeldhorn L, Andersen K, OffstadJ, Semb SO, Smith HJ, Paus B, Geiran O (2009) Prevalence dataon all Ghent features in a cross-sectional study of 87 adults withproven Marfan syndrome. Eur J Hum Genet 17(10):1222–30,Epub 2009 Mar 18
12. Steel HH (1996) Protrusio acetabuli: its occurrence in thecompletely expressed Marfan syndrome and its musculoskeletalcomponent and a procedure to arrest the course of protrusion inthe growing pelvis. J Pediatr Orthop 16:704–718
13. Sponseller PD, Jones KB, Ahn NU, Erkula G, Foran JR, Dietz HCIII (2006) Protrusio acetabuli in Marfan syndrome: age-relatedprevalence and associated hip function. J Bone Joint Surg Am88:486–495
14. Soames RW (1995) Skeletal System, p. 674. In: Gray H (ed)Gray's anatomy. The anatomical basis of medicine and surgery,Churchill Livingstone, Edinburgh, London, New York, Philadel-phia, Sydney, Toronto
Eur Radiol (2011) 21:1485–1491 1491


Paper IVThe pulmonary artery in Marfan syndrome patients.
A cross-sectional study


The pulmonary artery in Marfan syndrome patients. A cross-sectional
study
Rigmor Lundby1,2, Svend Rand-Hendriksen1,3, John K. Hald2, Are Hugo Pripp4, Hans-Jørgen
Smith1,2
1Faculty of Medicine, University of Oslo, Oslo, Norway2Department of radiology and nuclear medicine, Oslo University Hospital, Oslo, Norway3TRS National Resource Centre for Rare Disorders, Sunnaas Rehabilitation Hospital,
Nesoddtangen, Norway4Biostatistics and Epidemiology Unit, Oslo University Hospital, Oslo, Norway
Corresponding author:
Rigmor Lundby
Address: Department of radiology and nuclear medicine, Oslo University Hospital,
Rikshospitalet, Sognsvannsveien 20, N-0027 Oslo, Norway
e-mail: [email protected]

2
Abstract
Objectives To establish the prevalence of pulmonary artery dilatation in Marfan syndrome
(MFS) by modern radiological methods, to correlate diameter of the vessel with aortic
disease, and explore predictors of pulmonary artery dilatation in MFS.
Methods MR or CT imaging of the pulmonary artery and aorta was performed in 87 patients
with proven MFS. Diameters of the pulmonary artery root and trunk, and of the aortic root
were measured perpendicular to the long axis of the vessels; pulmonary artery diameters on
axial images, and aortic diameters on oblique sagittal images.
Results Compared to normal values in the literature, 47 of the 87 patients (54%) had widened
pulmonary artery trunk (
The mean (SD) ratio between pulmonary artery root and trunk diameters was 1.18 (0.155).
Multivariate analysis showed that ascending aortic surgery and high BSA were associated
with dilatation of the pulmonary artery trunk.
Conclusions Pulmonary artery dilatation is found in a high proportion of MFS patients, and
should be assessed using cut-off values based on pulmonary artery diameter measurements in
the normal population. Severe disease of the ascending aorta is a significant predictor of
pulmonary artery trunk dilatation in MFS patients.
Keywords
Pulmonary artery, aorta, MR imaging, connective tissue disease, Marfan syndrome

3
Introduction
Marfan syndrome (MFS) is an autosomal dominant genetic connective tissue disorder
characterized by manifestations in many organ systems, stated in the Ghent criteria from 1996
(“Ghent 1 criteria”) [1]. The diagnosis is based on findings in skeleton, eyes, the
cardiovascular and pulmonary systems, the skin and integument, dura, a family history, and
mutations in the gene encoding for fibrillin one (FBN1) [1, 2]. A major and frequent
cardiovascular criterion of MFS is dilatation of the ascending aorta and aortic root. To fulfil
the major cardiovascular criterion in the Ghent nosology, the aortic root and/or ascending
aorta must be affected.
According to the Ghent nosology from 1996 “dilatation of the main pulmonary artery, in the
absence of valvular or peripheral pulmonary stenosis or any other obvious cause, below the
age of 40 years” is considered a minor cardiovascular criterion of MFS [1]. Although
dilatation of the aortic root and pulmonary artery often are coexistent [3], it has been
suggested that pulmonary artery dilatation may be a sign of cardiovascular involvement in
MFS patients even in the absence of aortic disease [3].
Dilatation of the pulmonary artery is described as a sign of MFS in many articles [1, 3-7], but
documentation of the proportion of patients with dilated pulmonary artery in the MFS
population with modern radiological methods, is sparse. Revised Ghent criteria were
published in 2010 (“Ghent 2 criteria”) [8], and here dilatation of the pulmonary artery is not
included. Lack of specificity and incomplete knowledge of threshold values for dilatation of
the pulmonary artery are among the reasons for excluding dilatation of this structure from the
Ghent criteria. Further research was recommended.
In the present study, the axial diameters of the pulmonary artery root and trunk and the
oblique sagittal diameter of the aortic root were measured with MR imaging or CT in a cohort
of 87 patients with proven MFS without other known causes of pulmonary artery dilatation.
Measurements were compared to normal values based on MR and CT in the literature. The
aims were to find the prevalence of dilated pulmonary artery in MFS, to correlate diameters of
the vessel with aortic disease, and to explore predictors of pulmonary artery dilatation in
MFS.
Materials & Methods
The study was approved by the regional medical ethics committee; and for the purpose of
informed consent, only patients older than 18 years of age were included.
None of the patients were suspected of having pulmonary hypertension.

4
Study population
The participants were recruited either by letter sent to the 134 individuals above 18 years of
age registered in a National resource centre as having MFS; by advertisement in the journal of
the National Association of MFS, or through invitations distributed in the Department of
Thoracic and Cardiovascular Surgery at our hospital to patients suspected of having MFS.
Age was the only exclusion criterion before the examinations. Out of 109 individuals that
gave informed consent for participation, one died before the study started; one living abroad
was not able to attend, and two withdrew. All 105 participants were Caucasian. All patients
were assessed for all parts of the Ghent criteria (Ghent 1) [1] by the same group of physicians.
For assessment of fulfilment of the major cardiovascular criterion in the Ghent nosology,
information about previous surgery due to dilatation or dissection of the ascending aorta, and
dilatation of the ascending aorta measured with echocardiography was used [1, 9].The
assessment of Ghent criteria included sequencing of the entire coding region of the gene
FBN1 and search for large deletions or duplications [9].
MR or CT of the aorta and pulmonary artery
This study was a substudy of the “Norwegian Marfan Study”. In this part of the study MR
imaging of the aorta and the pulmonary artery was performed unless contraindicated when CT
examinations were obtained instead.
MR imaging at 1.5 T (Signa LX, GE Healthcare, Milwaukee, Wisconsin) of the aorta and
pulmonary artery in axial and oblique sagittal planes was performed using a standard ECG-
gated T1-weighted SE sequence. Repetition time equalled the R–R interval, echo time was
minimum 9.32 ms to maximum 39.976 ms, slice thickness was 7 mm in the axial plane, and 4
mm in the oblique sagittal plane.
Non-enhanced axial CT images with 5 mm slice thickness were obtained on a ProSpeed SX
scanner (GE Healthcare, Milwaukee, Wisconsin) in patients in whom MRI was
contraindicated. As part of assessment of all Ghent criteria, HRCT of the lungs was
performed as well.
Measurements and estimations
Consensus readings were performed by two radiologists (HJS and RL) of all MR and CT
examinations. Aortic dimensions were assessed perpendicular to the long axis of the vessel on
oblique sagittal images at the level of the sinuses of Valsalva (aortic root). Main pulmonary

5
artery dimensions were assessed perpendicular to the long axis of the artery on axial images at
two levels: the pulmonary artery root, and the pulmonary artery trunk at the pulmonary artery
bifurcation (Fig. 1).
Figure 1. Axial MR images of 63-year-old male MFS patient. Diameter measurement of the pulmonary artery
trunk (a) and pulmonary artery root (b) is indicated. The ascending aorta is replaced by a graft.
In the present substudy, fulfilment of the major cardiovascular criterion for MFS was
reassessed using MR or CT measurements of all native ascending aortas. The aortic root
diameter and body surface area (BSA) for each participant were plotted in Roman et al.´s
nomogram [1, 10].
This major criterion was also considered fulfilled in participants having previous surgery on
the ascending aorta due to dilatation or dissection.
Assessment of pulmonary artery dilatation (root and trunk) according to Ghent 1 criteria was
performed using nomograms for the aortic root [1]. Pulmonary artery trunk dilatation was
reassessed by comparison with recently published data on normal values based on 5 mm axial
CT imaging, suggesting a mean diameter of 24.0 mm and an upper limit of 29.6 mm (24.0
mm + 2 SD) for the normal pulmonary artery trunk in adults [11]. Using an electronic calliper
with 1 mm increments, we defined pulmonary trunk dilatation as diameters
reassessment.
Statistics
Data were described as mean (standard deviation) or frequency (percentage) for continuous or
categorical variables, respectively. Univariate statistical analysis on differences between
groups were analysed with independent sample t-test or chi-square, as appropriate, and
correlation assessed with Pearson correlation coefficient. Multivariate analysis on factors
influencing pulmonary artery diameter was done with a multiple linear model. The statistical

6
level of significance was 5%. All analyses were conducted with SPSS version 18 (SPSS Inc,
Chicago, IL).
Results
Eighty-seven out of 105 persons (56 female) fulfilled the Ghent 1 criteria for MFS, and in the
present substudy of a national Marfan Study, these 87 persons constituted the study group.
The mean (SD) age in men were 35.1 (11.1) years, and in female 42.1 (13.5) years.
Characteristics of the study population are given in Table 1.
Table 1. Characteristics of study population given as mean (SD) or number of patients (percentage). Diameters measured by MR or CT.
Patient characteristicsNumber of patients 87Female 56 (64.4%)Age (years) 39.6 (13.0)Weight (kg) 82.7 (17.3)Height (cm) 184.2 (10.6)BSA (m2) 2.07 (0.24) BMI (kg/cm2) 24.7(4.38)Diameter of aortic roots (mm) without previous aortic surgery, n=56 36.6 (6.9)Patients with previous surgery on ascending aorta 30 (34.5%)Pulmonary artery root diameter (mm), n=86 35.0 (4.6)Pulmonary artery trunk diameter (mm) 29.8 (3.8)Pulmonary artery trunks widened according to Ghent 1 criteria (1996) 0Pulmonary artery roots widened according to Ghent 1 criteria (1996) 7Pulmonary artery trunks widened according to cut-off 30 mm 47 (54%)Pulmonary artery roots widened according to cut-off 34.8 mm, n=86 43 (50%)
MR imaging was contraindicated in six persons, and CT was therefore performed instead. In
five of the 81 thoracic MR examinations of the study group, image quality was inadequate for
measurement of pulmonary artery dimensions; in these five cases HRCT was available for
diameter measurements. In one of the 87 patients neither MR nor CT had adequate depiction
of the pulmonary artery root, and the diameter could therefore not be measured.
MR and CT measurements of the pulmonary artery showed mean (SD) diameters of the
pulmonary artery root and trunk of 35.0 (4.6) mm and 29.8 (3.8) mm, respectively. The
pulmonary artery root was found to have larger diameter than the trunk in most cases, and the
mean (SD, range) ratio between the pulmonary artery root and trunk was 1.18 (0.155, 0.78-
1.58).

7
According to Ghent 1 criteria for pulmonary artery dilatation [1], which are based on
nomograms of the aortic root, 7 out of 39 patients (17.9%) under 40 years of age had dilated
pulmonary artery root, while none had dilatation of the pulmonary artery trunk. Compared to
published normal values for adult pulmonary artery trunk diameters [11], 47 (54%) of the 87
patients had dilated pulmonary artery trunk with a diameter
Thirty (34.5 %) of the 87 persons had previous surgery on the ascending aorta.
Echocardiographic measurements in the remaining 57 patients showed that 16 of these
patients had dilated aortic root according to the Ghent 1 criteria (nomograms by Roman et al.)
[9], however, when the aortic root diameters were reassessed with MR or CT, 40 of the 57
aortic roots were found to be dilated. Based on MR or CT a total of 70 (80.5%) patients thus
fulfilled the major cardiovascular criterion for MFS. The MR or CT measured mean (SD)
aortic root diameter in the 57 patients with native ascending aorta was 41.3 (6.1) mm.
Seven (14.9%) of the 47 patients with pulmonary artery trunk diameter
diameter of the aortic root, 20 (42.6%) had a dilated native aortic root, and 20 (42.6%) had
previous surgery on the ascending aorta.
Table 2. Pulmonary artery diameters in relation to patient characteristics.
Diameter of pulmonary artery root, n = 86
p-value pulmonary artery root
Diameter of pulmonary artery trunk, n = 87
p-value pulmonary artery trunk
Gender, mean (SD) mmMaleFemale
36.2 (4.2)34.4 (4.7)
0.063 29.9 (3.1)29.8 (4.2)
0.932
Age, correlation 0.300 0.005 0.182 0.091Height, correlation 0.261 0.015 0.147 0.173Weight, correlation 0.425 < 0.001 0.353 0.001BMI, correlation 0.265 0.014 0.185 0.086BSA, correlation 0.385 < 0.001 0.285 0.007Previous surgery ascending aorta, mean (SD) mm
YesNo
36.5 (5.1) 34.2 (4.1)
0.035 31.32 (4.7)29.0 (3.0)
0.017
There were no significant differences between genders with respect to pulmonary artery
diameters, but a tendency towards larger pulmonary artery root diameters in men (p=0.063)
(Table 2). The pulmonary artery root diameters correlated significantly with age, height,
weight, BMI and BSA, while the pulmonary artery trunk diameters had significant positive

8
correlation with weight and BSA only (Table 2). Pulmonary artery root and trunk diameters
were significantly larger in patients with previous surgery on the ascending aorta compared to
those without such surgery (p=0.041 and p=0.027, respectively) (Table 2). Pulmonary artery
trunk diameters were significantly larger in patients with ascending aortic disease (dilatation
or previous surgery) than in those without (p=0.018), but the pulmonary artery root diameters
were not significantly larger in this patient group (p=0.104).
A multivariate analysis of variables that potentially may have influenced the pulmonary artery
root and trunk diameters is shown in Table 3. For the pulmonary artery root, age (p=0.009)
and BSA (p=0.028) were the only parameters which correlated significantly with the vessel
diameter. Previous surgery on the ascending aorta (p=0.005) and BSA (p=0.004) correlated
significantly with the pulmonary artery trunk diameter.
Table 3. Multivariate analysis of variables that might affect pulmonary artery diameters.
A. Dependent variable: diameter of pulmonary artery root
Parameter Coeffient (95% CI) p-value
Ascending aorta
Dilated 0.73 (-1.68; 3.15) 0.55
Previous surgery 2.00 (-0.54; 4.54) 0.12
Male gender 0.77 (-1.67; 3.22) 0.53
Age 0.098 (0.025; 0.17) 0.009
BSA 5.38 (0.60; 10.16) 0.028
BMI 0.13 (-0.098; 0.35) 0.27
B. Dependent variable: diameter of the pulmonary artery trunk.Parameter Coeffient (95% CI) p-value
Ascending aorta
Dilated 1.68 (-0.42; 3.77) 0.12
Previous surgery 3.18 (-0.97; 5.39) 0.005
Male gender -1.96 (-4.08; 0.16) 0.07
Age 0.02 (-0.04; 0.09) 0.48
BSA 6.2 (2.03; 10.36) 0.004
BMI 0.017 (-0.18; 0.21) 0.86

9
Discussion
Our study showed that when compared to normal values in healthy adult persons [11], more
than half (54%) of our adult patients with proven MFS had dilatation of the pulmonary artery
trunk, some (approx. 15%) even in the absence of dilatation of the aortic root or ascending
aorta.
The Ghent 1 criteria of 1996 [1] included dilatation of the pulmonary artery as a sign (minor
vascular criterion) of MFS, but in the revised criteria (Ghent 2) published in 2010 [8], this
criterion was omitted. Reasons given were that pulmonary artery dilatation is not specific to
the diagnosis of MFS, that complications of pulmonary artery disease are rarely seen, and that
further research is needed regarding thresholds and the diagnostic utility of this finding [8] .
The uncertainty regarding threshold values for pulmonary artery dilatation is partly caused by
the vagueness of the Ghent 1 criteria with respect to the pulmonary artery. The authors state
that “until normal values for pulmonary artery diameter are available, dilatation can be
detected provisionally by echocardiography, CT or MRI using nomograms for the aorta” [1].
Furthermore, the Ghent 1 criteria do not specify which part of the pulmonary artery should be
measured, the root or the trunk.
In our study of 87 MFS patients, we measured the pulmonary artery root and trunk diameters
on axial 7 mm or 5 mm slices based on MR (7 mm) or CT (5 mm). In the literature, most
papers addressing upper normal values for the pulmonary artery have considered the
pulmonary artery trunk only, and among those performed with axial imaging [4, 11-14], only
three have included an adequate number of subjects (Table 4). The upper normal limit for the
pulmonary artery trunk diameter, defined as mean diameter + 2 SD, was quite similar in two
of the studies [12, 13], 32.4 and 33.2 mm, respectively, and clearly larger than in the third
study [11], 29.6 mm. This may be explained by the difference in slice thickness, 10 mm vs. 5
mm. axial slices will cut the main pulmonary artery obliquely, and thicker slices are apt to
overestimate the diameter due to partial volume effects. The 126 subjects studied by Bozlar et
al. [11] were imaged with nearly the same slice thickness as our MFS patients, and the age
distribution was furthermore similar, 30.6 ± 7.9 years and 35.1 ± 11 years, respectively.
Pulmonary hypertension and thoracic pathology had been excluded. We therefore consider
this group of healthy adults as an adequate control group for our study.

10
Table 4. Literature review of normal pulmonary artery (PA) trunk diameters based on axial CT or MR imaging.
Reference Subjects (n)
Age, mean (SD) years
Modality /slice thickness
PA trunk diam.mean ± SD mm
PA trunk upper limit, mean + 2SD
Karazincir et al. 2008 (13)
112 46.3 ± 13.6 CT / 10 mm 26.6 ± 2.9 32.4
Bozlar et al. 2007 (11)
126 30.6 ± 7.9 CT / 5 mm 24.0 ± 2.8 29.6
Nollen et al. 2002 (4)
15 28.0 ± 4.0 MR / unknown 24.0 ± 2.0 28.0
Choe at al. 2000 (14)
10 Unknown, range 25-72
CT / 10 mm 25.6 ± 2.2 30.0
Edwards et al. 1998 (12)
100 Unknown, range 11-90
CT / 10 mm 27.2 ± 3.0 33.2
Normal values for the pulmonary artery root diameter are nearly non-existing in the literature.
Nollen et al. measured diameters of the pulmonary artery root and trunk in 50 MFS patients
and 15 controls using MR imaging. Their pulmonary artery root diameters were not
perpendicular to the long axis of the vessel, however, instead three separate oblique diameters
in the axial plane were measured, and the anterior right diameter was used for analysis [4].
They suggested an upper normal value for the pulmonary artery root of 34.8 mm based on this
diameter. Using this cut-off value, 50% (43 of 86) of our MFS patients had dilated pulmonary
artery root (Table 1). The pulmonary artery root diameter in MFS patients and controls has
also been assessed with echocardiography, and based on ROC analysis, a cut-off value for
discriminating between normals and MFS of 23 mm was suggested for subjects older than 14
years [3]. This is clearly a much smaller value than the upper limit suggested by Nollen et al.
[4] (34.8 mm) and the mean value in our MFS patients (35.0 mm), probably reflecting the
inherent differences between the modalities used. Measurements comparable to those
obtained with axial CT or MR imaging may be difficult to obtain with echocardiography
where the imaging plane is dependent on the acoustic window. This difficulty is underscored
by our own study. Our preliminary measurements of aortic root diameters were performed
with echocardiography and resulted in 16 out of 57 MFS patients having dilated aortic root.
When remeasured with MR or CT, the number increased to 40 of 57.
The large discrepancy between the findings of pulmonary artery dilatation using nomograms
for the aorta as recommended by Ghent 1 [1] and when using cut-off values based on 2 SD
above the mean value in healthy volunteers, suggests that nomograms for the aorta are not
suited for assessment of pulmonary artery dilatation. In the normal population, the pulmonary

11
artery trunk is on average smaller than the ascending aorta, but the variation is large. In a
recent multidetector CT study of 103 normal, healthy adults, the ratio of short axis pulmonary
trunk diameter to short axis ascending aorta was mean (SD) 0.89 (0.24) [15].
The aortic and pulmonary artery roots have a common embryologic origin [16], and since
aortic root dilatation is typical of MFS, it has been speculated that the pulmonary artery root is
the most likely part of the vessel to dilate [3, 4]. There is sparse evidence only of this in the
literature. In an MR study of 50 adult MFS patients and 15 adult controls [4], the pulmonary
artery root was found to be wider than the pulmonary artery trunk in both patients and
controls; the difference between root and trunk was, however, larger in MFS patients than in
controls [4]. The pulmonary artery root being wider than the trunk is confirmed by our own
study, mean (SD) diameters being 35.0 (4.6) and 29.8 (3.8), respectively.
The above findings and speculations could indicate that pulmonary artery root dilatation is
more strongly correlated to disease of the ascending aorta in MFS patients than is pulmonary
artery trunk dilatation. This was not confirmed by our study. Both the pulmonary artery root
and trunk were significantly larger in the patients with previous surgery on the ascending
aorta than in those without previous surgery, probably reflecting a correlation between
pulmonary artery dilatation and the most severe cases of aortic disease in MFS. However,
when comparing pulmonary artery diameters in patients fulfilling the major cardiovascular
criterion (surgery or dilatation of the aortic root or ascending aorta) and those not fulfilling the
criterion, only the pulmonary artery trunk was significantly larger in patients fulfilling the
criterion. A correlation between aortic disease and pulmonary artery trunk diameter was also
suggested by our multivariate analysis showing that previous surgery on the ascending aorta
was a significant predictor of pulmonary artery trunk dilatation, but not of pulmonary artery
root dilatation.
Although a large majority of the patients with dilated pulmonary artery trunk also had aortic
disease (40 out of 47 or 85.1%), a few of these patients (7 out of 47, 14.9%) had no sign of
ascending aortic disease, suggesting that pulmonary artery dilatation may be an early marker
of vascular disease in MFS patients.
The clinical implications of our findings are few, but important. Pulmonary artery trunk
dilatation is common in MFS patients, and does not by itself imply pulmonary hypertension.
Dilatation of this vessel in a MFS patient may suggest MFS-related vascular affection even in
the absence of visible ascending aortic disease.

12
Limitations
A major limitation of our study is lack of controls using the exact same imaging technique as
for our patients. Some relevant and high quality studies of healthy adults using similar
technique as ours have been published, however, and we believe that normal values for
pulmonary artery trunk diameter using axial imaging are now well documented [11]. Reliable
normal values for pulmonary artery root diameter are still missing, however, and may be
difficult to obtain given the asymmetry of this part of the vessel.
Our study was performed in the period 2002 – 2004, and MR techniques for non-enhanced
imaging of thoracic vessels have improved since then. Multi-slice ECG-triggered MR
imaging also introduces a small variation in vessel diameter due to imaging of the vessel at
different time points during the cardiac cycle.
Conclusions
Pulmonary artery dilatation is a common finding in MFS (54%), and should be assessed using
cut-off values based on pulmonary artery diameter measurements in the normal population,
not on nomograms intended for the aorta. MR or CT imaging seems to provide more reliable
results for pulmonary artery dimensions than echocardiography. Severe disease of the
ascending aorta is a significant predictor of pulmonary artery trunk dilatation in MFS patients,
but such dilatation may occur even in the absence of visible aortic disease.
References
1. DePaepe A, Devereux RB, Dietz HC, Hennekam RC, Pyeritz RE (1996) Revised diagnostic criteria
for the Marfan syndrome. Am J Med Genet 62:417-426
2. Pyeritz RE (2000) The Marfan syndrome. Annu Rev Med 51:481-510
3. DeBacker J, Loeys B, Devos D, Dietz H, DeSutter J, DePaepe A (2006) A critical analysis of minor
cardiovascular criteria in the diagnostic evaluation of patients with Marfan syndrome. Genet Med
8:401-408
4. Nollen GJ, van Schijndel KE, Timmermans J, Groenink M, Barentsz JO, van der Wall EE, Stoker J,
Mulder BJ (2002) Pulmonary artery root dilatation in Marfan syndrome: quantitative assessment of an
unknown criterion. Heart 87:470-471
5. Nollen GJ, Mulder BJ (2004) What is new in the Marfan syndrome? Int J Cardiol 97 Suppl 1:103-108

13
6. Ha HI, Seo JB, Lee SH, Kang JW, Goo HW, Lim TH, Shin MJ (2007) Imaging of Marfan syndrome:
multisystemic manifestations. Radiographics 27:989-1004
7. McKusick VA (1955) The cardiovascular aspects of Marfan's syndrome: a heritable disorder of
connective tissue. Circulation 11:321-342
8. Loeys BL, Dietz HC, Braverman AC, Callewaert BL, DeBacker J, Devereux RB, Hilhorst-Hofstee Y,
Jondeau G, Faivre L, Milewicz DM, Pyeritz RE, Sponseller PD, Wordsworth P, De Paepe AM (2010)
The revised Ghent nosology for the Marfan syndrome. J Med Genet 47:476-485
9. Rand-Hendriksen S, Lundby R, Tjeldhorn L, Andersen K, Offstad J, Semb SO, Smith HJ, Paus B,
Geiran O (2009) Prevalence data on all Ghent features in a cross-sectional study of 87 adults with
proven Marfan syndrome. Eur J Hum Genet 17:1222-1230
10. Roman MJ, Devereux RB, Kramer-Fox R, O'Loughlin J (1989) Two-dimensional echocardiographic
aortic root dimensions in normal children and adults. Am J Cardiol 64:507-512
11. Bozlar U, Ors F, Deniz O, Uzun M, Gumus S, Ugurel MS, Yazar F, Tayfun C (2007) Pulmonary
Artery Diameters Measured by Multidetector-Row Computed Tomography in Healthy Adults. Acta
Radiol1-6
12. Edwards PD, Bull RK, Coulden R (1998) CT measurement of main pulmonary artery diameter. Br J
Radiol 71:1018-1020
13. Karazincir S, Balci A, Seyfeli E, Akoglu S, Babayigit C, Akgul F, Yalcin F, Egilmez E (2008) CT
assessment of main pulmonary artery diameter. Diagn Interv Radiol 14:72-74
14. Choe KO, Hong YK, Kim HJ, Joo SH, Cho BK, Chang BC, Cho SY, Shim WH, Chung NS (2000)
The use of high-resolution computed tomography in the evaluation of pulmonary hemodynamics in
patients with congenital heart disease: in pulmonary vessels larger than 1 mm in diameter. Pediatr
Cardiol 21:202-210
15. Lin FY, Devereux RB, Roman MJ, Meng J, Jow VM, Simprini L, Jacobs A, Weinsaft JW, Shaw LJ,
Berman DS, Callister TQ, Min JK (2009) The right sided great vessels by cardiac multidetector
computed tomography: normative reference values among healthy adults free of cardiopulmonary
disease, hypertension, and obesity. Acad Radiol 16:981-987
16. Brown CB, Baldwin HS (2006) Neural crest contribution to the cardiovascular system. Adv Exp Med
Biol 589:134-154
