radio link aspects - telecom infra project
TRANSCRIPT

Copyright © 2018 Telecom Infra Project, Inc. All rights reserved.
Radio Link Aspects

Copyright © 2018 Telecom Infra Project, Inc. All rights reserved.
Table of Contents
1. Executive Summary..............................................................................................................4
Introduction and Objectives........................................................................................................4
2. Radio Level KPIs and Metrics...........................................................................................5
2.1 KPIs................................................................................................................................................52.1.1 Throughput.............................................................................................................................................................62.1.2 Latency (Packet Delay).....................................................................................................................................62.1.3 Jitter (Packet Delay Variation)......................................................................................................................62.1.4 Packet Error Rate................................................................................................................................................6
2.2 Additional Metrics....................................................................................................................72.2.1. Frequency Band..................................................................................................................................................72.2.2 Received Signal Power.....................................................................................................................................72.2.3 Transmit Power.....................................................................................................................................................72.2.4 Signal-to-Noise Ratio (SNR)...........................................................................................................................82.2.5 Signal-to-Interference and Noise Ratio (SINR)....................................................................................82.2.6 Modulation and Coding Scheme (MCS).................................................................................................82.2.7 Transmit and Receive Beams........................................................................................................................82.2.8 Antenna Directivity.............................................................................................................................................92.2.9 Transmit Spectrum Mask................................................................................................................................92.2.10 Radiation Pattern Envelope........................................................................................................................92.2.11 Steering Range................................................................................................................................................102.2.12 Reaction time in case of link degradation.........................................................................................10
3. Test Cases...............................................................................................................................10
3.1 Point-to-Point Performance................................................................................................10
3.2 Point-to-Multipoint/Mesh Performance.........................................................................11
3.3 Interference Tests...................................................................................................................11
3.4 Link Establishment Time......................................................................................................11
3.5 Maximum Transmit Power..................................................................................................11
3.6 Radio Frequency (RF) Transmit Power Level Ramp-up and Ramp-down..........12
3.7 Transmitter Spectrum Mask...............................................................................................13
3.8 Transmitter Frequency Accuracy......................................................................................14
3.9 Receiver Input Signal Sensitivity.......................................................................................14
3.10 Quality of Service (QoS)....................................................................................................17
3.11 Synchronization....................................................................................................................21
3.12 Error Vector Magnitude (EVM).......................................................................................22
4. Test Setup...............................................................................................................................24

Copyright © 2018 Telecom Infra Project, Inc. All rights reserved.
4.1 Performance of Single Radio Link in Line-of-Sight (LOS) Conditions.................24
4.2 Performance Under Challenging Radio Conditions...................................................26
4.3 Influence of Weather Conditions......................................................................................27
4.4 Interference Scenarios..........................................................................................................28
4.5 Interference along a Street................................................................................................29
5. Summary..................................................................................................................................30
Appendix A: References........................................................................................................30

Copyright © 2018 Telecom Infra Project, Inc. All rights reserved.
1. Executive Summary This document defines a methodology of how the performance of an mmWave radio link that is part of a mesh network can be validated. A detailed set of test cases have been documented to evaluate the network performance in different areas, such as throughput, the risk of interference and compliance with regulation. In addition, and as a prerequisite for executing a test, the required Key Performance Indicators (KPIs) and test are described. In general, the intention of this work within the Technical Validation subgroup is to execute tests, and different environments and setups, to gain confidence in the achievable performance. This document serves as a baseline for multiple tests executed by different partners within the Project Group.
Introduction and Objectives
Figure 1: Work streams in the Technical Validation subgroup Figure 1 shows the different work streams within the Technical Validation subgroup. This document is related to the first work stream which deals with 60 GHz radio links. Aspects related to a radio link can, for example, be the achievable data rate versus the distance of the link or the link establishment time. A set of radio links can then be used to create a mesh network, which is

Copyright © 2018 Telecom Infra Project, Inc. All rights reserved.
the topic of the second work stream that deals with routing. A third work stream deals with the end-to-end perspective and considers performance at the end user. Within this context, the present document deals with the technical validation of the radio links, i.e. the first area. As for any kind of wireless networks, radio links are the foundation of an mmWave mesh network, which makes their reliable operation at a high performance essential. The present document should therefore be seen as one as one part within the broader scope of mmWave mesh networks. This document describes the test cases used by the TIP mmWave Networks Project Group for the validation of the 60 GHz technologies that are, or will be, based on IEEE 802.11ad and/or IEEE 802.11ay standards. Within this context, the objective of the validation process aims to ensure that technology specifications satisfy the true requirements of the applications and the use cases that they aim to serve [1]. The remainder of this document is structured as follows:
• Chapter 2 describes the Key Performance Indicators (KPIs) and metrics used to quantify the performance of a radio link.
• Chapter 3 contains the individual test cases. • Chapter 4 contains the test setups.
2. Radio Level KPIs and Metrics This chapter describes the metrics that are relevant for characterizing the performance of a 60 GHz mesh access network. It is structured into two parts: Section 3.1 describes the KPIs, which provide information related to the performance at the end user. Section 3.2 describes additional metrics which indicate whether the system under test conforms to its technical specifications.
2.1 KPIs At the highest level, the performance of a link or network can be characterized by measuring the maximum throughput that it is capable of and, in addition, its latency or packet delay. In more detail, the performance on higher protocol

Copyright © 2018 Telecom Infra Project, Inc. All rights reserved.
layers such as TCP can be influenced by jitter (or packet delay variation) and unsuccessful packet transmission.
2.1.1 Throughput Throughput determines the maximum rate at which no offered packets/frames are dropped due to system congestion under test. This KPI can be measured on protocol layers 1 (PHY), 2 (MAC), 3 (IP) and/or 4 (TCP and/or UDP) by offering a certain load to the link/network (e.g.sby sending data from a testing equipment source to a corresponding destination) and measuring the corresponding data rates.
2.1.2 Latency (Packet Delay) Latency tests measure the time interval that begins when the last bit of the input frame reaches the input port and ends when the first bit of the output frame is seen on the output port. Latency can be characterized in terms of the one-way delay (OWD) and the round-trip time (RTT) and also in terms of minimum, average and maximum values. It is important to measure the latency under different load levels, as queuing effects can have significant impact on the latency. It could be measured on protocol layer 3 via the Internet Control Message Protocol (ICMP), but other valid methods are also in scope.
2.1.3 Jitter (Packet Delay Variation) Jitter describes variations in the interarrival-time of packets, which can have a negative impact on the performance of higher layer protocols (e.g.TCP). It is measured in terms of the standard deviation of the delay. As with latency, jitter should also be measured under different load levels.
2.1.4 Packet Error Rate The packet error rate on IP level describes the ratio of unsuccessful packet transmissions versus the total number of transmitted packets. In wireless networks there are two main sources of unsuccessful packet transmissions: First, changes in the radio channel (e.g. short-term fading) and/or interference can
Copyright © 2018 Telecom Infra Project, Inc. All rights reserved.
make the reception of the packet impossible. If retransmissions on protocol layer 2 also fail, a packet loss on IP level occurs. Second, buffer overflow can occur. If the network / link are unable to support the offered load, data is buffered and finally discarded. With respect to validation of 60 GHz mesh networks, the first effect of packet loss due to fading and interference is the most relevant. The packet error rate should therefore be measured under an offered load which the network is capable of transferring. If possible, we recommend measuring the Packet Error Rate due to transport errors (e.g. errors in adaptive modulation, interference or fading) independent from errors due to buffer overflow.
2.2 Additional Metrics The following metrics indicate whether technology under test conforms to its technical specifications. Furthermore, these metrics provide important insight on why a certain performance is, or is not, achieved.
2.2.1. Frequency Band The supported range of frequencies, as well as bandwidth, are fundamental characteristics of any wireless technology, since they impact performance I(e.g. path loss), but they also define whether technology can be used in a region against established regulations.
2.2.2 Received Signal Power Received signal power can be used to:
• Calculate the path loss of a link and thereby estimate its performance • Understand the extent to which obstacles and weather conditions
deteriorate a link • Measure the sensitivity of the receiver
2.2.3 Transmit Power The instantaneous transmit power is important to analyze test results in detail.
Copyright © 2018 Telecom Infra Project, Inc. All rights reserved.
In addition, it can be used to validate the correct behavior of the transmit power control functionality.
2.2.4 Signal-to-Noise Ratio (SNR) The signal-to-noise ratio (SNR) is defined as the ratio of signal power to noise power and can be used to:
• Understand the effects of obstacles and weather conditions (as the received power)
• Calculate (in combination with the received power) the noise figure of the receiver which gives insights about its quality
• Test the behavior of the adaptive modulation and coding in both directions (also downshift and upshift).
2.2.5 Signal-to-Interference and Noise Ratio (SINR) The signal-to-interference and noise ratio (SINR) is the most important metric to analyze the effects of interference. SINR is used as a way to measure the quality of wireless systems, and similarly to SNR it can be used to evaluate and validate the performance of a system under test.
2.2.6 Modulation and Coding Scheme (MCS) The achieved modulation and coding scheme (MCS) can provide insight on why a certain throughput of a link was achieved. Furthermore, by comparing the selected MCS and the SINR/SNR, the behavior of the adaptive modulation and coding can be observed and tested in both directions (also examining downshift and upshift).
2.2.7 Transmit and Receive Beams Information about which beam was formed at the transmitter and which was used for reception provides insight on the propagation conditions, such as which reflectors were exploited by the system. Additionally, in a dedicated test

Copyright © 2018 Telecom Infra Project, Inc. All rights reserved.
setup the correct operation of the beam management procedures can be validated using this information.
2.2.8 Antenna Directivity Directivity is a parameter of an antenna which measures the degree to which the radiation emitted is concentrated in a single direction. Higher directivity is associated with both higher Equivalent Isotropically Radiated Power (EIRP) and therefore longer signal propagation, and narrower beam width, which reduces interference potential. Minimum antenna directivity (or its derivative, antenna gain) is often stipulated in regulations.
2.2.9 Transmit Spectrum Mask The transmit spectrum mask describes the frequency bounds of a model transmission, usually relative to a defined channel. Constraining transmission power within a transmit spectrum mask reduces adjacent-channel interference by limiting excessive radiation at frequencies beyond the necessary bandwidth. Measurement of the actual transmitter performance against the mask is a good indicator of adjacent-channel interference potential. The transmit spectrum mask is often stipulated in regulations.
2.2.10 Radiation Pattern Envelope The radiation pattern envelope, often stipulated in regulations, describes the bounds of a model transmission in terms of angular distance from the desired direction. It is usually defined for the horizontal (azimuth) plane but the vertical (elevation) plane may also be relevant depending on the use case. Constraining transmission power within a radiation pattern envelope reduces co-channel interference by limiting unintentional radiation outside of the main beam direction and, in the receiver, limiting sensitivity to incoming radiation outside of the main beam direction (side lobes). Measurement of the radiation pattern is a good indicator of the potential for co-channel interference.

Copyright © 2018 Telecom Infra Project, Inc. All rights reserved.
2.2.11 Steering Range The steering range is the angular distance between 3 dB points for a beam-formed transmission. It is typically measured in the horizontal (azimuth) and vertical (elevation) directions. The steering range indicates suitability for the target application, for example, access and backhaul applications may require different steering ranges.
2.2.12 Reaction time in case of link degradation In case a wireless link is subject to a change in fading (e.g. due to rain) or in interference, a quick adaption of the MCS is crucial to maintain the operation of the link and to prevent unnecessary re-routing. This metric therefore measures the reaction time in case of a link degradation.
3. Test Cases This section describes each test case objective, provides reference to the respective test setup, and describes the KPIs and metrics to be measured.
3.1 Point-to-Point Performance This basic test is used to characterize the performance of a 60 GHz radio link in terms of the KPIs and metrics described above. The testing possibilities include:
• Point-to-point link under clear line-of-sight (LOS) • Point-to-point link under non-line-of-sight (nLOS) • Point-to-point link during adverse weather conditions (assuming longer
term measurements)
Executing this test under different levels of maximum transmit power can provide insight on how much transmit power is required at different distances and which performance can be realized with limited transmit power (e.g. due to regulation).

Copyright © 2018 Telecom Infra Project, Inc. All rights reserved.
3.2 Point-to-Multipoint/Mesh Performance The objective of this test is to:
• Validate the capability of the system to serve multiple terminals • Validate the capability of the system to establish mesh topology • Evaluate the system PtMP and/or mesh performance of the system by
considering aforementioned KPIs
3.3 Interference Tests Interference is an important factor that limits the performance of wireless networks. In 60 GHz deployments, the effects of interference are expected be less severe than at lower-carrier frequency due to the high path loss and the strong directivity of receiver and transmitter. The objective of this test is to provide insights as to under which conditions interference can occur in 60 GHz networks and identify the consequences. This covers interference from within the system (e.g. two links of the same network) as well as interference from other systems working at the same or adjacent channels (considering that the 60 GHz spectrum is generally regulated under license-exempt regime and relatively wide channels of 2.16 GHz have to be supported).
3.4 Link Establishment Time The objective of this test is to measure the time needed to establish a radio link:
• During installation • During operation, e.g. in case of link failure
This test is applicable between nodes of equal capability(namely, distribution nodes) and among nodes of different capability (namely, distribution and customer nodes).
3.5 Maximum Transmit Power This test measures the maximum transmit power for each physical modulation state and confirms the transmit power and measured value.

Copyright © 2018 Telecom Infra Project, Inc. All rights reserved.
3.6 Radio Frequency (RF) Transmit Power Level Ramp-up and Ramp-down General Test Description: The objective of this test is to determine the time it takes for the transmitter RF power level to ramp up and ramp down. The transmitter RF power level is measured over some predefined measurement time interval and over some predefined frequency bandwidth. Example Specification Description: The transmitter power ramp-up time is defined as the time it takes for the transmitter average power to rise from less than a predefined percentage to more than a predefined percentage. It shall not exceed a predefined time limit. The transmitter power ramp-down time is defined as the time it takes for the transmitter average power to fall from greater than a predefined percentage to less than a pre-defined percentage. It shall not exceed a predefined time limit. Source: IEEE Std 802.11- 2016, Part 11: Wireless LAN Medium Access Control (MAC) and Physical Layer (PHY) Specifications, section 20.3.3.5 An Example Transmit Power Level Ramp Up and Ramp Down Test Case Overview, No Angular Dependency (Preliminary work-in-progress, subject to change):
Figure 3.6-1 Example Transmit Power Ramp Up and Ramp Down Test Setup, No Angular Dependency
Copyright © 2018 Telecom Infra Project, Inc. All rights reserved.
1. Configure the test equipment, mmWave transceiver, and Device-Under-Test (DUT) as shown
2. Put DUT in transmit mode 3. Set DUT transmit frequency 4. Configure DUT for desired MCS index 5. Steer transmit beam to boresight (on-axis direction) 6. Configure the test equipment to perform an RF power ramp-up and
ramp-down measurement (Preliminary) 7. Record the ramp-up and ramp-down time 8. Repeat steps 3-7 for additional RF channel frequencies
3.7 Transmitter Spectrum Mask This test validates whether the system under test is within regulatory requirements. The spectrum mask limits are necessary for a number of intra- and inter-system regulatory and performance requirements. General Test Description: The transmitter spectrum mask measurement may include both in-band and out-of-band spurious emissions, combining both in-band and out-of-band specifications. It is the power contained in a specified frequency bandwidth at certain frequency offsets relative to the total carrier power. It provides useful figures-of-merit for spectral regrowth and emissions produced by component and system hardware. Example Specification Description: The transmitted spectrum shall adhere to a transmit spectrum mask which specifies multiple points at various frequency offsets above and below the center transmit frequency, in which the transmit spectrum shall be a predefined dBr lower than the maximum spectral density of the signal, measured with a specified resolution bandwidth. Source: IEEE Std 802.11- 2016, Part 11: Wireless LAN Medium Access Control (MAC) and Physical Layer (PHY) Specifications, section 20.3.2 An Example SEM Test Case Overview, No Angular Dependency (Preliminary work-in-progress, subject to change):

Copyright © 2018 Telecom Infra Project, Inc. All rights reserved.
Figure 3.7-1 Example Transmitter Spectrum Mask Test Setup, No Angular Dependency
1. Configure the test equipment, mmWave transceiver, and Device-Under-Test (DUT) as shown below
2. Put DUT in transmit mode 3. Configure DUT for desired MCS index 4. Set DUT transmit frequency 5. Configure the test equipment to perform a Spectrum Emission Mask
(SEM) measurement 6. Repeat steps 3-5 for additional frequencies
3.8 Transmitter Frequency Accuracy The objective of this test is to verify that the carrier frequency is within specified tolerance levels relative to its nominal value. Please see section 4.12, Error Vector Magnitude (EVM).
3.9 Receiver Input Signal Sensitivity This test measures the maximum receiving threshold level at specified Packet Error Rate (PER) value. General Test Description: Receiver sensitivity is a measurement to verify the receiver’s ability to meet a throughput metric at a specified input power level (dBm). The throughput can be specified as a PER as a percentage of bits or packets transmitted through the system. This is defined as PER over Layer 1.

Copyright © 2018 Telecom Infra Project, Inc. All rights reserved.
Example Specification Description: The receiver sensitivity shall meet MCS dependent values as outlined in table 20-3. The PER requirement is specified in percentages for a given packet length for various MCS indexes and constellation modulation order. For RF power measurements performed over the air, the input level should be corrected to compensate for the antenna gain. Source: IEEE Std 802.11- 2016, Part 11: Wireless LAN Medium Access Control (MAC) and Physical Layer (PHY) Specifications, section 20.3.3.8 Receive Sensitivity An Example Receiver Sensitivity Test Case Overview, no Angular Dependency (Preliminary work-in-progress, subject to change):
Figure 3.9-1 Example Receiver PER Test Setup, No Angular Dependency
1. Configure the test equipment, mmWave transceiver, and Device-Under-Test (DUT) as shown below
2. Put DUT in receive mode 3. Set DUT frequency 4. Configure DUT for desired MCS index 5. Configure the test equipment to perform a PER measurement (Note- this
may have a DUT dependency) 6. Steer receive beam to boresight (on-axis direction)
a. Set transmit RF power level and query DUT for packets received b. Compute PER c. Decrease transmit RF power level incrementally, and re-measure
PER

Copyright © 2018 Telecom Infra Project, Inc. All rights reserved.
d. Repeat steps A-C as required to determine where the receiver no longer meets receiver PER requirement
7. Repeat steps 3-6 for additional MCS indexes and frequencies An Example Receiver Sensitivity Test Case Overview, with One-Dimensional Angular Dependency (Optional, Preliminary work-in-progress, subject to change): For this test, we are looking for a loss in sensitivity due to beam steering loss.
Figure 3.9-2 Example Receiver PER Test Setup, with Angular Dependency
1. Configure the test equipment, mmWave transceivers, and Device-Under-Test (DUT) as shown below
2. Put DUT in receive mode 3. Set DUT frequency 4. Configure DUT for desired MCS index 5. Configure the test equipment to perform a PER measurement (Note- this
may have a DUT dependency 6. Steer receive beam to boresight (on-axis direction)
a. Set transmit RF power level and query DUT for packets received b. Compute PER c. Decrease transmit RF power level incrementally, and re-measure
PER d. Repeat steps A-C as required to determine where receiver no
longer meets receiver PER requirement 7. Steer receive beam to negative angle theta, relative to boresight
a. Set transmit RF power level and query DUT for packets received b. Compute PER

Copyright © 2018 Telecom Infra Project, Inc. All rights reserved.
c. Decrease transmit RF power level incrementally, and re-measure PER
d. Repeat steps A-C as required to determine where receiver no longer meets receiver PER requirement
8. Steer receive beam to positive angle theta, relative to boresight a. Set transmit RF power level and query DUT for packets received b. Compute PER c. Decrease transmit RF power level incrementally, and re-measure
PER d. Repeat steps A-C as required to determine where receiver no
longer meets receiver PER requirement 9. Repeat steps 3-8 for additional MCS indexes and frequencies
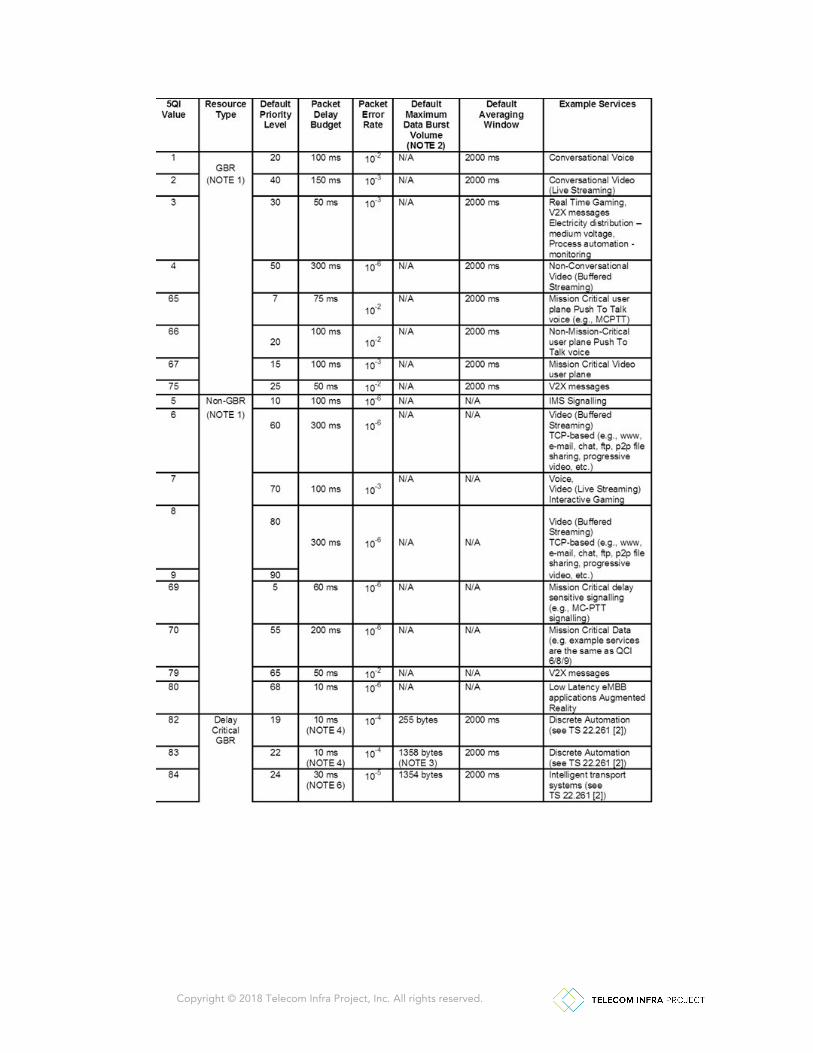
3.10 Quality of Service (QoS) The objective of this test is to validate the capability of the system under test to prioritize traffic, in terms of packet scheduling over-the-air among different nodes and/or traffic flows. To this end, it should be noted that the targeted applications for the discussed mmWave technology are primarily fixed wireless access and Small-Cell Backhaul / X-Haul. On top, wholesale services (namely, network infrastructure and resource sharing) is another potential application, so QoS is an important topic. Typically, the most demanding requirements arise from the mobile network, hence this will be used as a reference for subsequent discussions. In the case of 4G small-cell radio node and based on the 3GPP TS 23.203 V11.7.0 (2012-09), the following standardized QCI characteristics are applicable:

Copyright © 2018 Telecom Infra Project, Inc. All rights reserved.
All radio network elements are deriving the TNL (Transport Network Layer) QoS from the RNL (Radio Network Layer) QoS. Multiple factors influence the TNL QoS marking of a packet in the mobile domain, such as radio access technology, customer priority, and application type. Only the radio network has knowledge of all these factors and can do an appropriate marking of the packets, hence the classification and marking of different types of traffic must be done at the source of this traffic, namely eNodeBs, gateways, etc. It should be noted that different segments of the Backhaul network might support a different number of queues, but the typical QoS model for wireless Backhaul is

Copyright © 2018 Telecom Infra Project, Inc. All rights reserved.
based on eight (8) priority queues, where SP (Strict Priority) and WFQ (Weight Fair Queuing) are available. In the case of 5G small-cell radio node and based on the 3GPP TS 23.501 V15.3.0 (2018-09), the following standardized QCI characteristics are in discussion:
Copyright © 2018 Telecom Infra Project, Inc. All rights reserved.

Copyright © 2018 Telecom Infra Project, Inc. All rights reserved.
It is noted that in the case of the 5G small-cell, the appearance of new massive services results in the need of no fewer priority queues compared to 4G deployments. However, an equivalent to the 4G case, wireless backhaul 8-priority based QoS model could be applied along with network slicing mechanisms to meet the demands of the ultra-low latency services. The validation of any network slicing implementation needs to be tested in an end-to-end approach. Finally, it should be noted that the discussed wireless PtMP access/backhaul technology should be able to prioritize traffic as per service providers' SLA targets, not only at the packet-level scheduling I(e.g.at the equipment at node level) but also distribution nodes (DNs) should efficiently handle air scheduling among served customer/client nodes (CNs).
3.11 Synchronization The objective of this test is to validate the capability of system under test to implement frequency and phase/time synchronization to:
1. Avoid intra-system interference due to co-located/adjacent Time Division Duplex (TDD) transmitters: As TDD wireless technologies use a single frequency channel for transmission and reception, it is important to ensure that there is no interference between co-located and/or adjacent TDD radio transceivers that may operate at the same frequency channel due to non-synchronized Tx/Rx (Transmit/Receive) arrangement. TDD-based nodes, such as DNs, that are part of the same cluster must be synchronized, which means that their duty cycle must be aligned to transmit and receive at the same time. Global Navigation Satellite System (GNSS)-based (GPS, GLONASS, Galileo) phase/time sync and

Copyright © 2018 Telecom Infra Project, Inc. All rights reserved.
backhaul-based phase/time sync (e.g. if LOS visibility to satellite is problematic in urban canyon) are options (see below) for this purpose.
Address LTE-A (Pro)/5G small-cell backhaul requirements: As service providers develop their LTE-A (Pro) networks and prepare for 5G access network and services requirements, the topic of mobile network synchronization becomes important and phase/time synchronization has to be introduced due to TDD-based mobile base stations and/or deploying demanding radio access techniques, such as intra-site carrier aggregation, Coordinated Multi-Point (CoMP), etc. The key options with regard to this aspect are:
a. GNSS-based plus Sync-E (Sync-E allows enhanced time and phase
holdover in case of GNSS failure) b. Backhaul-based phase/time sync:
i. PTP-FTS according to G.827x ii. PTP telecom profile according to G.8275.1 iii. T-BC/T-TSC according to G.8273.2 iv. Sync-E according to recommendations ITU-T
G.8261/G.8262/G.8264 and G.8262.1 (Sync-E maintains accurate time at the eNodeB and faster restoration of traceable time)
3.12 Error Vector Magnitude (EVM) General Test Description: Error Vector Magnitude (EVM) is an in-band modulation accuracy measurement. EVM is computed by comparing the measured signal with an ideal reference signal to determine the error vector. EVM is the root mean square (RMS) of the error vectors, computed and expressed as a percentage of the square root of the mean power of the ideal signal. The error vector is the magnitude of the vector at the detected symbol location. This connects the I/Q reference-signal phasor to the I/Q measured-signal phasor. The computed results may be represented as a percentage or a logarithmic value (in dB). Example Specification Description: The transmitted EVM shall meet the MCS dependent values as outlined in table 20-22. The EVM requirement is specified in dB for various MCS indexes and
Copyright © 2018 Telecom Infra Project, Inc. All rights reserved.
constellation modulation order. The EVM measurements performed with test equipment shall be performed with equalization while making the measurements. The test equipment should also use root-raised cosine filter with a predefined filter roll-off factor when performing the EVM measurement. Note: All table references are to the IEEE Std 802.11- 2016. Source: IEEE Std 802.11- 2016, Part 11: Wireless LAN Medium Access Control (MAC) and Physical Layer (PHY) Specifications, section 20.6.4.1.1 Transmit EVM An Example EVM Test Case Overview, no Angular Dependency (Preliminary work-in-progress, subject to change):
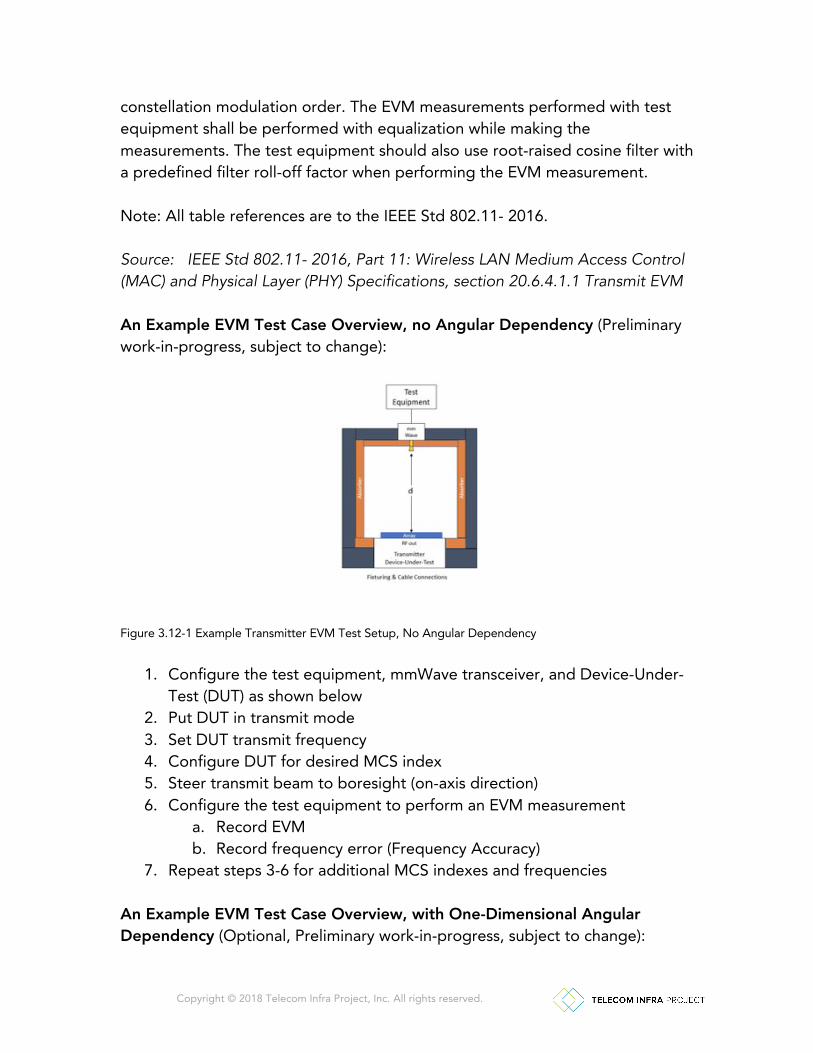
Figure 3.12-1 Example Transmitter EVM Test Setup, No Angular Dependency
1. Configure the test equipment, mmWave transceiver, and Device-Under-Test (DUT) as shown below
2. Put DUT in transmit mode 3. Set DUT transmit frequency 4. Configure DUT for desired MCS index 5. Steer transmit beam to boresight (on-axis direction) 6. Configure the test equipment to perform an EVM measurement
a. Record EVM b. Record frequency error (Frequency Accuracy)
7. Repeat steps 3-6 for additional MCS indexes and frequencies
An Example EVM Test Case Overview, with One-Dimensional Angular Dependency (Optional, Preliminary work-in-progress, subject to change):

Copyright © 2018 Telecom Infra Project, Inc. All rights reserved.
Figure 3.12-2 Example Transmitter EVM Test Setup, with Angular Dependency
1. Configure the test equipment, mmWave transceivers, and Device-Under-Test (DUT) as shown below
2. Put DUT in transmit mode 3. Set DUT transmit frequency 4. Configure DUT for desired MCS index 5. Configure the test equipment to perform an EVM measurement 6. Steer transmit beam to boresight (on-axis direction)
a. Record EVM b. Record frequency error (Frequency Accuracy)
7. Steer transmit beam to negative angle theta, relative to boresight a. Record EVM b. Record frequency error (Frequency Accuracy)
8. Steer transmit beam to positive angle theta, relative to boresight a. Record EVM b. Record frequency error (Frequency Accuracy)
9. Repeat steps 3-8 for additional MCS indexes and frequencies
4. Test Setup In the following, test setups for investigating different aspects of the mmWave radio link performance are described.
4.1 Performance of Single Radio Link in Line-of-Sight (LOS) Conditions This test investigates the main KPIs for single link.
Copyright © 2018 Telecom Infra Project, Inc. All rights reserved.
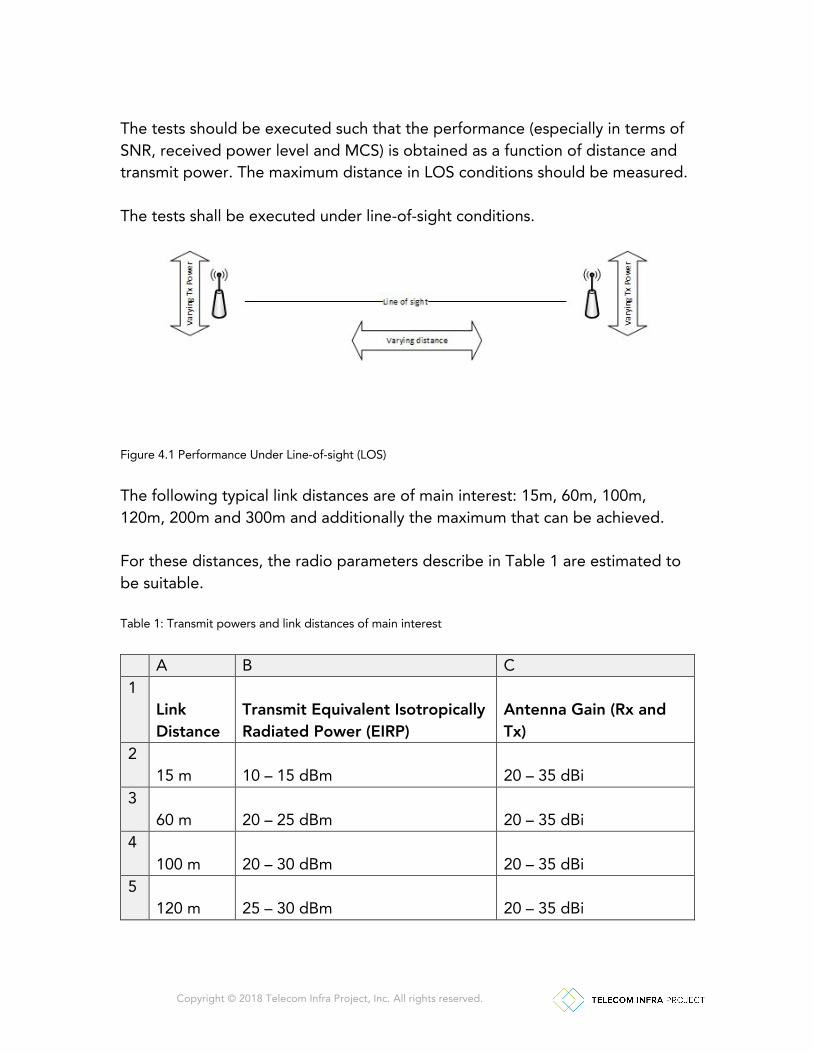
The tests should be executed such that the performance (especially in terms of SNR, received power level and MCS) is obtained as a function of distance and transmit power. The maximum distance in LOS conditions should be measured. The tests shall be executed under line-of-sight conditions.
Figure 4.1 Performance Under Line-of-sight (LOS) The following typical link distances are of main interest: 15m, 60m, 100m, 120m, 200m and 300m and additionally the maximum that can be achieved. For these distances, the radio parameters describe in Table 1 are estimated to be suitable. Table 1: Transmit powers and link distances of main interest A B C 1
Link Distance
Transmit Equivalent Isotropically Radiated Power (EIRP)
Antenna Gain (Rx and Tx)
2 15 m
10 – 15 dBm
20 – 35 dBi
3 60 m
20 – 25 dBm
20 – 35 dBi
4 100 m
20 – 30 dBm
20 – 35 dBi
5 120 m
25 – 30 dBm
20 – 35 dBi

Copyright © 2018 Telecom Infra Project, Inc. All rights reserved.
6 300 m
30 – 35 dBm
20 – 35 dBi
4.2 Performance Under Challenging Radio Conditions The tests described in Section 4.1. should be repeated under more challenging radio conditions, as shown in Figures 4.2, 4.3 and 4.4. It is expected that especially non-Line of Sight (nLOS) conditions will be especially challenging. It is therefore an output of this test setup under which conditions non-line-of-sight could operate. Again, the output should be the performance, especially in terms of SNR, received power level and MCS, obtained as a function of distance and transmit power. For Line of Sight (LOS) test with reflections, the radio parameters from Table 1 shall be used. For nLOS testing increased transmit EIRP is required. The maximum nLOS distance will be tracked.
Figure 4.2: Performance under LOS with reflection conditions with varying distance and transmit power

Copyright © 2018 Telecom Infra Project, Inc. All rights reserved.
Figure 4.3: Performance under nLOS conditions, penetration scenario, with varying distance and transmit power
Figure 4.4: Diffraction Scenario: There is no LOS, but diffracted signals might enable communication
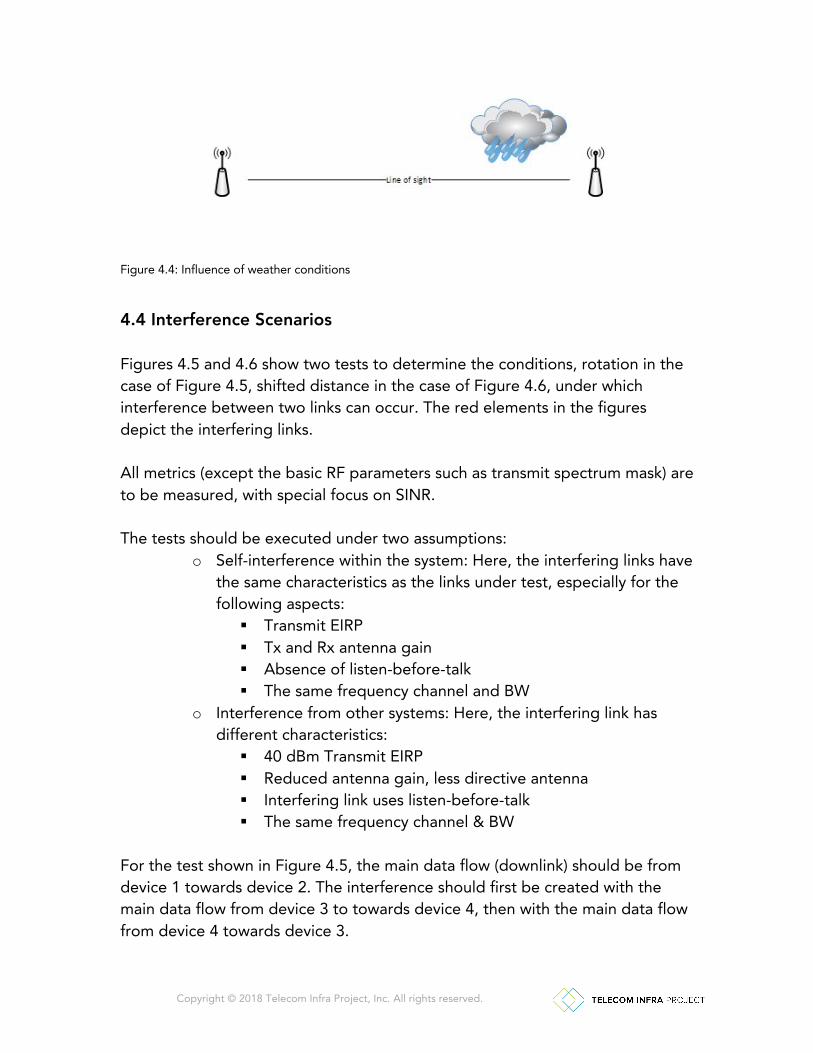
4.3 Influence of Weather Conditions In this test, all metrics (except the basic RF parameters such as transmit spectrum mask) are measured over longer periods in an outdoor environment to determine the influence of weather conditions. Of highest interest is the effect of rain, more specifically the following rain intensities: 2.5 mm/hr, 12.5 mm/hr, 25 mm/hr 35 mm/hr and 42 mm/hr. In the context of this text, the reaction time (see Section 2.2.12) is of special interest.
Copyright © 2018 Telecom Infra Project, Inc. All rights reserved.
Figure 4.4: Influence of weather conditions
4.4 Interference Scenarios Figures 4.5 and 4.6 show two tests to determine the conditions, rotation in the case of Figure 4.5, shifted distance in the case of Figure 4.6, under which interference between two links can occur. The red elements in the figures depict the interfering links. All metrics (except the basic RF parameters such as transmit spectrum mask) are to be measured, with special focus on SINR. The tests should be executed under two assumptions:
o Self-interference within the system: Here, the interfering links have the same characteristics as the links under test, especially for the following aspects:
§ Transmit EIRP § Tx and Rx antenna gain § Absence of listen-before-talk § The same frequency channel and BW
o Interference from other systems: Here, the interfering link has different characteristics:
§ 40 dBm Transmit EIRP § Reduced antenna gain, less directive antenna § Interfering link uses listen-before-talk § The same frequency channel & BW
For the test shown in Figure 4.5, the main data flow (downlink) should be from device 1 towards device 2. The interference should first be created with the main data flow from device 3 to towards device 4, then with the main data flow from device 4 towards device 3.

Copyright © 2018 Telecom Infra Project, Inc. All rights reserved.
Figure 4.5: Interference Test 1
Figure 4.6: Interference Test 2
4.5 Interference along a Street The test setup depicted in Figure 4,7 is an advanced version of the test setup depicted in Figure 4.6. For a transmission along a street self-interference within

Copyright © 2018 Telecom Infra Project, Inc. All rights reserved.
the system might occur. This test shall be executed with two different traffic patterns: In option 1, all links mainly transmit in the same direction, while in option 2 there is downlink traffic in different directions. All metrics (except the basic RF parameters such as transmit spectrum mask) are to be measured, with special focus on SINR.
Figure 4.7: Interference along a street
5. Summary This document proposes the KPIs and the test cases and setups to be used for the validation of the millimeter wave technologies of the TIP mmWave Networks Project Group ecosystem. Specifically, the current version describes the key metrics that are relevant for technologies that operate at 60 GHz spectrum and are based on IEEE 802.11ad and/or IEEE 802.11ay standards. The purpose of the current version is to be further discussed with all of the TIP Partners, to develop a version that is more detailed and reflects a more global view. In future version(s), targeted values (where applicable), more detailed test setup, procedures and equipment description will be incorporated.
Appendix A: References mmWave distribution node network, new usage model in IEEE 802.11ay, https://mentor.ieee.org/802.11/dcn/17/11-17-1019-02-00ay-mmwave-mesh-network-usage-model.pptx

Copyright © 2018 Telecom Infra Project, Inc. All rights reserved.
Copyright © 2018 Telecom Infra Project, Inc. All rights reserved. The Telecom Infra Project logo is a trademark of Telecom Infra Project, Inc. (the “Project”) in the United States or other countries and is registered in one or more countries. Removal of any of the notices or disclaimers contained in this document is strictly prohibited. The publication of this document is for informational purposes only. THIS DOCUMENT IS PROVIDED “AS IS,” AND WITHOUT ANY WARRANTY OF ANY KIND, INCLUDING WITHOUT LIMITATION, ANY EXPRESS OR IMPLIED WARRANTY OF NONINFRINGEMENT, MERCHANTABILITY, OR FITNESS FOR A PARTICULAR PURPOSE. UNDER NO CIRCUMSTANCES WILL THE PROJECT BE LIABLE TO ANY PARTY UNDER ANY CONTRACT, STRICT LIABILITY, NEGLIGENCE OR OTHER LEGAL OR EQUITABLE THEORY, FOR ANY INCIDENTAL INDIRECT, SPECIAL, EXEMPLARY, PUNITIVE, OR CONSEQUENTIAL DAMAGES OR FOR ANY COMMERCIAL OR ECONOMIC LOSSES, WITHOUT LIMITATION, INCLUDING AS A RESULT OF PRODUCT LIABILITY CLAIMS, LOST PROFITS, SAVINGS OR REVENUES OF ANY KIND IN CONNECTION WITH THE SUBJECT MATTER OF THIS AGREEMENT.