radiation shielding approaches for planetary surface
TRANSCRIPT
University of North DakotaUND Scholarly Commons
Theses and Dissertations Theses, Dissertations, and Senior Projects
January 2015
Radiation Shielding Approaches For PlanetarySurface Exploration: A Mars Case Study For UndConceptsArturo Ortiz
Follow this and additional works at: https://commons.und.edu/theses
This Thesis is brought to you for free and open access by the Theses, Dissertations, and Senior Projects at UND Scholarly Commons. It has beenaccepted for inclusion in Theses and Dissertations by an authorized administrator of UND Scholarly Commons. For more information, please [email protected].
Recommended CitationOrtiz, Arturo, "Radiation Shielding Approaches For Planetary Surface Exploration: A Mars Case Study For Und Concepts" (2015).Theses and Dissertations. 1819.https://commons.und.edu/theses/1819
RADIATION SHIELDING APPROACHES FOR PLANETARY SURFACE
EXPLORATION: A MARS CASE STUDY FOR UND CONCEPTS
by
Arturo Rafael Ortiz
Bachelor of Science, University of Puerto Rico, 1978
Master of Science, California State University, 1998
A Thesis
Submitted to the Graduate Faculty
of the
University of North Dakota
in partial fulfilment of the requirements
for the degree of
Master of Science
Grand Forks, North Dakota
May
2015

ii
Copyright 2015 Arturo R. Ortiz

This thesis, submitted by Arturo Ortiz in partial fulfillment of the requirements
for the Degree of Master of Science from the University of North Dakota, has been read
by the Faculty Advisory Committee under whom the work has been done and is hereby
approved. rnn/') r1,151( . it--'11 ,/U \4 L-Au*,^-z ,- *
Dr Jr"dtt" Ryg.l".,, Chairman
.-""2., ,- J'
.,i-'q r,/"{o /l 4 -,
This thesis is being submitted by the appointed advisory committee as having met
all of the requirements of the School of Graduate Studies at the University of North
Dakota and is hereby approved.
- . drtr/r- tz, f q
Date
'D. Pubio d.
Dr. Warren Jensen
Dean of the School of Graduate Studies
111

iv
PERMISSION
Title Radiation Shielding Approaches for Planetary Surface Exploration:
A Mars Case Study for UND Concepts
Department Space Studies
Degree Master of Science
In presenting this thesis in partial fulfillment of the requirements for a graduate
degree from the University of North Dakota, I agree that the library of this University
shall make it freely available for inspection. I further agree that permission for extensive
copying for scholarly purposes may be granted by the professor who supervised my
thesis work or, in his absence, by the Chairperson of the department or the Dean of the
School of Graduate Studies. It is understood that any copying or publication or other use
of this thesis or part thereof for financial gain shall not be allowed without my written
permission. It is also understood that due recognition shall be given to me and to the
University of North Dakota in any scholarly use which may be made of any material in
my thesis.
Arturo R. Ortiz
May 2015

v
TABLE OF CONTENTS
LIST OF FIGURES ........................................................................................................ viii
LIST OF TABLES ............................................................................................................ xii
ACKNOWLEDGMENTS .............................................................................................. xiv
ABSTRACT ......................................................................................................................xv
CHAPTER
I. INTRODUCTION ......................................................................................1
Overview .........................................................................................1
UND Planetary Surface Exploration Concepts ...............................2
The Hazardous Effects of Space Radiation . ...................................4
The Composition of Space Radiation .............................................4
The Mars Radiation Environment ...................................................6
Radiation Shielding .......................................................................10
Literature Review ..........................................................................15
II. METHOD .................................................................................................19
Overview .......................................................................................19
Radiation Transport in Matter .......................................................19
Ray-By-Ray Analysis ...................................................................22
Computational Tools .....................................................................23
Selection of Materials for Shielding Analysis ..............................26
Selection of Radiation Environments for Analysis .......................28

vi
Model of Inflatable Lunar-Martian Habitat ..................................30
Model of Pressurized Electric Rover ............................................33
Model of Space Suits ....................................................................35
Test Series .....................................................................................36
Inflatable Lunar-Martian Habitat ....................................36
Pressurized Electric Rover ...............................................38
Space Suits ........................................................................41
Surface Scenarios ..........................................................................41
Conservatism of the Methods .......................................................45
III. RESULTS .................................................................................................46
Inflatable Lunar-Martian Habitat ..................................................46
Pressurized Electric Rover ............................................................67
Space Suits ....................................................................................78
Surface Scenarios ..........................................................................79
IV. CONCLUSION .........................................................................................81
Introductory Remarks ...................................................................81
Inflatable Lunar-Martian Habitat ..................................................81
Pressurized Electric Rover ............................................................84
Space Suits ....................................................................................87
Surface Scenarios ..........................................................................88
V. RECOMMENDATIONS FOR FUTURE WORK ...................................90
APPENDICES ..................................................................................................................95
A. Compositions of Shielding Materials used in these Investigations .................96

vii
B. Permissible Exposure Limits for Astronauts ...................................................98
C. Minimal Surface Scenario ...............................................................................99
D. Ray Crossings on Port Side of PER ..............................................................100
E. Abbreviations and Acronyms ........................................................................103
REFERENCES ...............................................................................................................104
viii
LIST OF FIGURES
Figure Page
1. ILMH with PER in Docked Configuration ....................................................................2
2. Internal Frame of ILMH ................................................................................................2
3. PER with NDX-2 Space Suits Docked at Suitports .......................................................3
4. NDX-2 Space Suit ..........................................................................................................3
5. Radiation Measurements on Mars by Curiosity RAD Instrument .................................8
6. Abrasion-Ablation Sequence .......................................................................................25
7. Radiation Attenuation by Equal Masses of Material ....................................................26
8. Radiation Attenuation by Equal Volumes of Material ................................................28
9. ILMH Box ....................................................................................................................31
10. Trial Thickness Distributions .....................................................................................32
11. Convergence Test for Number of Rays .....................................................................33
12. Geometry of Ray Crossing Oblique Bow Surface of PER ........................................35
13. PER Target Points ......................................................................................................39
14. Dose Equivalent inside ILMH for February 1956 Solar Flare ..................................46
15. Dose Equivalent inside ILMH for 365 Days of 1977 Solar Min GCR ......................47
16. Acute Exposure inside ILMH – 5 g/cm2 Polyethylene Shielding ..............................48
17. 30 Day Exposure inside ILMH – 5 g/cm2 Polyethylene Shielding ...........................48
18. 365 Day Exposure inside ILMH – 5 g/cm2 Polyethylene Shielding .........................49
19. Acute Exposure inside ILMH – 10 g/cm2 Polyethylene Shielding ............................49
ix
20. 30 Day Exposure inside ILMH – 10 g/cm2 Polyethylene Shielding .........................50
21. 365 Day Exposure inside ILMH – 10 g/cm2 Polyethylene Shielding .......................50
22. Acute Exposure inside ILMH – 15 g/cm2 Polyethylene Shielding ............................51
23. 30 Day Exposure inside ILMH – 15 g/cm2 Polyethylene Shielding .........................51
24. 365 Day Exposure inside ILMH – 15 g/cm2 Polyethylene Shielding .......................52
25. Surface Plot of Acute Exposure inside ILMH – Polyethylene Shielding ..................53
26. Surface Plot of 30 Day Exposure inside ILMH – Polyethylene Shielding ................54
27. Surface Plot of 365 Day Exposure inside ILMH – Polyethylene Shielding ..............55
28. Contour Plot of Acute Exposure inside ILMH – Polyethylene Shielding .................56
29. Contour Plot of 30 Day Exposure inside ILMH – Polyethylene Shielding ...............57
30. Contour Plot of 365 Day Exposure inside ILMH – Polyethylene Shielding .............58
31. Acute Exposure inside ILMH – 1m Regolith Shielding ............................................59
32. 30 Day Exposure inside ILMH – 1m Regolith Shielding ..........................................59
33. 365 Day Exposure inside ILMH – 1m Regolith Shielding ........................................60
34. Acute Exposure inside ILMH – 2m Regolith Shielding ............................................60
35. 30 Day Exposure inside ILMH – 2m Regolith Shielding ..........................................61
36. 365 Day Exposure inside ILMH – 2m Regolith Shielding ........................................61
37. Surface Plot of Acute Exposure inside ILMH – Regolith Shielding .........................63
38. Surface Plot of 30 Day Exposure inside ILMH – Regolith Shielding .......................64
39. Surface Plot of 365 Day Exposure inside ILMH – Regolith Shielding .....................65
40. Contour Plot of Acute Exposure inside ILMH – Regolith Shielding ........................66
41. Contour Plot of 30 Day Exposure inside ILMH – Regolith Shielding ......................66
42. Contour Plot of 365 Day Exposure inside ILMH – Regolith Shielding ....................67

x
43. Acute Exposure inside PER – Port Side ....................................................................68
44. Acute Exposure inside PER – Starboard Side ...........................................................68
45. Solar Flare Attenuation by Hemispheres in Mars Environment ................................70
46. GCR Attenuation by Hemispheres in Mars Environment .........................................70
47. Dose at PER Hammocks February 1956 Solar Flare at -10 km ................................71
48. Dose at PER Hammocks February 1956 Solar Flare at 0 km ....................................71
49. Dose at PER Hammocks February 1956 Solar Flare at 10 km ..................................72
50. Dose at PER Hammocks February 1956 Solar Flare at 20 km ..................................72
51. Dose at PER Hammocks February 1956 Solar Flare at 30 km ..................................72
52. Solar Flare Dose at PER Hammocks with Fiberglass Hatch .....................................74
53. Dose at PER Hammocks 1 Year 1977 Solar Min GCR at -10 km ............................75
54. Dose at PER Hammocks 1 Year 1977 Solar Min GCR at 0 km ................................76
55. Dose at PER Hammocks 1 Year 1977 Solar Min GCR at 10 km ..............................76
56. Dose at PER Hammocks 1 Year 1977 Solar Min GCR at 20 km ..............................76
57. Dose at PER Hammocks 1 Year 1977 Solar Min GCR at 30 km ..............................77
58. GCR Dose at PER Hammocks with Fiberglass Hatch ...............................................77
59. Acute Exposure inside Baseline and Heavy PERs – Port Side ..................................78
60. Acute Exposure during Surface EVA ........................................................................79
61. ILMH under a Layer of Regolith ...............................................................................83
62. View of Interior Panels of a Proposed Moon Habitat ................................................84
63. CAM/CAF Phantoms and Body Zones ......................................................................94
64. PER Port Rays Converging at Port Hammock 1 Target Point .................................100
65. PER Port Rays Converging at Port Hammock 2 Target Point .................................101

xi
66. PER Port Rays Converging at Port Hammock 3 Target Point .................................101
67. PER Port Rays Converging at Port Hammock 4 Target Point .................................102
68. PER Port Rays Converging at Port Hammock 5 Target Point .................................102

xii
LIST OF TABLES
Table Page
1. Mars Atmosphere Protection in the Vertical Direction .................................................9
2. PER Materials ..............................................................................................................34
3. PER Target Points ........................................................................................................40
4. Materials for Heavy PER .............................................................................................41
5. Minimal Surface Scenario ............................................................................................44
6. Climbing Expedition ....................................................................................................44
7. Port Rays that Cross PER Hatch ..................................................................................73
8. Exposure for 365 Day Surface Stay .............................................................................80
9. Maximum Suggested Surface Elevation (km) for ILMH ............................................82
10. Aluminum ..................................................................................................................96
11. Fiberglass Epoxy ........................................................................................................96
12. Graphite Epoxy 51-49 ................................................................................................96
13. Mars Atmosphere .......................................................................................................96
14. Mars Regolith Simulant .............................................................................................96
15. Mylar ..........................................................................................................................97
16. Polyethylene ...............................................................................................................97
17. NASA Dose Limits for Short Term or Career Non-Cancer Effects ..........................98
18. European Space Agency Dose Limits ........................................................................98
19. Russian Space Agency Dose Limits ..........................................................................98
xiii
20. Detailed Summary of Minimal Surface Scenario ......................................................99

xiv
ACKNOWLEDGMENTS
I express my sincere appreciation to the members of my thesis advisory
committee, Drs. Vadim Rygalov, Pablo de León, and Warren Jensen, for their guidance
and support during my time in the Master of Science program at the University of North
Dakota. The exploration of space is an international endeavor, and it is noteworthy that
the makeup of my thesis advisory committee reflects this. I express special appreciation
to Dr. Rygalov, for it was during his fine course on Human Performance in Extreme
Environments that these investigations were conceived, while he was lecturing on space
radiation effects and linear energy transfer. I enrolled in that course as a general elective,
unaware at the time that an intense thesis investigation would arise from it. I express my
sincere appreciation to fellow Space Studies student Poonampreet Kaur Josan for
providing essential configuration data on the University of North Dakota planetary
surface exploration analogs. I express very special appreciation to the faculty and staff of
the Department of Space Studies for providing an unparalleled interdisciplinary graduate
program in spaceflight, available anywhere, anytime, to the explorers and guardians of
the High Frontier. Finally, I express my sincere appreciation to the Space Radiation
Group at the NASA Langley Research Center, for making available to me the use of their
powerful computer codes and models for space radiation analysis, without which these
investigations would not have been possible. Ad astra.

To the King of Heaven, Yeshua Ha’Mashiach (Jesus the Messiah), creator of many
celestial wonders that declare His Father’s glory. Gadol elohai.

xv
ABSTRACT
Surface stays on Mars may expose astronauts to high radiation doses from solar
flares and galactic cosmic radiation (GCR). We estimated shielding required for a
surface habitat, and assessed environments inside a planetary rover and space suit, under
historically severe solar flare and GCR conditions, using the HZETRN radiation
computer code. A 1m layer of Mars regolith can protect the habitat up to 30 km surface
elevation. Polyethylene at 5, 10, and 15 g/cm2 can protect up to 0, 10, and 20 km,
respectively. The rover protects from acute exposure up to -0.7 km while a space suit
protects up to -0.6 km. The shielded habitat is adequate as the primary radiation storm
shelter, while the rover is inadequate as the secondary shelter. Scenarios for 365 day
surface stays predict exposures of 270 to 1196 mSv, depending on sheltering and
elevation. Permissible limits are met only for minimal surface exploration.
The planetary surface exploration concepts examined under these investigations
are the University of North Dakota (UND) Inflatable Lunar-Martian Habitat (ILMH),
Pressurized Electric Rover (PER), and NDX-2 space suit. The radiation environments
are the February 1956 solar flare and 1977 solar minimum GCR, over a Mars surface
elevation range of -10 to 30 km. Computational analyses were performed using the
NASA Langley HZETRN and NUCFRG3 radiation computer codes with ray-by-ray
transport through three-dimensional shielding thickness distributions.
Surface exploration scenarios were developed to estimate exposure for 365 day
surface stays. A minimal scenario entails exploration below 4 km elevation, with the

xvi
solar flare occurring while the astronaut is inside the protection of a lightly shielded
ILMH deployed at 0 km. An intermediate scenario entails the same conditions, but with
the solar flare occurring while the astronaut is outside at 4 km and protected only by
space suit fabric. An extreme scenario includes a climbing expedition up to 30 km
elevation, with the solar flare occurring between 24 and 30 km, while the astronaut is
outside and protected only by space suit fabric. Total exposure under the three scenarios
is 270, 337, and 1196 mSv, respectively, with limits for acute exposure exceeded under
the intermediate and extreme scenarios. Space suit fabric provides almost negligible
protection during extravehicular activity. Acute exposure under the extreme scenario
exceeds the threshold for acute radiation syndrome. The weak protection provided by the
PER and space suit drives a need to formulate alternative radiation protection strategies
involving major restrictions on surface operations along with early detection and warning
of solar storm activity.

1
CHAPTER I
INTRODUCTION
Overview
The primary goal of this thesis is to investigate radiation shielding approaches to
protect astronauts from exposure to ionizing radiation from space in planetary surface
environments. The Mars surface radiation environment was selected for a case study
involving planetary exploration concepts developed by the University of North Dakota
(UND), Department of Space Studies. UND developed minimal solution planetary
surface exploration concepts under a NASA grant from 2010 through 2012. This thesis
focused on shielding approaches for the UND Inflatable Lunar-Martian Habitat (ILMH)
and the Pressurized Electric Rover (PER). A cursory investigation was performed to
assess the limited radiation protection provided by layers of Mylar used in space suits.
Shielding approaches involved layers of polyethylene, graphite epoxy, and Mars regolith.
NASA space radiation transport and nuclear fragmentation codes were applied to
estimate radiation doses inside the shielded habitat and the rover, resulting from
historically severe solar particle event (SPE) and galactic cosmic radiation (GCR)
environments. Acute exposure to SPE and prolonged exposure to GCR were estimated
for a Mars surface stay of one Earth year, taking into account regular extravehicular
activity (EVA) regimens for exploration.

2
UND Planetary Surface Exploration Concepts
The ILMH is a prototype habitat for Moon and Mars surface exploration. It
consists of a rigid frame covered by an inflatable bladder, approximately 12.2 m long, 3m
wide, and 2.4 m high. The bladder maintains an atmosphere. It is stiffened and
constrained by an internal rigid frame, which is composed of interlocking hub and strut
elements. The frame provides support for mounting of interior architectural elements. In
addition, the bladder and restraint can support a layer of regolith, which enables an in situ
radiation shielding approach (Schneider et al., 2010). The ILMH can support a crew of
four astronauts. The PER docks to the ILMH (de León et al., 2010). Figure 1 shows the
ILMH with the PER in the docked configuration. Figure 2 shows the internal frame of
the ILMH.
Figure 1. ILMH with PER in Docked Configuration
Figure 2. Internal Frame of ILMH

3
The PER is a pressurized electric wheeled vehicle with a suitport interface to a
pair of North Dakota Experimental (NDX) - 2 space suits. It is powered by an electric
battery that requires recharging after 24 hours. Its basic structure is similar to a
commercial electric vehicle, with a composite shell of fiberglass and epoxy resin and an
aluminum floor (de León et al., 2010). It has a carbon fiber hatch on the port side for
mating to the ILMH. The PER has a top speed of 25 mph in high mode and 15 mph in
low mode (Schneider et al., 2010). Figure 3 shows the PER with a pair of NDX-2 space
suits docked at the suitports.
Figure 3. PER with NDX-2 Space Suits Docked at Suitports
The NDX-1 and NDX-2 space suits were developed as prototype planetary
exploration suits for NASA. The NDX-2 space suit incorporated improvements to the
NDX-1, which includes aft entry, as in the Russian Orlan space suit (de León et al.,
2010). The NDX-2 suit docks to the PER through a suitport. Figure 4 shows the NDX-2
space suit.
Figure 4. NDX-2 Space Suit

4
The Hazardous Effects of Space Radiation
Astronauts need protection from deterministic and stochastic effects of space
radiation. Deterministic effects result from direct damage to biological tissue. These are
more likely to result from high exposure, such as 0.5 to 2 Gy. SPEs may cause
deterministic effects such as skin damage, blood count changes, and immune system
failure. Stochastic effects are random and include induced cancer and genetic effects.
They are infrequent and their thresholds are not well known. Stochastic effects are
believed to be proportional to exposure to low doses (Sinclair, 2000). They may include
cancer, tumor formation, and neurological disorders, and may occur many years after
exposure. They vary with the organ or tissue (Borggräfe, Quatmann, and Nölke, 2009).
In deep space, the main risk of acute exposure is from SPE, and the main risk of
chronic exposure is from GCR (Singleterry et al., 2013). It is estimated that about 10%
of SPE can cause significant radiation exposure (> 10 mSv) to human organs. For long
space missions, multiple exposures to SPE with intense particle fluxes and high energies
are a major concern (Kim, De Angelis, and Cucinotta, 2011).
There is very little hard data on the biological effects of GCR, since astronauts
have never endured long term exposure to GCR (Letaw, Silberberg, and Tsao, 1989).
There are no human data on exposure to protons and ions of high charge and energy, and
there are very little experimental data at low rates of these particles (Cucinotta, Kim, and
Ren, 2006).
The Composition of Space Radiation
The Sun continuously emits the solar wind, consisting mainly of protons and
electrons. Solar wind intensity varies over the 11 year solar cycle over a range of about

5
1010
to 1012
particles per cm2 per second per steradian. Generally, solar wind particles
have relatively low energies (from a few hundred eV to a few keV for a proton), and are
easily stopped within the first few hundred angstroms of shielding material. During an
SPE, the Sun releases large amounts of energy in sudden local bursts of gamma rays,
hard and soft x-rays, radio waves, and highly energetic particles (mainly protons) at high
fluence and flux density. Large currents and dynamic magnetic fields in the solar corona
accelerate charged solar particles into interplanetary space with energies of the order of
several GeV (Reitz, Berger, and Matthiae, 2012). SPEs can deliver a very high radiation
dose in a short time (Borggräfe, Quatmann, and Nölke, 2009).
SPEs are sporadic, and usually have energies below 1 GeV per nucleon. They are
associated with large coronal mass ejections (CMEs) from the Sun (Wilson et al., 2001a).
SPE frequency distribution depends strongly on the phase of the solar activity cycle.
SPEs occur frequently, and it is difficult to predict their size and timing (De Angelis et
al., 2007; Kim, De Angelis, and Cucinotta, 2011). They tend to occur during solar
maximum, when there is peak solar activity along with high sunspot numbers. During
solar minimum, sunspot numbers are low, and SPEs are infrequent (Pham and El-Genk,
2009; Cucinotta et al., 2013). It is important to characterize the size, speed, and location
of evolving CMEs of fluences greater than 1010
particles per cm2. These appear to occur
at an average rate of 1.5 per solar cycle (Sinclair, 2000). A particularly intense solar flare
occurred on 23 February 1956. The SPE of 29 September 1989 released protons with
energies above 30 MeV at fluence of 1.4 x 10⁹ particles per cm
2 (De Angelis et al., 2007).
SPE particle energies rarely exceed 600 MeV, but their flux is about six orders of
magnitude higher than for GCR. During a worst case event, about 100 million particles

6
per cm2 of moderate energies may impinge on a spacecraft over several hours (Borggräfe,
Quatmann, and Nölke, 2009).
GCR consists of highly energetic fully ionized nuclei of elements from hydrogen
to uranium. GCR ions have energies from several tens of MeV per nucleon up to1012
MeV per nucleon. Their distribution appears to be almost isotropic (Borggräfe,
Quatmann, and Nölke, 2009). The more abundant elements in GCR are hydrogen
through nickel at energies from tens to millions of MeV (Wilson et al., 2001b). From
interstellar space, the nuclei approach the Solar System and interact with the heliosphere.
The inward diffusion of GCR is balanced by the outward convection of the solar wind
(De Angelis et al., 2007). During solar maximum, GCR flux is about half as high as
during solar minimum (Borggräfe, Quatmann, and Nölke, 2009).
GCR is high linear energy transfer (LET) radiation, and it will be encountered
during interplanetary missions. LET is ion energy lost per path length when penetrating
through a material. High LET radiation may be 20 to 50 times more damaging to
biological tissue than low LET radiation. In order to assess biological risk, the measured
dose (D [Gy]) of high LET radiation must be accurately weighted by a quality factor (Q)
to obtain the dose equivalent (H [Sv]) (Sinclair, 2000). High LET radiation is more
likely to cause cancer, and hence higher Q is assigned to it (Simonsen et al., 2000).
The Mars Radiation Environment
Mars does not have a planetary magnetic field, and therefore cannot deflect
charged particles of low energy. Unlike the Earth, Mars cannot trap charged particles in
belts around the planet. Consequently, the Mars surface environment lacks the radiation
protection of a magnetosphere.

7
On a planetary surface, the planet’s shadow provides shielding from 50% of space
radiation (Letaw, Silberberg, and Tsao, 1989). The primary ions come from above over a
solid angle range of 0 to 2 steradians. Local topographic features may further reduce
the solid angle range (De Angelis et al., 2007).
Planetary atmospheres provide additional shielding, which is very limited in the
case of the thin Mars atmosphere (Stanford and Jones, 1999; Cucinotta et al., 2013).
However, the presence of an atmosphere leads to secondary radiation, since radiation
particles interact with atoms of planetary atmospheres and surfaces, producing neutrons,
which must be accounted for in the surface radiation environment (Borggräfe, Quatmann,
and Nölke, 2009). In addition, Mars lacks an ozone layer, and significant ultraviolet
radiation reaches the surface (Taraba et al., 2006), which is an additional hazard.
Prior to measurements by Mars surface rovers, understanding of the Mars surface
radiation environment was based on data from Apollo missions, Earth orbit spacecraft,
and calculations from models. The Radiation Assessment Detector (RAD) on board the
Curiosity Mars rover has been monitoring the Mars surface radiation environment since
August 2012. According to RAD measurements, the dose rate is about 210 Gy per day,
almost entirely due to GCR, with slow variations attributed to day-to-night differences in
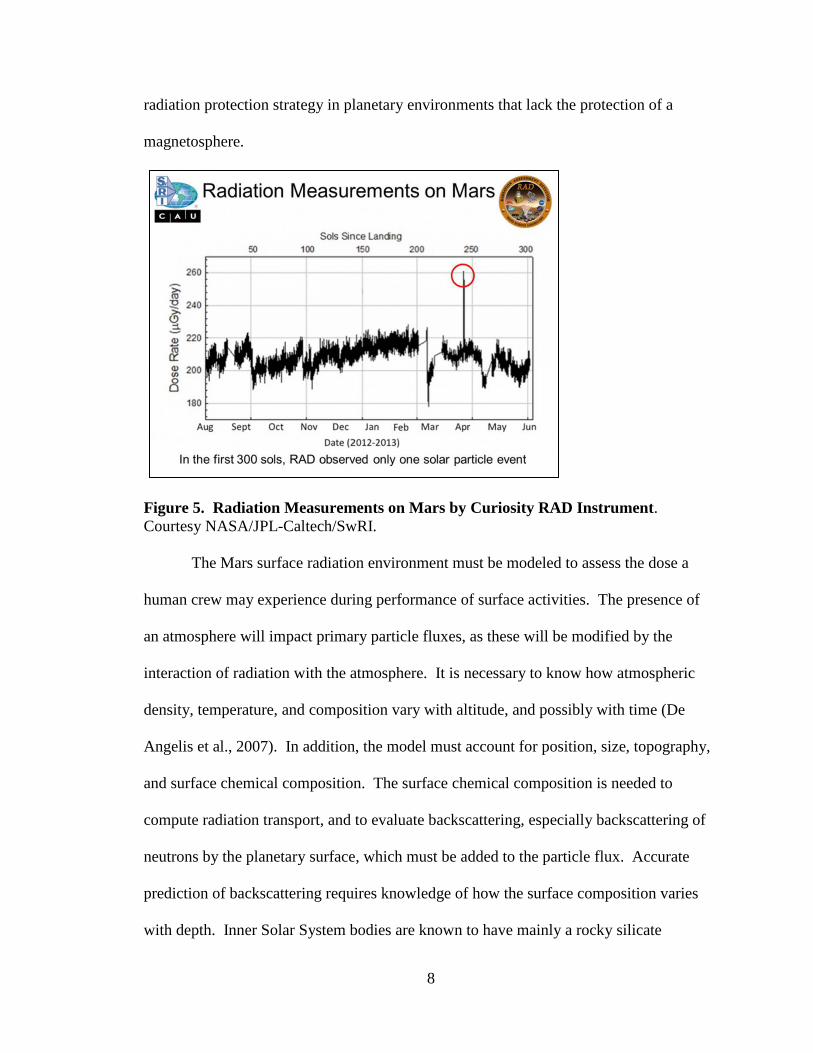
shielding provided by the atmosphere (NASA, 2014). Figure 5 shows 10 months of RAD
data. A single SPE occurred during that period, as noted in the figure. It was not a large
event.
The primary contributor to acute radiation exposure is SPE. Hence, capability to
monitor, and to eventually predict major solar eruptions will be an important part of
8
radiation protection strategy in planetary environments that lack the protection of a
magnetosphere.
Figure 5. Radiation Measurements on Mars by Curiosity RAD Instrument.
Courtesy NASA/JPL-Caltech/SwRI.
The Mars surface radiation environment must be modeled to assess the dose a
human crew may experience during performance of surface activities. The presence of
an atmosphere will impact primary particle fluxes, as these will be modified by the
interaction of radiation with the atmosphere. It is necessary to know how atmospheric
density, temperature, and composition vary with altitude, and possibly with time (De
Angelis et al., 2007). In addition, the model must account for position, size, topography,
and surface chemical composition. The surface chemical composition is needed to
compute radiation transport, and to evaluate backscattering, especially backscattering of
neutrons by the planetary surface, which must be added to the particle flux. Accurate
prediction of backscattering requires knowledge of how the surface composition varies
with depth. Inner Solar System bodies are known to have mainly a rocky silicate

9
composition. At low energy, backscattering of neutrons by silicates may be significant
(De Angelis et al., 2007).
The Committee on Space Research (COSPAR) developed low-density and high-
density models of radiation shielding provided by the Mars atmosphere, based on data
from the Viking landers. The Mars atmosphere is understood to provide radiation
shielding equivalent to 16 g/cm2 of CO2, resulting in an annual dose equivalent of 100 to
200 mSv, due mostly to GCR, over a surface elevation range from 0 to 12 km (Horneck
et al., 2001). Table 1 shows the radiation protection provided by the Mars atmosphere
according to the two COSPAR models (Simonsen et al., 1990).
Table 1. Mars Atmosphere Protection in the Vertical Direction
Protection (g/cm2 CO2)
Altitude (km) Low-Density Model High-Density Model
0 16 22
4 11 16
8 7 11
12 5 8
Researchers use the Mars Global Reference Atmospheric Model (Mars-GRAM)
for altitudes up to 80 km, the University of Arizona Mars Thermosphere General
Circulation Model from 80 to 170 km, and a thermospheric model (dependent on latitude,
longitude, and solar activity) above 170 km. Surface chemical composition has been
modeled using in situ results from the Viking 1 and 2 landers, the Mars Pathfinder
missions, and measurements from Mars 5 and Phobos 2 (De Angelis et al., 2007).
De Angelis and colleagues developed a model of the Mars radiation environment,
based on an expansion of capabilities of an earlier model restricted to the surface. Their
expanded model evaluates radiation at any location within the Mars atmosphere by
accounting for backscattered particles transported from the surface through the

10
atmosphere. They based the chemical and isotopic composition of the Mars atmosphere
on findings from the Viking landers. Soil composition was considered, along with ices
and volatiles. The model allows computation of particle flux and energy spectra at any
point at any time on the Mars surface (De Angelis et al., 2007).
Radiation Shielding
Outside of the protection of the Earth magnetosphere, effective shielding is
required to protect humans from space radiation. The purpose of shielding is to decrease
the radiation intensity by altering the radiation through interactions within protective
materials (Wilson et al., 2001b). Ultimately, the human body and sensitive spacecraft
electronics behind the shield are the targets of concern (Borggräfe, Quatmann, and Nölke,
2009).
During interplanetary transit, passive protection from SPE may consist of bulk
shielding, which is massive. To reduce mass, a small storm shelter may be built inside
the spacecraft, protected by heavy aluminum shielding of about 20 to 30 g/cm2. A storm
shelter may protect the crew from most deterministic effects, but probably not from late
stochastic effects. If a very energetic SPE releases particles with energies above 1 GeV,
a storm shelter is not likely to provide protection (Spillantini et al., 2007). The human
body provides self-shielding equivalent to 10 g/cm2 of aluminum (Letaw, Silberberg, and
Tsao, 1989).
Accurate analysis of radiation transport inside shielding must account for energy
loss by radiation particles as they penetrate the shielding. Energy loss through nuclear
fragmentation is of particular interest to radiation shielding analysis. Fragmentation is a
case of deep inelastic scattering. Biologically hazardous fragments are more likely to

11
emerge from collisions with targets of high atomic number or during bombardment by
heavy ions. The resulting secondary particles also penetrate the shielding material and
may cause additional nuclear reactions (Borggräfe, Quatmann, and Nölke, 2009).
Fragmentation of relatively light ions, such as alpha particles, is simpler than that of
heavy ions, since there are fewer final states that can emerge from the reactions (Shavers,
Cucinotta, and Wilson, 2001).
An ion moving through matter interacts primarily through Coulomb forces with
electrons and nuclei. Generally, there will be three types of interactions, which are
scattering by atomic electrons, elastic nuclear scattering, and nuclear reactions (Wilson et
al., 2001a). The ion loses energy continuously and may stop after a finite distance called
the range. The range depends on the ion type, its energy, and the composition of the
material (Tsoulfanidis, 1995).
Essentially, the radiation protection problem consists of characterization of the
habitable space interior radiation environment and the evaluation of its effects on
astronauts. The primary analytical method entails solution of the Boltzmann equation
(Wilson et al., 2001b), which describes the statistical average of energy densities of the
particles in the system. Boltzmann analysis treats the radiation as a continuous field.
Modeling and simulation of radiation transport is accomplished by numerical solution of
the Boltzmann transport equation, or by Monte Carlo methods.
Space radiation researchers have identified desirable properties of effective
shielding materials. The material should have high mass efficiency (Spillantini et al.,
2007). It must attenuate high energy source ions and the secondary particles produced by
interactions of source ions with nuclei inside the shielding (Wilson et al., 2001a; Pham

12
and El-Genk, 2009). Light materials do not generate as many secondary particles from
nuclear collisions (Cucinotta et al., 2004). High number of electrons per unit mass and a
high nuclear reaction cross section per unit mass are desirable properties (Wilson et al.,
2001a). Materials of low atomic mass reduce the occurrence of secondary particles, and
are more effective per unit mass in slowing down or stopping ions in atomic collisions.
They are also effective at fragmenting ions of high charge and energy. Materials with
high ratio of atomic number to atomic mass units (Z/A) reduce the ion range-to-energy
ratio through higher Coulombic stopping. Hydrogen-rich materials reduce production of
neutrons and other secondary particles emerging from nuclear fragmentation (Shavers et
al., 2004). The external radiation environment and the type of shielding material
determine the required thickness of shielding.
For protection from SPE, the main issues are particle fluence, frequency
distribution, predicted flux and energy spectra, and the largest event likely to be
encountered. Aluminum shielding of about 5 g/cm2 provides adequate protection from
SPE protons in the 50 to 70 MeV range (Spillantini, 2007). However, this will not
protect against extremely energetic protons ejected during some exceptionally intense
solar events. A few hours of exposure can exceed recommended dose limits. The effects
could be acute and deterministic, and could lead to lethal radiation syndromes
(Spillantini, 2007). In the case of relatively low energy SPE, energy deposition in human
tissue is easily reduced with additional shielding material. Most shielding materials
easily attenuate lower energy SPE particles, but production of secondary particles is
significant for higher energy SPE.

13
Highly energetic GCR nuclei can produce neutrons as secondary particles, thus
adding a neutron component to the GCR spectrum (Bartlett, Hager, and Tanner, 2003).
Materials of higher atomic number cause incident particles to emit low energy neutrons
and protons from nuclear collisions and recoil processes (Borggräfe, Quatmann, and
Nölke, 2009). The resulting neutron component depends on local shielding, and is
estimated to compose 10 to 60% of the total dose equivalent rate (Bartlett, Hager, and
Tanner, 2003). Hydrogen-rich materials, such as water or polyethylene, are suitable for
attenuation of neutrons.
It is difficult to protect against heavy energetic GCR ions due to their deep
penetrating power (Cucinotta et al., 2004). The effectiveness of GCR shielding drops as
the thickness increases, due to production of many secondary particles (Spillantini, 2007).
A shield will not absorb all the GCR. The radiation will penetrate in some form, and may
be absorbed by astronaut body tissue. In particular, relativistic ions in GCR are not
appreciably slowed by significant amounts of any material, and are the largest inducer of
secondary radiation in human tissue.
Aluminum is the standard material for radiation shielding in spacecraft.
Researchers found that aluminum shielding of 10 g/cm2 effectively attenuates 100 MeV
particles and associated secondary particles from spallation reactions (fragmentation) to
an acceptable level (Pham and El-Genk, 2009). Manned spacecraft typically use
aluminum at areal density in the 2 to 10 g/cm2 range (Wilson et al., 2001b). Aluminum
shielding of 5 g/cm2 is considered minimal, while 20 g/cm
2 is considered heavy shielding
(Cucinotta, Kim, and Ren, 2006). A thickness of 5 g/cm2 is typical for an area within a
habitat with equipment (Wilson et al., 2001b).
14
Researchers believe polymer composites are preferable to aluminum alloys.
Generic polyethylene (CH2) at a shielding areal density of 25 g/cm2 is being considered
(Badavi, Adams, and Wilson, 2010). Polyethylene fibers have high specific strength.
Polyethylene bricks weigh about half as much as aluminium, and are an excellent
candidate for retrofit. They are inert and are composed of low mass number elements (C
and H, which maximize Coulombic stopping while minimizing production of neutrons
and other secondary particles). Polyethylene also has desirable chemical and mechanical
properties. However, polyethylene has a low density (1.0 g/cm3), and hence occupies
more volume than denser materials (Shavers et al., 2004). NASA chose polyethylene as
the reference material for accelerator based radiation testing of multifunction composites
for radiation shielding. NASA is already implementing polyethylene as a shielding
material for manned space flight by adding blocks of polyethylene to the crew sleeping
quarters of the International Space Station (ISS) (Guetersloh et al., 2006). Hydrogen-rich
graphite fibers are also under serious consideration as efficient radiation shielding
materials (Wilson et al., 2001a).
Space suits are known to provide minimal protection from radiation. Generally,
radiation protection receives little attention during space suit design. Space suits are
designed for environmental control unrelated to radiation. Protection from radiation is
expected to be provided by temporary shelters or havens (Wilson et al., 2006). However,
during EVA, the space suit is the only protection for the skin, blood forming organs
(BFOs), and eyes. Since space suit life support systems can operate continuously for
eight hours, it is conceivable that an astronaut may roam a planetary surface long enough

15
to encounter an SPE, possibly far from the protection of a suitable storm shelter,
especially if there is no early warning of increased solar activity.
Literature Review
Previous investigations attempted to assess the relative effectiveness of shielding
materials and concepts for deployment in the Mars surface radiation environment.
Generally, space radiation researchers concluded from computational and experimental
investigations that hydrogen-rich materials are the best for shielding from both SPE and
GCR. Some significant previous investigations on radiation shielding for deployment in
the Mars surface environment are briefly summarized below in order by year of
publication.
Simonsen and colleagues calculated radiation exposure for a Mars mission of 2.5
years, with six months of transit each way, and a 1.5 year surface stay. They evaluated
effectiveness of light shielding of aluminum, polyethylene, and inflatable layup under
conditions of the August 1972 SPE, 1970 solar maximum GCR, and 1977 solar minimum
GCR. They concluded that only polyethylene gave significant reduction in dose
equivalent, which they attributed to its high hydrogen content (Simonsen et al., 2000).
Taraba and colleagues analyzed a manned mission to Mars for 2031. From time
of departure from Earth orbit to return to Earth, mission duration is 1066 days. The
launch date lies between the predicted solar maxima of 2025 and 2036, which reduces the
risk of having a major SPE during the mission. They estimated that 10 g/cm2 of
polyethylene shielding should limit BFO exposure to GCR during flight to 0.19 Sv/year
at solar maximum, and to 0.49 Sv/year at solar minimum. The polyethylene shielding is
also expected to limit exposure to SPE to 0.39 Sv at the Mars-Sun distance of 1.5 AU.

16
However, this shielding significantly increases vehicle mass. On the Mars surface, the
atmosphere limits BFO exposure to SPE to 0.32 Sv/year, and BFO exposure to GCR to
0.12 Sv/year. Exposure for the entire Mars mission was estimated to be about 2.5 to 3 Sv
(Taraba et al., 2006).
Cucinotta, Kim, and Ren calculated the shielding effectiveness of aluminum and
polyethylene for a Mars mission with a surface stay, in the environment of the August
1972 SPE, and solar minimum GCR. They concluded polyethylene was effective against
SPE. However, they found polyethylene to be about as poor as aluminum against GCR,
even under heavy shielding (Cucinotta, Kim, and Ren, 2006).
Guetersloh and colleagues performed experiments that tested the shielding
effectiveness of aluminum and polyethylene. Their data indicated that attenuation
through ionization and nuclear fragmentation occurred at higher rates in hydrogen than in
other materials, per unit mass of shielding (Guetersloh et al., 2006).
Borggräfe and colleagues calculated astronaut exposure for a Mars mission. Their
shielding materials were hydrogenated graphite nanofibers (HGNF), lithium hydride
(LiH), polyethylene, polysulfone, polyetherimide, water, and aluminium alloy Al2024.
For a Mars surface stay, they assumed CO2 shielding of a nominal Mars atmosphere.
Their radiation environment was GCR at solar maximum and minimum. Their
calculations indicated that shielding effectiveness increases with increasing hydrogen
content. They concluded HGNF, LiH, and polyethylene are the most effective materials
for attenuation of radiation (Borggräfe, Quatmann, and Nölke, 2009).
DeWitt and colleagues experimentally characterized the GCR radiation shielding
properties of aluminum, copper, and polyethylene. They irradiated these materials with

17
monoenergetic heavy ion beams in accelerator facilities, at combinations of atomic
number and beam energy that constituted a representative sample of the GCR spectrum.
Results indicated that polyethylene produced a very large increase in light fragment
peaks, along with a decrease in heights of peaks due to primaries (DeWitt et al., 2009).
Daga and colleagues studied the feasibility of deploying a hybrid rigid-inflatable
habitat on the Moon. Their concept is essentially the ILMH, and hence relevant to a
Mars case study. They considered radiation protection measures early in the study, and
incorporated heavy regolith shielding into the design architecture. They deliberately
avoided use of aluminum and other structural metals to reduce secondary radiation. The
panels inside the habitat could be made of polyethylene or other hydrogen-rich materials
to provide radiation protection. In addition, water and other hydrogen-rich materials
could be stored behind the floors, walls, and ceilings to contribute to radiation shielding
(Daga et al., 2010).
Schneider and colleagues performed computational investigations of radiation
shielding approaches for the ILMH on the Moon surface, assuming a stay of 180 days.
They examined several shielding materials, including Moon regolith simulant, and
estimated dose equivalent under several shielding scenarios. Although their research
involved a Moon scenario, it used methods and concepts applicable to a Mars case study.
Their assessment of the capability of the ILMH to support an adequate layer of Moon
regolith is of particular interest, since we considered a layer of Mars regolith for
shielding. A limitation of their study is that it did not account for the neutron backscatter
component of the radiation environment (Schneider et al., 2010).

18
Townsend and colleagues calculated radiation exposure on the Mars surface in the
environment of the February 1956 solar flare, at surface elevations from -7 to 25 km.
They evaluated the effectiveness of aluminum shielding over an areal density range of 0.3
to 40 g/cm2. Results showed that organ doses exceed 30 day limits (NASA, 2009) under
many of the analyzed conditions. Townsend and colleagues identified severe restrictions
in surface elevation, even under heavy shielding, to ensure doses remain within limits
(Townsend et al., 2013).
Cucinotta and colleagues analyzed the risks of cancer development after a 940
day Mars mission near solar minimum. They calculated doses under protection of heavy
aluminum shielding in low Earth orbit (LEO), Mars transit, and Mars surface
environments. Results indicated the cancer risk level exceeds NASA limits by a factor of
three, with some gender differences (Cucinotta et al., 2013).

19
CHAPTER II
METHOD
Overview
We assessed the radiation environments inside the ILMH, PER, and space suits by
running computer simulations that combined shielding materials, shielding
configurations, and Mars surface elevations with historically severe SPE and GCR
environments. The primary product was dose equivalent for the diverse combinations,
for comparison to permissible exposure limits. NASA, the European Space Agency
(ESA), and the Russian Space Agency (RSA) specify similar exposure limits. One
significant difference is that the RSA also specifies a BFO limit of 150 mSv for acute
exposure, which the other space agencies do not (NASA, 2009; THREE, 2014). Dose
limits of NASA, ESA, and RSA are summarized in Appendix B. Test series for the
ILMH emphasized protection from prolonged exposure to GCR. Test series for the PER
and space suits emphasized protection from acute exposure to SPE. From the results we
determined Mars surface environments and elevations where the ILMH and PER could
be deployed and astronauts could perform EVA regimens under safe radiation levels.
Radiation Transport in Matter
During direct ionization, charged particles such as protons, alpha and beta
particles, and higher Z nuclei lose energy mainly through discrete atomic excitation and
ionization as they interact with atoms in the target material. Electrons emerge at high
energies from the ionized atom after an impact by a particle of high charge and energy,

20
producing -rays (Cucinotta and Durante, 2006). Bethe-Bloch theory describes how
heavy ions lose energy as they pass through matter. The principal mechanisms of energy
loss are ionization and excitation of atoms in the material. Boltzmann transport theory
estimates particle flux and fluence from ion energy, penetration depth, and nuclear
fragmentation. State of the art space radiation transport codes incorporate Bethe-Bloch
theory, Boltzmann transport analysis, and a vast array of nuclear reactions data.
According to Bethe-Bloch theory, when a heavy ion of charge ze and velocity v
passes through a material of atomic number Z and density N atoms/m3, it transfers energy
dE to the material through ionization or excitation while penetrating to a depth dx. Given
the rest mass m0 of an electron, speed of light c, geometric mean excitation and ionization
potential I of the material, and = v/c, the stopping power is
.)1(
2ln
4 2
2
2
0
2
0
24
I
vmNZ
vm
ze
dx
dE [1]
This equation is valid for a charged particle moving through a pure element. A modified
version of the equation gives the stopping power for a charged particle moving through a
compound or mixture based on a weighted combination of individual stopping powers.
For a compound of molecular weight M and density , with the ith element having atomic
weight Ai, density i, stopping power (dE/dx)i, at Ni atoms per molecule, the weight
fraction of the ith element is
,M
ANw ii
i [2]
and the stopping power dE/dx for the compound is given by
.11
ii i
idx
dEw
dx
dE
[3]

21
Boltzmann transport analysis entails numerical solution of the linearized
Boltzmann transport equation, which is a simplified version of the general Boltzmann
transport equation. The linearized equation uses the straight-ahead approximation, where
all primary and secondary particles propagate in the same direction, and the transport
equation is reduced to a single spatial dimension (Singleterry et al., 2010). This is known
to overestimate transmitted flux, and hence adds conservatism to shielding analysis
(Shavers, Cucinotta, and Wilson, 2001). In addition, the analysis uses the continuous
slowing down approximation, where many interactions occur per unit path length,
allowing the slowing down to be modeled as a continuous process (Singleterry et al.,
2010).
The linearized Boltzmann transport equation is solved numerically to obtain the
flux j(x,E) of type j particles of kinetic energy E at depth x in a material. The equation
contains the macroscopic nuclear absorption cross section j(E) of a type j particle, and
the macroscopic differential cross section jk(E’,E) for fragmentation of a type k particle
with kinetic energy E’ producing a type j particle with kinetic energy E. For a type j
particle of atomic mass number Aj with stopping power Sj(E), the linearized Boltzmann
transport equation is
,),(),(),()()(1
EdExEEExEESEAx
k
kE
jkjjj
j
[4]
with boundary condition j(0,E) = fj(E), where fj(E) is a known function over a broad
energy spectrum. The radiation environment selected for the analysis is set as the
boundary condition. The left hand side of equation [4] accounts for continuous slowing
down of ion projectiles, and the right hand side accounts for nucleons emerging from

22
collisions of heavy ions with target nuclei in the material (Shavers, Cucinotta, and
Wilson, 2001). The term on the left hand side containing the energy derivative of
stopping power is the continuous slowing down operator. It represents the rate at which
charged particles lose energy due to atomic interactions with target material (Slaba et al.,
2010).
Ray-By-Ray Analysis
The radiation environments inside the ILMH, PER, and space suits were
computed by solving the linearized Boltzmann transport equation ray-by-ray. This
method consists of modeling the radiation shield as a three-dimensional thickness
distribution of shielding materials. The thickness distribution is a family of rays centered
at a target point inside the ILMH, PER, or space suit. The rays are nearly evenly
distributed over steradians, with all rays covering approximately equal amounts of
solid angle. Each ray is accompanied by an opposite ray. The number of rays is
determined by the complexity of the shielding geometry. Each ray crosses layers of
shielding materials. For each ray, the thicknesses of shielding materials are identified in
order from the outside in. A historical SPE or CGR environment is specified as the
boundary condition. An intricate computer code solves the Boltzmann equation along
each ray, transporting radiation through the shielding from the outside in, beginning with
the boundary condition and proceeding in a straight-ahead direction to the target point,
with continuous slowing down. All rays are integrated to compute flux at the target
point. Finally, responses are computed from the flux at the target point. The responses
of most interest are differential and integral LET distributions, dose, and dose equivalent
at the target point.

23
Computational Tools
We performed computations using state of the art space radiation transport codes
developed and validated by NASA over several years. Radiation transport codes
simulate atomic and nuclear interactions of nuclear particles passing through matter,
including nuclear fragmentation and production of lighter secondary nuclear particles
(e.g. protons, neutrons, and alpha particles) (Cucinotta et al., 2013). The Boltzmann
equation considers atomic and nuclear reactions during the propagation of source ions
arriving at a boundary. Solutions yield estimates of particle flux, energies, and
penetration depth of different ion species (Cucinotta et al., 2004). As particles cross a
small volume of material, the change in particle flux is balanced with gains and losses
from nuclear collisions (Borggräfe, Quatmann, and Nölke, 2009). The investigations of
this thesis used the HZETRN and NUCFRG3 computer codes.
HZETRN (High Charge [Z] and Energy Transport) is a deterministic code for
analysis of proton and heavy ion transport in media, developed by the NASA Langley
Research Center (LaRC). The transport algorithms solve numerically the linearized
Boltzmann transport equation using Bethe-Bloch theory, and the straight-ahead and
continuous slowing down approximations (Borggräfe, Quatmann, and Nölke, 2009), with
calculation of stopping powers and residual ranges. HZETRN accounts for primary and
secondary particles, including nuclear target fragments. The code calculates charged
particle energy spectra at predefined positions in a material layer, radiation fields behind
shielding materials, and dosimetric quantities (De Angelis et al., 2007). HZETRN
simulates the radiation shielding response of a material subject to exposure from large

24
SPE, GCR, the LEO environment, free space, and geomagnetically trapped proton and
electron fields (Badavi, Wilson, and Hunter, 2011).
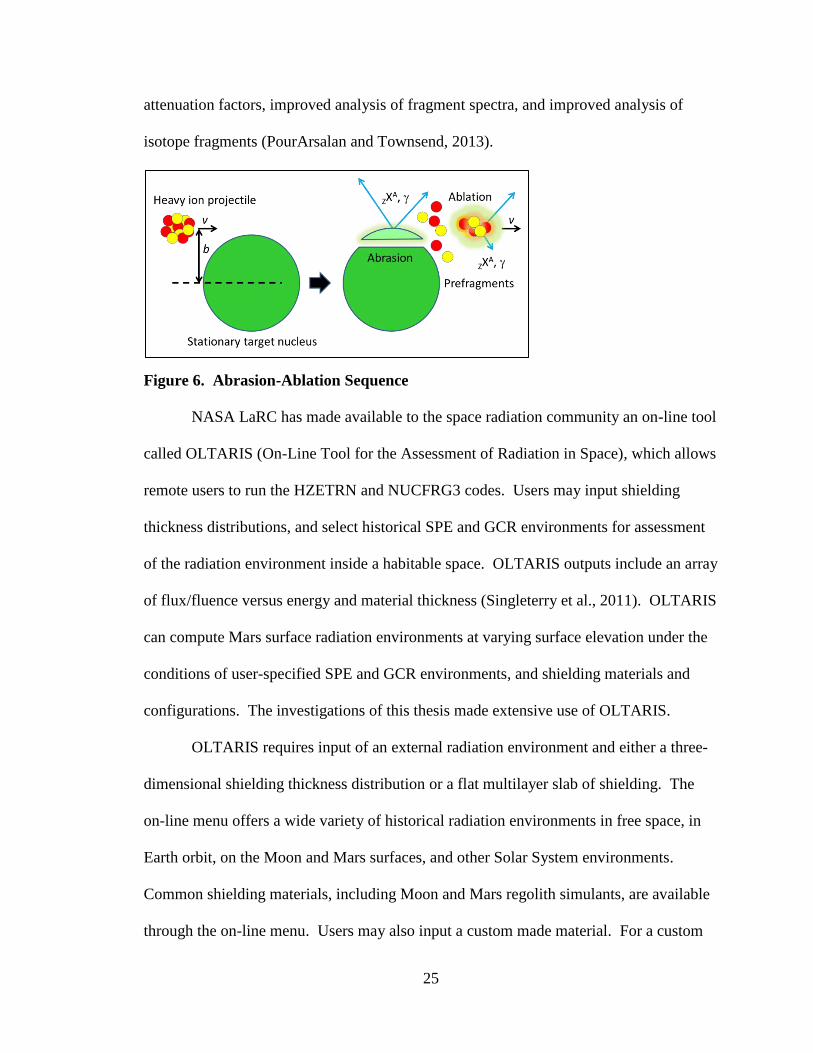
NUCFRG3 (Nuclear Fragmentation 3) is a semi empirical, geometric, classical
nuclear fragmentation analysis code developed by NASA LaRC for analysis of heavy ion
collisions. It uses the abrasion-ablation model of heavy ion fragmentation to estimate
cross sections for production of isotopes. According to this model, projectile
fragmentation occurs in three steps. First, a projectile ion approaches a stationary target
nucleus at velocity v and impact parameter b and a piece is sheared off (abraded) by
collision with the nucleus. Nucleons are knocked out of the projectile, leaving an excited
prefragment nucleus, which is assumed to move in the same direction as the projectile, at
the same velocity. Nucleons are also ejected from the struck target nucleus, emerging at
relatively low energy, and hence are not transported further in this model. Next, the
prefragment decays (ablates) by emission of energetic isotopes and -rays. Third, the
emerging particles interact in the final state. NUCFRG3 computes production cross
sections of these emerging particles for input into HZETRN (Wilson et al., 1991; Shinn
and Wilson, 1992; Townsend, Cucinotta, and Heilbronn, 2002). Figure 6 illustrates the
abrasion-ablation sequence. The model is geometric in the sense that the abrasion-
ablation process is determined from the relative impact parameter of colliding spherical
nuclei. NUCFRG3 computes trajectories and nuclear attenuation factors, and analyzes
fragment spectra. Researchers have used it to generate a large nuclear database for the
study of high charge and energy ion beams, radiation physics, and GCR shielding. The
latest version has a Coulomb trajectory correction, improved treatment of nuclear
25
attenuation factors, improved analysis of fragment spectra, and improved analysis of
isotope fragments (PourArsalan and Townsend, 2013).
Figure 6. Abrasion-Ablation Sequence
NASA LaRC has made available to the space radiation community an on-line tool
called OLTARIS (On-Line Tool for the Assessment of Radiation in Space), which allows
remote users to run the HZETRN and NUCFRG3 codes. Users may input shielding
thickness distributions, and select historical SPE and GCR environments for assessment
of the radiation environment inside a habitable space. OLTARIS outputs include an array
of flux/fluence versus energy and material thickness (Singleterry et al., 2011). OLTARIS
can compute Mars surface radiation environments at varying surface elevation under the
conditions of user-specified SPE and GCR environments, and shielding materials and
configurations. The investigations of this thesis made extensive use of OLTARIS.
OLTARIS requires input of an external radiation environment and either a three-
dimensional shielding thickness distribution or a flat multilayer slab of shielding. The
on-line menu offers a wide variety of historical radiation environments in free space, in
Earth orbit, on the Moon and Mars surfaces, and other Solar System environments.
Common shielding materials, including Moon and Mars regolith simulants, are available
through the on-line menu. Users may also input a custom made material. For a custom

26
material, OLTARIS must first generate a database of nuclear reaction cross sections, for
subsequent input into a radiation transport analysis code.
Figure 7. Radiation Attenuation by Equal Masses of Material
Selection of Materials for Shielding Analysis
We examined use of liquid hydrogen, water, graphite epoxy 51-49, polyethylene,
and Mars regolith as shielding materials. A preliminary assessment compared the
shielding effectiveness of these five materials to aluminum, using HZETRN and
NUCFRG3. (Appendix A shows the compositions of the materials). Figure 7 shows
HZETRN results for radiation attenuation by equal masses of these six materials in the
1977 solar minimum GCR environment at 1 AU. The curves indicate that liquid
050
100150200250300350400450500550600650700750800850
0 5 10 15 20 25 30 35 40 45 50
Do
se E
qu
ival
ent,
mSv
Areal Density, g/cm2
Radiation Attenuation by Equal Masses of Material Planar Incidence on Slab
365 Days of 1977 Solar Min GCR
Aluminum
Polyethylene
Graphite epoxy 51-49
Water
Liquid hydrogen
Mars regolith

27
hydrogen is the strongest attenuator by mass, whereas aluminum is the weakest. Figure 8
shows HZETRN results for radiation attenuation by equal volumes of these materials in
the same environment. The curves indicate that aluminum is the strongest attenuator up
to a thickness of about 15 cm, and polyethylene is the strongest above 15 cm. Liquid
hydrogen is the weakest attenuator by volume. In both figures, the attenuation
effectiveness of polyethylene, graphite epoxy 51-49, and water are close. Liquid
hydrogen is an excellent attenuator by mass, but it is very poor by volume. In addition, it
requires large storage tanks due to its low density, and also requires substantial cryogenic
equipment, and hence was not selected. Water is an excellent attenuator. However, it
requires a containment vessel with temperature control over a wide range, and hence was
not selected. Graphite epoxy 51-49 and polyethylene have similar radiation attenuation
properties, with polyethylene somewhat superior by mass and volume. They require
much less supporting hardware than liquid hydrogen or water. If the shielding is installed
along the exterior of the ILMH roof and walls, it does not occupy volume inside the
habitable space; hence volume efficiency becomes a lesser consideration than mass
efficiency. Polyethylene represents the best overall compromise between the desirable,
though somewhat competing attributes of attenuation of high-energy source ions and
secondary particles, mass efficiency, volume efficiency, being a light material that
reduces production of secondary particles, hydrogen-rich content, and high number of
electrons per unit mass. Hence, polyethylene was selected as the primary shielding
material for detailed analysis of the ILMH. Mars regolith was selected as a secondary
shielding material, to allow exploitation of this planetary resource available in situ, in
case results indicate massive shielding is required.

28
Figure 8. Radiation Attenuation by Equal Volumes of Material
Selection of Radiation Environments for Analysis
Historically severe SPE and GCR environments were selected for assessment of
acute and prolonged exposure. We did not consider the contribution from solar wind
particles, due to their vastly lower energies and hence vastly lower penetration depth. We
selected environments that represent worst cases, and hence add conservatism to the
analysis.
The 23 February 1956 solar flare was selected for analysis of acute exposure. It
remains the largest SPE ever observed. It was found to have a prompt component of
0
100
200
300
400
500
600
700
800
900
0 5 10 15 20 25 30 35 40 45 50
Do
se E
qu
ival
ent,
mSv
Shielding Thickness, cm
Radiation Attenuation by Equal Volumes of Material Planar Incidence on Slab
365 Days of 1977 Solar Min GCR
Aluminum
Polyethylene
Graphite epoxy 51-49
Water
Liquid hydrogen
Mars regolith

29
short duration, strong anisotropy, and exponential energy spectrum; and a delayed
component that was less anisotropic, with a power law spectrum (Vashenyuk, Balabin,
and Miroshnichenko, 2008). It delivered its total dose within hours, and is believed to
have delivered its peak intensity within 30 minutes of the start of the event, according to
data gathered by a ground network of cosmic ray sensors. This SPE qualifies as a worst
case event for analysis of acute exposure. We used the NASA LaRC model of this event.
For analysis of acute radiation exposure inside the ILMH and PER, we added 24 hours of
GCR exposure to solar flare exposure, assuming a solar flare may occur while the crew is
inside the ILMH or PER. Similarly, for analysis of acute exposure inside a space suit
during surface EVA, we added eight hours of background GCR to solar flare exposure.
The GCR environment during the 1977 solar minimum was selected for analysis
of prolonged exposure. This environment represents a case of maximum spectral
intensities, and hence qualifies as a worst case environment for analysis of prolonged
exposure (Badavi, Wilson, and Hunter, 2011). We used the Badhwar-O’Neill 2010 (BO
2010) model of this GCR environment. The BO 2010 GCR environments are accurate to
within 10% (OLTARIS, 2015). For analysis of radiation environments inside the ILMH,
we assumed a solar flare could occur during an extended stay, and we added solar flare
exposure to the background GCR for the selected time intervals.
In addition to SPE and GCR environments, a Mars atmospheric model must also
be selected to compute thickness of the atmosphere as a function of surface elevation.
These investigations used Mars-GRAM 2001 (De Angelis et al., 2004). Surface
elevation is the only parameter input into the Mars-GRAM model. The approximate
atmospheric composition is listed in Appendix A.

30
Model of Inflatable Lunar-Martian Habitat
The ILMH was modeled as a hollow rectangular box with no internal radiation
shielding, of length L, width W, and height H, as shown in Figure 9. The box has a layer
of shielding material covering the exterior of the box, over the roof and along the four
sides, within the inflatable volume. The floor does not have a layer of shielding, relying
on the planetary body to provide shielding from the floor direction. The shielding layer
has a uniform thickness t. The origin of the coordinate system is at the center of the box,
with the x axis pointing in the zenith direction, and the y-z plane parallel to the planetary
surface. For most of the analyses, the target point is at the origin. The direction cosines
of all the rays must be specified in the thickness distribution. All rays cross a face of the
box and converge at the target point. For each ray, a thickness is assigned at the point of
crossing and entered into the thickness distribution file. Each ray crosses a plane that is
parallel to the x-y, y-z, or x-z plane, at angle , , or with respect to the normal of the
planes, respectively. The direction cosines are cos cos and cos respectively. The
thicknesses at the face crossings, and hence the thicknesses specified in the thickness
distribution, are, respectively,
. , , ,cos
t
t [5]
For computational purposes, the planetary body is represented by a very thick and
massive layer of regolith immediately below the ILMH. The HZETRN algorithms
accessible through OLTARIS use a default areal density of 300 g/cm2 of Mars regolith
simulant to represent shielding provided by the Mars planetary body (OLTARIS, 2015c).

31
Figure 9. ILMH Box
A suitable number of rays had to be selected to develop the shielding thickness
distributions. A convergence test indicated whether the number of rays is sufficient for
the particular geometry. While it is important to select sufficient rays to capture the
varying geometry of the ILMH, it is also important to minimize the number of rays, to
facilitate generation of thickness distribution files and to reduce computer run time. We
started with the lowest number of rays that could represent a geometric figure with six
faces, and then increased the number of rays, maintaining almost even solid angle
spacing between rays, until dose calculations converged. We ran a simple convergence
test with a 5 g/cm2 layer of polyethylene over the roof and around the four walls, with no
polyethylene shielding of the floor. The target point was the center of the box. Shielding
thickness distributions were generated for 6, 26, and 42 rays centered at the target point.
The February 1956 solar flare and 1977 solar minimum GCR were selected as radiation
environments on Mars at surface elevation of 0 km. Figures 10a, b, and c show the
geometry of trial thickness distributions for 6, 26, and 42 rays, respectively. The figures
show the case of the February 1956 solar flare, with the color range of red to blue

32
indicating directions from more intense to less intense radiation, respectively. The almost
solid blue in the lower half of the geometry results from shielding provided by the Mars
body. The y-z plane is the Mars surface, and the x-axis points in the zenith direction.
With a sufficient number of rays, the geometry should resemble a geodesic sphere.
Figure 10. Trial Thickness Distributions
Figure 11a shows the results of the convergence test for the February 1956 solar
flare, and Figure 11b shows the results for the 1977 solar minimum GCR. The plots
show dose equivalent at the target point vs. number of rays. In both cases, a logarithmic
trend line indicates convergence at 42 rays. Consequently, we decided to develop 42-ray
shielding thickness distributions for the ILMH, with selected shielding materials and
thicknesses at the intersections of rays with layers of shielding.

33
Figure 11. Convergence Test for Number of Rays. February 1956 solar flare (a) and
365 days of 1977 solar min GCR (b).
Model of Pressurized Electric Rover
The PER was modeled as a hollow polyhedron with no internal shielding. This is
a very simple model, with no accounting for internal structures and hardware, cupolas, or
suitports. The roof, port, starboard, bow, and stern sides are composed of fiberglass
epoxy, except for windows, and a graphite epoxy hatch on the port side. The floor is
aluminum. The origin of the coordinate system is at the center of the polyhedron,
y = 18.712ln(x) + 41.248 R² = 0.9904
0
20
40
60
80
100
120
0 5 10 15 20 25 30 35 40 45
Do
se E
qu
ival
ent,
mSv
Number of Rays
(a) Convergence Test for Number of Rays - SPE Februray 1956 Solar Flare on Mars at 0 km
Computed Dose Equivalent
Log. (Computed DoseEquivalent)
y = 24.415ln(x) + 62.068 R² = 0.9634
0
20
40
60
80
100
120
140
160
180
0 5 10 15 20 25 30 35 40 45
Do
se E
qu
ival
ent,
mSv
Number of Rays
(b) Convergence Test for Number of Rays - GCR 365 Days of 1977 Solar Min GCR on Mars at 0 km
Computed Dose Equivalent
Log. (Computed DoseEquivalent)

34
midway between the roof and floor, the port and starboard sides, and the stern and bow.
The axes are defined the same as for the ILMH. Target points were selected in the
cockpit and sleep areas of the PER. Material properties are listed in Table 2. Windows
are represented as openings in the faces, with zero shielding thickness.
Table 2. PER Materials
Material Density (g/cm
3) Thickness (cm) Areal Density
(g/cm2)
PER Face(s)
Fiberglass
epoxy
1.95 0.7 1.365 Roof, port, starboard, bow,
and stern
Aluminum 2.7 0.8 2.16 Floor
Graphite epoxy 1.48 0.7 1.036 Port hatch
For fiberglass composition, we selected S-glass fiber developed for aerospace
applications, with C21H25ClO5 epoxy resin, at fiber-to-resin ratio of 67:33 (Carbon Fiber
Tube Shop, 2014; Ceramic Industry, 2014; NIH, 2014). The composition is shown in
Appendix A.
Thickness distributions of 42 rays were developed for each target point. At points
where rays cross surfaces that are parallel to the x-y, y-z, or x-z planes, shielding
thicknesses were calculated using equation [5], as for the ILMH. For a ray R that crosses
the oblique surface at the bow, indicated in Figure 12, the direction cosine (cos and
thickness (t’) are calculated from the coordinates of corner points S1(x1,y1,z1), S2(x2,y2,z2),
S3(x3,y3,z3), the point P(x,y,z) where the ray crosses a plane that is normal to an axis, and
target point coordinates T(xt,yt,zt). The thickness t’ was calculated from equations [6]
through [10].
,13 SSa
[6]
,12 SSb
[7]
,PTR
[8]

35
,)(
cosbaR
baR
[9]
.cos
tt [10]
Figure 12. Geometry of Ray Crossing Oblique Bow Surface of PER
Model of Space Suits
Modeling of space suits for radiation transport is difficult due to their complicated
and varying geometries, and variety of materials. We used an approach similar to the
investigations of Townsend and colleagues. They used the simplified geometry of a
hemispherical structure at a realistic shielding areal density, seated on the Mars surface,
with the astronaut at the center (Townsend et al., 2013). We modeled the suit as 42-ray
geodesic spheres of Mylar, with a thickness of zero assigned to all rays pointing toward

36
the surface, effectively replicating a hemisphere. To all rays pointing up from or parallel
to the surface we assigned a constant thickness.
Test Series
Inflatable Lunar-Martian Habitat
We analyzed the ILMH to assess its capability to protect from both acute and
prolonged exposure, and to assess its adequacy as the primary radiation storm shelter.
The goal is to compare computed dose equivalents with permissible exposure levels
(NASA, 2009; THREE, 2014). For the ILMH, the environment for acute exposure was
defined as the February 1956 solar flare combined with one day of 1977 solar minimum
GCR. Prolonged exposure was defined as the February 1956 solar flare combined with
30 or 365 days of 1977 solar minimum GCR. The time intervals of 1, 30, and 365 days
were selected to correspond with permissible exposure limits for acute, 30 day, and
annual exposure, for comparison of doses. For separate dose equivalents HS due to one
SPE and HG due to one year of GCR, we defined the total dose equivalent Hn for n days
at Mars surface elevation h as
).(365
)()( hHn
hHhH GSn [11]
We also computed external (unshielded) radiation environments over the surface
elevation range for comparison of doses behind shielding to external doses. External
environments were computed by performing radiation transport through a dummy shield
of thickness zero at every point where a ray crosses the shield.
We developed a test series based on a strategy that first examines the
effectiveness of light polyethylene shielding over the full Mars surface elevation range,
and then doubles and triples the shielding as required. If tripling of the shielding is not

37
adequate, then we change to an approach of using layers of Mars regolith. This offers
payload mass and volume savings associated with not having to transport massive
shielding to Mars, and also offers the opportunity to exploit a planetary resource available
in situ. The test series encompasses Mars surface elevations over a -10 to 30 km range in
increments of 1 km, at shielding configurations of 5, 10, and 15 g/cm2 polyethylene, and
of 1 and 2m of Mars regolith. The external radiation environment is the February 1956
solar flare combined with n days (n = 1, 30, 365) of 1977 solar minimum GCR. The
target point is the geometric center of the ILMH box.
We examined dose sensitivity to target point translation. Since there is no internal
shielding inside the ILMH, there should be minimal variation in dose as the target point is
translated inside the ILMH. We modified the 42-ray geodesic for 5 g/cm2 of
polyethylene over the roof and around the four walls, to account for some intersection
points of rays with shielding moving from face to face during target point translation,
crossing the shielding at different angles and thicknesses. We performed vertical and
horizontal sensitivity tests. The vertical test consisted of translating the target point
vertically from the center of the ILMH to the floor and roof, in the radiation environment
of the 1977 solar minimum GCR at Mars surface elevation of 0 km. The dose equivalent
varied from the center value by less than 3.5%. The horizontal test consisted of
translating the target point horizontally from the center of the ILMH to one end along the
long dimension, in the same radiation environment. The dose equivalent varied from the
center value by less than 3.2%. We attributed any small changes in dose equivalent to
minor changes in the thickness distribution resulting from re-centering of the rays at the

38
new target point, and we consider the variations to be insignificant. For a finite number
of rays, there will be some inevitable variability.
Pressurized Electric Rover
We selected target points in the cockpit and sleep areas, where astronauts are
likely to dwell for extended periods. In the cockpit, we selected two points centered
behind the front and side windows at the port and starboard sides, at about where driver
and passenger heads would be located, respectively. The target points in the cockpit
should indicate maximum radiation exposure due to unshielded windows. For the sleep
area, the goal was to find evidence of spatial variation in the internal radiation
environment, in order to support recommendations for optimum arrangement of the sleep
area to reduce radiation exposure. We selected five points evenly distributed over the
length of port and starboard hammocks installed in the lower aft area of the PER, parallel
to the bow-to-stern direction. The target points in the sleep area are lower in height,
farther from the windows, and hence somewhat less exposed. The even distribution of
target points in the sleep area over the bow-to-stern direction should indicate dose
variation between the relatively unshielded space in the cockpit and the more shielded
stern of the PER.
Figure 13 shows the locations of target points along the PER port side (a) and
bow (b). Target points on the starboard side are arranged symmetrically to points on the
port side. Figure 13a is a port view. It shows rays coming from the port direction
converging on the cockpit target point where the head of the driver is located. Figure 13b
is a front view. It shows the cockpit target points where passenger and driver heads are
located, and the front ends of the rows of port and starboard hammock target points. As

39
for the ILMH, we centered shielding thickness distributions of 42 rays at each target
point.
Figure 13. PER Target Points. Port Side (a) and Bow (b)
-50
-25
0
25
50
-100 -75 -50 -25 0 25 50 75 100
x, in
ches
z, inches
(a) PER Target Points (Port) Cockpit Point and Hammock Points 1 through 5, Left to Right
Target points
Port rays
-50
-40
-30
-20
-10
0
10
20
30
40
50
-40 -30 -20 -10 0 10 20 30 40
x, in
che
s
y, inches
(b) PER Target Points (Bow) Cockpit Points and Starboard and Port Hammocks
Passenger and driverheads
Hammock rows

40
Table 3 shows the coordinates of the selected target points. The x-axis points
toward zenith (floor-to-roof direction), the y-axis points in the starboard-to-port direction,
and the z-axis points in the bow-to-stern direction.
Table 3. PER Target Points (coordinates refer to Figure 13)
Target Point x (inches) y (inches) z (inches)
Port cockpit 16 10 -43
Port hammock 1 -18 17 13.3
Port hammock 2 -18 17 29.55
Port hammock 3 -18 17 45.8
Port hammock 4 -18 17 62.05
Port hammock 5 -18 17 78.3
Starboard cockpit 16 -10 -43
Starboard hammock 1 -18 -17 13.3
Starboard hammock 2 -18 -17 29.55
Starboard hammock 3 -18 -17 45.8
Starboard hammock 4 -18 -17 62.05
Starboard hammock 5 -18 -17 78.3
We assumed a generic surface roving trip could last up to 24 hours, and that an
SPE could occur during the 24 hour interval (under background GCR), when the PER
and astronauts are far from the protection of the ILMH. The time interval of 24 hours is
driven by the limited electric power provided by the PER battery. Since we are interested
in acute exposure inside the PER, we selected the February 1956 solar flare and one Earth
day of 1977 solar minimum GCR as the external radiation environment, over a surface
elevation range of -10 to 30 km. The external PER SPE environment at surface elevation
is the same as the external ILMH SPE environment at the same elevation. The external
PER GCR environment was obtained by adjusting the external ILMH GCR environment
for the difference in duration of exposure inside the PER.
In anticipation of very little radiation attenuation by the thin PER structure, we
developed a test series for an alternative heavy rover, to emphasize sensitivity to
shielding thickness. Shielding was increased by almost a factor of four across all

41
surfaces. Table 4 shows the shielding thicknesses and areal densities for the heavy rover.
The target points are the same for the baseline and heavy rover.
Table 4. Materials for Heavy PER
Material Density (g/cm
3) Thickness (cm) Areal Density
(g/cm2)
PER Face(s)
Fiberglass
epoxy
1.95 2.7 5.265 Roof, port, starboard, bow,
and stern
Aluminum 2.7 2.7 7.29 Floor
Graphite epoxy 1.48 2.7 3.996 Port hatch
Space Suits
We evaluated the space suit radiation environment at Mylar thicknesses of 50 and
500 microns (areal densities of 0.00665 and 0.0665 g/cm2, respectively). Appendix A
shows the composition of Mylar that we used (GESTIS, 2014; Polymer Processing,
2014). For an astronaut performing EVA for up to 8 hours outside the protection of a
shelter, the environment for acute exposure was defined as the February 1956 solar flare
combined with 8 hours (0.3333 days) of 1977 solar minimum CGR. We computed dose
equivalent at the center of the Mylar hemisphere for acute exposure over a surface
elevation range from -10 to 30 km. The external space suit SPE environment at surface
elevation is the same as the external ILMH SPE environment at the same elevation. The
external space suit GCR environment was obtained by adjusting the external ILMH GCR
environment for the difference in duration of exposure inside the space suit.
Surface Scenarios
We estimated total astronaut exposure to ionizing radiation for three surface
scenarios with a stay of one Earth year. A minimal scenario entails exposure in a
relatively benign radiation environment. An intermediate scenario entails moderate
exposure, and is more likely to resemble operational conditions on Mars. An extreme

42
scenario entails exposure under worst conditions, possibly leading to acute radiation
syndrome (ARS). For each scenario, we defined the external environment for acute
exposure as the February 1956 solar flare combined with one Earth day of background
1977 solar minimum GCR. In all three scenarios, the only protection from radiation is
provided by either the ILMH shielding, PER shell, or space suit fabric.
In the minimal scenario, the ILMH is deployed at 0 km surface elevation, with a 5
g/cm2 areal density layer of polyethylene over the roof and around the four walls, but not
the floor. The external environment for the ILMH consists of the February 1956 solar
flare and 1977 solar minimum GCR, where the duration of GCR exposure equals the
estimated dwell time inside the ILMH. The flare occurs while the astronaut is inside the
ILMH. During PER roving, the external radiation environment is background 1977 solar
minimum GCR for the duration of dwell time inside the PER at surface elevation. For
PER dwells we used dose equivalent at the port cockpit target point for conservatism.
During EVA, the astronaut will wear a space suit made of Mylar fabric of 500 microns
thickness. The external radiation environment during EVA is background 1977 solar
minimum GCR for the duration of EVA at surface elevation. Local EVAs of 3 hours
duration occur at 0 km elevation, in the immediate vicinity of the ILMH. Short and long
excursions of PER roving occur over a surface elevation range of -4 to 4 km. Short
excursions last 24 hours, of which 8 are inside the PER and 16 are EVA. Long
excursions last 72 hours, of which 24 are inside the PER and 48 are EVA. In a typical
month, an astronaut performs 25 local EVAs, two short roving excursions, and one long
roving excursion. Dwell times during excursions are evenly distributed over the surface
elevation range. Hence, the external radiation environment during excursions is just the

43
average background GCR environment over -4 to 4 km, for the duration of the excursion,
accounting separately for time inside the PER, and time outside the PER while wearing a
space suit (Rygalov, 2015, private communication).
Table 5 is a summary of surface activities under the minimal scenario. It
combines short and long excursion PER dwells, and combines short and long excursion
EVAs. (A more detailed summary of the minimal surface scenario is provided in
Appendix C.) For each activity we calculated dose equivalent inside the ILMH, PER, or
space suit, given the external radiation environment and total duration of the activity, and
then added dose equivalents of all activities to obtain total dose equivalent for the 365
day surface stay.
In the intermediate scenario, the solar flare occurs during EVA at 4 km elevation,
instead of while inside the ILMH. Otherwise, conditions are the same as for the minimal
scenario (Rygalov, 2015, private communication).
An extreme scenario was developed to determine if exposures approach the level
of ARS. The threshold for ARS is about 700 mGy, delivered over a short time interval,
usually minutes (CDC, 2015). When radiobiological effectiveness is accounted for, a
dose equivalent of about 1000 mSv would put the astronaut at elevated risk for onset of
ARS.
The extreme scenario includes a 10 day climbing expedition up to 30 km
elevation, with intermediate base camps along the way. The solar flare occurs during
EVA between 24 and 30 km elevation, instead of while inside the ILMH (Rygalov, 2015,
private communication). Table 6 shows the activities and environments of the climbing
expedition.

44
Table 5. Minimal Surface Scenario
Table 6. Climbing Expedition
Aside from the climbing expedition, the extreme scenario is similar to the
minimal scenario. For 11 of the 12 months, the extreme scenario consists of the same
activities and environments as the minimal scenario, but with no solar flare while inside
the ILMH. During the remaining month, the astronaut performs only 10 local EVAs, and
does not perform any short or long excursion roving, but performs the 10 day climb
Surface
Activity
Radiation
Shielding
Total
Duration
(Days)
External Radiation Environment
Local EVA 500 microns
thick Mylar
space suit
37.5 1977 solar min GCR at 0 km
Excursion
EVAs
500 microns
thick Mylar
space suit
40 Average 1977 solar min GCR from
-4 to 4 km
Excursion
PER dwells
PER structure 20 Average 1977 solar min GCR from
-4 to 4 km
ILMH dwell 5 g/cm2
polyethylene
267.5 February 1956 solar flare and 1977
solar min GCR at 0 km
Surface
Activity
Radiation
Shielding
Total
Duration
(Days)
External Radiation Environment
Excursion
PER dwells
from 0 to 6
km
PER structure 3 Average 1977 solar min GCR from
0 to 6 km
Excursion
PER dwells
from 6 to 12
km
PER structure 2 Average 1977 solar min GCR from
6 to 12 km
Excursion
EVAs from
12 to 18 km
500 microns
thick Mylar
space suit
2 Average 1977 solar min GCR from
12 to 18 km
Excursion
EVAs from
18 to 24 km
500 microns
thick Mylar
space suit
2 Average 1977 solar min GCR from
18 to 24 km
Excursion
EVAs from
24 to 30 km
500 microns
thick Mylar
space suit
1 February 1956 solar flare and
average 1977 solar min GCR from
24 to 30 km

45
instead, under background GCR over the elevation range, and under a solar flare in the
upper 6 km of the range.
Conservatism of the Methods
The methods used in these investigations have conservatism. The straight-ahead
approximation used in the radiation transport codes is known to overestimate transmitted
flux. The selected radiation environments of severe SPE and intense GCR are
countercyclical, in that severe SPEs generally occur during periods of maximum solar
activity, when that very same activity modulates GCR in the Solar System. Conversely,
intense GCR generally occurs during periods of minimum solar activity, when there is
less modulation of GCR by solar activity. It is not likely that a historically severe solar
flare such as the February 1956 event will occur during a period of low solar activity,
such as during the 1977 solar minimum, when GCR was relatively high. However, we
found it advisable to consider a worst case, as several other space radiation researchers
did.
These investigations combined historically severe radiation environments,
conservatism of the analytical methods, state of the art radiation transport codes,
accounting for neutron backscatter, and ray-by-ray transport, using the most current Mars
atmosphere model available through OLTARIS. This helps establish confidence that the
recommended shielding approaches for the ILMH and PER are adequate to protect
astronauts from ionizing radiation in the Mars surface environment.

46
CHAPTER III
RESULTS
Inflatable Lunar-Martian Habitat
Figures 14 and 15 show plots of dose equivalent vs. surface elevation due to SPE
and GCR, respectively. The figures show the external environment, and the internal
environments under 5, 10, and 15 g/cm2 of polyethylene, and under 1 and 2m of Mars
regolith, over a surface elevation range of -10 to 30 km.
Figure 14. Dose Equivalent inside ILMH for February 1956 Solar Flare
0
100
200
300
400
500
600
700
800
900
1000
1100
1200
1300
1400
1500
-10 -5 0 5 10 15 20 25 30
Do
se E
qu
ival
ent,
mSv
Elevation, km
Dose Equivalent inside ILMH February 1956 Solar Flare
External environment
5 g/cm2 (5 cm)polyethylene
10 g/cm2 (10 cm)polyethylene
15 g/cm2 (15 cm)polyethylene
170 g/cm2 (1m) Marsregolith
340 g/cm2 (2m) Marsregolith

47
Figure 15. Dose Equivalent inside ILMH for 365 Days of 1977 Solar Min GCR
Figures 16 through 24 show dose equivalent inside the ILMH under polyethylene
shielding for the combined SPE and GCR environments over a surface elevation range of
-10 to 30 km. Figures 16, 17, and 18 show dose equivalent at 5 g/cm2 for acute, 30 day,
and 365 day exposure, respectively. Figures 19, 20, and 21 show dose equivalent at 10
g/cm2 for acute, 30 day, and 365 day exposure, respectively. Figures 22, 23, and 24 show
dose equivalent at 15 g/cm2 for acute, 30 day, and 365 day exposure, respectively.
Figures 16, 19, and 22 indicate the GCR contribution to acute exposure is minimal
compared to the SPE contribution. Figures 17, 20, and 23 indicate the SPE contribution
0255075
100125150175200225250275300325350375400425450
-10 -5 0 5 10 15 20 25 30
Do
se E
qu
ival
ent,
mSv
Elevation, km
Dose Equivalent inside ILMH 365 Days of 1977 Solar Min GCR
External environment
5 g/cm2 (5 cm)polyethylene
10 g/cm2 (10 cm)polyethylene
15 g/cm2 (15 cm)polyethylene
170 g/cm2 (1m) Marsregolith
340 g/cm2 (2m) Marsregolith

48
is dominant for 30 day exposure. Figures 18, 21, and 24 indicate the GCR contribution
exceeds the SPE contribution for 365 day exposure.
Figure 16. Acute Exposure inside ILMH – 5 g/cm2 Polyethylene Shielding
Figure 17. 30 Day Exposure inside ILMH – 5 g/cm2 Polyethylene Shielding
0255075
100125150175200225250275
-10 -5 0 5 10 15 20 25 30
Do
se E
qu
ival
ent,
mSv
Elevation, km
Acute Exposure inside ILMH - 5 g/cm2 Polyethylene Shielding February 1956 Solar Flare and 1 Day of 1977 Solar Min GCR
Total exposure
SPE exposure
GCR exposure
0255075
100125150175200225250275300
-10 -5 0 5 10 15 20 25 30
Do
se E
qu
ival
ent,
mSv
Elevation, km
30 Day Exposure inside ILMH - 5 g/cm2 Polyethylene Shielding February 1956 Solar Flare and 30 Days of 1977 Solar Min GCR
Total exposure
SPE exposure
GCR exposure

49
Figure 18. 365 Day Exposure inside ILMH – 5 g/cm2 Polyethylene Shielding
Figure 19. Acute Exposure inside ILMH – 10 g/cm2 Polyethylene Shielding
0
50
100
150
200
250
300
350
400
450
500
550
-10 -5 0 5 10 15 20 25 30
Do
se E
qu
ival
ent,
mSv
Elevation, km
365 Day Exposure inside ILMH - 5 g/cm2 Polyethylene Shielding February 1956 Solar Flare and 365 Days of 1977 Solar Min GCR
Total exposure
SPE exposure
GCR exposure
0
25
50
75
100
125
150
175
200
-10 -5 0 5 10 15 20 25 30
Do
se E
qu
ival
ent,
mSv
Elevation, km
Acute Exposure inside ILMH - 10 g/cm2 Polyethylene Shielding February 1956 Solar Flare and 1 Day of 1977 Solar Min GCR
Total exposure
SPE exposure
GCR exposure

50
Figure 20. 30 Day Exposure inside ILMH – 10 g/cm2 Polyethylene Shielding
Figure 21. 365 Day Exposure inside ILMH – 10 g/cm2 Polyethylene Shielding
0
25
50
75
100
125
150
175
200
225
-10 -5 0 5 10 15 20 25 30
Do
se E
qu
ival
ent,
mSv
Elevation, km
30 Day Exposure inside ILMH - 10 g/cm2 Polyethylene Shielding February 1956 Solar Flare and 30 Days of 1977 Solar Min GCR
Total exposure
SPE exposure
GCR exposure
0
50
100
150
200
250
300
350
400
450
-10 -5 0 5 10 15 20 25 30
Do
se E
qu
ival
ent,
mSv
Elevation, km
365 Day Exposure inside ILMH - 10 g/cm2 Polyethylene Shielding February 1956 Solar Flare and 365 Days of 1977 Solar Min GCR
Total exposure
SPE exposure
GCR exposure

51
Figure 22. Acute Exposure inside ILMH – 15 g/cm2 Polyethylene Shielding
Figure 23. 30 Day Exposure inside ILMH – 15 g/cm2 Polyethylene Shielding
0
20
40
60
80
100
120
140
160
180
-10 -5 0 5 10 15 20 25 30
Do
se E
qu
ival
ent,
mSv
Elevation, km
Acute Exposure inside ILMH - 15 g/cm2 Polyethylene Shielding February 1956 Solar Flare and 1 Day of 1977 Solar Min GCR
Total exposure
SPE exposure
GCR exposure
0
20
40
60
80
100
120
140
160
180
200
-10 -5 0 5 10 15 20 25 30
Do
se E
qu
ival
ent,
mSv
Elevation, km
30 Day Exposure inside ILMH - 15 g/cm2 Polyethylene Shielding February 1956 Solar Flare and 30 Days of 1977 Solar Min GCR
Total exposure
SPE exposure
GCR exposure

52
Figure 24. 365 Day Exposure inside ILMH – 15 g/cm2 Polyethylene Shielding
A better visualization of exposure levels is obtained by consolidating the
information from Figures 16 through 24 into three dimensional surface plots of acute, 30
day, and 365 day exposure, with all shielding thicknesses represented on each surface
plot. Contour plots can then be generated from the surface plots, to identify bands where
each shielding thickness meets permissible exposure limits. Figures 25, 26, and 27 are
surface plots of acute, 30 day, and 365 day exposure, respectively, in the external
environment and at 5, 10, and 15 g/cm2 of polyethylene shielding. The surface plots
indicate a relatively steep attenuation slope over the first 5 g/cm2 of polyethylene, with a
progressive leveling off up to 15 g/cm2. This illustrates the diminishing effectiveness of
greater shielding thickness. The plots suggest that addition of another 5 g/cm2 on top of
the 15 g/cm2 would produce only marginal reduction in dose.
0
50
100
150
200
250
300
350
-10 -5 0 5 10 15 20 25 30
Do
se E
qu
ival
ent,
mSv
Elevation, km
365 Day Exposure inside ILMH - 15 g/cm2 Polyethylene Shielding February 1956 Solar Flare and 365 Days of 1977 Solar Min GCR
Total exposure
SPE exposure
GCR exposure

53
Figure 25. Surface Plot of Acute Exposure inside ILMH – Polyethylene Shielding
-10
-5
0
5
10
15
20
25
30
0
100
200
300
400
500
600
700
800
900
1000
1100
1200
1300
1400
1500
0 5 10 15
Elevation, km
Do
se E
qu
ival
ent,
mSv
Areal Density, g/cm2
Acute Exposure inside ILMH - Polyethylene Shielding February 1956 Solar Flare and 1 Day of 1977 Solar Min GCR
0-100 100-200 200-300 300-400 400-500
500-600 600-700 700-800 800-900 900-1000
1000-1100 1100-1200 1200-1300 1300-1400 1400-1500

54
Figure 26. Surface Plot of 30 Day Exposure inside ILMH – Polyethylene Shielding
-10
-5
0
5
10
15
20
25
30
0
100
200
300
400
500
600
700
800
900
1000
1100
1200
1300
1400
1500
0 5 10 15
Elevation, km
Do
se E
qu
ival
ent,
mSv
Areal Density, g/cm2
30 Day Exposure inside ILMH - Polyethylene Shielding February 1956 Solar Flare and 30 Days of 1977 Solar Min GCR
0-100 100-200 200-300 300-400 400-500
500-600 600-700 700-800 800-900 900-1000
1000-1100 1100-1200 1200-1300 1300-1400 1400-1500

55
Figure 27. Surface Plot of 365 Day Exposure inside ILMH – Polyethylene Shielding
-10
-5
0
5
10
15
20
25
30
0
100
200
300
400
500
600
700
800
900
1000
1100
1200
1300
1400
1500
1600
1700
1800
1900
0 5 10 15
Elevation, km
Do
se E
qu
ival
ent,
mSv
Areal Density, g/cm2
365 Day Exposure inside ILMH - Polyethylene Shielding February 1956 Solar Flare and 365 Days of 1977 Solar Min GCR
0-100 100-200 200-300 300-400 400-500 500-600 600-700
700-800 800-900 900-1000 1000-1100 1100-1200 1200-1300 1300-1400
1400-1500 1500-1600 1600-1700 1700-1800 1800-1900

56
We estimated by linear interpolation the maximum surface elevations where
exposures remain within permissible limits. For a permissible limit HL, given surface
elevations h1 and h2 at dose equivalents H1 and H2, respectively, with h1 < h2 and H1 < HL
< H2, the maximum elevation hmax is
).( 1
12
121max HH
HH
hhhh L
[12]
Figure 28 is a contour plot of acute exposure in the external environment and at 5,
10, and 15 g/cm2
of polyethylene shielding. It indicates the BFO limit of 150 mSv for
acute exposure is exceeded above -2.3 km in the external environment, above 8.2 km at 5
g/cm2
of shielding, above 14.1 km at 10 g/cm2 of shielding, and above 20.1 km at 15
g/cm2 of shielding.
Figure 28. Contour Plot of Acute Exposure inside ILMH – Polyethylene Shielding.
BFO limit of 150 mSv is exceeded above -2.3 km in external environment (A), above 8.2
km at 5 g/cm2 shielding (B), above 14.1 km at 10 g/cm
2 shielding (C), and above 20.1 km
at 15 g/cm2 shielding (D).
Figure 29 is a contour plot of 30 day exposure in the external environment and at
5, 10, and 15 g/cm2
of polyethylene shielding. It indicates the BFO limit of 250 mSv for
30 day exposure is exceeded above 7.9 km in the external environment and above 22.8
0
5
10
15
-5 0 5 10 15 20 25
Are
al D
ensi
ty, g
/cm
2
Elevation, km
Acute Exposure inside ILMH - Polyethylene Shielding February 1956 Solar Flare and 1 Day of 1977 Solar Min GCR
0-150 150-300 300-450 450-600 600-750 750-900
A
B D
C

57
km at 5 g/cm2 of shielding. In addition, the eye limit of 500 mSv for 30 day exposure is
exceeded above 18.4 km in the external environment.
Figure 29. Contour Plot of 30 Day Exposure inside ILMH – Polyethylene Shielding.
BFO limit of 250 mSv is exceeded above 7.9 km in external environment (A) and above
22.8 km at 5 g/cm2 shielding (B); eye limit of 500 mSv is exceeded above 18.4 km in
external environment (C).
Figure 30 is a contour plot of 365 day exposure in the external environment and at
5, 10, and 15 g/cm2
of polyethylene shielding. It indicates the BFO limit of 500 mSv for
365 day exposure is exceeded above 7.2 km in the external environment and above 25.9
km at 5 g/cm2 of shielding. In addition, the eye limit of 1000 mSv for 365 day exposure
is exceeded above 21.5 km in the external environment.
The contour plots indicate a need for massive shielding, since 15 g/cm2 of
polyethylene will not protect adequately up to 30 km surface elevation. As a way to save
payload mass and volume, we considered the possibility of heavily shielding only the
ILMH roof. In a preliminary trial case, we calculated dose equivalent inside the ILMH
shielded by a 5 g/cm2 layer of polyethylene over the roof only, in the environments of the
February1956 solar flare and 1977 solar minimum GCR, separately, at 0 km Mars surface
elevation. In the solar flare environment, dose equivalent increased by 23% over the case
0
5
10
15
5 10 15 20 25
Are
al D
ensi
ty, g
/cm
2
Elevation, km
30 Day Exposure inside ILMH - Polyethylene Shielding February 1956 Solar Flare and 30 Days of 1977 Solar Min GCR
0-250 250-500 500-750 750-1000
A B C

58
of shielding the roof and four walls. In the GCR environment, dose equivalent increased
by 33%. We attributed the larger dose increase in the GCR environment to its isotropic
nature, as GCR is more evenly distributed over the sky, while SPE is primarily from the
overhead direction.
Figure 30. Contour Plot of 365 Day Exposure inside ILMH – Polyethylene
Shielding. BFO limit of 500 mSv is exceeded above 7.2 km in external environment (A)
and above 25.9 km at 5 g/cm2 shielding (B); eye limit of 1000 mSv is exceeded above
21.5 km in external environment (C).
Figures 31 through 36 show dose equivalent inside the ILMH under regolith
shielding for the combined SPE and GCR environments over a surface elevation range of
-10 to 30 km. Figures 31, 32, and 33 show dose equivalent at 1m shielding for acute, 30
day, and 365 day exposure, respectively. Figures 34, 35, and 36 show dose equivalent at
2m shielding for acute, 30 day, and 365 day exposure, respectively. Figures 31 and 34
indicate the GCR contribution to acute exposure is minimal compared to the SPE
contribution. Figures 32 and 35 indicate the SPE contribution is dominant for 30 day
exposure, although less strongly dominant at 2m of shielding. Figures 33 and 36 indicate
the GCR contribution is dominant for 365 day exposure.
0
5
10
15
5 10 15 20 25 30
Are
al D
ensi
ty, g
/cm
2
Elevation, km
365 Day Exposure inside ILMH - Polyethylene Shielding February 1956 Solar Flare and 365 Days of 1977 Solar Min GCR
0-500 500-1000 1000-1500 1500-2000
A B
C

59
Figure 31. Acute Exposure inside ILMH – 1m Regolith Shielding
Figure 32. 30 Day Exposure inside ILMH – 1m Regolith Shielding
0
5
10
15
20
25
30
35
40
45
50
-10 0 10 20 30
Do
se E
qu
ival
ent,
mSv
Elevation, km
Acute Exposure inside ILMH - 1m Regolith Shielding February 1956 Solar Flare and 1 Day of 1977 Solar Min GCR
Total exposure
SPE exposure
GCR exposure
05
101520253035404550556065
-10 -5 0 5 10 15 20 25 30
Do
se E
qu
ival
ent,
mSv
Elevation, km
30 Day Exposure inside ILMH - 1m Regolith Shielding February 1956 Solar Flare and 30 Days of 1977 Solar Min GCR
Total exposure
SPE exposure
GCR exposure

60
Figure 33. 365 Day Exposure inside ILMH – 1m Regolith Shielding
Figure 34. Acute Exposure inside ILMH – 2m Regolith Shielding
0
50
100
150
200
250
-10 -5 0 5 10 15 20 25 30
Do
se E
qu
ival
ent,
mSv
Elevation, km
365 Day Exposure inside ILMH - 1m Regolith Shielding February 1956 Solar Flare and 365 Days of 1977 Solar Min GCR
Total exposure
SPE exposure
GCR exposure
0
2
4
6
8
10
12
14
-10 -5 0 5 10 15 20 25 30
Do
se E
qu
ival
ent,
mSv
Elevation, km
Acute Exposure inside ILMH - 2m Regolith Shielding February 1956 Solar Flare and 1 Day of 1977 Solar Min GCR
Total exposure
SPE exposure
GCR exposure

61
Figure 35. 30 Day Exposure inside ILMH – 2m Regolith Shielding
Figure 36. 365 Day Exposure inside ILMH – 2m Regolith Shielding
0
2
4
6
8
10
12
14
16
18
20
-10 -5 0 5 10 15 20 25 30
Do
se E
qu
ival
ent,
mSv
Elevation, km
30 Day Exposure inside ILMH - 2m Regolith Shielding February 1956 Solar Flare and 30 Days of 1977 Solar Min GCR
Total exposure
SPE exposure
GCR exposure
0
10
20
30
40
50
60
70
80
90
100
-10 0 10 20 30
Do
se E
qu
ival
ent,
mSv
Elevation, km
365 Day Exposure inside ILMH - 2m Regolith Shielding February 1956 Solar Flare and 365 Days of 1977 Solar Min GCR
Total exposure
SPE exposure
GCR exposure

62
As in the case of polyethylene shielding, better visualization of exposures levels
was obtained by consolidating the information from Figures 31 through 36 into three
dimensional surface plots of acute, 30 day, and 365 day exposure, with all shielding
thicknesses represented on each surface plot. Contour plots were generated from the
surface plots, to identify bands where each shielding thickness meets permissible
exposure limits.
Figures 37, 38, and 39 are surface plots of acute, 30 day, and 365 day exposure,
respectively, in the external environment and at 1m and 2m of regolith shielding. The
surface plots indicate a very steep attenuation slope over the first meter of regolith, with a
far less steep slope over the second meter. This illustrates the diminishing effectiveness
of greater shielding thickness, as similarly illustrated by the surface plots for
polyethylene shielding. The plots suggest that addition of a third meter of regolith would
produce only marginal reduction in dose.
Figures 40, 41, and 42 are contour plots of acute, 30 day, and 365 day exposure,
respectively, in the external environment and at 1m and 2m of regolith shielding. They
indicate that all permissible exposure limits for acute, 30 day, and 365 day exposure are
met over the entire surface elevation range of -10 to 30 km at a shielding thickness of 1m.
At a shielding thickness of 2m, exposures are reduced to almost negligible levels.
The indications arising from the contour plots for the cases of polyethylene and
regolith shielding are adequate to identify surface elevation ranges where each shielding
configuration provides adequate protection from ionizing radiation. Specific
recommendations for deployment of the ILMH at safe surface elevations under several
shielding scenarios are provided in the Conclusion chapter of this thesis.

63
Figure 37. Surface Plot of Acute Exposure inside ILMH – Regolith Shielding
-10
-5
0
5
10
15
20
25
30
0
100
200
300
400
500
600
700
800
900
1000
1100
1200
1300
1400
1500
0 1 2
Elevation, km
Do
se E
qu
ival
ent,
mSv
Thickness, m
Acute Exposure inside ILMH - Regolith Shielding February 1956 Solar Flare and 1 Day of 1977 Solar Min GCR
0-100 100-200 200-300 300-400 400-500
500-600 600-700 700-800 800-900 900-1000
1000-1100 1100-1200 1200-1300 1300-1400 1400-1500

64
Figure 38. Surface Plot of 30 Day Exposure inside ILMH – Regolith Shielding
-10
-5
0
5
10
15
20
25
30
0
100
200
300
400
500
600
700
800
900
1000
1100
1200
1300
1400
1500
0 1 2
Elevation, km
Do
se E
qu
ival
ent,
mSv
Thickness, m
30 Day Exposure inside ILMH - Regolith Shielding February 1956 Solar Flare and 30 Days of 1977 Solar Min GCR
0-100 100-200 200-300 300-400 400-500
500-600 600-700 700-800 800-900 900-1000
1000-1100 1100-1200 1200-1300 1300-1400 1400-1500

65
Figure 39. Surface Plot of 365 Day Exposure inside ILMH – Regolith Shielding
-10
-5
0
5
10
15
20
25
30
0
100
200
300
400
500
600
700
800
900
1000
1100
1200
1300
1400
1500
1600
1700
1800
1900
0 1 2
Elevation, km
Do
se E
qu
ival
ent,
mSv
Thickness, m
365 Day Exposure inside ILMH - Regolith Shielding February 1956 Solar Flare and 365 Days of 1977 Solar Min GCR
0-100 100-200 200-300 300-400 400-500 500-600 600-700
700-800 800-900 900-1000 1000-1100 1100-1200 1200-1300 1300-1400
1400-1500 1500-1600 1600-1700 1700-1800 1800-1900
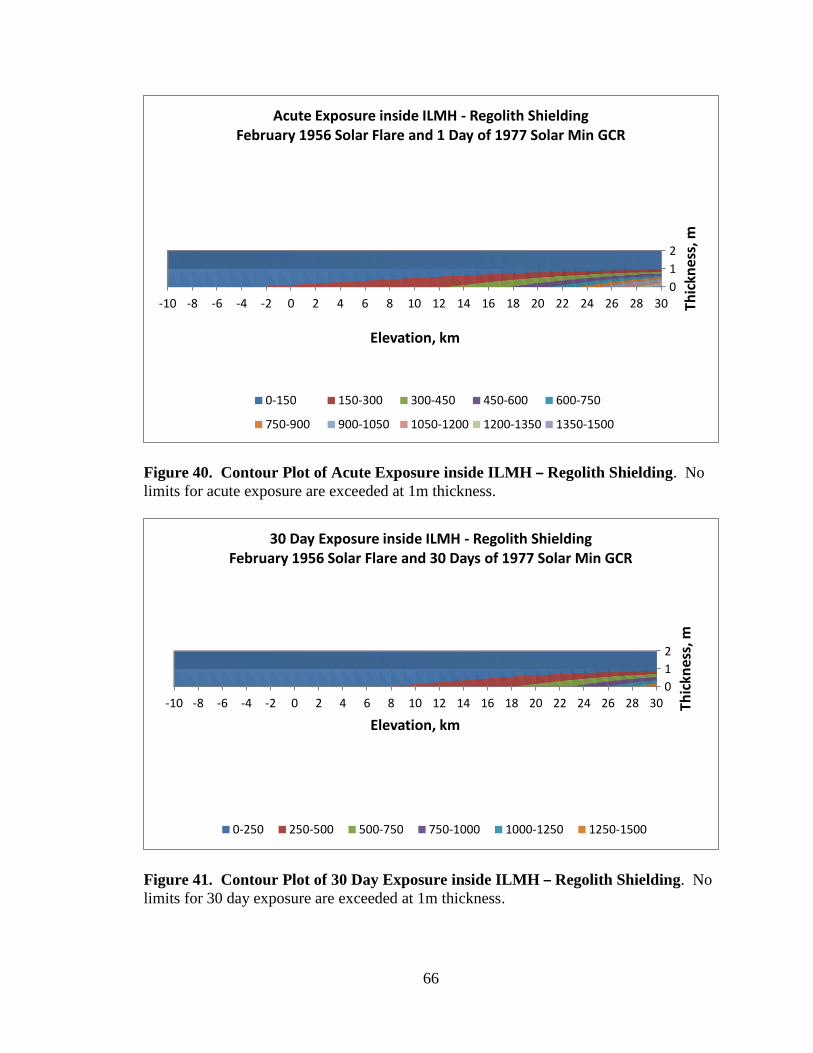
66
Figure 40. Contour Plot of Acute Exposure inside ILMH – Regolith Shielding. No
limits for acute exposure are exceeded at 1m thickness.
Figure 41. Contour Plot of 30 Day Exposure inside ILMH – Regolith Shielding. No
limits for 30 day exposure are exceeded at 1m thickness.
0
1
2
-10 -8 -6 -4 -2 0 2 4 6 8 10 12 14 16 18 20 22 24 26 28 30 Thic
knes
s, m
Elevation, km
Acute Exposure inside ILMH - Regolith Shielding February 1956 Solar Flare and 1 Day of 1977 Solar Min GCR
0-150 150-300 300-450 450-600 600-750
750-900 900-1050 1050-1200 1200-1350 1350-1500
0
1
2
-10 -8 -6 -4 -2 0 2 4 6 8 10 12 14 16 18 20 22 24 26 28 30 Thic
knes
s, m
Elevation, km
30 Day Exposure inside ILMH - Regolith Shielding February 1956 Solar Flare and 30 Days of 1977 Solar Min GCR
0-250 250-500 500-750 750-1000 1000-1250 1250-1500

67
Figure 42. Contour Plot of 365 Day Exposure inside ILMH – Regolith Shielding.
No limits for 365 day exposure are exceeded at 1m thickness.
Pressurized Electric Rover
Figures 43 and 44 are plots of acute exposure inside the PER over a surface
elevation range of -10 to 30 km. Figure 43 shows acute exposure at the port cockpit and
hammock target points. Figure 44 shows acute exposure at the starboard cockpit and
hammock target points. These exposures are for the PER with no shielding other than the
limited protection provided by its structural materials. Doses are due almost entirely to
the solar flare, with minimal contribution from the GCR. Hence, the solar flare strongly
dominates the internal radiation environment. Both figures indicate dose is highest at the
target points behind the cockpit windows, with a general, though small downward trend
in dose at hammock target points in the bow-to-stern direction. This is not surprising, as
the cockpit target points are essentially unshielded behind large windows, while the
hammock target points are behind the very light shielding of the PER shell, and at lower
height than the cockpit windows. Interpolation of port cockpit doses indicates that the
BFO limit of 150 mSv for acute exposure is exceeded above -0.7 km elevation. This is
0
1
2
-10 -8 -6 -4 -2 0 2 4 6 8 10 12 14 16 18 20 22 24 26 28 30 Thic
knes
s, m
Elevation, km
365 Day Exposure inside ILMH - Regolith Shielding February 1956 Solar Flare and 365 Days of 1977 Solar Min GCR
0-500 500-1000 1000-1500 1500-2000
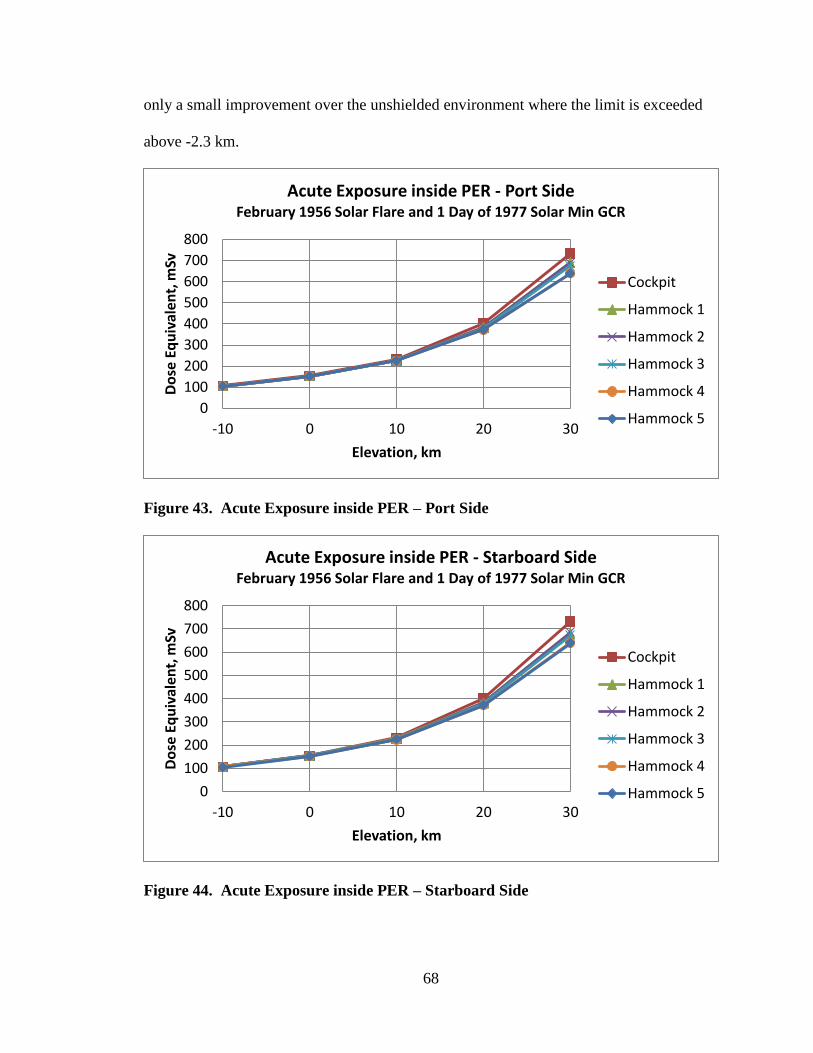
68
only a small improvement over the unshielded environment where the limit is exceeded
above -2.3 km.
Figure 43. Acute Exposure inside PER – Port Side
Figure 44. Acute Exposure inside PER – Starboard Side
0
100
200
300
400
500
600
700
800
-10 0 10 20 30
Do
se E
qu
ival
ent,
mSv
Elevation, km
Acute Exposure inside PER - Port Side February 1956 Solar Flare and 1 Day of 1977 Solar Min GCR
Cockpit
Hammock 1
Hammock 2
Hammock 3
Hammock 4
Hammock 5
0
100
200
300
400
500
600
700
800
-10 0 10 20 30
Do
se E
qu
ival
ent,
mSv
Elevation, km
Acute Exposure inside PER - Starboard Side February 1956 Solar Flare and 1 Day of 1977 Solar Min GCR
Cockpit
Hammock 1
Hammock 2
Hammock 3
Hammock 4
Hammock 5

69
A cursory examination of Figures 43 and 44 indicates similar trends in dose on
the port and starboard sides. We performed a detailed examination of trends in SPE and
GCR doses on both sides. As explained below, separate examination of doses from the
solar flare and GCR reveals different trends on the port and starboard sides, along with a
reversal in trends at 20 km elevation.
We compared the effectiveness of fiberglass epoxy and graphite epoxy to
attenuate separately SPE and GCR. Figures 45 and 46 are plots of radiation attenuation
of the February 1956 solar flare and one year of 1977 solar minimum GCR in the Mars
environment, respectively, over -10 to 30 km. The plots compare radiation attenuation by
fiberglass epoxy and graphite epoxy 51-49 hemispheres (no floor) at the same thickness
as the PER shell, which is 0.7 cm. Figure 45 indicates that graphite epoxy 51-49 is a
slightly better attenuator of the solar flare than fiberglass epoxy up to 20 km, and that
fiberglass epoxy is a slightly better attenuator than graphite epoxy 51-49 between 20 and
30 km. There is a reversal at 20 km. Both materials are poor attenuators at the PER shell
thickness of 0.7 cm. Attenuation improves with rising surface elevation. However, up to
30 km, the dose is reduced at best by less than half of the external environment, and it
substantially exceeds the acute exposure limit. Figure 46 indicates that graphite epoxy
51-49 is a better attenuator of GCR than fiberglass epoxy over the entire surface elevation
range of -10 to 30 km. However, at a thickness of 0.7 cm, they both just barely reduce
the dose from the level of the external environment. The varying SPE and CGR
attenuation effectiveness of fiberglass epoxy and graphite epoxy 51-49 over the elevation
range can explain small differences in dose trends that we noted between the port and
starboard sides.

70
Figure 45. Solar Flare Attenuation by Hemispheres in Mars Environment
Figure 46. GCR Attenuation by Hemispheres in Mars Environment
Results indicate small variations between PER target points at each elevation.
Since GCR contributes so little to the acute dose, we decided to analyze separately the
internal radiation environments induced by the solar flare and GCR. We noted different
trends on the port and starboard sides in the solar flare and GCR environments.
0
250
500
750
1000
1250
1500
-10 -5 0 5 10 15 20 25 30
Do
se E
qu
ival
ent,
mSv
Elevation, km
Solar Flare Attenuation in Mars Environment February 1956 Event
External environment
Fiberglass epoxyhemisphere (0.7 cm,1.365 g/cm2)
Graphite epoxy 51-49hemisphere (0.7 cm,1.036 g/cm2)
150
200
250
300
350
400
450
-10 -5 0 5 10 15 20 25 30
Do
se E
qu
ival
ent,
mSv
Elevation, km
GCR Attenuation in Mars Environment 365 Days of 1977 Solar Min GCR
External environment
Fiberglass epoxyhemisphere (0.7 cm,1.365 g/cm2)
Graphite epoxy 51-49hemisphere (0.7 cm,1.036 g/cm2)

71
Figures 47 through 51 are plots of dose equivalent in the February 1956 solar flare
environment, at the five target points along the port and starboard hammocks. The
figures show doses at -10, 0, 10, 20, and 30 km, respectively. They indicate a slight
general downward trend in dose along the starboard hammock target points in the bow-
to-stern direction. Figures 47, 48, and 49 (-10, 0, and 10 km, respectively) indicate a
different trend on the port side than the starboard side, while Figures 50 and 51 (20 and
30 km, respectively) indicate somewhat similar trends on the port and starboard sides.
Figure 47. Dose at PER Hammocks February 1956 Solar Flare at -10 km
Figure 48. Dose at PER Hammocks February 1956 Solar Flare at 0 km
104
105
106
1 2 3 4 5
Do
se E
qu
ival
ent,
mSv
Target Point
Dose at PER Hammocks February 1956 Solar Flare -10 km
Port -10 km
Starboard -10 km
151
152
153
1 2 3 4 5
Do
se E
qu
ival
ent,
mSv
Target Point
Dose at PER Hammocks February 1956 Solar Flare 0 km
Port 0 km
Starboard 0 km

72
Figure 49. Dose at PER Hammocks February 1956 Solar Flare at 10 km
Figure 50. Dose at PER Hammocks February 1956 Solar Flare at 20 km
Figure 51. Dose at PER Hammocks February 1956 Solar Flare at 30 km
223
224
225
226
1 2 3 4 5
Do
se E
qu
ival
ent,
mSv
Target Point
Dose at PER Hammocks February 1956 Solar Flare 10 km
Port 10 km
Starboard 10 km
370
372
374
376
378
380
382
1 2 3 4 5
Do
se E
qu
ival
ent,
mSv
Target Point
Dose at PER Hammocks February 1956 Solar Flare 20 km
Port 20 km
Starboard 20 km
630
640
650
660
670
680
690
1 2 3 4 5
Do
se E
qu
ival
ent,
mSv
Target Point
Dose at PER Hammocks February 1956 Solar Flare 30 km
Port 30 km
Starboard 30 km

73
The disparity in trends between the port and starboard sides may be explained by
the shielding asymmetry of the PER caused by the graphite epoxy hatch on the port side.
Table 7 shows the number of port rays that cross the hatch on the way to each port
hammock target point. In the bow-to-stern direction, the number of port rays crossing the
hatch decreases. Hence, shielding heaviness behind graphite epoxy decreases on the port
side in the bow-to-stern direction. Appendix D has diagrams that show where the port
rays cross the PER surface.
Table 7. Port Rays that Cross PER Hatch
Port Hammock Target Point Number of Port Rays
1 10
2 6
3 1
4 0
5 0
Since graphite epoxy is a stronger solar flare attenuator than fiberglass epoxy
below 20 km, the port hammock target points that see rays crossing graphite epoxy
should have a lower dose than their respective starboard hammock target points, at
elevations below 20 km. Furthermore, port hammock target points 1 through 3 (bow-to-
stern direction) should see increasing dose below 20 km, as there is decreasing protection
behind graphite epoxy in the bow-to-stern direction. The trends on the port and starboard
sides in Figures 47 through 49 are consistent with this.
Figures 50 and 51 (20 and 30 km, respectively) indicate slightly higher doses,
hence lower attenuation, on the port side than on the starboard side, from target points 1
through 3. These two figures show doses in the elevation range where graphite epoxy is
a weaker solar flare attenuator than fiberglass epoxy. Therefore, port hammock target
points 1 through 3, which are shielded behind graphite epoxy, should have a higher dose

74
than their respective starboard hammock target points. In addition, the dose should
decrease from port hammock target points 1 through 3 as there is decreasing shielding
behind the weaker graphite epoxy in the bow-to-stern direction. At port hammock target
points 4 and 5 there is no shielding behind graphite epoxy. They are both behind
fiberglass, as are their respective points on the starboard side. Hence, points 4 and 5 on
the port side should have the same doses as their respective points on the starboard side.
The trends on the port and starboard sides in Figures 50 and 51 are consistent with this.
We tested this explanation by replacing the graphite epoxy hatch with fiberglass
epoxy at the same thickness as the fiberglass shell, and recalculating the doses at 0 km.
Figure 52 is a plot comparing the recalculated doses at the five port and starboard
hammock target points at 0 km. It shows that replacement of graphite epoxy with
fiberglass epoxy establishes identical trends on the port and starboard sides, thus
symmetrizing the internal radiation field.
Figure 52. Solar Flare Dose at PER Hammocks with Fiberglass Hatch
As in the case of the SPE environment, we examined trends in dose under the
GCR environment on the port and starboard sides. Figures 53 through 57 are plots of
151
152
152
153
153
1 2 3 4 5Do
se E
qu
ival
ent,
mSv
Target Point
Dose at PER Hammocks February 1956 Solar Flare 0 km Fiberglass Hatch
Port 0 km(fiberglass hatch)
Starboard 0 km(fiberglass hatch)

75
dose equivalent in the 1977 solar minimum GCR environment (plotted for 365 days,
rather than the actual duration of acute exposure, to avoid displaying very small
numbers), at the five target points along the port and starboard hammocks. The figures
show doses at -10, 0, 10, 20, and 30 km, respectively. As in the SPE environment, we
noted a similar disparity in trends on the port and starboard sides, which we attributed to
the asymmetry in shielding caused by the graphite epoxy hatch on the port side. Since
there is no reversal in GCR attenuation between graphite epoxy and fiberglass epoxy at
20 km, there is no change in the general port and starboard trends above 20 km (Figures
56 and 57, compared to Figures 53 through 55), unlike the change in the solar flare
environment.
As in the solar flare case, we tested this explanation by replacing the graphite
epoxy hatch with fiberglass epoxy and recalculating the doses at 0 km. Figure 58 is a
plot of the recalculated doses at the five port and starboard hammock target points at 0
km. It shows that replacement of graphite epoxy with fiberglass epoxy establishes
identical trends on the port and starboard sides, thus symmetrizing the internal radiation
field.
Figure 53. Dose at PER Hammocks 1 Year 1977 Solar Min GCR at -10 km
161
162
163
164
1 2 3 4 5
Do
se E
qu
ival
ent,
mSv
Target Point
Dose at PER Hammocks 1 Year 1977 Solar Min GCR -10 km
Port -10 km
Starboard -10 km

76
Figure 54. Dose at PER Hammocks 1 Year 1977 Solar Min GCR at 0 km
Figure 55. Dose at PER Hammocks 1 Year 1977 Solar Min GCR at 10 km
Figure 56. Dose at PER Hammocks 1 Year 1977 Solar Min GCR at 20 km
202
203
204
205
1 2 3 4 5
Do
se E
qu
ival
ent,
mSv
Target Point
Dose at PER Hammocks 1 Year 1977 Solar Min GCR 0 km
Port 0 km
Starboard 0 km
279
280
281
282
283
1 2 3 4 5
Do
se E
qu
ival
ent,
mSv
Target Point
Dose at PER Hammocks 1 Year 1977 Solar Min GCR 10 km
Port 10 km
Starboard 10 km
337
338
339
340
341
1 2 3 4 5
Do
se E
qu
ival
ent,
mSv
Target Point
Dose at PER Hammocks 1 Year 1977 Solar Min GCR 20 km
Port 20 km
Starboard 20 km

77
Figure 57. Dose at PER Hammocks 1 Year 1977 Solar Min GCR at 30 km
Figure 58. GCR Dose at PER Hammocks with Fiberglass Hatch
Figure 59 is a plot comparing acute exposure inside the baseline and heavy PERs
on the port side over a surface elevation range of -10 to 30 km. It indicates higher
attenuation inside the heavy PER, as expected, with similar trends in the bow-to-stern
direction. For both the baseline and heavy PER, the highest dose occurs at the cockpit
target point. In the baseline PER, the dose equivalent at 30 km is 732 mSv, while in the
heavy PER it is 370 mSv, which is a little more than half. This indicates that an almost
fourfold increase in shielding reduced the dose by less than half, showing the diminishing
effectiveness of increased shielding thickness. In any case, exposure inside the heavy
203
203
204
204
205
205
1 2 3 4 5
Do
se E
qu
ival
ent,
mSv
Target Point
Dose at PER Hammocks 1 Year 1977 Solar Min GCR 0 km Fiberglass Hatch
Port 0 km (fiberglasshatch)
Starboard 0 km(fiberglass hatch)
383
384
385
386
387
388
1 2 3 4 5Do
se E
qu
ival
ent,
mSv
Target Point
Dose at PER Hammocks 1 Year 1977 Solar Min GCR 30 km
Port 30 km
Starboard 30 km
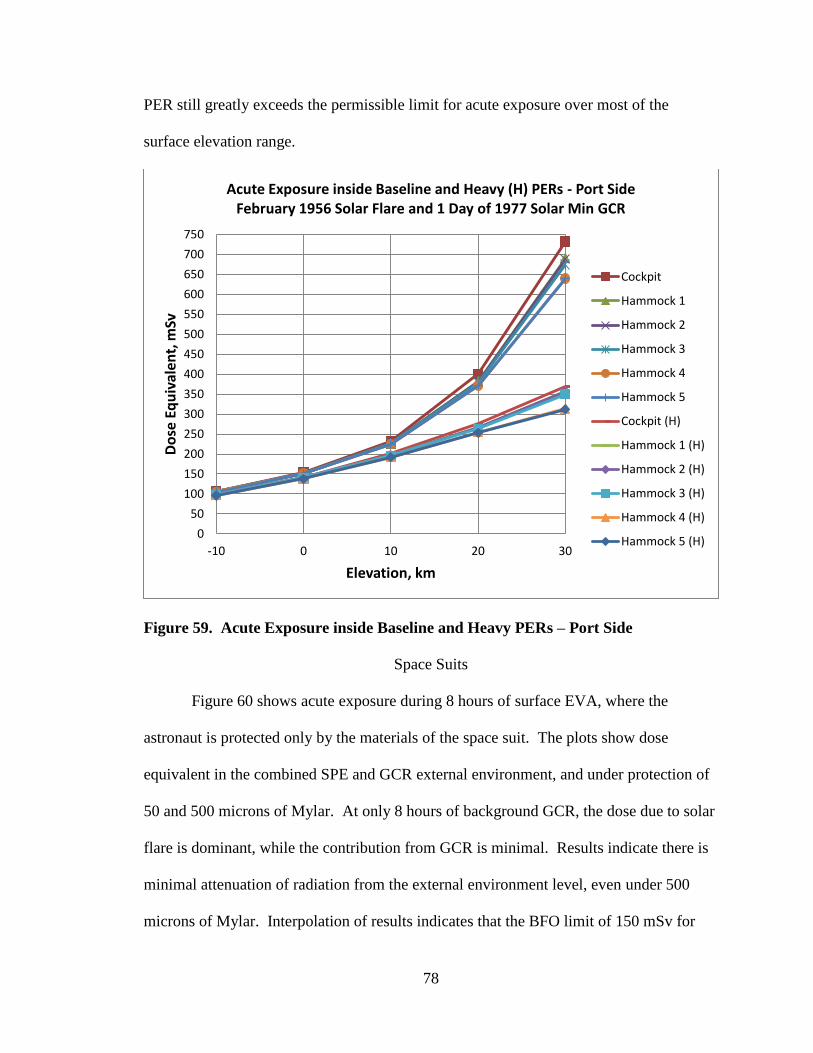
78
PER still greatly exceeds the permissible limit for acute exposure over most of the
surface elevation range.
Figure 59. Acute Exposure inside Baseline and Heavy PERs – Port Side
Space Suits
Figure 60 shows acute exposure during 8 hours of surface EVA, where the
astronaut is protected only by the materials of the space suit. The plots show dose
equivalent in the combined SPE and GCR external environment, and under protection of
50 and 500 microns of Mylar. At only 8 hours of background GCR, the dose due to solar
flare is dominant, while the contribution from GCR is minimal. Results indicate there is
minimal attenuation of radiation from the external environment level, even under 500
microns of Mylar. Interpolation of results indicates that the BFO limit of 150 mSv for
0
50
100
150
200
250
300
350
400
450
500
550
600
650
700
750
-10 0 10 20 30
Do
se E
qu
ival
ent,
mSv
Elevation, km
Acute Exposure inside Baseline and Heavy (H) PERs - Port Side February 1956 Solar Flare and 1 Day of 1977 Solar Min GCR
Cockpit
Hammock 1
Hammock 2
Hammock 3
Hammock 4
Hammock 5
Cockpit (H)
Hammock 1 (H)
Hammock 2 (H)
Hammock 3 (H)
Hammock 4 (H)
Hammock 5 (H)
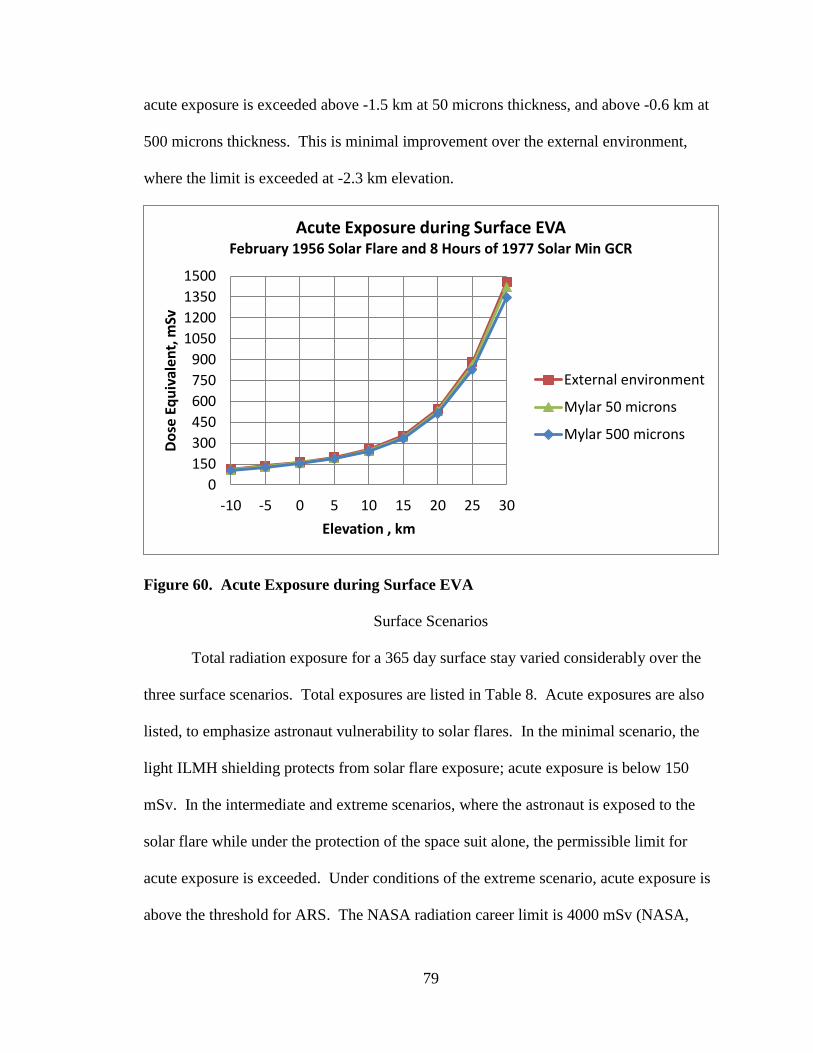
79
acute exposure is exceeded above -1.5 km at 50 microns thickness, and above -0.6 km at
500 microns thickness. This is minimal improvement over the external environment,
where the limit is exceeded at -2.3 km elevation.
Figure 60. Acute Exposure during Surface EVA
Surface Scenarios
Total radiation exposure for a 365 day surface stay varied considerably over the
three surface scenarios. Total exposures are listed in Table 8. Acute exposures are also
listed, to emphasize astronaut vulnerability to solar flares. In the minimal scenario, the
light ILMH shielding protects from solar flare exposure; acute exposure is below 150
mSv. In the intermediate and extreme scenarios, where the astronaut is exposed to the
solar flare while under the protection of the space suit alone, the permissible limit for
acute exposure is exceeded. Under conditions of the extreme scenario, acute exposure is
above the threshold for ARS. The NASA radiation career limit is 4000 mSv (NASA,
0
150
300
450
600
750
900
1050
1200
1350
1500
-10 -5 0 5 10 15 20 25 30
Do
se E
qu
ival
ent,
mSv
Elevation , km
Acute Exposure during Surface EVA February 1956 Solar Flare and 8 Hours of 1977 Solar Min GCR
External environment
Mylar 50 microns
Mylar 500 microns

80
2009), while the ESA and RSA career limits are both 1000 mSv (THREE, 2014). Aside
from acute exposure, the total exposures of the three surface scenarios meet the NASA
career limit. The total exposure of the extreme scenario exceeds the ESA and RSA career
limits.
Table 8. Exposure for 365 Day Surface Stay
Surface Scenario Acute Exposure (mSv) Total Exposure (mSv)
Minimal 112 270
Intermediate 179 337
Extreme 1036 1196

81
CHAPTER IV
CONCLUSION
Introductory Remarks
Calculations show that during a long stay on the Mars surface, ionizing radiation
levels far exceed currently accepted standards for humans, over much of the surface
elevation range. Humans operating on Mars will be affected by ionizing radiation much
more than humans operating on Earth. Therefore, it is imperative to develop an effective
radiation protection strategy for planetary surface exploration. Currently, radiation
standards for astronauts are similar to those for nuclear power plant workers. Additional
measures will be required for astronauts working on planetary surfaces. Mitigation
strategies could entail integration between life support system design (habitat, rover, and
space suit), surface mission planning (duration, use of terrain for protection, travel
distances for rover and suited astronauts, etc.), early warning of solar storms, and medical
protection and recovery countermeasures. These would all have to be integrated into
planetary surface operations.
Inflatable Lunar-Martian Habitat
Selection of ILMH shielding material and thickness depends strongly on the range
of Mars surface elevation of interest for exploration. The severity of the radiation
environment increases as surface elevation increases, due to decreasing protection by the
atmosphere. Over a surface elevation range up to 0 km, a 5 g/cm2 layer of polyethylene
over the roof and around the four walls provides adequate protection to remain within

82
permissible exposure limits for acute, 30 day, and 365 day exposure. Over a surface
elevation range up to 10 km, a 10 g/cm2 layer of polyethylene is required. If there is
interest in deploying the ILMH up to 20 km surface elevation, then a 15 g/cm2 layer of
polyethylene is required. The maximum suggested surface elevations for deployment of
the ILMH in the external environment and under polyethylene shielding are summarized
by permissible exposure limit in Table 9.
Table 9. Maximum Suggested Surface Elevation (km) for ILMH
Polyethylene Shielding (g/cm
2)
Organ Exposure Limit
(mSv)
External
Environment 5 10 15
BFO Acute 150 -2.3 8.2 14.1 20.1
BFO 30 days 250 7.9 22.8
BFO 365 days 500 7.2 25.9
Eye 30 days 500 18.4
Eye 365 days 1000 21.5
To keep exposures within permissible levels up to a surface elevation of 30
km, massive shielding is required. Reduction of payload mass and volume by shielding
only the roof is not a viable approach, due to large increases in SPE and GCR doses.
Hence, our recommendation for massive shielding is to lay a thick layer of regolith over
the roof and around the four walls. Calculations show that a 1m layer of Mars regolith
provides adequate protection to remain within permissible exposure limits for acute, 30
day, and 365 day exposure, while a 2m layer of Mars regolith reduces exposures to
almost negligible levels. Use of Mars regolith allows exploitation of a planetary resource
that is available in situ, along with payload mass and volume savings. Mars regolith also
has the advantage of being nonparasitic, as it can also provide thermal insulation and
micrometeoroid protection.
In order to serve as the primary radiation storm shelter, the ILMH must maintain
acute exposure within permissible levels. Limits for acute exposure at 5, 10, and 15

83
g/cm2 of polyethylene shielding are met at surface elevations up to 8.2, 14.1, and 20.1
km, respectively. A layer of regolith of 1m thickness provides adequate protection from
a severe solar radiation storm, up to 30 km. Figure 61 is a diagram showing the ILMH
under a layer of Mars regolith. The figure shows the concept developed by the UND
Department of Space Studies and colleagues specifically for Lunar exploration, but
seated on the Mars surface.
Figure 61. ILMH under a Layer of Regolith (adapted from Schneider et al., 2010)
The shield may consist of a layer of sacks filled with regolith and stacked on top
of each other. The weight will be supported by the fabric structure and transferred to the
rigid frame through conjugation joints (Schneider et al., 2010). Structural analyses
performed by the UND Department of Space Studies and colleagues indicate the ILMH
can support 1m of Moon regolith at 1g. Hence, the ILMH has sufficient structural
margin to support 1m of Mars regolith in the Mars gravitational environment of 0.376 g
(de León, 2014, private communication).

84
The interior panels of the ILMH could be manufactured of polyethylene or
another hydrogen-rich material, to provide additional shielding. Figure 62 shows the
interior panels of the Moon habitat proposed by Daga and colleagues.
Figure 62. View of Interior Panels of a Proposed Moon Habitat (Daga et al., 2010)
Pressurized Electric Rover
The thin PER shell provides very limited protection from the external radiation
environment. Without additional shielding, the PER does not protect from a February
1956 solar flare at elevation above -0.7 km. In its current configuration, the PER is not
adequate to serve as a secondary storm shelter. As indicated by Figure 45, solar flare
attenuation by equal thicknesses of fiberglass epoxy and graphite epoxy 51-49 are
similar. Graphite epoxy 51-49 was already shown to be a good attenuator. The poor
radiation protection provided by the PER is not due to its materials. It is due to the very
thin shell. At a thickness of about 0.7 cm, no “realistic” material is likely to provide
adequate attenuation. The baseline areal densities of fiberglass epoxy and graphite epoxy
(1.365 and 1.036 g/cm2, respectively) will not even provide minimal shielding. However,
if the thickness of the shell is increased to provide radiation protection comparable to an
adequately shielded ILMH, the PER becomes quite massive, requiring much more power
for surface roving, which limits its performance envelope. Installation of heavy

85
shielding, either internal or external, also interferes with the hatch, suitports, and other
essential interfaces to the exterior.
The dose equivalent trends noted in the bow-to-stern direction are small, and do
not result in large variations in dose equivalent at any surface elevation. Therefore, they
do not support development of an optimum configuration of sleep areas.
Ignoring interface issues, we considered a shielding layer for the PER. We
already saw the ILMH needs 10 g/cm2 of polyethylene to meet the BFO limit of 150 mSv
for acute exposure up to 14.1 km. Since graphite epoxy is about as good an attenuator as
polyethylene (and there already is some carbon fiber in the baseline PER design), we
considered the possibility of a haven in the aft space of the PER, shielded by 10 cm of
graphite epoxy from the roof, port, starboard, bow, and stern directions, but not the floor
direction. The haven would be about 8 feet long, 7 feet high, and 4.5 feet wide. A 10 cm
layer of graphite epoxy 51-49 around this volume would have a mass of about 2900 kg
(6380 lbs.). Even in the Mars gravitational environment of 0.376 g, the shielding would
still weigh about 2400 lbs., which is probably excessive for a small mobile rover (not to
mention the v penalty for the launch vehicle). Even this heavy shield would protect the
PER haven only over a limited surface elevation range.
If the operational elevation range of the PER crosses 20 km, where the SPE
attenuation strengths of fiberglass epoxy and graphite epoxy are reversed, then a
multilayer shield may be optimum. From the outside in, the shield may consist of a layer
of graphite epoxy and a layer of fiberglass epoxy, of approximately equal thickness. This
way, the stronger attenuator of SPE at elevation will be present to provide some

86
protection over the entire surface elevation range. The stronger attenuator of GCR, i.e.
graphite epoxy, should be on the outside for an optimum configuration.
Strategies for radiation protection inside the PER are limited. As indicated by the
results for the heavy PER, even a fourfold increase in shielding falls far short of adequacy
for a storm shelter. To be an adequate secondary storm shelter over the entire surface
elevation range, the PER would require massive shielding, like the ILMH. In addition,
the very tight space inside the PER would make adequate internal shielding unfeasible.
Furthermore, both internal and external shielding would cause interface problems. We
recommend a strategy of early warning of increased solar activity, to alert the crew to
drive back to the ILMH in time to escape a severe solar storm, or else park under the
protection of natural topography, if there happens to be such topography nearby. A
radiation monitoring device, like the RAD on the Curiosity rover, might be suitable. It
has already detected an SPE spike on Mars, as indicated in Figure 5. We recommend
installation of a RAD instrument at the ILMH site, with at least one astronaut remaining
in the ILMH while up to three astronauts perform surface roving and EVA. The
astronaut inside the ILMH can monitor external charged particle activity and alert the
others to return to the ILMH upon detection of increased charged particle counts. Since
solar flares often have rise times of hours (unlike the February 1956 flare, which attained
peak intensity in only 30 minutes), this may give the astronauts time to return to the
protection of the ILMH and escape the worst of the solar storm. However, after several
hours of roving, the PER may be too far from the ILMH to return in time to escape a
major solar flare, keeping in mind its top speed of 25 mph (along with possibly rough
terrain) even with real-time warning of the flare. It may be necessary to impose a severe

87
radius of roving to ensure the crew can return long before the flare attains peak intensity.
Since the crew may have to rely on local geological features for protection, initial surface
exploration may be required just to perform surveys of local geological and survival
resources.
Another possibility is to redesign the PER and its power source to accommodate
the massive shielding required for protection from acute exposure. It may be feasible to
design a rover that protects over a greater portion of the elevation range, but not likely up
to 30 km. Mass requirements were not included in the original PER design and
construction, since radiation protection was not a primary goal at the time (Rygalov,
2014, private communication). It will likely be necessary to install a larger, more
powerful battery to support mobility under the added mass of shielding while also
providing capacity for the planned scope of surface operations.
Space Suits
Results indicate that during a major solar storm, space suits provide negligible
protection from radiation. Even under protection of 500 microns of space suit material,
there is minimal attenuation from the external environment level. We concluded that
space suits will not provide protection from an event such as the February 1956 solar
flare at any operationally realistic thickness or choice of material, unless EVA is
restricted to below -0.6 km while wearing a Mylar space suit with a thickness of at least
500 microns. If there is no natural topography that may serve as a storm shelter, then
surface EVA may have to be restricted to a very short distance from a protected habitat.
This also drives the need to implement an early warning system for solar storms to alert
88
astronauts to return immediately to the protection of a shielded haven, possibly a satellite
system specifically designed for this purpose.
The radiation protection deficiency of space suits is due to their being very thin.
Even at 500 microns, the shielding areal density of Mylar is only 0.0665 g/cm2, which is
two orders of magnitude below even minimal shielding. Hence, a space suit would have
to be about 100 times as thick or as dense to provide even light shielding. Even so, light
shielding is inadequate over a considerable range of Mars surface elevation, as we saw
with the ILMH. In addition, issues related to the physiological part of human factors will
make very heavy suits impractical.
There is interest in use of metallized materials as space suit fabric. However, we
know that a minimal aluminum shield at an areal density of 5 g/cm2 is inadequate
shielding in severe environments. At a density of 2.7 g/cm3, a minimal aluminum shield
would have a thickness of 1.852 cm. When the total weight of the suit is accounted for, it
becomes impractical for an astronaut to perform surface EVA regimens weighted by such
a massive suit. In any case, the degree of metallic content in suits will be far short of
even minimal shielding. Furthermore, the investigations of Townsend and colleagues
assumed a more realistic space suit shielding equivalent to 0.3 g/cm2 of aluminum, and
found that it fails to protect body organs over most of the Mars surface elevation range
during a severe solar flare (Townsend et al., 2013). We do not consider use of metallized
suits to be a viable approach.
Surface Scenarios
The dose equivalent for a 365 day surface stay on Mars vastly exceeds the dose
equivalent for one year on Earth. The average effective dose rate on the Earth is about 3

89
mSv per year (Durante and Manti, 2008). Even the minimal surface scenario, which
produced a rate of 270 mSv per year, greatly exceeds the dose rate on Earth. However, it
is lower than the equivalent dose rate on the Moon, which may reach as high as 360 mSv
per year (Durante and Manti, 2008).
The intermediate and extreme surface scenarios indicate there is no adequate
protection from a major solar flare outside a shielded habitat, at the surface elevation
ranges considered. In both scenarios, where the astronaut endures a solar flare outside
the ILMH, the permissible limit for acute exposure is exceeded, even at a relatively low
elevation of 4 km. At elevation between 24 and 30 km, the dose equivalent for acute
exposure is 1036 mSv, which exceeds the level of ARS. Hence, an astronaut performing
EVA at high Mars surface altitude will be at elevated risk for onset of ARS if a major
solar flare occurs. Since the PER and space suit provide minimal protection from
radiation, an alternative protection strategy is required while outside the ILMH. During
surface exploration by EVA, the astronaut might not be near natural topography that
could provide protection. Therefore, real-time warning of a solar storm, followed by
quick travel to the ILMH, may be the best strategy for prevention of excessive exposure.

90
CHAPTER V
RECOMMENDATIONS FOR FUTURE WORK
Research and development in radiation protection is essential, considering that
future astronauts will be exposed to much higher radiation risk environments as they
venture into interplanetary space. Future research and development should consider
inevitable failures of radiation protection strategies on planetary surfaces. A
comprehensive radiation protection strategy must address both the avoidance of excessive
exposure, and remedial treatment for excessive exposure when avoidance fails.
Development of in-place medical recovery installations may be required, along with
recovery procedures, including emergency transportation back to Earth. Radiation
resistance training is not viable at present, due to lack of a realistic approach for
implementation. Failure of radiation protection also raises significant ethical questions.
In cases of excessive radiation exposure, material compensation will be required for
astronauts and their families.
This thesis focused on radiation shielding strategies for UND planetary surface
exploration concepts. Radiation shielding analysis of these concepts has progressed from
planar incidence on flat shielding on the Lunar surface, with no accounting for neutron
backscatter (Schneider et al., 2010), to multi-directional incidence on three-dimensional
shielding on the Martian surface, with neutron backscatter, as performed under these
investigations. At the time that Schneider and colleagues performed their calculations,
the HZETRN transport code was not set up to process neutron backscatter from the Lunar

91
surface. A 2012 upgrade, currently accessible through OLTARIS, has neutron
backscatter analysis capability (OLTARIS, 2015b). OLTARIS also added capability to
perform ray-by-ray radiation transport analysis using new SPE and GCR models for the
Lunar surface environment, with three-dimensional shielding thickness distributions. In
light of the greatly increased computational capability of the upgraded radiation code(s)
and the availability of Lunar surface radiation models, we recommend that the UND
Department of Space Studies revisit and possibly re-accomplish some of the 2010
calculations for the Lunar surface environment.
So far, only very simple models of the habitat and rover have been implemented
for radiation analysis. The next logical progression should be in-depth analysis with
vastly more detailed shielding thickness distributions. This will require implementation
of computer-aided design (CAD) models of the ILMH and PER, with ray tracing
capability. (A detailed CAD model of the ILMH was developed mainly for structural
analysis [de León, 2014, private communication].)
Development of CAD models of the ILMH and PER, with ray tracing capability,
will enable inclusion of internal structural elements and hardware into the shielding
thickness distributions. The geometry will be more complicated, hence many more rays
will be required. Use of CAD software with ray tracing will enable more realistic
modeling of habitat shielding, especially internal shielding provided by walls, hardware,
equipment, fluid tanks, pipes, and interface hardware. In addition, alternative shielding
methods may be explored with ray tracing. For example, ILMH shielding may be
supplemented by an array of external water tanks along the ILMH walls (Rygalov, 2015,
private communication). Analysis of the PER internal radiation environment showed a

92
small gradient when the ray crossings transitioned from graphite to fiberglass. For the
ILMH, it should be expected that large gradients may result in the internal radiation
environment as the ray crossings transition from air to filled water tanks. It may then be
possible to arrange ILMH sleep areas and work stations to exploit any valleys resulting in
the internal radiation environment. Similarly, if hot spots result, internal hardware and
storage space could be arranged to occupy volumes containing hot spots, and hence
prevent crew dwell at a hot spot. These alternative shielding concepts should be explored
further, but it will require many more rays to capture the more intricate shielding
geometry, and hence CAD models with ray tracing will be essential to the effort. We
recommend that the UND Department of Space Studies implement CAD models of the
ILMH, PER, and possibly the NDX-1 and NDX-2 space suits, with ray tracing capability,
and develop shielding thickness distributions with hundreds or even thousands of rays,
and then reassess the internal radiation environments of the ILMH, PER, and space suits,
taking into account alternative shielding approaches.
So far, radiation analyses of the UND concepts have not produced dose
predictions at the human organ level. The analyses have estimated dose equivalents at
target points behind habitat shielding, but not inside human body zones where vital
organs with sensitive tissues are located. Radiation vulnerability varies across human
body organs, as reflected by varying tissue weighting factors. Since ionizing radiation is
highly penetrating (especially energetic GCR ions), it is important to be able to predict
exposure to individual internal organs behind the protection of human skin. This requires
assessment of human biological responses at the organ level.

93
In-depth analysis of human biological responses to space radiation requires use of
the whole body equivalent dose method. This entails insertion of Computerized
Anatomical Male (CAM) and Computerized Anatomical Female (CAF) phantom proxies
into the shielding thickness distributions. NASA Langley has made this capability
available to space radiation researchers through OLTARIS, which provides CAM/CAF
phantoms that enable analyses with 500 body tissue distributions. Figure 63 shows a
sample CAM developed by NASA Langley. Use of CAM/CAF proxies requires CAD
models of the space habitats, with ray tracing capability. This will enable development of
detailed shielding thickness distributions with thousands of rays for a complicated habitat
with bulkheads and other structural members that provide internal radiation shielding,
and hence get integrated into the shielding thickness distributions. The phantom proxies
can be inserted into the shielding thickness distributions at varying location and
orientation, for five-zone (head, chest, pelvis, thighs, and calves) full body effective dose
calculations. Shielding thickness distributions consisting of spheres with up to 10,000
rays can be centered at each of the five body zones, for analysis of ray-by-ray transport
along each ray (Singleterry et al., 2010). The computations will have the highest
resolution possible by state of the art methods and can yield doses for individual organs.
Researchers in radiation effects may prefer results for individual organs, as inputs to
models for prediction of delayed responses to radiation exposure. We recommend that
the UND Department of Space Studies implement CAD models of the ILMH, PER, and
possibly the NDX-1 and NDX-2 space suits, with ray tracing capability, and perform
whole body equivalent dose analyses with CAM/CAF phantoms. This will make

94
maximum use of the powerful computational capability that NASA Langley has made
available through OLTARIS.
Figure 63. CAM/CAF Phantoms and Body Zones. NASA LaRC image.

95
APPENDICES

96
Appendix A
Compositions of Shielding Materials Used in these Investigations
Table 10. Aluminum
Density: 2.7 g/cm3
Formula Percentage by Mass
Al 100
Table 11. Fiberglass Epoxy
S-glass with epoxy resin C21H25ClO5 at fiber-to-resin ratio of 67:33
Density: 1.95 g/cm3
Formula Percentage by Mass
SiO2 43.55
Al2O3 16.75
MgO 6.7
C21H25ClO5 33.0
Total 100
Table 12. Graphite Epoxy 51-49
Density: 1.48 g/cm3
Formula Percentage by Mass
C 50.92
C37H42 N4O6S 49.08
Total 100
Table 13. Mars Atmosphere
Approximate composition (De Angelis et al., 2004)
Table 14. Mars Regolith Simulant
NASA LaRC
Density: 1.7 g/cm3
Formula Percentage by Mass
SiO2 51.2
Fe2O3 9.3
Al2CaK2MgNa2O7 32.1
H2O 7.4
Total 100
Formula Percentage by Mass
CO2 95.32
N2 2.70
Ar 1.6
O2 0.13
CO 0.08

97
Table 15. Mylar
Polyethylene terephthalate
Amorphous density: 1.33 g/cm3
Table 16. Polyethylene
Density: 1.0 g/cm
3
Formula Percentage by Mass
CH2 100
Formula Percentage by Mass
C10H8O4 100

98
Appendix B
Permissible Exposure Limits for Astronauts
Table 17. NASA Dose Limits for Short Term or Career Non-Cancer Effects
(NASA, 2009) Organ 30 Day Limit 1 Year Limit Career Limit
Lens* 1000 mGy-Eq 2000 mGy-Eq 4000 mGy-Eq
Skin 1500 3000 4000
BFO 250 500 Not applicable
Heart** 250 500 1000
CNS*** 500 1000 1500
CNS *** (Z ≥ 10) - 100 mGy 250 mGy
*Lens limits are intended to prevent early (< 5 yr) severe cataracts (e.g., from a solar particle event). An
additional cataract risk exists at lower doses from cosmic rays for sub-clinical cataracts, which may
progress to severe types after long latency (> 5 yr) and are not preventable by existing mitigation measures;
however, they are deemed an acceptable risk to the program.
**Heart doses calculated as average over heart muscle and adjacent arteries.
***CNS limits should be calculated at the hippocampus.
Table 18. European Space Agency Dose Limits
(THREE, 2014)
Table 19. Russian Space Agency Dose Limits
(THREE, 2014) Limit Value (mSv)
Career 1000
Blood Forming Organs 150 for acute
250 for 30 days
500 for 1 year
Eye 500 for 30 days
1000 for 1 year
2000 for career
Skin 1500 for 30 days
3000 for 1 year
6000 for career
Limit Value (mSv)
Career 1000
Blood Forming Organs 250 for 30 days
500 for 1 year
Eye 500 for 30 days
1000 for 1 year
Skin 1500 for 30 days
3000 for 1 year
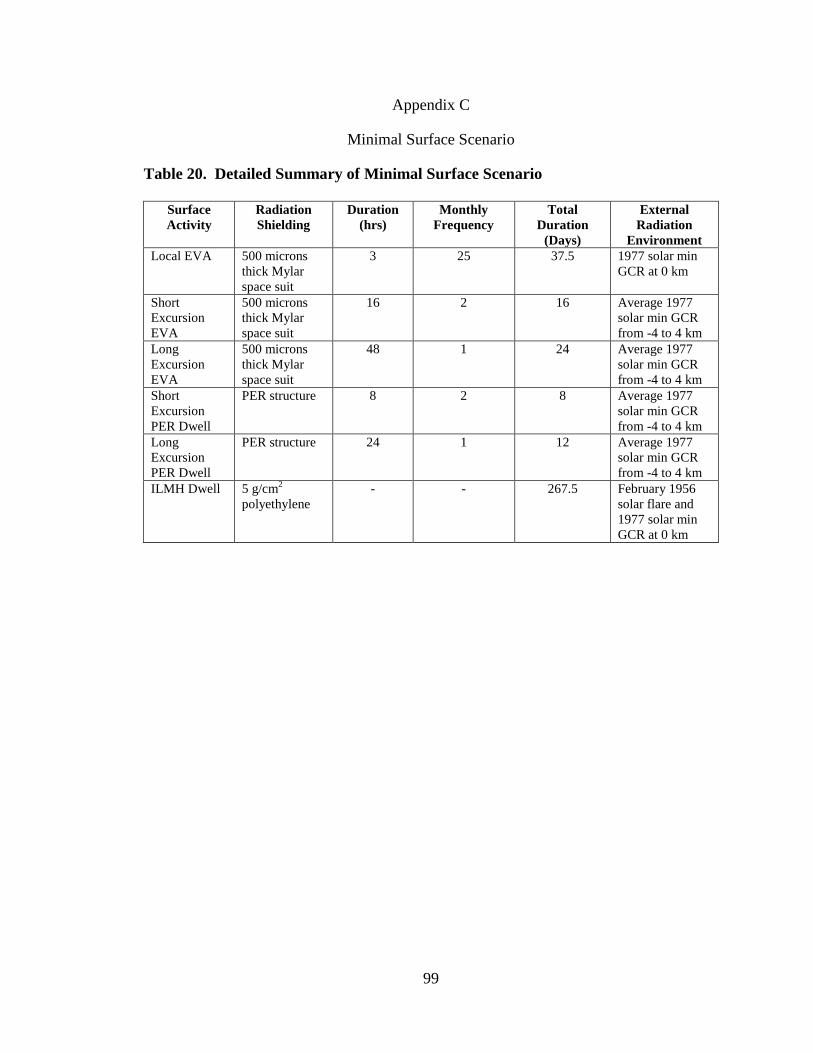
99
Appendix C
Minimal Surface Scenario
Table 20. Detailed Summary of Minimal Surface Scenario
Surface
Activity
Radiation
Shielding
Duration
(hrs)
Monthly
Frequency
Total
Duration
(Days)
External
Radiation
Environment
Local EVA 500 microns
thick Mylar
space suit
3 25 37.5 1977 solar min
GCR at 0 km
Short
Excursion
EVA
500 microns
thick Mylar
space suit
16 2 16 Average 1977
solar min GCR
from -4 to 4 km
Long
Excursion
EVA
500 microns
thick Mylar
space suit
48 1 24 Average 1977
solar min GCR
from -4 to 4 km
Short
Excursion
PER Dwell
PER structure 8 2 8 Average 1977
solar min GCR
from -4 to 4 km
Long
Excursion
PER Dwell
PER structure 24 1 12 Average 1977
solar min GCR
from -4 to 4 km
ILMH Dwell 5 g/cm2
polyethylene
- - 267.5 February 1956
solar flare and
1977 solar min
GCR at 0 km

100
Appendix D
Ray Crossings on Port Side of PER
Figures 64 through 68 illustrate decreasing shielding behind graphite epoxy in the
bow-to-stern direction on the port side of the PER. Figure 64 shows that 10 of 15 port
rays converging at hammock target point 1 cross the graphite epoxy hatch. Figure 65
shows that only 6 of 15 port rays converging at point 2 cross the hatch. Figure 66 shows
that only one of 15 port rays converging at point 3 crosses the hatch. Figures 67 and 68
show that no port rays converging at points 4 and 5, respectively, cross the hatch. As a
result, shielding behind graphite epoxy decreases in the bow-to-stern direction on the port
side, while shielding behind fiberglass increases, as the port rays transition from crossing
graphite to crossing fiberglass. Therefore, it should be expected that some gradient
should develop in the internal radiation environment due to this variation in shielding
along the bow-to-stern direction.
Figure 64. PER Port Rays Converging at Port Hammock 1 Target Point
-50
-25
0
25
50
-100 -75 -50 -25 0 25 50 75 100
x, in
che
s
z, inches
PER Port Ray Intersections - Hammock 1
Hatch boundary
Target point
Rays

101
Figure 65. PER Port Rays Converging at Port Hammock 2 Target Point
Figure 66. PER Port Rays Converging at Port Hammock 3 Target Point
Since attenuation effectiveness against SPE and GCR of graphite epoxy and
fiberglass epoxy varies with surface elevation, it should also be expected that the
resulting gradient in the internal radiation environment should vary with surface
elevation. Furthermore, since radiation attenuation effectiveness of graphite epoxy and
fiberglass epoxy are similar, the resulting gradients should be small. The fact that the
HZETRN computer runs actually predicted these small variations shows that the
-50
-25
0
25
50
-100 -75 -50 -25 0 25 50 75 100
x, in
che
s
z, inches
PER Port Ray Intersections - Hammock 2
Hatch boundary
Target point
Rays
-50
-25
0
25
50
-100 -75 -50 -25 0 25 50 75 100
x, in
che
s
z, inches
PER Port Ray Intersections - Hammock 3
Hatch boundary
Target point
Port rays

102
algorithms are very sensitive to changing material properties in the shielding thickness
distributions.
Figure 67. PER Port Rays Converging at Port Hammock 4 Target Point
Figure 68. PER Port Rays Converging at Port Hammock 5 Target Point
-50
-25
0
25
50
-100 -75 -50 -25 0 25 50 75 100
x, in
che
s
z, inches
PER Port Ray Intersections - Hammock 4
Hatch boundary
Target point
port rays
-50
-25
0
25
50
-100 -75 -50 -25 0 25 50 75 100
x, in
che
s
z, inches
PER Port Ray Intersections - Hammock 5
Hatch boundary
Target point
Port rays

103
Appendix E
Abbreviations and Acronyms
A atomic mass number
ARS acute radiation syndrome
AU astronomical unit
BFO blood forming organ
BO Badhwar-O’Neill
CAD computer-aided design
CAF Computerized Anatomical Female
CAM Computerized Anatomical Male
cm centimeter
CME coronal mass ejection
COSPAR Committee on Space Research
GCR galactic cosmic radiation
ESA European Space Agency
EVA extravehicular activity
g acceleration of gravity; gram
GeV giga electron volts
Gy Gray
HZETRN High Charge (Z) and Energy Transport
ILMH Inflatable Lunar-Martian Habitat
ISS International Space Station
kg kilogram
km kilometer
LaRC Langley Research Center
LEO low Earth orbit
LET linear energy transfer
m meter
Mars-GRAM Mars Global Reference Atmospheric Model
MeV million electron volts
mm millimeter
mph miles per hour
NASA National Aeronautics and Space Agency
NDX North Dakota Experimental
NUGFRG Nuclear Fragmentation
OLTARIS On-Line Tool for the Assessment of Radiation in Space
PER Pressurized Electric Rover
RAD Radiation Assessment Detector
RSA Russian Space Agency
Sv Sievert
SPE solar particle event
UND University of North Dakota
Z atomic number

104
REFERENCES
Badavi, F. F., Adams, D. O, and Wilson, J. W. (2010), “On the validity of the aluminum
equivalent approximation in space radiation shielding applications,” Advances in Space
Research, 46, pp. 719-727
Badavi, F. F., Wilson, J. W, and Hunter, A. (2011), “Numerical study of the generation of
linear energy transfer spectra for space radiation applications,” Advance in Space
Research, 47, pp. 1608-1615
Bartlett, D. T., Hager, L. G., and Tanner, R. J. (2003), “The determination of the neutron
component of cosmic radiation fields in spacecraft,” Radiation Measurements, 36, pp.
439-443
Borggräfe, A., Quatmann, M., and Nölke, D. (2009), “Radiation protective structures on
the base of a case study for a manned Mars mission,” Acta Astronautica, 65, pp. 1292-
1305
Carbon Fiber Tube Shop (2014),
http://www.carbonfibertubeshop.com/tube%20properties.html, accessed 27 October
2014. (This is the web site of Carbon Fiber Tube Shop, an industrial provider of carbon
fiber tubing, and therefore is a reputable source.)
CDC (2015), http://www.bt.cdc.gov/radiation/arsphysicianfactsheet.asp, accessed 29
January 2015. (This is an official Centers for Disease Control and Prevention website,
and therefore is a reputable source.)
Ceramic Industry (2014),
http://www.ceramicindustry.com/ext/resources/CI/Protected/Files/PDF/fiberglass-
compositions.pdf, accessed 27 October 2014. (This is the website of Ceramic Industry
magazine, a global forum for information exchange on the ceramic, glass, and brick
industries, and therefore is a reputable source.)
Cucinotta, F. A., Schimmerling, W., Wilson, J. W., Peterson, L. E., Saganti, P. B., and
Dicello, J. F. (2004), “Uncertainties in estimates of the risks of late effects from space
radiation,” Advances in Space Research, 34, pp. 1383-1389
Cucinotta, F. A., Kim, M. Y., and Ren, L. (2006), “Evaluating shielding effectiveness for
reducing space radiation cancer risks,” Radiation Measurements, 41, pp. 1173-1185
105
Cucinotta, F. A., Kim, M. Y., Chappell, L. J., and Huff, J. L. (2013), “How Safe Is Safe
Enough? Radiation Risk for a Human Mission to Mars,” PLOS ONE, Volume 8, Issue
10
Daga, A., Schneider, I., Uzman, Z. B., de León, P., and Harris, G. (2010) “Habitat
Architecture Concept Definition for ‘Integrated Strategies for the Human Exploration of
the Moon and Mars’ (A NASA-funded Study): Interim Status Report,” 40th International
Conference on Environmental Systems, AIAA 2010-6072
De Angelis, G., Badavi, F. F., Blattnig, S. R., Clowdsley, M. S., Nealy, J. E., Qualls, G.
D., Singleterry, R. C., Tripathi, R. K., and Wilson, J. W. (2007), “Modeling of the
Martian Environment for Radiation Analysis,” Nuclear Physics B (Proc. Suppl.), 166, pp.
184–202
De Angelis, G., Clowdsley, M. S., Singleterry, R. C., and Wilson, J. W. (2004), “A new
Mars radiation environment model with visualization,” Advances in Space Research, 34,
pp. 1328–1332
de León, P., Daga, A., Schneider, I., and Broock, L. V. (2010), “Design and Construction
of an Inflatable Lunar Base with Pressurized Rovers and Suitports,” 61st International
Astronautical Congress 2010, paper 8635
DeWitt, J. M., Benton, E. R., Uchihori, Y., Yasuda, N., Benton, E. V., and Frank, A. L.
(2009), “Assessment of radiation shielding materials for protection of space crews using
CR-39 plastic nuclear track detector,” Radiation Measurements, 44, pp. 905-908
Durante, M. and Manti, L. (2008), “Human response to high-background radiation
environments on Earth and in space,” Advances in Space Research, 42, pp. 999-1007
GESTIS (2014), http://gestis-
en.itrust.de/nxt/gateway.dll/gestis_en/000000.xml?f=templates$fn=default.htm$vid=gesti
seng:sdbeng$3.0, accessed 24 October 2014 (This is the website of the Substance
Database of the Institute for Occupational Safety and Health of German Social Accident
Insurance, and therefore is a reputable source.)
Guetersloh, S., Zeitlin, C., Heilbronn, L., Miller, J., Komiyama, T., Fukumura, A., Iwata,
Y., Murakami, T., and Bhattacharya, M. (2006), “Polyethylene as a radiation shielding
standard in simulated cosmic-ray environments,” Nuclear Instruments and Methods in
Physics Research, B, 252, pp. 319-332
Horneck, G., Facius, R., Reitz, G., Rettberg, P., Baumstark-Khan, C., and Gerzer, R.
(2001), “Critical issues in connection with human planetary missions: protection of and
from the environment,” Acta Astronautica, 49, pp. 279-288
Kim, M. Y., De Angelis, G., and Cucinotta, F. A. (2011), “Probabilistic assessment of
radiation risk for astronauts in space missions,” Acta Astronautica, 68, pp. 747-759

106
Letaw, J. R., Silberberg, R., and Tsao, C. H. (1989), “Radiation hazards on space
missions outside the magnetosphere,” Advances in Space Research, Volume 9, Number
10, pp. 285-291
NASA (2009), “Space Flight Human System Standard, Volume 1: Crew Health,” NASA-
STD-3001, p. 67
NASA (2014), http://www.nasa.gov/jpl/msl/mars-rover-curiosity-
pia17600.html#.VEWS7fnF_Sg, accessed 20 October 2014. (This is an official NASA
Jet Propulsion Laboratory website, and therefore is a reputable source.)
NIH (2014),
http://pubchem.ncbi.nlm.nih.gov//compound/169944?from=summary#section=Top,
accessed 27 October 2014. (This is an official National Institute of Health website, and
therefore is a reputable source.)
OLTARIS (2015), https://oltaris.larc.nasa.gov/ref_files/boundary_condition_ref.pdf,
accessed 6 January 2015. (This is an official NASA Langley Research Center website,
and therefore is a reputable source.)
OLTARIS (2015b), https://oltaris.larc.nasa.gov/change_log, accessed 30 January 2015.
(This is an official NASA Langley Research Center website, and therefore is a reputable
source.)
OLTARIS (2015c), https://oltaris.larc.nasa.gov/projects/new, accessed 5 February 2015.
(This is an official NASA Langley Research Center website, and therefore is a reputable
source.)
Pham, T. T. and El-Genk, M. S. (2009), “Dose estimates in a lunar shelter with regolith
shielding,” Acta Astronautica, 64, pp. 697-713
Polymer Processing (2014), http://www.polymerprocessing.com/polymers/PET.html,
accessed 24 October 2014. (This is a website that provides fundamental information for
professionals and students in the field of polymer processing, and therefore is a reputable
source.)
PourArsalan, M. and Townsend, L. W. (2013), “Emitted High Energy Light Particle Data
Base Development Using a Thermodynamic Coalescence Model,” 11th International
Conference on Nucleus-Nucleus Collisions, Journal of Physics, Conference Series 420
Reitz, G., Berger, T., and Matthiae, D. (2012), “Radiation exposure in the moon
environment,” Planetary and Space Science, 74, pp. 78-83

107
Schneider, I., Daga, A., de León, P., and Harris, G. (2010), “Interim Report for the
Human Exploration of the Moon and Mars: Space radiation protection and mitigation
strategies for a long term duration lunar base (a NASA funded study),” 40th
International
Conference on Environmental Systems, AIAA 2010-6220
Shavers, M. R., Cucinotta, F. A., and Wilson, J. W. (2001), “HZETRN: neutron and
proton production in quasi-elastic scattering of GCR heavy-ions,” Radiation
Measurements, 33, pp. 347–353
Shavers, M. R., Zapp, N., Barber, R. E., Wilson, J. W., Qualls, G., Toupes, L., Ramsey,
S., Vinci, V., Smith, G., and Cucinotta, F. A. (2004), “Implementation of ALARA
radiation protection on the ISS through polyethylene shielding augmentation of the
Service Module Crew Quarters,” Advances in Space Research, 34, pp. 1333-1337
Shinn, J. L. and Wilson, J. W. (1992), “An Efficient HZETRN (A Galactic Cosmic Ray
Transport Code),” NASA Technical Paper 3147, pp. 1-2
Simonsen, L. C., Nealy, J. E., Townsend, L. W., and Wilson, J. W. (1990), “Radiation
Exposure for Manned Mars Surface Missions,” NASA TP-2979
Simonsen, L. C., Wilson, J. W., Kim, M. H., and Cucinotta, F. A. (2000), “Radiation
exposure for human Mars exploration,” Health Physics, Volume 79, Number 5, pp. 515-
525
Sinclair, W. K. (2000), “Dose limits for astronauts,” Health Physics, Volume 79, Number
5, pp. 585-590
Singleterry, R. C., Blattnig, S. R., Clowdsley, M. S., Qualls, G. D., Sandridge, C. A.,
Simonsen, L. C., Norbury, J. W., Slaba, T. C., Walker, S. A., Badavi, F. F., Spangler, J.
L., Aumann, A. R., Zapp, E. N., Rutledge, R. D., Lee, K. T., and Norman, R. B. (2010),
“OLTARIS: On-Line Tool for the Assessment of Radiation in Space,” NASA/TP-2010-
216722
Singleterry, R. C., Blattnig, S. R., Clowdsley, M. S., Qualls, G. D., Sandridge, C. A.,
Simonsen, L. C., Slaba, T. C., Walker, S. A., Badavi, F. F., Spangler, J. L., Aumann, A.
R., Zapp, E. N., Rutledge, R. D., Lee, K. T., Norman, R. B., and Norbury, J. W. (2011),
“OLTARIS: On-line tool for the assessment of radiation in space,” Acta Astronautica, 68,
pp. 1086-1097
Slaba, T. C., Blattnig, S. R., Clowdsley, M. S., Walker, S. A., and Badavi, F. F. (2010),
“An Improved Neutron Transport Algorithm for HZETRN,” NASA/TP-2010-216199
Spillantini, P., Casolino, M., Durante, M., Mueller-Mellin, R., Reitz, G., Rossi, L.,
Shurshakov, V., and Sorbi, M. (2007), “Shielding from cosmic radiation for
interplanetary missions: Active and passive methods,” Radiation Measurements, 42, pp.
14-23

108
Stanford, M. and Jones, J. A. (1999), “Space radiation concerns for manned exploration,”
Acta Astronautica, Volume 45, Number 1, pp. 39-47
Taraba, M., Zwintz, K., Bombardelli, C., Lasue, J., Rogler, P., Ruelle, V., Schlutz, J.,
Schübler, M., O’Sullivan, S., Sinzig, B., Treffer, M., Valavanoglou, A., Quickelberghe,
M. V., Walpole, M., and Wessels, L. (2006), “Project M3-a study for a manned Mars
mission in 2031,” Acta Astronautica, 58, pp. 88-104
THREE (2014), http://three.usra.edu/articles/AstronautRadLimitsFC.pdf, accessed 1
October 2014. (This is the website of The Health Risks of Extraterrestrial Environments
[THREE], produced and managed by the Universities Space Research Association
Division of Space Life Sciences. Its articles are written by investigators and colleagues
of the NASA Space Radiation Program, and therefore is a reputable source.)
Townsend, L. W, Cucinotta, F. A., and Heilbronn, L. H. (2002), “Nuclear model
calculations and their role in space radiation research,” Advances in Space Research,
Volume 30, Number 4, pp. 907-916
Townsend, L. W., Anderson, J.A., Adamczyk, A. M., and Werneth, C. M. (2013), “Estimates of Carrington-class solar particle event radiation exposures as a function of
altitude in the atmosphere of Mars,” Acta Astronautica, 89, pp. 189-194
Tsoulfanidis, N. (1995) Measurement and Detection of Radiation. Taylor and Francis,
Washington, DC, 614pp.
Vashenyuk, E. V., Balabin, Y. V., and Miroshnichenko, L. I. (2008), “Relativistic solar
protons in the ground level event of 23 February 1956: New study,” Advances in Space
Research, 41, pp. 926–935
Wilson, J. W., Townsend, L. W., Schimmerling, W., Khandelwal, G. S., Khan, F., Nealy,
J. E., Cucinotta, F. A., Simonsen, L. C., Shinn, J. L., and Norbury, J. W. (1991),
“Transport Methods and Interactions for Space Radiations,” NASA Reference
Publication 1257, p. 103
Wilson, J. W., Shinn, J. L., Tripathi, R. K., Singleterry, R. C., Clowdsley, M. S.,
Thibeault, S. A., Cheatwood, F. M., Schimmerling, W., Cucinotta, F. A., Badhwar, G. D.,
Noor, A. K., Kim, M. Y., Badavi, F. F., Heinbockel, J. H., Miller, J., Zeitlin, C., and
Heilbronn, L. (2001a), “Issues in deep space radiation protection,” Acta Astronautica,
Volume 49, Numbers 3-10, pp. 289-312
Wilson, J. W., Cucinotta, F. A., Miller, J., Shinn, J. L., Thibeault, S. A., Singleterry, R.
C., Simonsen, L. C., and Kim, M. H. (2001b), “Approach and issues relating to shield
material design to protect astronauts from space radiation,” Materials and Design, 22, pp.
541-554

109
Wilson, J. W., Anderson, B. M., Cucinotta, F. A., Ware, J., and Zeitlin, C. J. (2006),
“Spacesuit Radiation Shield Design Methods,” 36th International Conference on
Environmental Systems (ICES), 17-20 July 2006