radar - guidance notes on scoring
TRANSCRIPT

7/29/2019 Radar - Guidance Notes on Scoring
http://slidepdf.com/reader/full/radar-guidance-notes-on-scoring 1/12
RADAR: GUIDANCE NOTES ON SCORING
INTRODUCTION
RADAR is the assessment tool, introduced by EFQM in 1999; its systematic use promptsassessors to ask simple but vitally important questions regarding the organisation they are
assessing. The answers to these questions lead to lists of strengths and areas for
improvement in each of the criterion parts in the excellence model. Whilst this is usuallythe most important part of the assessment, RADAR can also be used to derive a score for
a criterion part and, by repeated application over all 32 criterion parts, an overall score
for the organization being assessed.These guidance notes are derived from an explanatory document produced by the UK
group of assessors that was intended to help in the scoring of National and International
award applications.The following pages explain the use of the RADAR scoring matrices for Enablers and
Results separately.
SCORING OF ENABLERS
The RADAR scoring matrix builds up an Overall Score for an enabler criterion part by
combining the score for the three elements Approach, Deployment and Assessment and
Review – see below.
Approach Score for approach ……..
Deployment Score for deployment ……..
Assessment &
Review Score for assessment & review ……..
Overall Score ……..
An Assessor will apply these scoring elements to each of the Enabler criterion parts – 24
in total. In other words each Enabler criterion part will be expected to indicate the
approach taken; the degree of deployment of this approach, and the assessment & reviewcharacteristics.
J:\Training\IN\EAT\Homework\2. HW letter\HW.Attachements\Assessed

7/29/2019 Radar - Guidance Notes on Scoring
http://slidepdf.com/reader/full/radar-guidance-notes-on-scoring 2/12
RADAR logic encourages an organisation to be clear about the RESULTS it wants to
achieve, as a key part of its POLICY & STRATEGY formulation. It then needs to plan
and develop an integrated set of sound APPROACHES designed to deliver these results.These approaches require systematic implementation so that DEPLOYMENT is carried
out in a structured way. Measurement, learning and improvement activities derived from
ASSESSMENT & REVIEW are then utilized to make the approaches more effective.RADAR logic is really another classic PDCA (PLAN-DO-CHECK-ACT) cycle, where
the expectation is to :-
PLAN the approach
DO (in other words DEPLOY) the approach
CHECK (assess) the effectiveness and then
ACT on the learning by improving the approach.
Scoring the Approach
The Approach element is scored based on two principal attributes:
• Sound: The extent to which the approach has a clear rationale, defined processes
and focuses on stakeholder needs, and
• Integrated: The extent to which the approach supports policy and strategy, andis linked to other approaches where appropriate.
Sound:
The soundness of an approach requires that an organisation can explain the rationale
behind choosing it; for instance by means of research or benchmarking. A soundapproach will be underpinned by clearly defined and developed processes, and will alsofocus on the needs of the stakeholders.
Scoring the soundness of an approach will examine whether there is:-
• Solid reasoning
• A description of the relevant processes supporting the approach, and
• A link to stakeholder needs.
The more evidence presented the higher the score. A weaker ‘submission’ would merely
describe what was done, but not why or how. A role model ‘submission’ would describewhat is done, why, how, and the link to the relevant stakeholders, supported with
appropriate examples.
Thus a well-defined approach that has been based on extensive research and some best-
in-class benchmarking would tend to score in a higher box on the matrix.
J:\Training\IN\EAT\Homework\2. HW letter\HW.Attachements\Assessed

7/29/2019 Radar - Guidance Notes on Scoring
http://slidepdf.com/reader/full/radar-guidance-notes-on-scoring 3/12
If the processes are well defined, perhaps documented, and have been developed over a
period of time this would again suggest a high score. If the link to current stakeholders is
not as well supported with evidence, however, the score here might be reduced to the15% - 35% band.
Suppose the approach rationale scores around 75%, and the processes underpinning theapproach also score 75%, but there is limited focus on stakeholder needs and this only
scores 30%. The Assessor might begin by considering an arithmetic average of 75 plus
75 plus 30 (i.e.180) divided by the 3 attributes. This gives an overall score of 60% for thesoundness of approach.
Each Assessor must then judge whether this score feels right, based on the criterion part,
the type of company, the evidence, the scope and objectives of the assessment, and theattributes on the scoring matrix. This may cause the score to increase or decrease, until it
‘feels’ right.
There is no need to go into the same level of detail for every attribute of RADAR scoring but the principles are the same for each element. Each scoring element has its attributes,
which are shown on the scoring matrix.
Integrated:
The second of the two ‘approach’ attributes, integration is all about how the organisation
aligns its approach with its overall policy and strategy, as well as to approaches which are
described elsewhere in the ‘submission’ document.
The degree to which the approach has been integrated needs to be supported by
examples, and in general the more evidence provided the higher the score will become.
Scoring Deployment
Every Assessor knows that scoring deployment is tough. It is made easier with a site visit
but that does not help much while sitting down and reading a ‘submission’ document!
The Deployment element is scored based on two principal attributes:
• Implemented: The extent to which the approach is implemented, and
•
Systematic: The extent to which the deployment is carried out in a structured waywith the method used to ensure deployment being itself planned and executed
soundly.
Implemented:
The Assessor is seeking examples of the extent to which the approach has beenimplemented. This may relate to different levels within an organisation’s hierarchy;
J:\Training\IN\EAT\Homework\2. HW letter\HW.Attachements\Assessed

7/29/2019 Radar - Guidance Notes on Scoring
http://slidepdf.com/reader/full/radar-guidance-notes-on-scoring 4/12
different locations; the number of processes; the number of employees or the various
products or services being offered. The overview of the ‘submission’ document is useful
here, as it often contains relevant information about such issues.
The Assessor needs to look for words such as “all managers” or “every process” or “most
locations.” Without these terms it can be very difficult to evaluate the extent of deployment. Additional information might well be provided elsewhere in the
‘submission’, which can influence judgment of this element of RADAR scoring.
Systematic:
The Assessor must look for evidence of structure, robustness and sustainability in the
way in which deployment is planned and implemented. How methodical is thedeployment?
Perhaps an implementation plan was developed, with clear ownership, involving
extensive communication, piloting and training. The plan included a logical process thathad been followed and examples are used to support each of the features just described.
This would certainly score well against the RADAR criteria.
Scoring Assessment and Review
This feature of RADAR scoring probes into the effectiveness of reviews. In simple terms,
Assessors are looking to understand how measurement and learning processes have been
used to drive improvement.
The Assessment and Review element is scored based on three principle attributes:
• Measurement: The extent to which regular and appropriate measurement of theeffectiveness of the approach and deployment takes place.
• Learning: The extent to which learning activities take place to identify best practices
and improvement opportunities.
• Improvement: The extent to which the output from measurement and learning is
analysed and used in order to identify, prioritise, plan and implement improvements.
Measurement:
The organisation is expected to illustrate how it measures the effectiveness of its
approaches, and also how it measures the efficiency and extent of deployment of theseapproaches. It is the process of measurement that Assessors are looking for here, rather
than the results of measurement (which should of course be included under the relevant
results criterion).The measurement frequency ought to be explained together with anexplanation of why the particular mechanisms were adopted. Hence a high scoring
application will generally explain why a particular measurement process has been
employed; who owns it; how often it is applied; and how it links to a corresponding result provided under a Results criterion.
J:\Training\IN\EAT\Homework\2. HW letter\HW.Attachements\Assessed

7/29/2019 Radar - Guidance Notes on Scoring
http://slidepdf.com/reader/full/radar-guidance-notes-on-scoring 5/12
Learning:
Learning activities might include internal benchmarking, industry benchmarking, or
comparisons with the processes of best-in-class organisations (which could be from an
entirely different sector).
Other methods of learning could include the involvement of universities or research
institutes, attendance at leading edge conferences or networking activities. Whatever thelearning activities, it is clear that to score well against the ‘learning’ attribute the
organisation needs to provide some explanation for why these particular activities were
selected and the course of action followed.
Improvement:
The data obtained through measurement and learning must obviously be used to identify,
prioritise, plan and implement improvements. Ideally there will be an explanation of themechanisms used, supported with examples showing how learning is systematically:-
• Fed back into the organisation.
• Evaluated, and
• Prioritised.
Thus an explanation of the rationale for the measurement and learning processes will
result in a higher score, as will examples of how the data has been used to driveimprovements.
Overall Score
The overall score for the criterion part will derive from the scores for the separate
elements – i.e. Approach, Deployment, and Assessment and Review. The Assessor
must decide on the overall score and consider if this is appropriate in light of all that hasnow been considered. The overall score will not necessarily be the average of the three
elemental scores, but is likely to be fairly close to it.
Some final tips
•If either the approach or deployment scores zero, the overall score should also be
zero.
• If the approach is weak but the deployment is extensive, the overall score should biastowards the approach score (if the approach is not systematic it might not be sustained
into the future. In the extreme, there might be nothing to deploy).
• If assessment and review were to score zero but approach and deployment were
strong, it would be unreasonable to give an overall score of zero. Certainly the scorewill be lower than it might otherwise have been, but not zero.
J:\Training\IN\EAT\Homework\2. HW letter\HW.Attachements\Assessed

7/29/2019 Radar - Guidance Notes on Scoring
http://slidepdf.com/reader/full/radar-guidance-notes-on-scoring 6/12
Meaning of the words
Anecdotal, some evidence, evidence, clear evidence, comprehensive evidence
These words are used in the RADAR scoring matrix and allow the Assessor to categorisethe broadness and extent of the information or evidence provided in the ‘submission’
document. The words are used in scoring Enabler criterion parts only and are related
therefore to processes, methods or descriptions of procedures.
An “Anecdote” is an unsupported statement, for example :
• The CEO supports the Quality process.
• Process management underpins our activities.
In both cases the Assessor has little information upon which to judge the processes,
methods or procedures used.
Near the other end of the range we have “Clear Evidence”. This category is characterised
by:
• A clear description of the process(es) used to approach the criterion part.
• Some examples of how the process(es) is/are used in practice.
• Some numeracy – how often the process(es) is/are used, how use has varied over
time.
So, for example, the CEO’s support for the Excellence ethos might be implemented
though:
• Opening and closing all induction training courses.
• A regular (e.g.) weekly or monthly ‘walk about’ to different departments.
• All board meeting agenda ensure stakeholder perceptions are always addressed.
• Participating in establishing the criteria for recognising staff and in making
presentations to those recognised.
By providing a good description of what is done, examples of use and supporting
numerical data “Clear Evidence” would be established.
To justify a mark of “Comprehensive Evidence” the organisation could provide in
addition linkages to other criterion parts – either within the Enabler or the Results
criteria.
Having defined the lower and upper ends of evidence scale, the categories “Some
Evidence” and “Evidence” are used when the information provided exceeds our Anecdote but is less than that required of Clear Evidence.
J:\Training\IN\EAT\Homework\2. HW letter\HW.Attachements\Assessed

7/29/2019 Radar - Guidance Notes on Scoring
http://slidepdf.com/reader/full/radar-guidance-notes-on-scoring 7/12
SCORING OF RESULTS
Each of the Results criteria are made up of two parts:
• For People, Customer and Society Results, these parts relate to perception measures
and performance indicators.
• For Key Performance Results, the two parts are key performance outcomes and key performance indicators.
The perception measures and key outcomes are sometimes referred to as lagging(trailing/following) indicators; whereas the performance indicators and key performance
indicators are sometimes referred to as leading (driving) indicators. Leading indicators
are usually measured more frequently than lagging indicators and generally comprise theinternal measurements used to manage the organization day by day, week by week, etc.
It is important to realize that what may be considered indicators in one organisation may
be classified as outcomes in another. This is for the organisation to decide and to explainin their ‘submission’ document.
Let's provide some definitions.
A perception result relates to direct feedback from a stakeholder e.g. when employees
respond via an internal attitude survey.
A performance indicator is the result of a measurement process that is driven by the
organisation themselves and is entirely within their span of control e.g. measuring process cycle times or product quality.
A key performance outcome could be financial or non financial and is clearly a
fundamental measure in the context of policy and strategy.
Scoring Results criterion parts
The Overall Score for a Result criterion part is based equally on the score for Excellence
of Results (based on the attributes: Trends, Targets, Comparisons and Causes) and theattribute Scope.
Excellence of Results is based on the four attributes below:
Trends relate to positive movement of a result or sustained satisfactory or better performance over a period of time.
J:\Training\IN\EAT\Homework\2. HW letter\HW.Attachements\Assessed

7/29/2019 Radar - Guidance Notes on Scoring
http://slidepdf.com/reader/full/radar-guidance-notes-on-scoring 8/12
There has often been a debate about what constitutes a trend. For example on this chart, is
the trend over four years or five years?
1998 1999 2000 2 001 2002
0
5
10
15
20
25
30
35
For consistency of interpretation, we would suggest that this is over four years.
1999 2000
0
10
20
30
40
50
60
When there are only two points on a chart - is this a trend? We would suggest it is - but
over one year.
If a chart showed a result like this:
1997 1998 1999 2000 2001
0
10
20
30
40
50
60
70
The Assessor would be seeking an explanation of the negative trend in 1998. Combiningall of these sources of information, the Assessor must now evaluate the extent to which
any targets are appropriate. This is undoubtedly made easier when there are some other
comparisons - for example competitor performance, industry averages, national averages, best-in-class from any other sector, world class across all sectors (see following sections
on Targets and Comparisons).
J:\Training\IN\EAT\Homework\2. HW letter\HW.Attachements\Assessed
7/29/2019 Radar - Guidance Notes on Scoring
http://slidepdf.com/reader/full/radar-guidance-notes-on-scoring 9/12
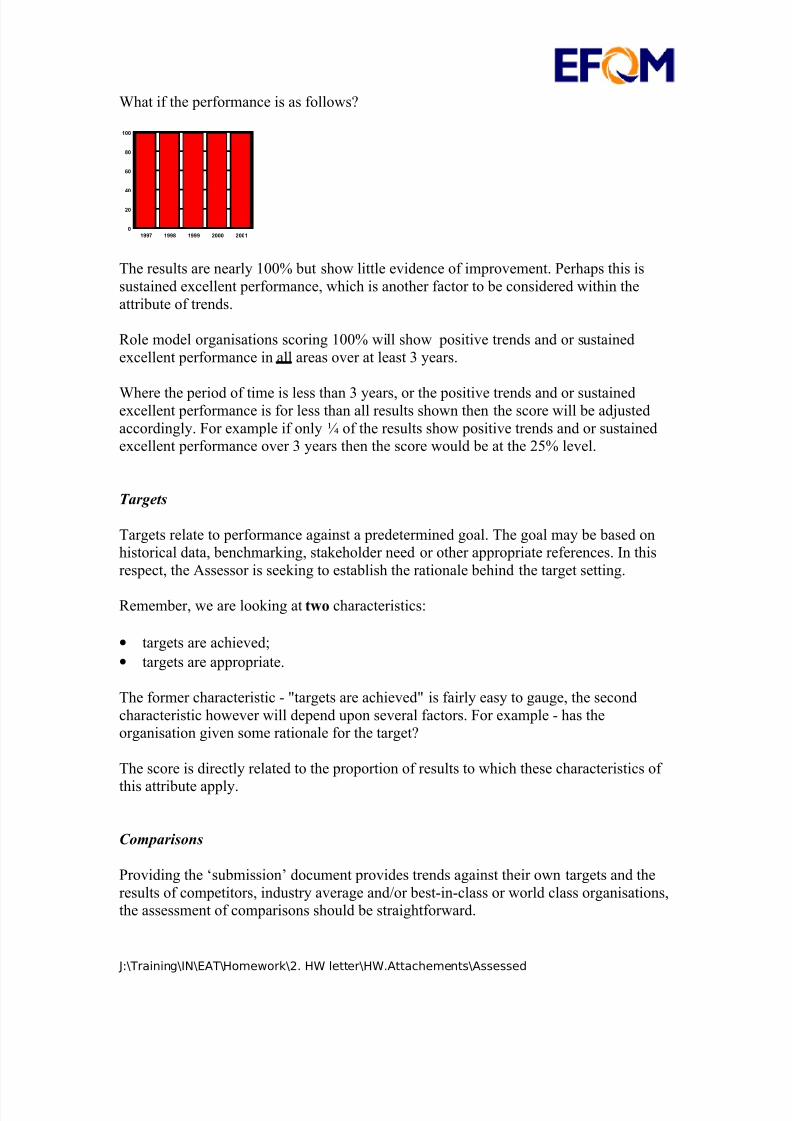
What if the performance is as follows?
1997 1998 1999 2000 2001
0
20
40
60
80
100
The results are nearly 100% but show little evidence of improvement. Perhaps this is
sustained excellent performance, which is another factor to be considered within the
attribute of trends.
Role model organisations scoring 100% will show positive trends and or sustained
excellent performance in all areas over at least 3 years.
Where the period of time is less than 3 years, or the positive trends and or sustainedexcellent performance is for less than all results shown then the score will be adjusted
accordingly. For example if only ¼ of the results show positive trends and or sustainedexcellent performance over 3 years then the score would be at the 25% level.
Targets
Targets relate to performance against a predetermined goal. The goal may be based onhistorical data, benchmarking, stakeholder need or other appropriate references. In this
respect, the Assessor is seeking to establish the rationale behind the target setting.
Remember, we are looking at two characteristics:
• targets are achieved;
• targets are appropriate.
The former characteristic - "targets are achieved" is fairly easy to gauge, the second
characteristic however will depend upon several factors. For example - has theorganisation given some rationale for the target?
The score is directly related to the proportion of results to which these characteristics of
this attribute apply.
Comparisons
Providing the ‘submission’ document provides trends against their own targets and the
results of competitors, industry average and/or best-in-class or world class organisations,the assessment of comparisons should be straightforward.
J:\Training\IN\EAT\Homework\2. HW letter\HW.Attachements\Assessed

7/29/2019 Radar - Guidance Notes on Scoring
http://slidepdf.com/reader/full/radar-guidance-notes-on-scoring 10/12
The Assessor is now making a judgment as to what extent the results of the organisation
compare to these other reference points. Comparisons are either favourable or not andthey are so for none ranging up to all cases.
The comparisons are what give the targets additional credibility.
As a minimum - Assessors are seeking comparisons with external organisations. How
and why these organisations were selected may have been covered in the Enablers butthese reasons clearly need to be understood.
Competitor and industry averages should also be addressed but for role model
organisations, comparisons with average will not be good enough - they will showcomparisons with best-in-class organisations within their own sector and with world-class
as well.
As with targets, the score is directly related to the proportion of results to which therelevant characteristics of the attribute apply.
Role model organisations will compare excellently against world class for most, if not all
of their results.
Causes
The links to approaches requires extensive evidence within the ‘submission’ document.
The more links provided by the organisation, the easier this task becomes. Clearly, issues
that have been highlighted in the Enablers, particularly under Policy and Strategy, need to be linked to the appropriate Results criterion. This is equally true of other criteria - for
example People and People Results. In a well drafted submission document the writer
will provide comprehensive cross-references that link Results to Enabler criterion parts.
The extent to which the approaches are driven by results through innovation and learning
will influence the scoring of this attribute.
In a role model organisation, all the results shown will have a tangible link back to the
approaches and have clear evidence of these links. Such leading organisations will alsoindicate how they are ensuring that their leading position will be maintained.
Scoring Scope
Whereas the list of suggested measures in the Excellence Model brochure is not achecklist, it is a good reference to the type of measures that organisations might include
in the management of their enterprise. In addressing Scope the Assessor must make a
J:\Training\IN\EAT\Homework\2. HW letter\HW.Attachements\Assessed

7/29/2019 Radar - Guidance Notes on Scoring
http://slidepdf.com/reader/full/radar-guidance-notes-on-scoring 11/12
judgment as to the relevance of the measures presented (which may include some not
listed in the latter brochure) within the business context of the organisation being
assessed.
Again, the information provided by the organisation in the Enablers criteria is the primary
source of information in respect of the scope of measures presented.
Remember, that public sector organisations may present very different (and maybe more
limited) measures than the conventional measures used by commercial enterprises andthey should not automatically be penalised for this. The question should always be "Are
the measures shown appropriate and sufficient?"
Scope also addresses the segmentation of the results presented. Generally results are
much more useful as a basis for action in a segmented form. Take an annual staff surveywhich gave as a result “there is 84% satisfaction with training across all staff”. Good in
itself perhaps but how much more useful, as a basis for action, would be this result
segmented across different levels of staff, functions or locations?
The assessor’s score for scope will take account therefore of extent to which a full rangeof results, relevant to the organisation and criterion part, is presented and the extent to
which the results are segmented to facilitate action.
Overall Score
The overall score for the criterion part will derive from the scores for Excellence of
Results and Scope. The Assessor must decide on the overall score and consider if this is
appropriate in light of all that has now been considered. The overall score will not
necessarily be the average of the two scores, but is likely to be fairly close to it.
Some examples
Case 1
Consider a company that has positive trends over at least three years for a little over half their results; targets are achieved and appropriate for about 25% of their results. They are
favourable in comparison with others in their sector in about 35% of cases but there are
no tangible links to the approaches.
We might score trends at 60
Targets at 25;Comparisons 35
and Causes at 0
Here the mathematical average for the Excellence of Results is 30% but since no Causal
link to Enablers is evident, it is likely that a lower score would be taken.
J:\Training\IN\EAT\Homework\2. HW letter\HW.Attachements\Assessed

7/29/2019 Radar - Guidance Notes on Scoring
http://slidepdf.com/reader/full/radar-guidance-notes-on-scoring 12/12
Case 2
A submission has a score for Excellence of Results 30% but the Scope score is 90%.
Should we really give a score of 60%? - probably not. Just measuring many things does
not make an organisation a role model. Most assessors in a case like this would bias their overall score to Excellence of Results score. There must be a degree of balance between
what is being measured and the excellence of what has been achieved.
Overall summary
It is usually easier to score the Results section of a ‘submission’ than the Enablers section
but it is often more difficult to write meaningful feedback without repeating the obvious -for example:
•
There are few trends;• There are few comparisons with external organisations;
• There is little evidence that results are caused by approach.
Bear this in mind when preparing feedback reports - because although the score isimportant - is the feedback of areas for improvement, which is of greatest value to the
organisation.
Role model organisations will have:
• Positive trends or sustained excellent performance over at least 3 years.• Excellent performance against their own targets the rationale for which has been
made clear.
• Evidence of being best-in-class performers in many areas when compared to
competitor, industry average and best-in-class organisations.
• Evidence of mastery over the process because all results are being caused by
approaches and there is evidence that the leading position of the organisation will bemaintained.
• The scope of results of a role model organisation will address all relevant areas.
J:\Training\IN\EAT\Homework\2. HW letter\HW.Attachements\Assessed