scoring of the bidding process on two english rail …. i am requesting the scoring for all the...
TRANSCRIPT

XXXXXXXXXXXXXXXX XXXXXXXXXXXXXXXX XXXXXXXXXXXXXXXX XXXXXXXXXXXXXXXX
XXXXXXXXXXXXX XXXXXXXXXXXXX XXXXXXXXXXXXX
Our ref: FOI 0007501 Dear XXXXXX REQUEST UNDER THE FREEDOM OF INFORMATION ACT 2000 (“the Act”) I am writing to confirm that the Department for Transport does hold some of the information you requested in your email of 23 March 2011, but has decided that not all of this information can be disclosed. Where it is not being provided the reasons are given below. Below are the questions you raised under the Act and our responses to them: Q1. I am requesting the scoring for all the bidders for Part E and Part D (for each successful and unsuccessful bidder).
The Department for Transport (DfT) received eight bidder responses for the Greater Anglia franchise. The table below shows the scoring for all bidders for Part E and Part D.
Greater Anglia
Rank Applicant
Code Part D Score
Part E Score
Overall Score
1 C 46.1% 20.0% 66.1% 2 H 45.2% 17.5% 62.7% 3 D 38.7% 17.5% 56.2% 4 A 36.4% 12.5% 48.9% 5 E 39.5% 9.2% 48.6% 6 B 31.5% 10.8% 42.3%
7 F 19.3% 8.3% 27.7%
8 G 13.7% 12.5% 26.2%
Q2. Bidders were not asked to submit a full EFQM assessment and I am requesting details of the guidance given to DfT markers on how to score the submission when only the Results section was submitted.

The information held on the guidance provided to evaluators is in the form of a marking matrix provided to all evaluators. The marking matrix is extracted from the 2010 EFQM business excellence model scoring framework. A copy of the marking matrix is attached [ANNEX A].
Q3. I am also requesting the rationale for only asking for the results section of the EFQM model and any evidence that the DfT sought advice on this from the EFQM or British Quality Foundation and what their advice was.
The first part of your question concerns the reasoning for only asking for the results section of the EFQM model. The rationale was set out in a paper for a DfT Contract Award Committee which was approved on 06 January 2011. The relevant extract from this paper concerning the rationale is below:
“The most significant change is to Part D (Transport Industry Performance & Experience) which is assessed using the EFQM Excellence Model. Many respondents to the Reforming Rail Franchising consultation process felt that the Department’s rail franchise pre-qualification process was unduly onerous and Ministers have indicated that they would like us to reduce the volume and detail of bid submissions where possible.
We propose to focus the EFQM pre-qualification evaluation on the ‘Results’ the applicant has achieved in other transport operations. This reduces the number of EFQM questions from 32 to 8. The ‘Enablers’ element of the model will still be used when the RADAR approach is applied to assess delivery plans at the bid evaluation stage. This change should significantly reduce the amount of work required both by applicants and by the Department. The project plan for GA and ICWC already assumes that the Part D evaluation time will be reduced as a result. The change also enables the proposed page limit for submissions to be reduced (see below).
We have tested the impact of ceasing to consider ‘Enablers’ by restating the Part D scores assessed for the 9 applicants for the previous aborted competitions for the GA and ET (Essex Thameside) franchises. In no case would moving from a combination of ‘Enablers’ and ‘Results’ to ‘Results’ alone have changed the overall Part D score for an applicant by as much as 5 percentage points. These scores will continue to be combined with those for the Part E (Franchise Specific) proposals. We are therefore confident that the proposed reduction in EFQM assessment work will have no material bearing on the overall weighted scores used for short-listing.”
Extract from DfT Contract Award Committee Paper (06 January 2011)
The second part of your question asks for evidence that DfT sought advice from the EFQM or British Quality Foundation on only asking for the results section of the EFQM model. I can confirm that the DfT does not hold this information.
Q4. I am also seeking information on who the markers in the DfT were and what experience of EFQM assessment and/or scoring they each had.

You have asked for information on who the markers in the DfT were as well as their experience.
In this case the information you have requested is the personal data of someone
else. I can confirm that we hold this information but that the data is being withheld under Section 40 of the Act.
The Departmental officials, who evaluated the bids, are all staff below the senior
civil service level and their personal information has been withheld under the personal information exemption at section 40(2) and 40(3) of the Freedom of Information Act 2000. These individuals are not in public facing roles and therefore have an expectation that their personal information will not be disclosed to a member of the public. It would be unfair for us to disclose their personal information to a member of the public and would contravene the first data protection principle.
I can confirm that all five DfT evaluators are EFQM qualified and possess an
appropriate range of experience. If you are unhappy with the way the Department has handled your request or with the decisions made in relation to your request you may complain within two calendar months of the date of this letter by writing to me at the above address. Please see the attached details of DfT’s complaints procedure and your right to complain to the Information Commissioner. If you have any queries about this letter, please contact me. Please remember to quote the reference number above in any future communications. Yours sincerely XXXXXXXXXXX Your right to complain to DfT and the Information Commissioner You have the right to complain about the way in which your request for information was handled and/or about the decision not to disclose all or part of the information requested. In addition a complaint can be made that DfT has not complied with its FOI publication scheme. Your complaint will be acknowledged and you will be advised of a target date by which to expect a response. Initially your complaint will be re-considered by the official who dealt with your request for information. If, after careful consideration, that official decides that his/her decision was correct, your complaint will automatically be referred to a senior independent official who will conduct a further review. You will be advised of the outcome of your complaint and if a decision is taken to disclose information originally withheld this will be done as soon as possible.

If you are not content with the outcome of the internal review, you have the right to apply directly to the Information Commissioner for a decision. The Information Commissioner can be contacted at: Information Commissioner’s Office Wycliffe House Water Lane Wilmslow Cheshire SK9 5AF

Annex A – Marking Matrix
InterCity West Coast and Greater Anglia Passenger Rail Franchises
Accreditation Questionnaire Part ‘D’ Assessment
Ref. #: Franchisee: Points Awarded: Assessor: Signed: Date:

InterCity West Coast and Greater Anglia Passenger Rail Franchise Accreditation Questionnaire Part ‘D’ Response
Instructions .................................................................................................................... 7
Introduction to RADAR© .................................................................................................... 7
Results Section ............................................................................................................... 8
1 Customer Results ................................................................................................. 8
2 Key Results ....................................................................................................... 12
3 People Results ................................................................................................... 16
4 Corporate Social Responsibility .............................................................................. 20
6 of 24

InterCity West Coast and Greater Anglia Passenger Rail Franchise Accreditation Questionnaire Part ‘D’ Response
7 of 24
Instructions
This pack contains the marking matrix for ‘Part D’ of the Accreditation Question (AQ) for the InterCity West Coast and Greater Anglia passenger rail franchises. The questions contained within Part D are based on the European Foundation for Quality Management (EFQM) Business Excellence Model©1 and scored using the Results element of the EFQM RADAR©2 approach. The questionnaire comprises of a Results Criteria section which is further sub-divided into the following elements: Results Criteria: Customer Results Key Results People Results Corporate Social Responsibility Interested Parties have been encouraged to illustrate and support their responses using operational results and examples from the last 2 years. Markers should assess the extent to which the responses fulfil the criteria for each element against a scale of 0 to 100 (illustrative examples given for each question) recording both the score (using the overall scale and the box in the lower right hand corner) and any ‘Strengths’ or ‘Weaknesses’ on the appropriate pages in this pack. All 8 scores should be recorded in the spreadsheet provided.
Introduction to RADAR©
RADAR© stands for Results, Approach, Deployment, Assessment and Refinement and reflects the requirements of what should be addressed within the results and enablers criteria. Only the results criteria are assessed in the Pre-Qualification Questionnaire. 1. Results Criteria Results measure the excellence and scope of what the organisation is delivering in terms of value to its stakeholders and the organisation’s effectiveness and efficiency. Achievements are measured against stakeholders’ perceptions, the organisation’s own targets and external comparisons. ‘Scope and Relevance, Integrity and Segmentation’: Applicants should provide Results data that is comprehensive, timely, reliable, accurate, appropriately segmented and consistent with their strategy and the needs and expectations of their relevant stakeholders. Applicants should demonstrate relationships between relevant Results and that they understand their impact on one another. The words ‘Trends’, ‘Targets’, Comparisons’ and ‘Causes’ each relate to the excellence and results presented. Trends ‘Trends’ refer to collections of data over time, relating to various parameters used to measure results. A positive trend is one showing general improvements over time. Thus 3, 6, 10, 9, 12, 11, 14 would constitute a positive trend. Of course, performance against some parameters may already be good at the start of the trend. In these cases the organisation will seek to sustain the good performance already achieved. Targets ‘Targets’ refer to the organisation’s own internal targets. For each trend of Key Results presented, the internal target should be specified – also as a trend over time. The information presented in the results criteria should indicate the reasoning behind the targets set so that a judgement can be made on whether the targets are challenging or break-through. It should also be possible to link targets to the enabler criteria – one example could be in the strategy criterion. Favourable comparison with target results means generally achieving or exceeding the trend of targets presented. Comparisons ‘Comparisons’ refer to comparisons with external organisations – against specific organisations, industry averages or acknowledged ‘Best in Class’ organisations. ‘Best in Class’ indicates that results achieved are the best of their kind – the organisation concerned may of course be in a different line of business from the organisation being assessed. If the latter is a national player, ‘Best in Class’ could be in relation to other national players. If the organisation being assessed aspires to being a global player then the search for ‘Best in Class’ should be wider. Comparisons should be made for the Key Results. Causes ‘Causes’ refer to the extent to which results occur as a consequence of a specific enabling approach or approaches, and represent the final area in which judgement needs to be taken on the excellence of results. Linking results back to the enablers will enable a measured view to be taken about the cause and effect relationship. The causes illustrated should provide confidence that positive performance will be sustained in the future.
1Copyright, European Quality Management Foundation. 2 Copyright, European Quality Management Foundation.

8 of 24
Results Section
1 Customer Results “Excellent organisations:
Develop and agree a set of performance indicators and related outcomes to determine the successful deployment of their strategy and supporting policies, based on the needs and expectations of their customers.
Set clear targets for Key Results based on the needs and expectations of their customers, in line with their chosen strategy.
Demonstrate positive or sustained good Customer Results over at least 3 years.
Clearly understand the underlying reasons and drivers of observed trends and the impact these results will have on other performance indicators and related outcomes.
Anticipate future performance and results.
Understand how the Key Results they achieve compare to similar organisations and use this data, where relevant, for target setting.
Segment results to understand the experience, needs and expectations of specific customer groups.”
When preparing their response the potential bidder should have supplied at least 2 years’ worth of relevant supporting data with respect to existing passenger service activities (rail industry or other public transport operation).
1.1. “Describe the criteria used to track and measure your customers’ perceptions of your organisation and service, and provide examples of results achieved.”
These measures are the customers’ perceptions of the organisation (obtained, for example, from customer surveys, focus groups, vendor ratings, compliments and complaints). These perceptions should give a clear understanding of the effectiveness, from the customer’s perspective, of the deployment and execution of the organisation’s customer strategy and supporting policies and processes. Depending on the purpose of the organisation, measures may focus on:
Reputation and image
Product and service value
Product and service delivery
Customer service, relationship and support
Customer loyalty and engagement
Assessor Notes Strengths: Weaknesses:

9 of 24
1.1 Score:
1.1 Describe the criteria used to track and measure your customers’ perceptions of your organisation and service and action taken to improve customer satisfaction, and provide examples of results achieved. Scope and Relevance: The scope of the results presented: - addresses the needs and expectations of relevant stakeholders; - is consistent with the strategy and policies of the organisation. The most important, Key Results are identified and prioritised. Relationships between relevant results are understood.
Relevance not established or anecdotal information
Results presented and relevance established for about ¼ of the areas
involved
Results presented and relevance established for about ½ of the areas
involved
Results presented and relevance established for about ¾ of the areas
involved
Results presented and relevance established for all of the areas involved
0 5 10 15 20 25 30 35 40 45 50 55 60 65 70 75 80 85 90 95 100
Integrity: Results are timely, reliable and accurate.
No evidence of integrity or anecdotal information
Timely, reliable and accurate for about ¼ results presented
Timely, reliable and accurate for about ½ results presented
Timely, reliable and accurate for about ¾ results presented
Timely, reliable and accurate for all results presented
0 5 10 15 20 25 30 35 40 45 50 55 60 65 70 75 80 85 90 95 100 Segmentation: Results are appropriately segmented.
No segmentation Usable segmentation for about ¼ of results
Usable segmentation for about ½ of results
Usable segmentation for about ¾ of results
Usable segmentation for all of results
0 5 10 15 20 25 30 35 40 45 50 55 60 65 70 75 80 85 90 95 100 Trends: Trends are positive and/or there is sustained good performance.
No results or anecdotal information. Positive trends and/or sustained good performance for about ¼ of results over
at least 2 years.
Positive trends and/or sustained good performance for about ½ of results over
at least 2 years
Positive trends and/or sustained good performance for about ¾ of results over
at least 2 years
Positive trends and/or sustained good performance for all results over at least
2 years
0 5 10 15 20 25 30 35 40 45 50 55 60 65 70 75 80 85 90 95 100 Targets: Targets are set for the Key Results. Targets are appropriate. Targets are achieved.
No targets or anecdotal information Appropriate and achieved for about ¼ of Key Results
Appropriate and achieved for about ½ of Key Results
Appropriate and achieved for about ¾ of Key Results
Appropriate and achieved for all Key Results
0 5 10 15 20 25 30 35 40 45 50 55 60 65 70 75 80 85 90 95 100 Comparisons: Comparisons are made for the Key Results. Comparisons are appropriate. Comparisons are favourable.
No comparisons or anecdotal information
Established, favourable and appropriate comparisons for about ¼ of Key Results
Established, favourable and appropriate comparisons for about ½ of Key Results
Established, favourable and appropriate comparisons for about ¾ of Key Results
Established, favourable and appropriate comparisons for all Key Results
0 5 10 15 20 25 30 35 40 45 50 55 60 65 70 75 80 85 90 95 100 Causes: The relationship between Results achieved and their Enablers is understood. Based on the evidence presented, there is confidence that positive performance will be sustained in the future.
No confidence on causes/anecdotal information
Enabling effect visible for about ¼ of results and some evidence that performance will be sustained
Enabling effect visible for about ½ of results and evidence that performance
will be sustained
Enabling effect visible for about ¾ of results and clear evidence that performance will be sustained
Enabling effect visible for all results and comprehensive evidence that performance will be sustained
0 5 10 15 20 25 30 35 40 45 50 55 60 65 70 75 80 85 90 95 100 1.1 Customer Results 0 5 10 15 20 25 30 35 40 45 50 55 60 65 70 75 80 85 90 95 100

10 of 24
1.2 “What internal performance indicators does your organisation use in order to monitor, understand, predict and improve its performance and to predict the perceptions of customers and stakeholders? Provide examples of results achieved, and performance results for your operation's punctuality and service reliability over the same period.”
These are the internal measures used by the organisation in order to monitor, understand, predict and improve the performance of the organisation and to predict their impact on the perceptions of its external customers. These indicators should give a clear understanding of the efficiency and effectiveness of the deployment and execution of the organisation’s customer strategy and supporting policies and processes. Depending on the purpose of the organisation examples of measures that may be focused on include:
External recognition
o Number of customer accolades and nomination for awards;
o Press coverage.
Products and services delivery:
o Competitiveness / Value for Money;
o Performance against customer based objectives;
o Defect, error and rejection rates;
o Seals of approval, environmental labels;
o Guarantee and warranty provisions;
o Complaints;
o Logistics indicators;
o Product life cycle;
o Innovation in design;
o Time to market.
Customer service, relationships and support
o Duration of relationship;
o Effective recommendations;
o Frequency / value of orders;
o Lifetime value;
o Number of complaints, compliments and commendations;
o New and/or lost services or business;
o Customer retention.
Assessor Notes Strengths: Weaknesses:

11 of 24
1.2 Score:
1.2 What internal performance indicators does your organisation use in order to monitor, understand, predict and improve its performance and to predict the perceptions of customers and stakeholders? Provide examples of results achieved, and performance results for your operation's punctuality and service reliability over the same period Scope and Relevance: The scope of the results presented: - addresses the needs and expectations of relevant stakeholders; - is consistent with the strategy and policies of the organisation. The most important, Key Results are identified and prioritised. Relationships between relevant results are understood.
Relevance not established or anecdotal information
Results presented and relevance established for about ¼ of the areas
involved
Results presented and relevance established for about ½ of the areas
involved
Results presented and relevance established for about ¾ of the areas
involved
Results presented and relevance established for all of the areas involved
0 5 10 15 20 25 30 35 40 45 50 55 60 65 70 75 80 85 90 95 100
Integrity: Results are timely, reliable and accurate.
No evidence of integrity or anecdotal information
Timely, reliable and accurate for about ¼ results presented
Timely, reliable and accurate for about ½ results presented
Timely, reliable and accurate for about ¾ results presented
Timely, reliable and accurate for all results presented
0 5 10 15 20 25 30 35 40 45 50 55 60 65 70 75 80 85 90 95 100 Segmentation: Results are appropriately segmented.
No segmentation Usable segmentation for about ¼ of results
Usable segmentation for about ½ of results
Usable segmentation for about ¾ of results
Usable segmentation for all of results
0 5 10 15 20 25 30 35 40 45 50 55 60 65 70 75 80 85 90 95 100 Trends: Trends are positive and/or there is sustained good performance.
No results or anecdotal information. Positive trends and/or sustained good performance for about ¼ of results over
at least 2 years.
Positive trends and/or sustained good performance for about ½ of results over
at least 2 years
Positive trends and/or sustained good performance for about ¾ of results over
at least 2 years
Positive trends and/or sustained good performance for all results over at least
2 years
0 5 10 15 20 25 30 35 40 45 50 55 60 65 70 75 80 85 90 95 100 Targets: Targets are set for the Key Results. Targets are appropriate. Targets are achieved.
No targets or anecdotal information Appropriate and achieved for about ¼ of Key Results
Appropriate and achieved for about ½ of Key Results
Appropriate and achieved for about ¾ of Key Results
Appropriate and achieved for all Key Results
0 5 10 15 20 25 30 35 40 45 50 55 60 65 70 75 80 85 90 95 100 Comparisons: Comparisons are made for the Key Results. Comparisons are appropriate. Comparisons are favourable.
No comparisons or anecdotal information
Established, favourable and appropriate comparisons for about ¼ of Key Results
Established, favourable and appropriate comparisons for about ½ of Key Results
Established, favourable and appropriate comparisons for about ¾ of Key Results
Established, favourable and appropriate comparisons for all Key Results
0 5 10 15 20 25 30 35 40 45 50 55 60 65 70 75 80 85 90 95 100 Causes: The relationship between Results achieved and their Enablers is understood. Based on the evidence presented, there is confidence that positive performance will be sustained in the future.
No confidence on causes/anecdotal information
Enabling effect visible for about ¼ of results and some evidence that performance will be sustained
Enabling effect visible for about ½ of results and evidence that performance
will be sustained
Enabling effect visible for about ¾ of results and clear evidence that performance will be sustained
Enabling effect visible for all results and comprehensive evidence that performance will be sustained
0 5 10 15 20 25 30 35 40 45 50 55 60 65 70 75 80 85 90 95 100 1.2 Customer Results 0 5 10 15 20 25 30 35 40 45 50 55 60 65 70 75 80 85 90 95 100

12 of 24
2 Key Results “Excellent organisations:
Develop and agree a set of key financial and non-financial results to determine the successful deployment of their strategy, based on the needs and expectations of their key stakeholders.
Set clear targets for Key Results based on the needs and expectations of their key stakeholders, in line with their chosen strategy.
Demonstrate positive or sustained good Key Results over at least 3 years.
Clearly understand the underlying reasons and drivers of observed trends and the impact these results will have on other performance indicators and related outcomes; anticipate future performance and results.
Understand how the Key Results they achieve compare to similar organisations and use this data, where relevant, for target setting.
Segment results to understand the performance levels and strategic outcomes achieved within specific areas of the organisation.”
When preparing their response the potential bidder should have supplied at least 2 years worth of relevant supporting data with respect to existing passenger service activities (rail industry or other public transport operation).
2.1. “Describe the measures used to monitor your organisation's Key Strategic Outcomes and provide examples of results achieved against financial and non-financial outcomes which demonstrate the success of your organisation’s deployment of strategy. You should include descriptions of any breaches of contract.”
These measures are key results defined by the organisation and agreed in their policy and strategies. Depending on the purpose and objectives of the organisation some of the measures contained in the guidance for Key Performance Outcomes may be applicable to Key Performance Indicators and vice versa:
Financial outcomes may include:
o Financial performance ratios;
o Financial performance bonds;
o Meeting of budgets;
o Audited accounts including income, grants and expenditures;
o Investment returns
o Surplus / Profit
Non-Financial outcomes may include:
o Market share;
o Time to market;
o Success rates as defined by the organisations mission and values statement;
o Volumes;
o Compliance with legislation and codes of practice;
o Results of statutory audits and inspections;
o Process performance. Assessor Notes Strengths: Weaknesses:
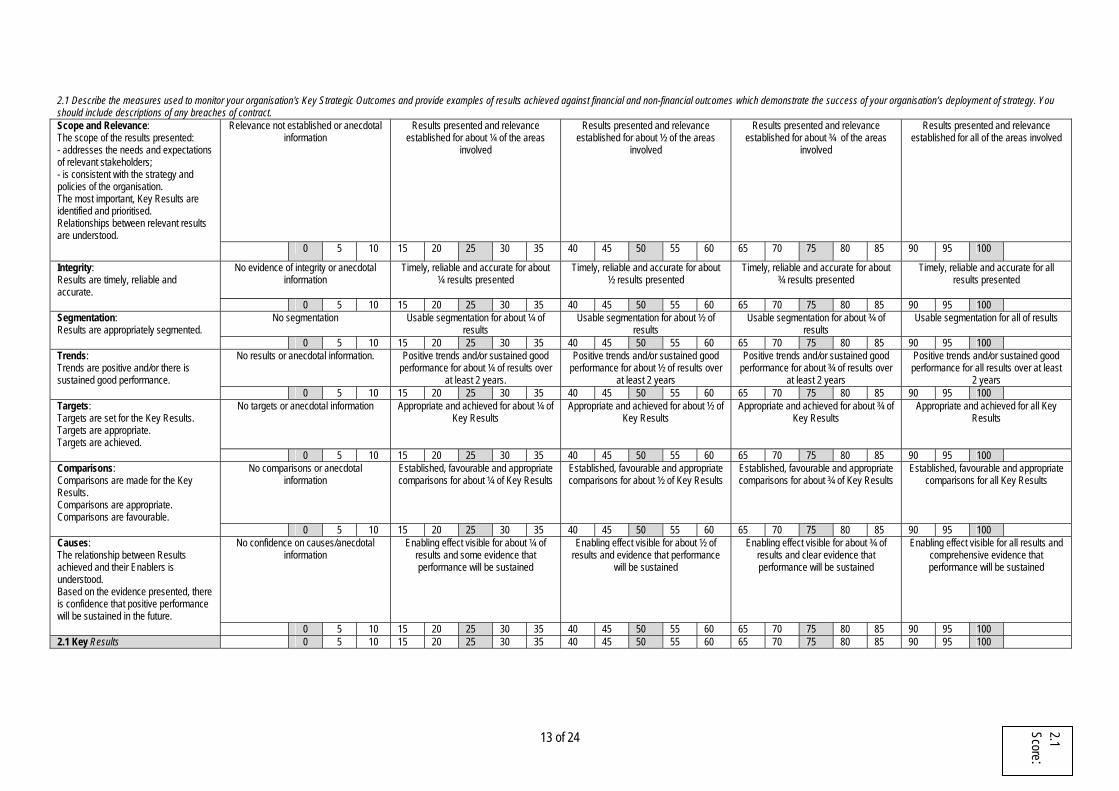
2.1 Describe the measures used to monitor your organisation's Key Strategic Outcomes and provide examples of results achieved against financial and non-financial outcomes which demonstrate the success of your organisation’s deployment of strategy. You should include descriptions of any breaches of contract. Scope and Relevance: The scope of the results presented: - addresses the needs and expectations of relevant stakeholders; - is consistent with the strategy and policies of the organisation. The most important, Key Results are identified and prioritised. Relationships between relevant results are understood.
Relevance not established or anecdotal information
Results presented and relevance established for about ¼ of the areas
involved
Results presented and relevance established for about ½ of the areas
involved
Results presented and relevance established for about ¾ of the areas
involved
Results presented and relevance established for all of the areas involved
0 5 10 15 20 25 30 35 40 45 50 55 60 65 70 75 80 85 90 95 100
Integrity: Results are timely, reliable and accurate.
No evidence of integrity or anecdotal information
Timely, reliable and accurate for about ¼ results presented
Timely, reliable and accurate for about ½ results presented
Timely, reliable and accurate for about ¾ results presented
Timely, reliable and accurate for all results presented
0 5 10 15 20 25 30 35 40 45 50 55 60 65 70 75 80 85 90 95 100 Segmentation: Results are appropriately segmented.
No segmentation Usable segmentation for about ¼ of results
Usable segmentation for about ½ of results
Usable segmentation for about ¾ of results
Usable segmentation for all of results
0 5 10 15 20 25 30 35 40 45 50 55 60 65 70 75 80 85 90 95 100 Trends: Trends are positive and/or there is sustained good performance.
No results or anecdotal information. Positive trends and/or sustained good performance for about ¼ of results over
at least 2 years.
Positive trends and/or sustained good performance for about ½ of results over
at least 2 years
Positive trends and/or sustained good performance for about ¾ of results over
at least 2 years
Positive trends and/or sustained good performance for all results over at least
2 years 0 5 10 15 20 25 30 35 40 45 50 55 60 65 70 75 80 85 90 95 100 Targets: Targets are set for the Key Results. Targets are appropriate. Targets are achieved.
No targets or anecdotal information Appropriate and achieved for about ¼ of Key Results
Appropriate and achieved for about ½ of Key Results
Appropriate and achieved for about ¾ of Key Results
Appropriate and achieved for all Key Results
0 5 10 15 20 25 30 35 40 45 50 55 60 65 70 75 80 85 90 95 100 Comparisons: Comparisons are made for the Key Results. Comparisons are appropriate. Comparisons are favourable.
No comparisons or anecdotal information
Established, favourable and appropriate comparisons for about ¼ of Key Results
Established, favourable and appropriate comparisons for about ½ of Key Results
Established, favourable and appropriate comparisons for about ¾ of Key Results
Established, favourable and appropriate comparisons for all Key Results
0 5 10 15 20 25 30 35 40 45 50 55 60 65 70 75 80 85 90 95 100 Causes: The relationship between Results achieved and their Enablers is understood. Based on the evidence presented, there is confidence that positive performance will be sustained in the future.
No confidence on causes/anecdotal information
Enabling effect visible for about ¼ of results and some evidence that performance will be sustained
Enabling effect visible for about ½ of results and evidence that performance
will be sustained
Enabling effect visible for about ¾ of results and clear evidence that performance will be sustained
Enabling effect visible for all results and comprehensive evidence that performance will be sustained
0 5 10 15 20 25 30 35 40 45 50 55 60 65 70 75 80 85 90 95 100 2.1 Key Results 0 5 10 15 20 25 30 35 40 45 50 55 60 65 70 75 80 85 90 95 100
13 of 24
2.1 Score:
14 of 24
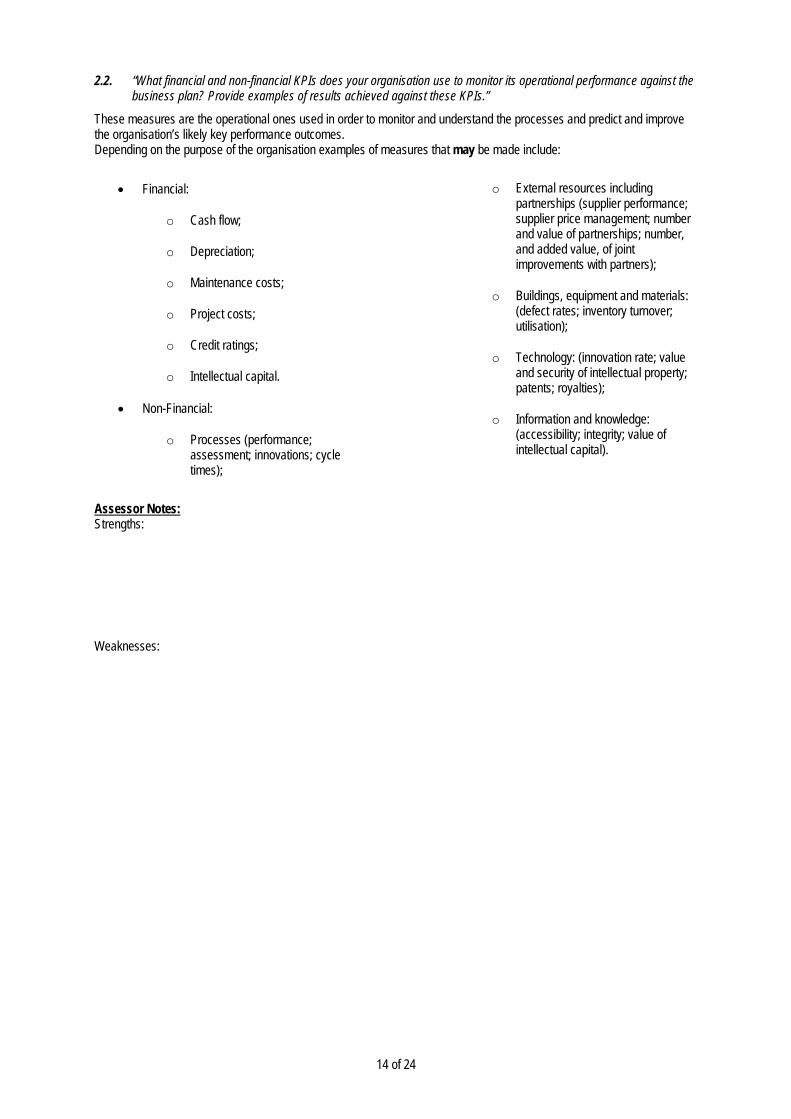
2.2. “What financial and non-financial KPIs does your organisation use to monitor its operational performance against the business plan? Provide examples of results achieved against these KPIs.”
These measures are the operational ones used in order to monitor and understand the processes and predict and improve the organisation’s likely key performance outcomes. Depending on the purpose of the organisation examples of measures that may be made include:
Financial:
o Cash flow;
o Depreciation;
o Maintenance costs;
o Project costs;
o Credit ratings;
o Intellectual capital.
Non-Financial:
o Processes (performance; assessment; innovations; cycle times);
o External resources including partnerships (supplier performance; supplier price management; number and value of partnerships; number, and added value, of joint improvements with partners);
o Buildings, equipment and materials: (defect rates; inventory turnover; utilisation);
o Technology: (innovation rate; value and security of intellectual property; patents; royalties);
o Information and knowledge: (accessibility; integrity; value of intellectual capital).
Assessor Notes: Strengths: Weaknesses:

2.2 What financial and non-financial KPIs does your organisation use to monitor its operational performance against the business plan? Provide examples of results achieved against these KPIs Scope and Relevance: The scope of the results presented: - addresses the needs and expectations of relevant stakeholders; - is consistent with the strategy and policies of the organisation. The most important, Key Results are identified and prioritised. Relationships between relevant results are understood.
Relevance not established or anecdotal information
Results presented and relevance established for about ¼ of the areas
involved
Results presented and relevance established for about ½ of the areas
involved
Results presented and relevance established for about ¾ of the areas
involved
Results presented and relevance established for all of the areas involved
0 5 10 15 20 25 30 35 40 45 50 55 60 65 70 75 80 85 90 95 100
Integrity: Results are timely, reliable and accurate.
No evidence of integrity or anecdotal information
Timely, reliable and accurate for about ¼ results presented
Timely, reliable and accurate for about ½ results presented
Timely, reliable and accurate for about ¾ results presented
Timely, reliable and accurate for all results presented
0 5 10 15 20 25 30 35 40 45 50 55 60 65 70 75 80 85 90 95 100 Segmentation: Results are appropriately segmented.
No segmentation Usable segmentation for about ¼ of results
Usable segmentation for about ½ of results
Usable segmentation for about ¾ of results
Usable segmentation for all of results
0 5 10 15 20 25 30 35 40 45 50 55 60 65 70 75 80 85 90 95 100 Trends: Trends are positive and/or there is sustained good performance.
No results or anecdotal information. Positive trends and/or sustained good performance for about ¼ of results over
at least 2 years.
Positive trends and/or sustained good performance for about ½ of results over
at least 2 years
Positive trends and/or sustained good performance for about ¾ of results over
at least 2 years
Positive trends and/or sustained good performance for all results over at least
2 years 0 5 10 15 20 25 30 35 40 45 50 55 60 65 70 75 80 85 90 95 100 Targets: Targets are set for the Key Results. Targets are appropriate. Targets are achieved.
No targets or anecdotal information Appropriate and achieved for about ¼ of Key Results
Appropriate and achieved for about ½ of Key Results
Appropriate and achieved for about ¾ of Key Results
Appropriate and achieved for all Key Results
0 5 10 15 20 25 30 35 40 45 50 55 60 65 70 75 80 85 90 95 100 Comparisons: Comparisons are made for the Key Results. Comparisons are appropriate. Comparisons are favourable.
No comparisons or anecdotal information
Established, favourable and appropriate comparisons for about ¼ of Key Results
Established, favourable and appropriate comparisons for about ½ of Key Results
Established, favourable and appropriate comparisons for about ¾ of Key Results
Established, favourable and appropriate comparisons for all Key Results
0 5 10 15 20 25 30 35 40 45 50 55 60 65 70 75 80 85 90 95 100 Causes: The relationship between Results achieved and their Enablers is understood. Based on the evidence presented, there is confidence that positive performance will be sustained in the future.
No confidence on causes/anecdotal information
Enabling effect visible for about ¼ of results and some evidence that performance will be sustained
Enabling effect visible for about ½ of results and evidence that performance
will be sustained
Enabling effect visible for about ¾ of results and clear evidence that performance will be sustained
Enabling effect visible for all results and comprehensive evidence that performance will be sustained
0 5 10 15 20 25 30 35 40 45 50 55 60 65 70 75 80 85 90 95 100 2.2 Key Results 0 5 10 15 20 25 30 35 40 45 50 55 60 65 70 75 80 85 90 95 100
15 of 24
2.2 Score:

16 of 24
3 People Results “Excellent organisations:
Develop and agree a set of performance indicators and related outcomes to determine the successful deployment of their strategy and supporting policies, based on the needs and expectations of their people.;
Set clear targets for Key Results based on the needs and expectations of their people, in line with their chosen strategy; demonstrate positive or sustained good People Results over at least 3 years.
Clearly understand the underlying reasons and drivers of observed trends and the impact these results will have on other performance indicators and related outcomes.
Anticipate future performance and results; understand how the Key Results they achieve compare to similar organisations and use this data, where relevant, for target setting.
Segment results to understand the needs and expectations of specific groups within their organisation.”
When preparing their response the potential bidder should have supplied at least 2 years worth of relevant supporting data with respect to existing passenger service activities (rail industry or other public transport operation).
3.1. “How do you measure your employees’ perceptions of your organisation? Provide examples of results achieved. “
These measures are of the people’s perception of the organisation (obtained, for example, from surveys, focus groups, interviews, structured appraisals). Depending on the purpose and objectives of the organisation examples of measures that may be made include:
Motivation:
o Career development;
o Communication;
o Empowerment;
o Equal opportunities;
o Involvement;
o Leadership;
o Opportunity to learn and achieve;
o Recognition;
o Target setting and appraisals;
o The organisation’s values, mission, vision policy and strategy;
o Training and development.
Satisfaction:
o Organisation’s administration;
o Employment conditions;
o Facilities and services;
o Health and safety conditions;
o Job security;
o Pay and benefits;
o Peer relationships;
o The management of change;
o The organisation’s environmental policy and impact;
o The organisation’s role in the community and society;
o Working environment. Assessor Notes: Strengths: Weaknesses:

3.1 How do you measure your employees’ perceptions of your organisation? Provide examples of results achieved. Scope and Relevance: The scope of the results presented: - addresses the needs and expectations of relevant stakeholders; - is consistent with the strategy and policies of the organisation. The most important, Key Results are identified and prioritised. Relationships between relevant results are understood.
Relevance not established or anecdotal information
Results presented and relevance established for about ¼ of the areas
involved
Results presented and relevance established for about ½ of the areas
involved
Results presented and relevance established for about ¾ of the areas
involved
Results presented and relevance established for all of the areas involved
0 5 10 15 20 25 30 35 40 45 50 55 60 65 70 75 80 85 90 95 100
Integrity: Results are timely, reliable and accurate.
No evidence of integrity or anecdotal information
Timely, reliable and accurate for about ¼ results presented
Timely, reliable and accurate for about ½ results presented
Timely, reliable and accurate for about ¾ results presented
Timely, reliable and accurate for all results presented
0 5 10 15 20 25 30 35 40 45 50 55 60 65 70 75 80 85 90 95 100 Segmentation: Results are appropriately segmented.
No segmentation Usable segmentation for about ¼ of results
Usable segmentation for about ½ of results
Usable segmentation for about ¾ of results
Usable segmentation for all of results
0 5 10 15 20 25 30 35 40 45 50 55 60 65 70 75 80 85 90 95 100 Trends: Trends are positive and/or there is sustained good performance.
No results or anecdotal information. Positive trends and/or sustained good performance for about ¼ of results over
at least 2 years.
Positive trends and/or sustained good performance for about ½ of results over
at least 2 years
Positive trends and/or sustained good performance for about ¾ of results over
at least 2 years
Positive trends and/or sustained good performance for all results over at least
2 years 0 5 10 15 20 25 30 35 40 45 50 55 60 65 70 75 80 85 90 95 100 Targets: Targets are set for the Key Results. Targets are appropriate. Targets are achieved.
No targets or anecdotal information Appropriate and achieved for about ¼ of Key Results
Appropriate and achieved for about ½ of Key Results
Appropriate and achieved for about ¾ of Key Results
Appropriate and achieved for all Key Results
0 5 10 15 20 25 30 35 40 45 50 55 60 65 70 75 80 85 90 95 100 Comparisons: Comparisons are made for the Key Results. Comparisons are appropriate. Comparisons are favourable.
No comparisons or anecdotal information
Established, favourable and appropriate comparisons for about ¼ of Key Results
Established, favourable and appropriate comparisons for about ½ of Key Results
Established, favourable and appropriate comparisons for about ¾ of Key Results
Established, favourable and appropriate comparisons for all Key Results
0 5 10 15 20 25 30 35 40 45 50 55 60 65 70 75 80 85 90 95 100 Causes: The relationship between Results achieved and their Enablers is understood. Based on the evidence presented, there is confidence that positive performance will be sustained in the future.
No confidence on causes/anecdotal information
Enabling effect visible for about ¼ of results and some evidence that performance will be sustained
Enabling effect visible for about ½ of results and evidence that performance
will be sustained
Enabling effect visible for about ¾ of results and clear evidence that performance will be sustained
Enabling effect visible for all results and comprehensive evidence that performance will be sustained
0 5 10 15 20 25 30 35 40 45 50 55 60 65 70 75 80 85 90 95 100 3.1 Key Results 0 5 10 15 20 25 30 35 40 45 50 55 60 65 70 75 80 85 90 95 100
17 of 24
3.1 Score:

18 of 24
3.2. “Provide examples of the measures you use to monitor, understand, predict and improve the performance of your employees and evidence of results achieved.”
These measures are the internal ones used in order to monitor, understand, predict and improve the performance of the organisation’s people and to predict their impact on perceptions. Depending on the purpose of the organisation examples of measures that may be made include:
Achievements:
o Competency requirement versus competencies available;
o Productivity;
o Success rates of training and development to meet objectives;
o External awards and recognition.
Motivation and involvement:
o Involvement in improvement teams;
o Involvement in suggestion schemes;
o Involvement in work councils;
o Levels of training and development;
o Measurable benefits of team work;
o Recognition of individuals and teams;
o Response rates to people surveys.
Satisfaction
o Absenteeism and sickness levels;
o Accident levels;
o Grievances;
o Recruitment trends;
o Staff turnover and loyalty;
o Industrial action;
o Use of organisation provided facilities and benefits.
Services provided to the organisation’s people:
o Accuracy of personnel administration;
o Communication effectiveness;
o Speed of response to enquiries;
o Training evaluation.
Assessor Notes: Strengths: Weaknesses:

3.2 Provide examples of the measures you use to monitor, understand, predict and improve the performance of your employees and evidence of results achieved Scope and Relevance: The scope of the results presented: - addresses the needs and expectations of relevant stakeholders; - is consistent with the strategy and policies of the organisation. The most important, Key Results are identified and prioritised. Relationships between relevant results are understood.
Relevance not established or anecdotal information
Results presented and relevance established for about ¼ of the areas
involved
Results presented and relevance established for about ½ of the areas
involved
Results presented and relevance established for about ¾ of the areas
involved
Results presented and relevance established for all of the areas involved
0 5 10 15 20 25 30 35 40 45 50 55 60 65 70 75 80 85 90 95 100
Integrity: Results are timely, reliable and accurate.
No evidence of integrity or anecdotal information
Timely, reliable and accurate for about ¼ results presented
Timely, reliable and accurate for about ½ results presented
Timely, reliable and accurate for about ¾ results presented
Timely, reliable and accurate for all results presented
0 5 10 15 20 25 30 35 40 45 50 55 60 65 70 75 80 85 90 95 100 Segmentation: Results are appropriately segmented.
No segmentation Usable segmentation for about ¼ of results
Usable segmentation for about ½ of results
Usable segmentation for about ¾ of results
Usable segmentation for all of results
0 5 10 15 20 25 30 35 40 45 50 55 60 65 70 75 80 85 90 95 100 Trends: Trends are positive and/or there is sustained good performance.
No results or anecdotal information. Positive trends and/or sustained good performance for about ¼ of results over
at least 2 years.
Positive trends and/or sustained good performance for about ½ of results over
at least 2 years
Positive trends and/or sustained good performance for about ¾ of results over
at least 2 years
Positive trends and/or sustained good performance for all results over at least
2 years 0 5 10 15 20 25 30 35 40 45 50 55 60 65 70 75 80 85 90 95 100 Targets: Targets are set for the Key Results. Targets are appropriate. Targets are achieved.
No targets or anecdotal information Appropriate and achieved for about ¼ of Key Results
Appropriate and achieved for about ½ of Key Results
Appropriate and achieved for about ¾ of Key Results
Appropriate and achieved for all Key Results
0 5 10 15 20 25 30 35 40 45 50 55 60 65 70 75 80 85 90 95 100 Comparisons: Comparisons are made for the Key Results. Comparisons are appropriate. Comparisons are favourable.
No comparisons or anecdotal information
Established, favourable and appropriate comparisons for about ¼ of Key Results
Established, favourable and appropriate comparisons for about ½ of Key Results
Established, favourable and appropriate comparisons for about ¾ of Key Results
Established, favourable and appropriate comparisons for all Key Results
0 5 10 15 20 25 30 35 40 45 50 55 60 65 70 75 80 85 90 95 100 Causes: The relationship between Results achieved and their Enablers is understood. Based on the evidence presented, there is confidence that positive performance will be sustained in the future.
No confidence on causes/anecdotal information
Enabling effect visible for about ¼ of results and some evidence that performance will be sustained
Enabling effect visible for about ½ of results and evidence that performance
will be sustained
Enabling effect visible for about ¾ of results and clear evidence that performance will be sustained
Enabling effect visible for all results and comprehensive evidence that performance will be sustained
0 5 10 15 20 25 30 35 40 45 50 55 60 65 70 75 80 85 90 95 100 3.2 Key Results 0 5 10 15 20 25 30 35 40 45 50 55 60 65 70 75 80 85 90 95 100
19 of 24
3.2 Score:

20 of 24
4 Corporate Social Responsibility “Excellent organisations:
Develop and agree a set of performance indicators and related outcomes to determine the successful deployment of their corporate social responsibility strategy and supporting policies, based on the needs and expectations of the relevant external stakeholders;
Set clear targets for Key Results based on the needs and expectations of their external stakeholders, in line with their chosen strategy;
Demonstrate positive or sustained good Corporate Social Responsibility Results over at least 3 years; Clearly understand the underlying reasons and drivers of observed trends and the impact these results will have on
other performance indicators and related outcomes; Anticipate future performance and results; Understand how the Key Results they achieve compare to similar organisations and use this data, where relevant,
for target setting; and Segment results to understand the experience, needs and expectations of specific stakeholders.”
When preparing their response the potential bidder should have supplied at least 2 years worth of relevant supporting data.
4.1. “How do you measure society’s perception of your organisation? Provide examples of results achieved.” These measures are of the society’s perception of the organisation (obtained for example from surveys, reports, press articles, public meetings, public representatives, governmental authorities. Some of the measures contained in the guidance for Perception Measures may be applicable to Performance Indicators and vice versa. Depending on the purpose and objectives of the organisation examples of measures that may be made include:
Image; o Responsiveness to contacts; o As a responsible member of the
community; o As an employer;
Performance as a responsible citizen; o Disclosures of information relevant to
the community; o Equal opportunity practices; o Impact on local, regional, national
and global economies; o Relationships with relevant
authorities; o Ethical behaviour; o Has a clearly defined and
implemented policy on minimum working age.
o Does not employ forced or slave labour.
Involvement in the communities where it operates:
o Involvement in education and training;
o Involvement of community bodies in relevant activities;
o Voluntary work and philanthropy. Reduction and prevention of nuisance and
harm from its operations and/or throughout the lifecycle of its products and services:
o Is not off-shoring environmentally damaging production processes;
o Health risks and accidents; o Noise and odour; o Hazards (safety); o Pollution and toxic emissions; o Analysis of the supply chain; o Environmental performance
evaluation/lifecycle evaluation. Reporting on activities to assist in the
preservation and sustainability of resources: o Choice of transport; o Ecological impact; o Reduction and elimination of waste of
materials, energy or natural resources;
o Recycling. Assessor Notes: Strengths: Weaknesses:

4.1 How do you measure society’s perception of your organisation? Provide examples of results achieved. Scope and Relevance: The scope of the results presented: - addresses the needs and expectations of relevant stakeholders; - is consistent with the strategy and policies of the organisation. The most important, Key Results are identified and prioritised. Relationships between relevant results are understood.
Relevance not established or anecdotal information
Results presented and relevance established for about ¼ of the areas
involved
Results presented and relevance established for about ½ of the areas
involved
Results presented and relevance established for about ¾ of the areas
involved
Results presented and relevance established for all of the areas involved
0 5 10 15 20 25 30 35 40 45 50 55 60 65 70 75 80 85 90 95 100
Integrity: Results are timely, reliable and accurate.
No evidence of integrity or anecdotal information
Timely, reliable and accurate for about ¼ results presented
Timely, reliable and accurate for about ½ results presented
Timely, reliable and accurate for about ¾ results presented
Timely, reliable and accurate for all results presented
0 5 10 15 20 25 30 35 40 45 50 55 60 65 70 75 80 85 90 95 100 Segmentation: Results are appropriately segmented.
No segmentation Usable segmentation for about ¼ of results
Usable segmentation for about ½ of results
Usable segmentation for about ¾ of results
Usable segmentation for all of results
0 5 10 15 20 25 30 35 40 45 50 55 60 65 70 75 80 85 90 95 100 Trends: Trends are positive and/or there is sustained good performance.
No results or anecdotal information. Positive trends and/or sustained good performance for about ¼ of results over
at least 2 years.
Positive trends and/or sustained good performance for about ½ of results over
at least 2 years
Positive trends and/or sustained good performance for about ¾ of results over
at least 2 years
Positive trends and/or sustained good performance for all results over at least
2 years 0 5 10 15 20 25 30 35 40 45 50 55 60 65 70 75 80 85 90 95 100 Targets: Targets are set for the Key Results. Targets are appropriate. Targets are achieved.
No targets or anecdotal information Appropriate and achieved for about ¼ of Key Results
Appropriate and achieved for about ½ of Key Results
Appropriate and achieved for about ¾ of Key Results
Appropriate and achieved for all Key Results
0 5 10 15 20 25 30 35 40 45 50 55 60 65 70 75 80 85 90 95 100 Comparisons: Comparisons are made for the Key Results. Comparisons are appropriate. Comparisons are favourable.
No comparisons or anecdotal information
Established, favourable and appropriate comparisons for about ¼ of Key Results
Established, favourable and appropriate comparisons for about ½ of Key Results
Established, favourable and appropriate comparisons for about ¾ of Key Results
Established, favourable and appropriate comparisons for all Key Results
0 5 10 15 20 25 30 35 40 45 50 55 60 65 70 75 80 85 90 95 100 Causes: The relationship between Results achieved and their Enablers is understood. Based on the evidence presented, there is confidence that positive performance will be sustained in the future.
No confidence on causes/anecdotal information
Enabling effect visible for about ¼ of results and some evidence that performance will be sustained
Enabling effect visible for about ½ of results and evidence that performance
will be sustained
Enabling effect visible for about ¾ of results and clear evidence that performance will be sustained
Enabling effect visible for all results and comprehensive evidence that performance will be sustained
0 5 10 15 20 25 30 35 40 45 50 55 60 65 70 75 80 85 90 95 100 4.1 Key Results 0 5 10 15 20 25 30 35 40 45 50 55 60 65 70 75 80 85 90 95 100
21 of 24
4.1 Score:

22 of 24
4.2. “Provide examples of the measures you use to monitor, understand, predict and improve the societal and
environmental performance of your organisation and evidence of results achieved.” These measures are the internal ones used by the organisation in order to monitor, understand, predict and improve the performance of the organisation and to predict perceptions of society. Depending on the purpose and objectives of the organisation examples of measures that may be made include:
Handling changes in employment levels; Dealings with authorities on issues such as:
o Certification; o Planning.
Accolades and award received: o Exchange of information in relation to
Corporate Social Responsibility good practice auditing and social reporting.
Assessor Notes: Strengths: Weaknesses:

4.2 Provide examples of the measures you use to monitor, understand, predict and improve the societal and environmental performance of your organisation and evidence of results achieved Scope and Relevance: The scope of the results presented: - addresses the needs and expectations of relevant stakeholders; - is consistent with the strategy and policies of the organisation. The most important, Key Results are identified and prioritised. Relationships between relevant results are understood.
Relevance not established or anecdotal information
Results presented and relevance established for about ¼ of the areas
involved
Results presented and relevance established for about ½ of the areas
involved
Results presented and relevance established for about ¾ of the areas
involved
Results presented and relevance established for all of the areas involved
0 5 10 15 20 25 30 35 40 45 50 55 60 65 70 75 80 85 90 95 100
Integrity: Results are timely, reliable and accurate.
No evidence of integrity or anecdotal information
Timely, reliable and accurate for about ¼ results presented
Timely, reliable and accurate for about ½ results presented
Timely, reliable and accurate for about ¾ results presented
Timely, reliable and accurate for all results presented
0 5 10 15 20 25 30 35 40 45 50 55 60 65 70 75 80 85 90 95 100 Segmentation: Results are appropriately segmented.
No segmentation Usable segmentation for about ¼ of results
Usable segmentation for about ½ of results
Usable segmentation for about ¾ of results
Usable segmentation for all of results
0 5 10 15 20 25 30 35 40 45 50 55 60 65 70 75 80 85 90 95 100 Trends: Trends are positive and/or there is sustained good performance.
No results or anecdotal information. Positive trends and/or sustained good performance for about ¼ of results over
at least 2 years.
Positive trends and/or sustained good performance for about ½ of results over
at least 2 years
Positive trends and/or sustained good performance for about ¾ of results over
at least 2 years
Positive trends and/or sustained good performance for all results over at least
2 years 0 5 10 15 20 25 30 35 40 45 50 55 60 65 70 75 80 85 90 95 100 Targets: Targets are set for the Key Results. Targets are appropriate. Targets are achieved.
No targets or anecdotal information Appropriate and achieved for about ¼ of Key Results
Appropriate and achieved for about ½ of Key Results
Appropriate and achieved for about ¾ of Key Results
Appropriate and achieved for all Key Results
0 5 10 15 20 25 30 35 40 45 50 55 60 65 70 75 80 85 90 95 100 Comparisons: Comparisons are made for the Key Results. Comparisons are appropriate. Comparisons are favourable.
No comparisons or anecdotal information
Established, favourable and appropriate comparisons for about ¼ of Key Results
Established, favourable and appropriate comparisons for about ½ of Key Results
Established, favourable and appropriate comparisons for about ¾ of Key Results
Established, favourable and appropriate comparisons for all Key Results
0 5 10 15 20 25 30 35 40 45 50 55 60 65 70 75 80 85 90 95 100 Causes: The relationship between Results achieved and their Enablers is understood. Based on the evidence presented, there is confidence that positive performance will be sustained in the future.
No confidence on causes/anecdotal information
Enabling effect visible for about ¼ of results and some evidence that performance will be sustained
Enabling effect visible for about ½ of results and evidence that performance
will be sustained
Enabling effect visible for about ¾ of results and clear evidence that performance will be sustained
Enabling effect visible for all results and comprehensive evidence that performance will be sustained
0 5 10 15 20 25 30 35 40 45 50 55 60 65 70 75 80 85 90 95 100 4.1 Key Results 0 5 10 15 20 25 30 35 40 45 50 55 60 65 70 75 80 85 90 95 100
23 of 24
4.1 Score:

24 of 24
4.1 Score: