racial inequality in employment and earnings after ... · racial inequality in employment and...
TRANSCRIPT

Racial Inequality in Employment
and Earnings after Incarceration
Bruce Western*
Harvard University
Catherine Sirois
Stanford University
February 2017
*Department of Sociology, 33 Kirkland Street, Cambridge MA 02138. E-mail: [email protected]. This research was supported by grant5R21HD073761-02 from NIH/NICHD, SES-1259013 from the National ScienceFoundation, and a grant from the Russell Sage Foundation. We gratefully acknowl-edge the significant assistance of the Massachusetts Department of Correction, theexcellent research assistance of Jennifer Arzu, and Chris Muller who commentedon an earlier draft. The data for this paper are from the Boston Reentry Study, aresearch project conducted by Bruce Western, Anthony Braga and Rhiana Kohl.

Abstract
This paper analyzes monthly employment and earnings in the year afterincarceration with survey data from a sample of individuals just releasedfrom prison. More than in earlier research, the data provide detailed mea-surement of temporary and informal employment and richly describe thelabor market disadvantages of formerly-incarcerated men and women. Wefind that half the sample is jobless in any given month and average earn-ings are well below the poverty level. Jointly modeling employment andearnings, blacks and Hispanics are estimated to have lower total earningsthan whites even after accounting for health, human capital, and criminalinvolvement. Indeed, whites have worse health and higher rates of drug ad-diction so accounting for covariates increases the estimated race/ethnicitygap in earnings. A decomposition attributes most of the earnings gaps toracial and ethnic inequalities in employment. Qualitative interviews sug-gest that whites more than blacks and Hispanics find stable, high-payingjobs through friends and family. These findings synthesize several priorempirical results and underline the unusual disadvantage of African Amer-icans at the nexus of the penal system and the labor market.

Men and women released from incarceration have trouble finding work
and are usually employed in low-wage jobs that offer little opportunity for
advancement. Poor labor market outcomes among released prisoners are
often explained by low levels of schooling, a lack of work experience, and
continuing criminal involvement. Through the effects of criminal stigma
or eroded human capital during incarceration, serving time in prison has
itself been found to reduce employment by as much as a third, and hourly
wages by ten to twenty percent (Freeman 1992; Western 2006; Mueller-
Smith 2014; cf. Kling 2006; for reviews see Western et al. 2001 and Holzer
2009).
Beyond the low incomes and high unemployment rates of released pris-
oners, incarceration for blacks and Hispanics is different from incarcera-
tion for whites. The racialization of incarceration is reflected most obvi-
ously in disparities, in which imprisonment rates are five to eight times
higher for African Americans than whites, and twice as high for Hispanics
(Tonry and Melewski 2008; Travis et al. 2014, 56–64). Prison admissions
and releases are also spatially concentrated in poor minority neighborhoods
(Clear 2007; Sampson and Loeffler 2010; Simes 2016).
In the labor market, the stigma of incarceration for black job seekers
appears to be greater than for whites (Pager 2003; Pager et al. 2009).
Whites with criminal records have better network connections to job op-
portunities than blacks and Hispanics (Sullivan 1989). African Americans
with friends and family out of prison are also less likely to recommend
them for jobs, fearing that they may be unreliable or otherwise unsuccess-
ful (Smith 2007). The influence of discrimination and networks on labor
market outcomes after incarceration resemble mechanisms for racial in-
equality observed more widely in high-poverty communities and low-wage
1

labor markets (Wilson 1996; Royster 2003). Incarceration thus appears
to be distinctively pervasive and closely connected to the social structure
of poverty in minority communities. The association between incarcera-
tion and poverty forms a novel type of compounded disadvantage affecting
minorities, and African Americans in particular, more than whites.
Despite these findings, there are few detailed studies of the labor mar-
ket experiences of released prisoners. Most quantitative studies rely on
large national surveys that miss casual and temporary employment com-
mon among highly disadvantaged workers (e.g., Freeman 1992; Grog-
ger 1995; Western 2002). Analyses of labor market outcomes in these
studies rely on standard measures of human capital, and poorly control
for the acute disadvantages—such as drug addiction and disability—of re-
leased prisoners. A few studies analyze administrative records (mostly un-
employment insurance data) that provide poor coverage of employment
among those with criminal records (e.g. Kling 2006; Pettit and Lyons 2007;
Mueller-Smith 2014; cf. Kornfeld and Bloom 1999). Audit studies are sug-
gestive of racial inequality after incarceration, but they draw from a ran-
dom sample of employers, not from those who are likely to be contacted
by job seekers with criminal records (Pager 2003). Moreover, high rates of
unemployment among released prisoners are often handled in an ad hoc
way in analyses of earnings. Problems of selection into employment are
often ignored and zero earners are often treated as a nuisance for data
analysis. In short, research on the earnings and employment of formerly-
incarcerated workers is likely to overlook the distinctive disadvantages of
released prisoners, poorly observe the labor markets in which they work,
and fail to integrate the analysis of employment and earnings under very
high rates of joblessness.
2

This paper studies the labor market experiences of a sample of men and
women who are followed from state prison in Massachusetts through their
first year after incarceration. In contrast to previous research, we use a
unique data set that was designed to measure the transition from prison
to community and the tenuous employment that follows incarceration. In-
tensive follow-up in the year after incarceration yields monthly employ-
ment and earnings data at a time when labor market experiences are very
volatile. Samples of black, white, and Hispanic former prisoners also enable
analysis of racial inequalities in employment and earnings after incarcera-
tion. We analyze monthly employment and earnings after prison release
with a hurdle model that jointly models the probability of employment and
the level of earnings, given employment. For a high-unemployment sam-
ple like released prisoners, the hurdle model incorporates the high risk of
joblessness in estimates of earnings.
EMPLOYMENT AND EARNINGS AFTER INCARCERATION
Monthly employment and earnings data in the first year after incarcera-
tion are available from the Boston Reentry Study. The BRS interviewed a
sample (N = 122) of Massachusetts state prisoners just prior to release from
incarceration and then repeatedly over a one-year follow-up period. Four
follow-up interviews at one week, two months, six months, and 12 months
after prison release yield a detailed history of work and wages. In these
data, employment is defined as working at all for pay in a given month,
including all informal, casual, and temporary jobs. Earnings includes pay
from any job, excluding illegal earnings. Earnings are measured in nominal
dollars recorded in 2012 and 2013.
3

(a) Employment
Month
Em
ploy
men
t Rat
e
0.4
0.5
0.6
0.7
2 4 6 8 10 12
●
●
●
●
●
●
●
●●
●
●●
Black
2 4 6 8 10 12
●
●
●
●
●
●
●
● ●
● ●
●
Hispanic
2 4 6 8 10 12
●
● ●
●
●
●
●
●
●
● ●
●
White
(b) Earnings
Mea
n M
onth
ly E
arni
ngs
500
1000
1500
2000
2500
3000
2 4 6 8 10 12
●
●
● ● ●
●● ●
● ●●
●
Excluding 0'sIncluding 0's ●
Black
2 4 6 8 10 12
●●
●● ●
● ●● ●
●●
●
Excluding 0'sIncluding 0's ●
Hispanic
2 4 6 8 10 12
●
●
● ●●
●
●
● ●●
●
●
Excluding 0'sIncluding 0's ●
White
Figure 1. In the twelve months after prison release: (a) monthly employmentrate by race and ethnicity; (b) mean monthly earnings including zero earners andexcluding zero earners by race and ethnicity, Boston Reentry Study (N = 122).
4
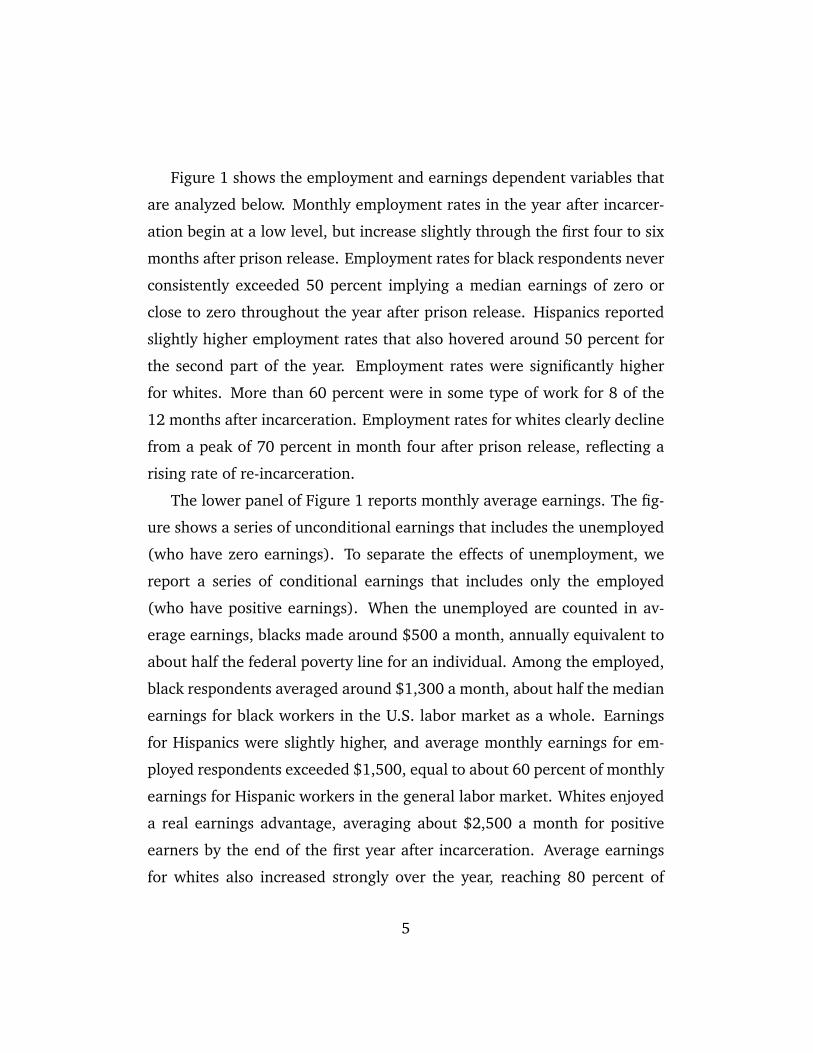
Figure 1 shows the employment and earnings dependent variables that
are analyzed below. Monthly employment rates in the year after incarcer-
ation begin at a low level, but increase slightly through the first four to six
months after prison release. Employment rates for black respondents never
consistently exceeded 50 percent implying a median earnings of zero or
close to zero throughout the year after prison release. Hispanics reported
slightly higher employment rates that also hovered around 50 percent for
the second part of the year. Employment rates were significantly higher
for whites. More than 60 percent were in some type of work for 8 of the
12 months after incarceration. Employment rates for whites clearly decline
from a peak of 70 percent in month four after prison release, reflecting a
rising rate of re-incarceration.
The lower panel of Figure 1 reports monthly average earnings. The fig-
ure shows a series of unconditional earnings that includes the unemployed
(who have zero earnings). To separate the effects of unemployment, we
report a series of conditional earnings that includes only the employed
(who have positive earnings). When the unemployed are counted in av-
erage earnings, blacks made around $500 a month, annually equivalent to
about half the federal poverty line for an individual. Among the employed,
black respondents averaged around $1,300 a month, about half the median
earnings for black workers in the U.S. labor market as a whole. Earnings
for Hispanics were slightly higher, and average monthly earnings for em-
ployed respondents exceeded $1,500, equal to about 60 percent of monthly
earnings for Hispanic workers in the general labor market. Whites enjoyed
a real earnings advantage, averaging about $2,500 a month for positive
earners by the end of the first year after incarceration. Average earnings
for whites also increased strongly over the year, reaching 80 percent of
5

monthly earnings for whites in the labor market as a whole (see Bureau of
Labor Statistics 2014, 7).
Labor market research on those leaving prison has mainly focused on
the effects of incarceration, rather than variability in employment and earn-
ings among those who have been incarcerated. Still, similar to the Boston
data, published tabulations with national survey data and administrative
records also show a relatively low level of wages among formerly-incarcerated
blacks and Hispanics compared to whites (Western 2002; Lyons and Pettit
2011). Large race effects, indicating the low economic status of blacks and
Hispanics, have also been widely estimated while controlling for incarcera-
tion in studies of administrative data and national surveys (Grogger 1995;
Western 2002; Lyons and Pettit 2011; Geller et al. 2011).
RESEARCH ON POST-INCARCERATION EMPLOYMENT
Two main lines of research have studied the labor market experiences of
men and women released from prison. One examines racial inequalities
in which formerly-incarcerated African Americans and Hispanics, through
the effects of criminal stigma and social networks, face greater obstacles
to employment than whites. Other work attributes poor labor market out-
comes among all released prisoners to pre-existing human capital deficits,
behavioral problems, and criminal involvement.
The labor market disadvantage of formerly-incarcerated minorities has
been traced to intensified criminal stigma and weak network connections
to employment. Devah Pager’s (2007; Pager et al. 2009) audit studies in
Milwaukee and New York City found that callback rates for white job seek-
ers with criminal records were two to three times higher than for black
6
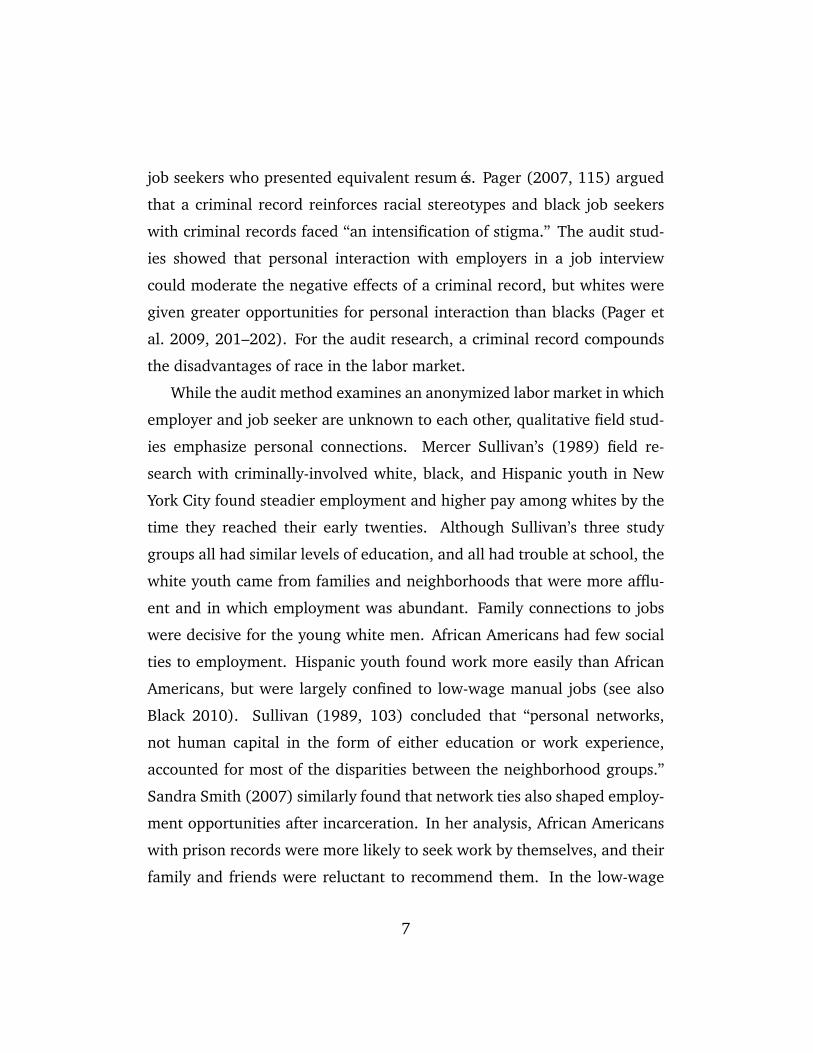
job seekers who presented equivalent resumés. Pager (2007, 115) argued
that a criminal record reinforces racial stereotypes and black job seekers
with criminal records faced “an intensification of stigma.” The audit stud-
ies showed that personal interaction with employers in a job interview
could moderate the negative effects of a criminal record, but whites were
given greater opportunities for personal interaction than blacks (Pager et
al. 2009, 201–202). For the audit research, a criminal record compounds
the disadvantages of race in the labor market.
While the audit method examines an anonymized labor market in which
employer and job seeker are unknown to each other, qualitative field stud-
ies emphasize personal connections. Mercer Sullivan’s (1989) field re-
search with criminally-involved white, black, and Hispanic youth in New
York City found steadier employment and higher pay among whites by the
time they reached their early twenties. Although Sullivan’s three study
groups all had similar levels of education, and all had trouble at school, the
white youth came from families and neighborhoods that were more afflu-
ent and in which employment was abundant. Family connections to jobs
were decisive for the young white men. African Americans had few social
ties to employment. Hispanic youth found work more easily than African
Americans, but were largely confined to low-wage manual jobs (see also
Black 2010). Sullivan (1989, 103) concluded that “personal networks,
not human capital in the form of either education or work experience,
accounted for most of the disparities between the neighborhood groups.”
Sandra Smith (2007) similarly found that network ties also shaped employ-
ment opportunities after incarceration. In her analysis, African Americans
with prison records were more likely to seek work by themselves, and their
family and friends were reluctant to recommend them. In the low-wage
7

labor market where employers often rely on referrals, poor black job seek-
ers with criminal records were disadvantaged by social networks that were
uncooperative and distrusting.
Racial inequalities in employment for released prisoners emerge in con-
texts in which discrimination and network effects have been observed more
broadly in urban low-wage labor markets. Thus William Julius Wilson
(1996) describes the reluctance of employers to hire young black men
because of concerns about their reliability and honesty. Deirdre Roys-
ter (2003) in her study of young black and white job seekers finds that
whites were more likely to be connected by teachers and older white men
to steady, blue-collar jobs.
Economic life after incarceration is embedded in this larger racially-
differentiated structure of opportunities that confronts low-skill workers.
After incarceration, whites face less discrimination and have stronger so-
cial ties to employment. A few qualitative studies indicate high rates of
Hispanic employment compared to blacks but largely in secondary labor
market, low-wage, jobs (Sullivan 1989; Black 2010). African Americans
face the greatest stigma after incarceration, and the greatest isolation from
employment opportunities. The stigma and social network accounts of the
economic disadvantage of blacks and Hispanics after incarceration together
form a theory of compounded disadvantage in which racial inequalities in
incarceration are amplified in the labor market after release (Lyons and
Pettit 2011).
Labor market outcomes may be poor among formerly-incarcerated blacks
and Hispanics, but most released prisoners—regardless of race or ethnicity—
face significant obstacles to steady employment. Our analysis studies dif-
ferences in employment and earnings among blacks, whites, and Hispan-
8

ics, accounting for three main sources of unemployment and low wages:
deficits of health and human capital, criminal involvement, and prepara-
tion for employment in the transition from prison to community.
Formerly-incarcerated men and women average low levels of schooling
that is a significant disadvantage in the labor market. In addition to widely
observed educational deficits, the poor health of the prison population also
reduces their readiness for work. The incarcerated suffer from high rates of
infectious and chronic disease, mental illness, and disorders related to sub-
stance use (Wildeman and Muller 2012; Travis et al. 2014, 202–232). Drug
use itself can be disabling for employment, particularly for those with his-
tories of addiction (Henkel 2011). Health problems are often co-occurring,
creating impediments to employment (Schnittker 2012). To capture the
effects of health and human capital, we control for high school dropout,
chronic pain and disability, and a self-reported history of drug and alcohol
abuse.
The worlds of crime and legal work can compete for the time and en-
ergy of released prisoners. The formerly-incarcerated may stay out of the
formal labor market where they continue to rely on income from the drug
trade or other illegal work. Those who continue to be criminally-involved
after incarceration face a higher risk of re-incarceration which, of course,
also prevents employment. To account for continuing criminal involvement
after incarceration, we control for re-incarceration and a time varying mea-
sure of criminal activity.
Finally, research on the transition from prison to community empha-
sizes the moment of prison release as influential for social integration af-
ter incarceration (Visher and Travis 2003; Western et al. 2015). Because
prison release is a cumulative social process, a bad start marked by idle-
9

ness and estrangement from family may hamper job searching and other
forms of self-help in the following months. Released prisoners also vary
greatly in their employability. Those with a work history, a work release
job in prison, stable housing upon release, and a driver’s license are more
equipped to search for work and are relatively employable at the point of
prison release. Our analysis controls for social isolation and readiness for
employment immediately after release from incarceration.
Rich covariate data in the Boston Reentry Study allows an analysis that
accounts for the unusual frailty of the prison population, its criminal in-
volvement, and the conditions of transition from prison to community.
While these explanations help account for the very low earnings of all pris-
oners, they may also account for racial inequalities after incarceration. If
educational attainment, health status, employability, and rates of criminal
desistance are lower among blacks and Hispanics, this may explain poor la-
bor market outcomes after prison release. In this case, incarceration would
be less a source of cumulative racial disadvantage, than a marker of the
extreme social and economic marginalization that was significantly estab-
lished prior to incarceration.
A HURDLE MODEL FOR EMPLOYMENT AND EARNINGS
Analyzing earnings in a sample with a high rate of unemployment is chal-
lenging because there is little consensus about analyzing those with zero
earnings. Studies of formerly-incarcerated workers have omitted zero earn-
ers (Waldfogel 1994; Nagin and Waldfogel 1998; Lyons and Pettit 2011),
imputed a small positive constant for log transformation (Western 2006),
or provided little detail about the analysis of zero earners (Kling 2006;
10

Lyons and Pettit 2011). These ad hoc approaches are unsatisfactory be-
cause unemployment rates among released prisoners are high and theoret-
ically important, selection into employment is nonrandom, and analysis of
positive earnings over-estimates economic well-being (Western and Pettit
2005).
Our approach views earnings after incarceration as depending on two
distinct processes: an employment process (getting a job), and an earnings
process (getting paid, having found a job). In each month, t (t = 1, . . . ,12),
respondent i (i = 1, . . . , N) is paid monthly earnings, yi t , that may be zero if
the respondent is not employed. We fit an augmented hurdle model, that
includes a logistic regression for the probability of employment, pi t , and a
log-normal regression on earnings, conditional on being employed. If xi t is
a vector of covariates (including an intercept), Bi is a dummy variable for
black respondents, and Hi is a dummy variable for Hispanic respondents,
then the employment and earnings processes are written:
logit(pi t ) =α1Bi +α2Hi +x′i tα3 +τt +γi ,
log yi t =β1Bi +β2Hi +x′i tβ3 +θt +δi +ui t ,
where the earnings regression is conditional on employment (yi t > 0), τt
and θt are time fixed effects, and γi and δi are respondent-level random ef-
fects assumed to have a normal distribution, with zero mean and indepen-
dent of all covariates. Random effects adjust standard errors for clustering
arising from the panel structure of the data. Instead of random effects, we
could fit respondent fixed effects but coefficients of key interest, for time-
invariant predictors, would be unidentified. Assuming yi t is log normal,
the errors in the earnings equation, ui t , follow a normal distribution. We
augment the hurdle model by allowing the random effects γi and δi to be
11

correlated. Correlation of the random effects, ρ, adjusts coefficients for the
earnings process for the propensity to employment (see Min and Agresti
2005 for a similar model; the Appendix details the model and estimation).
The correlation of the random effects is similar to the correlated errors in
the conventional sample selection model (Heckman 1979).
In contrast to truncation or sample selection models, the hurdle model
counts unemployment as producing an earnings of zero. The employ-
ment and earnings processes are described by separate sets of parameters.
Jointly modelling employment and earnings provides a type of sample-
selection adjustment where earnings coefficients are attenuated for respon-
dents with a high probability of unemployment. Although covariates for
the model are motivated by causal accounts of the determinants of earn-
ings, we treat the model as a data description. Interest centers on the
race/ethnicity gaps in earnings and employment—measures of labor mar-
ket inequality obtained after covariate adjustment.
DATA
The BRS data on monthly employment and earnings is constructed from
four interviews conducted in the year after prison release. The BRS sample
includes male and female prisoners and is representative of prison release
cohorts from Massachusetts returning to Boston (Western et al. 2015). Like
the national prison population, the BRS sample has a low level of average
schooling, is disproportionately black and Hispanic, and has little history
of employment.
Monthly employment and earnings were measured with survey ques-
tions that asked respondents about all jobs and earnings since the last inter-
12

view. Measurement in this way captured all incomes from work including,
for example, day labor for cash helping with home improvements or snow
clearance for a family member. Employment and earnings also includes all
formal employment that ranges from hourly jobs in food service to skilled
jobs as unionized workers in the construction industry. The survey inter-
views were also supplemented with more open-ended conversations with
respondents, yielding qualitative data on job search and hiring.
Covariates used in the regression analysis are reported in Table 1. Re-
spondents’ health and human capital is measured by indicators for high
school dropout, time-invariant measures of chronic pain, and a self-reported
history of drug addiction. To measure the transition from prison to com-
munity, we include scales for employability and social isolation. Criminal
involvement is measured with a scale that records new criminal charges,
illegal income, and drug use. We also include a monthly dummy variable
indicating whether a respondent was incarcerated in the current month.
The regressions also control for age (coded as four discrete categories) and
sex.
Our interest centers on the race/ethnicity gaps in earnings and employ-
ment. Race and ethnicity is coded as three categories for non-Hispanic
blacks, non-Hispanic whites, and Hispanics. Non-Hispanic blacks include
mostly African Americans but also a small number of respondents of Cape
Verdean and West Indian descent. Hispanics are mostly Puerto Rican but
the sample also includes a few Dominicans, Hondurans, and a few respon-
dents of unspecified Hispanic origin. The white ethnicities reported to us
by respondents included mostly Irish, Italian, and Portuguese.
Descriptive statistics for the variables used in the regression analysis are
reported in Table 2. Whites tend to be somewhat older with slightly higher
13

Table 1. Variables used in regression analysis of monthly employment andearnings in the year after prison release.
Variable DescriptionDependent variables
Employed Dummy variable for positive monthly earningsMonthly earnings Continuous measure of earnings in dollars from all jobs in
a given month
DemographicsRace/ethnicity Categorical variable for blacks, whites, and Hispanics re-
ported at baseline, coded as dummy variables for blacksand Hispanics
Age Conded as four discrete categories: under age 30, 30 to 39,40 to 49, over age 50.
Female Dummy variable for female respondents
Health and Human CapitalH.S. dropout Dummy variable for no high school diploma including
GED’sChronic pain or disability Dummy variable for back pain, arthritis, or a physical dis-
ability reported at baselineDrug addiction Dummy variable for a history of addiction or substance
abuse reported at baseline
Transition from prisonEmployability at release Standardized scale summing four indicators of employabil-
ity at prison release: employment prior to arrest, a workrelease job in prison, a valid driver’s license at release, andstable housing at release (not in a homeless shelter or onthe streets)
Isolation in first week Standardized scale summing time spent without family andin no activity in the first week after release
Criminal involvementCrime scale Time-varying standardized scale summing three indicators
of criminal behavior at each survey wave: criminal charge,use of illegal drugs, and illegal income. Charge is codedfrom arrest records; drugs and illegal income are self-reported.
Re-incarceration Time-varying dummy variable for re-incarcarceration in agiven month, coded from court records.
14

Table 2. Means of employment, earnings, and covariates by race, Boston ReentryStudy.
Race/EthnicityWhite Black Hispanic Total
Dependent variablesEmployed .63 .50 .52 .54Monthly earnings ($) 1384.39 700.18 755.65 913.20Monthly positive earnings ($) 2184.74 1394.93 1453.18 1676.61
DemographicsAge (years) 39.81 35.32 33.52 36.29Female .10 .18 .09 .14
Health and Human CapitalHigh school dropout .49 .63 .76 .62Chronic pain or disability .48 .34 .14 .34Drug addiction .77 .39 .48 .52
Transition from prisonEmployability at release −.15 .06 .09 .00Isolation in first week .19 −.10 −.03 .00
Criminal involvementCrime scale .35 −.13 −.19 .00Re-incarceration .09 .04 .10 .07
No. of respondents 36 58 22 116No. of observations 377 649 250 1276
15

levels of education compared to blacks and Hispanics. Whites were also
more likely to be in poorer health and report higher rates of drug addiction.
High levels of substance use and poor health among white prisoners does
not appear to be specific to the Boston sample as similar patterns are re-
ported in national data (National Center on Addiction and Substance Abuse
2010; Maruschak et al. 2015). High rates of drug addiction among whites
is associated with greater illegal drug use after incarceration, contributing
to a relatively high level of criminal involvement. At the time of prison re-
lease, whites scored lower on the employability index and were more likely
to be socially isolated in the first week after incarceration. Thus whites
enjoyed higher rates of employment and earnings after incarceration, but
the descriptive statistics indicate they are relatively disadvantaged by their
health, criminal involvement, drug use and sociability.
A large number of alternative measures could also be used to account
for poor employment outcomes of formerly-incarcerated men and women.
Our data analysis experimented with measures of housing, family support,
mental illness, chronic disease, histories of childhood trauma, time served
in prison, parole supervision, and a variety of other variables. The results
we report below on race and ethnicity gaps in employment and earnings are
robust to a wide variety of other specifications with alternative covariates.
RESULTS
Estimates from the hurdle model indicate the large employment and earn-
ings disadvantages of blacks and Hispanics that persist even after control-
ling for addiction, physical disability, and the stress of transition in the first
weeks after prison release. We supplement the quantitative results with
16

qualitative evidence from interviews with the BRS respondents.
Evidence from the Model Estimates
Regression estimates from the hurdle model are reported in Table 3. We
first fit a model that includes only the race effects, along with respondent
random effects, and time fixed effects for each month of observation. The
employment and earnings coefficients show large race and ethnic dispar-
ities. The odds of employment for blacks are only a quarter as large as
for whites. The odds of Hispanic employment are only a third of that for
whites, although this difference is not estimated precisely. The earnings
equation also indicates large racial and ethnic inequalities. Blacks take
home just two-thirds of the earnings of whites (exp[−.409] = .66). The
Hispanic-white earnings gap is somewhat smaller and is not estimated
precisely which may reflect the relatively small number of Hispanics and
whites in the sample.
Controlling for covariates, the coefficients for blacks and Hispanics in-
crease in magnitude because of the observed disadvantage of white re-
spondents. The black employment coefficient nearly doubles when covari-
ates are controlled, and the odds of white employment are about 14 times
higher (exp[2.621] = 13.7) than for observably similar blacks. The odds of
employment among whites are six times higher (exp[1.797] = 6.0) than for
Hispanics similarly reflecting the relative health and criminal desistance
among formerly-incarcerated Hispanics.
The earnings equation also indicates the economic advantage of em-
ployed whites, adjusting for covariate characteristics. Similar to the simple
model that omits covariates, estimates indicate that employed blacks earn
just two-thirds that of employed whites (exp[−.445] = .64). Hispanic respon-
17

Table 3. Results from correlated hurdle model of monthly employment (logistic re-gression) and log earnings (linear regression) in a sample of formerly-incarceratedmen and women, Boston Reentry Study. (Standard errors in parentheses.)
Positive Log Positive LogEmployment Earnings Employment Earnings
Intercept .184 6.572 3.241 6.837(.677) (.204) (1.165) (.307)
Race or EthnicityBlack −1.365 −.409 −2.621 −.445
(.782) (.225) (.884) (.244)
Hispanic −.856 −.337 −1.797 −.374(1.021) (.296) (1.095) (.319)
Health and Human CapitalChronic pain − − −.457 −.018
(.830) (.241)
Drug addiction − − −1.479 .068(.840) (.238)
H.S. dropout − − −1.433 −.462(.759) (.217)
Criminal involvementCrime or arrest − − −.033 −.051
(.166) (.046)
Re-incarceration − − −6.141 −3.821(1.124) (.281)
Transition from prisonEmployability − − .974 .079
(.372) (.107)
Social isolation − − −.255 −.273(.390) (.115)
Cross-correlation (ρ) .724 .669No. of respondents 116 116No. of observations 1276 1276
Note: All models include monthly fixed effects, and random effects for each re-spondent. Full models also include controls for age and sex.
18

dents also earn less than whites on average, although in this case—as in the
simple model—the white-Hispanic gap is not statistically significant.
Other coefficients indicate low employment rates for high school drop
outs and those with histories of drug addiction. Chronic pain is also neg-
atively associated with employment but is not statistically significant. Re-
incarceration is strongly related to unemployment and low earnings. Fi-
nally, employability and social isolation at prison release are also closely
related to subsequent earnings and employment. A standard deviation in-
crease in the employability scale is associated with more than doubling the
odds of employment. A standard deviation increase in the social isolation
scale is associated with a 25 percent reduction in earnings.
Because total earnings depends on employment and the level of positive
earnings, regression coefficients cannot be directly interpreted in terms of
the marginal effects of covariates on total earnings. To simplify interpreta-
tion, we can calculate marginal race and ethnicity gaps in earnings, fixing
the covariates at their mean values and averaging over the employment
and earnings equations. For given values of the covariates, x, total annual
earnings is given by, y = p y , where p is the predicted monthly employment
rate, and y is the predicted level of positive monthly earnings. (We set ran-
dom effects to zero and average over time fixed effects to calculate rates
of employment and earnings.) Estimates of total annual earnings can be
used to calculate marginal earnings gaps between blacks and whites, and
Hispanics and whites. Writing the earnings gap as a function of the em-
ployment rate and the average level of positive earnings yields a simple
decomposition. For example, for the earnings gap between blacks (B) and
19

whites (W ):
yW − yB = pW yW − pB yB
= yW (pW − pB ) + pB (yW − yB ).
We call the first term the employment component, reflecting the contribu-
tion of the racial gap in employment, pW − pB , to the overall earnings gap.
We call the second term the earnings component, reflecting the contribu-
tion of the racial gap in positive earnings, yW − yB , to the overall earnings
gap. (Each term can be annualized by multiplying by 12.) Table 4 reports
the decomposition of total annual earnings based on unadjusted estimates
from the simple models with no covariates, and regression-adjusted esti-
mates of the total earnings gaps that set all covariates to their mean values.
Without regression adjustment, the white-black gap in annual earnings
is estimated to be over $6,400, about 80 percent of the total annual earn-
ings for black respondents. About two-thirds of the race gap in total annual
earnings is attributable to the high rate of joblessness among formerly-
incarcerated blacks. Only about a third of the total earnings gap is asso-
ciated with the low level of pay among formerly-incarcerated blacks who
found employment. Because formerly-incarcerated whites are relatively
disadvantaged by their poor health and drug use, the regression adjusted
gap in total earnings is larger than the unadjusted gap. For observably
identical blacks and whites, blacks are estimated to earn more than $7,000
less than whites in the first year after prison release. About 80 percent
(5647/7045 = .80) of this race gap in earnings is attributable to the large
and statistically significant race gap in employment.
The lower panel in Table 4 reports the white-Hispanic gap in total earn-
ings. With relatively few whites and Hispanics in the small BRS sample,
20

Table 4. Marginal white-black and white-Hispanic gaps in total earnings, decom-posed into employment and earnings components. (Standard errors in parenthe-ses.)
RegressionUnadjusted Adjusted
White-Black Earnings GapEmployment component 4225 5647
(2572) (2089)
Earnings component 2230 1397(1375) (889)
Total difference 6455 7045(3417) (2609)
White-Hispanic Earnings GapEmployment component 2635 3589
(3084) (2418)
Earnings component 2085 1655(2065) (1652)
Total difference 4720 5245(4233) (3281)
Note: Marginal effects are calculated from predicted employment, positivemonthly earnings, and total annual earnings, setting covariates at mean valuesand random effects to zero.
21

the earnings differences are not statistically significant. Still the pattern
of results is similar to those we obtained for white-black earnings inequal-
ity. Whites earn on average $4,720 more than Hispanics, about 50 per-
cent of annual Hispanic earnings in the year after prison release. Like the
white-black gap in earnings, over half the white-Hispanic gap in earnings
is attributable to differences in employment. The regression-adjusted gap
in earnings is slightly larger than the unadjusted gap. About 70 percent
of the regression-adjusted gap between whites and Hispanics is related to
the relatively low rate of employment among Hispanics after incarceration
(3589/5245 = .68).
In sum, averaging over the employment and earnings equations shows
that whites enjoy a large earnings advantage over blacks and Hispanics in
the year after prison release. The earnings advantage is undiminished by
accounting for differences in health, human capital, criminal involvement,
and the transition from prison to community. The large earnings gap results
more from the high rate of unemployment among formerly-incarcerated
minorities, than the relatively low wages among those that find employ-
ment. Unemployment, not pay, is the main driver of racial inequality in the
labor market after incarceration.
Qualitative Evidence on Finding Work
Quantitative estimates indicated large employment and earnings advan-
tages of whites over blacks and Hispanics. Qualitative interviews help ex-
plain racial inequality in employment as the product of racial differences in
social ties to employment and criminal stigma. Whites in the reentry study
mostly found work through recommendations and referrals from their so-
cial networks (Table 5). Social contacts supplied referrals just over three-
22

quarters of the time for white respondents. Whites were more likely to
be connected to steady jobs in high-paying industries, mainly construction.
Black and Hispanic respondents were less likely to have family, friends, and
other contacts who could connect them to stable, high-paying jobs. His-
panic respondents found work through family and friends two-thirds of the
time, but were mostly referred to low-wage jobs. Black respondents found
jobs through networks around 40 percent of the time. More than whites or
Hispanics, blacks relied on a variety of formal strategies, including online
searches, applying in person, and applying to temporary employment agen-
cies. Jobs for black respondents typically paid minimum wage and tended
to last for just a few months.
With weak employment networks and reliant on formal methods for
finding work, black respondents may have been more vulnerable to crimi-
nal record discrimination. Among the jobless, blacks attributed their unem-
ployment to their criminal records nearly a quarter of the time (Table 5).
In contrast, whites used formal job search methods infrequently and only
8 percent reported their criminal record as an impediment to employment.
Hispanics do not follow the same pattern of formal job search associated
with self-reported criminal record discrimination. This may in part be as-
sociated with the unusually high rate of long-term joblessness in the small
Hispanic sample.
Qualitative interviews indicate the utility of network connections for
whites. Patrick, aged 31, had served a year in prison. As a teenager in
one of Boston’s historically poor, white neighborhoods, he began to use
heroin, dropped out of high school, and attempted suicide. Patrick was
in and out of trouble throughout adolescence, but he managed to join a
construction union in his early twenties with the help of his father who
23

Table 5. Percentage distribution of methods of job finding among employed re-spondents, and reasons for not working for unemployed respondents, by race andethnicity, Boston Reentry Study.
Race/EthnicityWhite Black Hispanic
Method of Finding Current JobAll network referrals 75.5% 43.4% 66.7%
Family 9.4 14.5 24.2Friends 41.5 25.3 42.4Other network 24.5 3.6 0.0
Formal job search 18.9 42.1 3.0Other methods 5.7 14.5 30.3Total 100.0 100.0 100.0Respondent-waves (N) 53 83 33
Reason for Not WorkingCriminal record 8.2 23.9 32.3Other reasons 91.8 76.1 67.7Total 100.0 100.0 100.0Respondent-waves (N) 49 88 31
Note: Data are taken from the two month, six month, and 12 month waves ofthe BRS. Other network referrals include other sources, such as union officials orformer employers. Other methods of job finding include continuing employmentin work release jobs.
24

was a union official. He worked steadily as a welder until losing his job at
age 30 while using heroin regularly. In the first two months after prison
release, Patrick was out of work and struggled to stay sober. He completed
a course to update his trade certification and over the Thanksgiving holiday,
he regained contact with his father. Soon after, he was offered a job on a
construction site. By the 6-month interview, he was earning about $1,300
each week and paying rent for an apartment that he shared with his father
and brothers. Finding work was critical for his stability. “I can’t really
do anything else other than construction and crime,” he told us. Patrick’s
history in the union and family connections smoothed the transition back
to work after prison, and he remained employed a year later.
Hispanic respondents who found work were also likely to rely on social
networks, but the jobs they found tended to pay less. At 12 months out
of prison, employed white respondents who had found their jobs through
friends and family earned an average of $3,000 each month, twice as much
as Hispanic respondents who had found work in the same way.
After dropping out of school at age 16, Johnny, a Hispanic man in his
early thirties, estimated that he had spent half of his adult years working
and the other half incarcerated. Throughout the year after his 21-month
prison term, he was consistently employed often working several casual
jobs at a time. Upon release, he contacted an old friend who worked at a
furniture warehouse. Johnny spent a few days a week at the warehouse do-
ing furniture removal, paid in cash for each job. He also spent several days
a week working at a car wash, a job he found through his brother. When
the furniture warehouse closed after four months, Johnny’s cousin helped
connect him to a work crew where he was paid daily to do landscaping and
maintenance work. Like Patrick, Johnny relied on his social networks to
25

find work. However, his friends connected him to minimum-wage jobs or
day labor. By the 12-month interview, Johnny was earning about $1,500
per month, though his monthly earnings had fluctuated between $450 and
$4,000 over the course of the year.
Black respondents were less likely than white and Hispanic respondents
to find jobs through family and friends in the year after their release, and
instead relied on more formal means of job search. Among black respon-
dents who were employed at the 12-month interview, over half had found
work through an online database, newspaper advertisement, temporary
employment agency or employment program. Most worked in temporary
jobs or at minimum wage ($8.50 an hour in Massachusetts) in the service
sector. Employment was unstable and job duration for blacks was about
two months less on average compared to whites and Hispanics.
At the age of 28, Dante was released after serving a year and a half in
prison. Since dropping out of high school at age 16, he had worked for
half a year and spent a total of six years incarcerated. He earned his GED
while in prison. After release, Dante moved in with his sister and her friend
who lived in a working-class suburb just outside of Boston. He searched for
work online and at temporary employment agencies. In his third month
out, Dante was hired for two jobs, as a prep cook in a fast-food restaurant
and as a bus boy at a local sports arena. He held both jobs for three months,
sometimes working up to 50 hours a week. He was ultimately forced to
quit the fast-food restaurant because of his schedule at the arena: “They
wanted me to choose jobs.” Dante’s arena job paid slightly more ($10.35
an hour), but his hours varied from week to week depending on games
and events. When working, his monthly income averaged just over $500
and never exceeded $1,000 a month. The seasonal nature of Dante’s work
26
also put him at risk of unemployment. Though he held the bus boy job at
his 12-month interview, Dante had not worked for two consecutive months
near the end of the year because business at the arena was slow.
Formal methods of job search, used mostly by black respondents, also
exposed job seekers to criminal record discrimination. A handful of respon-
dents volunteered information about their criminal record while search-
ing for work, but most reported that employers learned about their record
through formal background checks or by asking at an interview. We cannot
know from the survey data whether unemployment resulted from employ-
ers’ concerns about a criminal record but circumstances were sometimes
suggestive. Some respondents reported that they had started a job and
were fired weeks later when employers conducted a formal background
check.
Since dropping out of high school in the 12th grade, Keon, a 30-year-
old black man, had taken GED classes, worked steadily for two and a half
years, and served five years in state prison. Throughout the year after re-
lease, Keon spoke to family and friends about employment and applied to
jobs in person and online. At one month out of prison, he interviewed
for a position at a department store and was told he had the job. Though
Keon had indicated that he had a criminal record on the online application,
his interviewer did not ask him about it. Three weeks later, however, he
learned he had lost the job after his employer conducted a formal back-
ground check. Though Keon was able to find construction work for three
months through a friend, earning about $1,000 a month, the work was tem-
porary, and at the one-year interview, he had been unemployed for seven
months. He had a newborn daughter, sold marijuana to contribute income
to the household, and hoped to find a stable job on the books.
27

DISCUSSION
Steady employment helps promote criminal desistance and social integra-
tion after incarceration (Sampson and Laub 1993; Uggen 2000; Sullivan
1989; Western et al. 2015). Panel data from sample of men and women
released from prison to the Boston area shows high rates of unemployment
and low earnings in the year after incarceration. Unemployment rates var-
ied between 40 and 60 percent over the year and earnings averaged around
$1,000 a month, approximately equal to the federal poverty line for an in-
dividual. Unemployment and low wages were associated not just with con-
ventional measures of human capital, such as prior work experience and
schooling. Characteristics of the ex-prisoner population, including physical
disability and histories of drug addiction, were also associated with poor
labor market outcomes.
In addition to poverty-level wages among the formerly-incarcerated, we
also find large racial and ethnic inequalities in employment and earnings.
Whites just out of prison were relatively disadvantaged in several ways.
They had higher rates of physical disability and drug addiction, were less
ready for employment and more socially isolated immediately after prison
release. Despite these disadvantages, their employment rates were higher
and their earnings were nearly double those of formerly-incarcerated blacks
and Hispanics (see also Abram et al. 2016 on delinquent youth). Qualita-
tive evidence showed that higher levels of employment and earnings among
whites were associated with social network connections to relatively well-
paying jobs. Because they were more likely to be exposed to the scrutiny of
employers met through a formal job search, the stigma of a criminal record
also appears to be more disqualifying for blacks in particular. These empir-
28

ical results help synthesize a variety of findings in earlier studies, showing
the relative disadvantage of black job seekers with criminal records (Pager
2003; Pager et al. 2009), and the network disadvantage of formerly incar-
cerated blacks and Hispanics (Sullivan 1989; Smith 2007; Black 2010).
Although the reentry study is not directly informative about the causal
effect of incarceration, the analysis has implications for research on in-
carceration effects for labor market outcomes. First, researchers have fo-
cused on the endogeneity of incarceration to pre-existing disadvantages
that also drive poor outcomes in the labor market (see Western et al. 2001;
(Holzer 2009)). The reentry study data allow detailed measurement of
these confounding sources of disadvantage. While we found that crimi-
nal involvement is associated with unemployment and low wages, human
frailty—measured by a history of drug addiction and chronic pain—was
also important. Prison release also has a dynamic quality, and social isola-
tion and lack of job readiness at the moment of release are associated with
poor outcomes months later. Second, much of the employment we ob-
served was highly informal and sometimes fleeting, unlikely to be covered
by administrative records or conventional survey interviews. Moreover, rel-
atively disadvantaged black workers were more reliant on the formal labor
market where employment is more easily observed. We cannot know how
this might bias estimates of the causal effect of incarceration without in-
formation on informal employment in a comparison group, but the reentry
study data illustrate the significant challenges of economic measurement
in a highly marginal population. Third, separately modeling earnings and
employment treats unemployment as a true zero in the estimation of total
earnings. Such an approach provides a flexible model that allows some
covariates—like job readiness and re-incarceration—to be more closely as-
29

sociated with employment than earnings.
Poverty-level earnings commonly follows incarceration but a few re-
spondents found steady work in well-paying jobs. White unionized workers
in skilled trades earned well above poverty wages despite long histories of
incarceration, drug addiction, and criminal involvement. Some respon-
dents had strong family connections to stable jobs that they held continu-
ously through their first year after incarceration. These examples suggest
how a supportive employment context can promote economic well-being
even for workers who are deeply disadvantaged. Contrast the low incomes
of minority respondents. Even when relatively advantaged by their per-
sonal characteristics, blacks and Hispanics had weaker network ties to well-
paying jobs and faced intensified criminal stigma. They experienced more
unemployment and earned less as a result. The social context of prison
release thus emerges as central to economic well-being after incarcera-
tion. While the individual characteristics of men and women coming out of
prison are associated with their fortunes after incarceration, a supportive
social context after incarceration can moderate disabling disadvantages.
Researchers have widely explored the claim that the current era of
mass incarceration has deepened social and economic inequality in Amer-
ica (Western 2006; Wakefield and Uggen 2010; Wakefield and Wildeman
2013). Our small longitudinal study of Boston prisoners cannot evaluate
such a large claim of historical change. Still, we are able to observe in de-
tail a type of compounded disadvantage produced by the close connection
between incarceration and poverty. The analysis provides clear evidence of
widespread unemployment and poverty-level wages in a cohort of released
prisoners.
Labor market outcomes are worse for blacks and Hispanics than whites,
30

despite the relatively poor health and high rates of drug addiction among
whites. The results suggest that high rates of incarceration among blacks
and Hispanics combine with the social conditions of poverty—characterized
by social detachment from skilled employment and the stigma of criminality—
to produce high rates of joblessness and low-wage employment. More
generally, the significance of mass incarceration for racial inequality ex-
tends beyond racial disparities in imprisonment rates. The results reported
here show how the experience of incarceration is embedded in racially-
differentiated experiences of poverty. With the highest incarceration rates
and returning to the most adverse economic environments, African Amer-
icans have the lowest earnings and bear the greatest weight of the com-
pounded disadvantages of mass incarceration.
31

APPENDIX: THE MODEL AND ESTIMATION
For respondent i at time t , monthly earnings, yi t , and the probability of
employment, pi t , is written as a function of covariates, x, and dummy vari-
ables, Bi and Hi , indicating blacks and Hispanics,
logit(pi t ) =α1Bi +α2Hi +x′i tα3 +τt +γi ,
log yi t =β1Bi +β2Hi +x′i tβ3 +θt +δi +ui t ,
where the random effects have a normal distribution, γi
δi
∼ N
0
0
,
σ2γ σγδ
σγδ σ2δ
,
and the cross-equation correlation is given by the scaled covariance, ρ =σγδ/(σ2
γσ2δ
)1/2. Conditional on the random effects and collecting all the
model parameters into the vector, ξ, the contribution of one observation to
the log likelihood for this model is written,
f (ei t , yi t ;ξ) = (1−ei t ) log(1−pi t )+ei t [log(pi t )+ϕ(yi t )]
where ei t is a binary indicator for employment used in the employment
equation, ϕ is the log likelihood for a log normal regression. The log likeli-
hood thus consists of two parts: one for the probability of employment, and
one for the density of earnings, given employment. With correlated ran-
dom effects, this model can be estimated using Markov Chain Monte Carlo
(MCMC) methods. Estimates were obtained from an MCMC run for three
parallel chains with a burn-in of 20,000 iterations, and another 100,000
for estimation.
To obtain marginal effects at average covariate values, x, on uncondi-
tional earnings, we set random effects to zero and calculated a predicted
32

probability of employment, pr (r =W,B , H) for each race group. We made
similar calculations for mean positive earnings, yr , though under the log
normal distribution an adjustment is needed for the dispersion of the distri-
bution, E(yr |x) = yr = exp(µr +σ2/2), where µr is the linear prediction from
the earnings regression evaluated at the covariate means, and σ2 is the dis-
persion parameter of the log normal likelihood. Total annual earnings is
calculated from the predicted probability of monthly employment and the
predicted mean level of positive monthly earnings, given by yr = pr yr ×12.
33

REFERENCES
Abram, Karen M., Nicole M. Azores-Gococo, Kristin M. Emanuel,David A. Aaby, Leah J. Welty, Jennifer A. Hershfield, Melinda S.Rosenbaum, and Linda A. Teplin. 2016. “Sex and Racial/Ethnic Dif-ferences in Positive Outcomes in Delinquent Youth After Detention:A 12-Year Longitudinal Study.” JAMA Pediatrics .
Black, Timothy. 2010. When a Heart Turns Rock Solid: The Lives of ThreePuerto Rican Brothers On and Off the Streets. New York, NY: Vintage.
Bureau of Labor Statistics. 2014. Labor Force Characteristics by Race andEthnicity, 2013. Washington, DC: U.S. Bureau of Labor Statistics.
Clear, Todd. 2007. Imprisoning Communities: How Mass IncarcerationMakes Disadvantaged Neighborhoods Worse. New York: Oxford Uni-versity Press.
Freeman, Richard B. 1992. “Crime and the Employment of Disadvan-taged Youth.” In Urban Labor Markets and Job Opportunity, editedby George Peterson and Wayne Vroman, pp. 201–237. WashingtonDC: Urban Institute Press.
Geller, Amanda, Irwin Garfinkel, and Bruce Western. 2011. “PaternalIncarceration and Support for Children in Fragile Families.” Demog-raphy 48:25–47.
Grogger, Jeffrey. 1995. “The Effect of Arrests on the Employment andEarnings of Young Men.” Quarterly Journal of Economics 110:51–71.
Heckman, James J. 1979. “Sample Selection Bias as a Specification Er-ror.” Econometrica 47:153–161.
Henkel, Dieter. 2011. “Unemployment and Substance Use: A Review ofthe Literature (1990-2010).” Current Drug Abuse Reviews 4:4–27.
Holzer, Harry J. 2009. “Collateral Costs: Effect of Incarceration on Em-ployment and Earnings Among Young Workers.” In Do Prisons MakeUs Safer?, edited by Steven Raphael and Michael A Stoll, pp. 239–266. New York: Russell Sage Foundation.
34

Kling, Jeffrey R. 2006. “Incarceration Length, Employment, and Earn-ings.” American Economic Review 96:863–876.
Kornfeld, Robert and Howard S Bloom. 1999. “Measuring Program Im-pacts on Earnings and Employment: Do Unemployment InsuranceWage Reports from Employers Agree with Surveys of Individuals?”Journal of Labor Economics 17:168–197.
Lyons, Christopher J. and Becky Pettit. 2011. “Compounded Disad-vantage: Race, Incarceration, and Wage Growth.” Social Problems58:257–280.
Maruschak, Laura M., Marcus Berzofsky, and Jennifer Unangst. 2015.Medical Problems of State and Federal Prisoners and Jail Inmates,2011–12. Washington DC: Bureau of Justice Statistics.
Min, Yongyi and Alan Agresti. 2005. “Random Effect Models for Re-peated Measures of Zero-Inflated Count Data.” Statistical Modelling5:1–19.
Mueller-Smith, Michael. 2014. “The Criminal and Labor Market Im-pacts of Incarceration.” Department of Economics Working Paper,Columbia University.
Nagin, Daniel and Joel Waldfogel. 1998. “The Effect of Conviction onIncome Through the Life Cycle.” International Review of Law and Eco-nomics 18:25–40.
National Center on Addiction and Substance Abuse. 2010. Behind BarsII: Substance Abuse and America’s Prison Population. New York:Columbia University.
Pager, Devah. 2003. “The Mark of a Criminal Record.” American Journalof Sociology 108:937–975.
Pager, Devah. 2007. Marked: Race, Crime, and Finding Work in an Era ofMass Incarceration. Chicago, IL: University of Chicago Press.
Pager, Devah, Bruce Western, and Naomi Sugie. 2009. “Sequencing Dis-advantage: Barriers to Employment Facing Young Black and WhiteMen with Criminal Records.” Annals of the American Academy of Po-litical and Social Science 623:195–213.
Pettit, Becky and Christopher Lyons. 2007. “Status and the Stigma ofIncarceration: The Labor Market Effects of Incarceration by Race,
35

Class, and Criminal Involvement.” In Barriers to Re-entry: The Impactof Incarceration on Labor Market Outcomes, edited by David Weiman,Shawn Bushway, and and Michael Stoll, pp. 202–226. New York:Russell Sage Foundation.
Royster, Deirdre. 2003. Race and the Invisible Hand: How White NetworksExclude Black Men from Blue-Collar Jobs. Berkeley, CA: University ofCalifornia Press.
Sampson, Robert J and John H Laub. 1993. Crime in the Making: Path-ways and Turning Points Through Life. Cambridge, MA: Harvard Uni-versity Press.
Sampson, Robert J and Charles Loeffler. 2010. “Punishment’s Place: TheLocal Concentration of Mass Incarceration.” Daedalus pp. 20–31.
Schnittker, Jason, Michael Massoglia, and Christopher Uggen. 2012.“Out and Down: Incarceration and Psychiatric Disorders.” Journalof Health and Social Behavior 53:448–464.
Simes, Jessica Tayloe. 2016. Essays on Place and Punishment in America.Ph.D. thesis, Harvard University, Cambridge, MA.
Smith, Sandra Susan. 2007. Lone Pursuit: Distrust and Defensive Individ-ualism Among the Black Poor. New York: Russell Sage Foundation.
Sullivan, Mercer L. 1989. "Getting Paid": Youth Crime and Work in theInner City. Cornell University Press.
Tonry, Michael and Matthew Melewski. 2008. “The Malign Effects ofDrug and Crime Control Policies on Black Americans.” Crime andJustice 37:1–44.
Travis, Jeremy, Bruce Western, and Stephens Redburn (eds.). 2014. TheGrowth of Incarceration in the United States: Exploring Causes andConsequences. Washington, DC: National Academy Press.
Uggen, Christopher. 2000. “Work as a Turning Point in the Life Course ofCriminals: A Duration Model of Age, Employment, and Recidivism.”American Sociological Review 65:529–546.
Visher, Christy A and Jeremy Travis. 2003. “Transitions from Prison toCommunity: Understanding Individual Pathways.” Annual Review ofSociology 29:89–113.
36
Wakefield, Sara and Christopher Uggen. 2010. “Incarceration and Strat-ification.” Annual Review of Sociology 36:387–406.
Wakefield, Sara and Christopher Wildeman. 2013. Children of the PrisonBoom: Mass Incarceration and the Future of the American Inequality.New York, NY: Oxford Univerity Press.
Waldfogel, Joel. 1994. “The Effect of Criminal Conviction on Incomeand the ‘Trust Reposed in Workmen’.” Journal of Human Resources29:62–81.
Western, Bruce. 2002. “The Impact of Incarceration on Wage Mobilityand Inequality.” American Sociological Review 67:526–546.
Western, Bruce. 2006. Punishment and Inequality in America. New York:Russell Sage Foundation.
Western, Bruce, Anthony Braga, Jaclyn Davis, and Catherine Sirois.2015. “Stress and Hardship After Prison.” American Journal of So-ciology 120:1512–1547.
Western, Bruce, Jeffrey R. Kling, and David F. Weiman. 2001. “The La-bor Market Consequences of Incarceration.” Crime and Delinquency47:410–427.
Western, Bruce and Beck Pettit. 2005. “Black-White Wage Inequality,Employment Rates, and Incarceration.” American Journal of Sociol-ogy 111:553–578.
Wildeman, Christopher and Christopher Muller. 2012. “Mass Imprison-ment and Inequality in Health and Family Life.” Annual Review ofLaw and Social Science 8:11–30.
Wilson, William Julius. 1996. When Work Disappears: The World of theNew Urban Poor. New York: Knopf.
37