racial and ethnic group differences in college enrollment decisions
TRANSCRIPT

This chapter reviews and synthesizes what is known fromprior research about racial and ethnic group differences incollege enrollment and identifies areas for intervention.This chapter is relevant to campus administrators,institutional researchers, and others who are interested inraising the share of African Americans and Hispanicswho are enrolling in U.S. colleges and universities.
Racial and Ethnic Group Differences in College Enrollment Decisions
Laura W. Perna
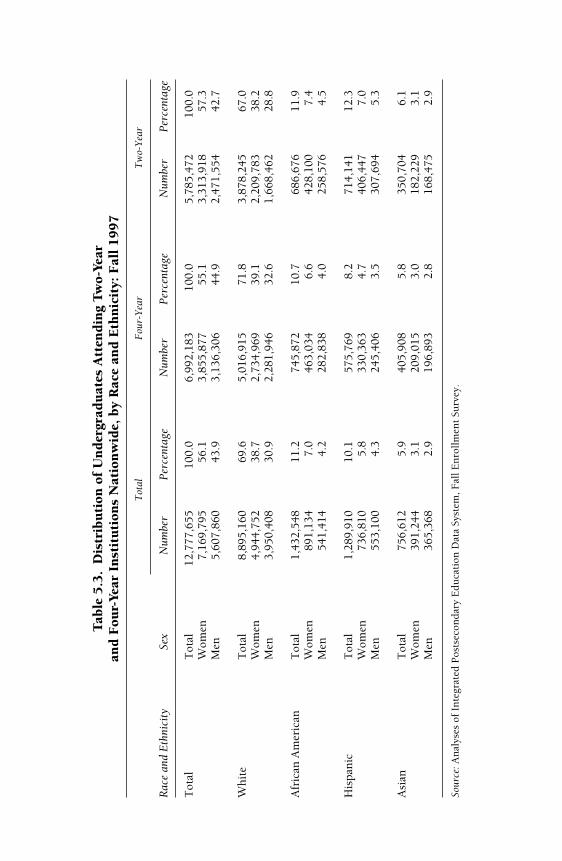
More African Americans and Hispanics are attending college and receivingdegrees than ever before (Nettles, Perna, and Freeman, 1999). Over the pastdecade, the number of African American and Hispanic undergraduates enrolledin four-year colleges and universities nationwide increased by 42 percent and161 percent, respectively, while the number of white undergraduates increasedby just 1 percent (see Table 5.1). Over the same period, the number of bach-elor’s degrees awarded increased by 68 percent for African Americans and 186 percent for Hispanics, compared with a 7 percent increase for whites (seeTable 5.2). Despite this progress, however, analyses of the Integrated Post-secondary Education Data System show that in 1997, African Americans andHispanics were underrepresented among both undergraduates (at 11.2 percentand 10.1 percent, respectively) and bachelor’s degree recipients (7.8 per-cent and 6.3 percent) relative to their representation in the traditional college-age population (14.3 percent and 13.7 percent) (see Tables 5.3 and 5.4).
The continued underrepresentation of African Americans and Hispan-ics among undergraduates and bachelor’s degree recipients does not appearto be attributable to a lack of interest in or predisposition toward college.Between 1980 and 1990 the percentage of high school sophomores whoreported that they expected to earn at least a bachelor’s degree increasedfrom 35 percent to 70 percent among African Americans and from 28 per-cent to 62 percent among Hispanics. Comparable percentages of AfricanAmerican and white 1990 high school sophomores expected to at least fin-ish college (Nettles and Perna, 1997).
A review of college enrollment rates suggests that merely aspiring to com-plete a bachelor’s degree is not sufficient to ensure actual college enrollment
NEW DIRECTIONS FOR INSTITUTIONAL RESEARCH, no. 107, Fall 2000 © Jossey-Bass Publishers 65
5

Tab
le 5
.1.
Ch
ange
in
th
e N
um
ber
of
Un
der
grad
uat
es A
tten
din
g C
olle
ges
and
Un
iver
siti
es N
atio
nw
ide,
by
Rac
e an
d E
thn
icit
y: 1
976, 1986, 1997
Cha
nge
(per
cent
age)
Rac
e an
d E
thni
city
1976
1986
1997
1976
–97
1976
–86
1986
–97
Fou
r-ye
ar in
stit
uti
ons
Tot
al5,
686,
808
6,20
8,61
36,
992,
183
239
13W
hit
e4,
776,
499
4,97
9,45
45,
016,
915
54
1A
fric
an A
mer
ican
528,
036
525,
134
745,
872
41�
142
His
pan
ic14
5,98
522
0,45
957
5,76
929
451
161
Asi
an91
,088
201,
808
405,
908
346
122
101
Pu
blic
tw
o-ye
ar in
stit
uti
ons
Tot
al3,
662,
648
4,33
8,44
55,
785,
472
5818
33W
hit
e2,
898,
056
3,23
4,76
63,
878,
245
3412
20A
fric
an A
mer
ican
404,
404
423,
102
686,
676
705
62H
ispa
nic
205,
713
214,
976
714,
141
247
523
2A
sian
77,7
2417
4,24
135
0,70
435
112
410
1
Sour
ce:N
ettl
es, P
ern
a, a
nd
Fre
eman
, 199
9; a
nd
anal
yses
of
Inte
grat
ed P
osts
econ
dary
Edu
cati
on D
ata
Syst
em, F
all E
nro
llm
ent
Surv
ey.

Tab
le 5
.2.
Ch
ange
in
th
e N
um
ber
of
Bac
hel
or’s
Deg
rees
Aw
ard
ed, by
Rac
e an
d E
thn
icit
y: 1
977, 1987, 1997
Cha
nge
(per
cent
age)
Rac
e an
d E
thni
city
1977
1987
1997
1977
–97
1977
–87
1987
–97
Tot
al91
9,52
699
1,26
41,
188,
385
298
20W
hit
e80
7,66
581
9,43
587
8,92
99
17
Afr
ican
Am
eric
an58
,636
54,9
9692
,170
57�
668
His
pan
ic18
,743
26,2
5575
,012
300
4018
6A
sian
13,7
9331
,771
67,4
5238
913
011
2
Sour
ce:N
ettl
es, P
ern
a, a
nd
Fre
eman
, 199
9; a
nd
anal
yses
of
Inte
grat
ed P
osts
econ
dary
Edu
cati
on D
ata
Syst
em, F
all E
nro
llm
ent
Surv
ey.
Tab
le 5
.3.
Dis
trib
uti
on o
f U
nd
ergr
adu
ates
Att
end
ing
Two-
Year
an
d F
our-
Year
In
stit
uti
ons
Nat
ion
wid
e, b
y R
ace
and
Eth
nic
ity:
Fal
l 1997
Tot
alF
our-
Yea
rT
wo-
Yea
r
Rac
e an
d E
thni
city
Sex
Num
ber
Perc
enta
geN
umbe
rPe
rcen
tage
Num
ber
Perc
enta
ge
Tot
alT
otal
12,7
77,6
5510
0.0
6,99
2,18
310
0.0
5,78
5,47
210
0.0
Wom
en7,
169,
795
56.1
3,85
5,87
755
.13,
313,
918
57.3
Men
5,60
7,86
043
.93,
136,
306
44.9
2,47
1,55
442
.7
Wh
ite
Tot
al8,
895,
160
69.6
5,01
6,91
571
.83,
878,
245
67.0
Wom
en4,
944,
752
38.7
2,73
4,96
939
.12,
209,
783
38.2
Men
3,95
0,40
830
.92,
281,
946
32.6
1,66
8,46
228
.8
Afr
ican
Am
eric
anT
otal
1,43
2,54
811
.274
5,87
210
.768
6,67
611
.9W
omen
891,
134
7.0
463,
034
6.6
428,
100
7.4
Men
541,
414
4.2
282,
838
4.0
258,
576
4.5
His
pan
icT
otal
1,28
9,91
010
.157
5,76
98.
271
4,14
112
.3W
omen
736,
810
5.8
330,
363
4.7
406,
447
7.0
Men
553,
100
4.3
245,
406
3.5
307,
694
5.3
Asi
anT
otal
756,
612
5.9
405,
908
5.8
350,
704
6.1
Wom
en39
1,24
43.
120
9,01
53.
018
2,22
93.
1M
en36
5,36
82.
919
6,89
32.
816
8,47
52.
9
Sour
ce:A
nal
yses
of
Inte
grat
ed P
osts
econ
dary
Edu
cati
on D
ata
Syst
em, F
all E
nro
llm
ent
Surv
ey.

Tab
le 5
.4.
Dis
trib
uti
on o
f D
egre
e R
ecip
ien
ts, by
Rac
e an
d E
thn
icit
y: 1
997
Ass
ocia
teB
ache
lor’
sM
aste
r’s
Doc
tora
tePr
ofes
sion
al
Rac
e an
d E
thni
city
Sex
Num
ber
Perc
enta
geN
umbe
rPe
rcen
tage
Num
ber
Perc
enta
geN
umbe
rPe
rcen
tage
Num
ber
Perc
enta
ge
Tot
alT
otal
577,
398
100.
01,
188,
385
100.
042
1,52
310
0.0
46,0
5210
0.0
78,1
2710
0.0
Wom
en35
1,30
960
.866
2,33
855
.723
9,80
556
.918
,826
40.9
32,7
9642
.0M
en22
6,08
939
.252
6,04
744
.318
1,71
843
.127
,226
59.1
45,3
3158
.0
Wh
ite
Tot
al42
1,32
673
.087
8,92
974
.028
8,69
068
.527
,232
59.1
58,7
6175
.2W
omen
165,
398
28.6
393,
017
33.1
118,
088
28.0
14,7
1031
.935
,089
44.9
Men
255,
928
44.3
485,
912
40.9
170,
602
40.5
12,5
2227
.223
,672
30.3
Afr
ican
A
mer
ican
Tot
al55
,261
9.6
92,1
707.
826
,957
6.4
1,79
43.
94,
308
5.5
Wom
en36
,285
6.3
59,4
045.
018
,509
4.4
1,02
92.
22,
519
3.2
Men
18,9
763.
332
,766
2.8
8,44
82.
076
51.
71,
789
2.3
His
pan
icT
otal
46,5
318.
175
,012
6.3
16,3
683.
91,
170
2.5
4,12
35.
3W
omen
18,6
873.
230
,578
2.6
6,47
11.
559
51.
32,
219
2.8
Men
27,8
444.
844
,434
3.7
9,89
72.
357
51.
21,
904
2.4
Asi
anT
otal
25,0
584.
367
,452
5.7
17,9
654.
32,
530
5.5
7,17
49.
2W
omen
10,8
941.
931
,776
2.7
8,61
52.
01,
556
3.4
3,86
34.
9M
en14
,164
2.5
35,6
763.
09,
350
2.2
974
2.1
3,31
14.
2
Sour
ce:
An
alys
es o
f In
tegr
ated
Pos
tsec
onda
ry E
duca
tion
Dat
a Sy
stem
, Com
plet
ion
s Su
rvey
.

70 UNDERSTANDING THE COLLEGE CHOICE OF DISADVANTAGED STUDENTS
(Perna, 2000b). The percentage of students who actually enroll in college con-tinues to vary by racial and ethnic group, even when only those who reportaspiring to earn at least a bachelor’s degree are considered. Descriptive anal-yses of the National Educational Longitudinal Study of 1990–1994 (NCES,1996) reveal that only about 38 percent of African American and Hispanic1990 high school sophomores who aspired to complete at least a bachelor’sdegree were enrolled in a four-year institution during the fall after graduatingfrom high school, compared with about 55 percent of whites and Asians(Perna, 2000b).
Policymakers, college and university administrators, and institutionalresearchers should be concerned about the lower college enrollment ratesof African Americans and Hispanics relative to those of whites and Asiansfor several reasons. First, because smaller proportions of African Americansand Hispanics are enrolling in college, they are less likely than whites andAsians to realize the range of benefits associated with attending college andearning at least a bachelor’s degree. The economic benefits include higherlifetime earnings, whereas the noneconomic benefits include a more fulfill-ing work environment, better health, longer life, more informed purchases,and greater participation in cultural events (Bowen, 1980, 1997; Leslie andBrinkman, 1988; McPherson, 1993). Society also loses from the lower col-lege enrollment rates of African Americans and Hispanics because higherlevels of education are associated with such public benefits as greater pro-ductivity, greater civic involvement, greater volunteerism, higher votingrates, reduced dependence on public welfare, and lower crime rates (Bowen,1997). Moreover, the continued underrepresentation of African Americansand Hispanics among undergraduates contributes to the low representationof African Americans and Hispanics at the next stages of the educationalpipeline. Table 5.4 shows that the representation of African Americans andHispanics declines as the degree level increases. For example, African Amer-icans received 9.6 percent of the associate degrees awarded in 1997 but only7.8 percent of the bachelor’s degrees, 6.4 percent of the master’s degrees, 5.5 percent of the first-professional degrees, and 3.9 percent of the doctoraldegrees. Hispanics received 8.1 percent of the associate degrees but only 6.3 percent of the bachelor’s degrees, 5.3 percent of the first-professionaldegrees, 3.9 percent of the master’s degrees, and 2.5 percent of the doctoraldegrees. Addressing the lower undergraduate enrollment rates of AfricanAmericans and Hispanics is likely an important step toward increasing therepresentation of African Americans and Hispanics among professional anddoctoral degree recipients.
What We Know About Racial and Ethnic GroupDifferences in College Enrollment
According to Hossler and Gallagher (1987), the process of deciding to enrollin college may be characterized as having three phases: predisposition,search, and choice. In the first phase, students decide to attend college

71RACIAL AND ETHNIC GROUP DIFFERENCES IN COLLEGE ENROLLMENT
rather than pursue other postsecondary education alternatives (for exam-ple, work, the military). In the second phase, students search for infor-mation about college, learn about particular colleges and universities, andform a choice set. In the third phase, students select an institution from thechoice set in which to enroll.
Some researchers have concluded that a student’s educational expecta-tions are among the best predictors of college enrollment (Hossler, Schmit,and Vesper, 1999; McDonough, 1997). Hossler and Stage (1992) have con-cluded that minority status is positively related to the postsecondary plansof Indiana ninth graders only indirectly, through involvement in schoolactivities and parental expectations after controlling for such differences associoeconomic status and academic ability. Nonetheless, little is knownabout racial and ethnic group differences in the formation of educationalplans. Some researchers (for example, Hurtado, Inkelas, Briggs, and Rhee,1997) have concluded that a more precise model of the predisposition stageis required to fully understand racial and ethnic group differences in collegeenrollment behavior.
Relatively little is also known about racial and ethnic group differencesin the search phase. Based on their analyses of data from the National Lon-gitudinal Study of the High School Class of 1972 and the High School andBeyond Survey of 1980 and 1982 high school seniors, St. John and Noell(1989) have found that in all three classes, African Americans were morelikely than whites and Hispanics to apply to college after controlling for dif-ferences in background characteristics. Using the number of applicationssubmitted to postsecondary educational institutions as a measure of search,Hurtado, Inkelas, Briggs, and Rhee (1997) have concluded that AfricanAmerican and Hispanic college applicants apply to a greater number of col-leges than whites after controlling for background characteristics, ability,and college preferences. The small percent of variance explained by the Hur-tado, Inkelas, Briggs, and Rhee model (11 percent) suggests, however, thatfurther examination of the search phase may improve our understanding ofracial and ethnic group differences in the college enrollment process.
Although more attention has been focused on the choice phase of theprocess, the results of such research are inconsistent. Using data from HighSchool and Beyond, St. John and Noell (1989) have found that collegeenrollment rates were comparable for African American, Hispanic, andwhite high school seniors after controlling for differences in background,ability, and educational aspirations. African American college applicantswere less likely than their white peers to enroll, however, after also con-trolling for financial aid offers. Other researchers have shown that, com-pared with their white counterparts and after controlling for otherdifferences, African American high school students are less likely to enrollin college (Nolfi and others, 1978), are less likely to attend highly selectivecolleges and universities (Hearn, 1984) and are less likely to attend theirfirst-choice institution (Hurtado, Inkelas, Briggs, and Rhee, 1997). Stillother research suggests that African Americans are more likely than whites

72 UNDERSTANDING THE COLLEGE CHOICE OF DISADVANTAGED STUDENTS
to enroll in college (Thomas, 1980; Catsiapis, 1987; Kane and Spizman,1994; Perna, 2000a) and tend to enroll in four-year rather than two-year col-leges (Rouse, 1994; Perna, 2000b) holding constant other variables.
Researchers have also shown that the variables that predict collegeenrollment vary by race and ethnicity, suggesting that the college enrollmentdecision-making process is different for African Americans, Hispanics, andwhites. For example, Hurtado and her colleagues (1997) have found thatability is a less important predictor of the number of applications to collegefor African Americans than for whites, Hispanics, and Asians. Thomas(1980) has found that socioeconomic status and test scores had strongerdirect effects on college enrollment for African American 1972 high schoolseniors, particularly African American males, than for their white counter-parts. St. John (1991) has concluded that African American high schoolseniors were more likely than white seniors to attend college when region,family background, ability, and high school experiences were controlled butwere no more likely than white seniors to attend when educational expec-tations were also controlled. Hispanic seniors were less likely than otherseniors to attend college when region and family background were con-trolled but as likely to do so as white seniors when test scores and highschool experiences were also taken into account. Jackson (1990) has shownthat receiving financial aid had a stronger positive effect on the probabilityof enrolling in college for African American and Hispanic college applicantsin 1980 than for their white counterparts but that the positive effect offinancial aid for Hispanics disappeared when background and academiccharacteristics were also held constant. Other research suggests thateducational expectations are a less important predictor of college enrollmentfor African Americans than for whites (Thomas, 1980; Perna, 2000a).
Theoretical Framework for Understanding Racial and Ethnic Group Differences in College Enrollment
Among the conceptual frameworks that have been used to examine collegeenrollment behavior are sociological status attainment approaches (forexample, Thomas, 1980; Hearn, 1984) and social-psychological approaches(for example, Chapman, 1981; Hossler, Braxton, and Coopersmith, 1989).Another common theoretical approach to examining college enrollmentdecisions is economic (Fuller, Manski, and Wise, 1982; Manski and Wise,1983; Schwartz, 1985; Hossler, Braxton, and Coopersmith, 1989; Hossler,Schmit, and Vesper, 1999). Econometric models posit that an individualmakes a decision about attending college by comparing the benefits withthe costs for all possible alternatives and then selecting the alternative withthe greatest net benefit, given the individual’s personal tastes and preferences(Hossler, Braxton and Coopersmith, 1989; Manski and Wise, 1983). Theshort-term consumption benefits of attending college include enjoyment ofthe learning experience, involvement in extracurricular activities, partic-

73RACIAL AND ETHNIC GROUP DIFFERENCES IN COLLEGE ENROLLMENT
ipation in social and cultural events, and enhancement of social status.Future benefits include higher lifetime earnings, more fulfilling work envi-ronment, better health, longer life, more informed purchases, and lowerprobability of unemployment (Bowen, 1980, 1997; Leslie and Brinkman,1988; McPherson, 1993). The costs of investing in a college educationinclude the direct costs of attendance (for example, tuition, fees, room,board, books, and supplies) less financial aid, the opportunity costs of for-gone earnings and leisure time, and the costs of traveling between home andthe institution.
Because the informational and computational requirements implied byeconometric models exceed an individual’s information-processing capaci-ties, rational models of decision making are generally regarded as norma-tive rather than descriptive models (Hogarth, 1987). To manage cognitivedecision-making demands, individuals adopt such strategies as satisficingor bounded rationality. McDonough (1997, p. 9) has used Bourdieu’s con-cept of habitus to explain that an individual’s expectations, attitudes, andaspirations are not based on rational analyses but are “sensible or reasona-ble choices.” Habitus, or the internalized system of thoughts, beliefs, andperceptions acquired from the immediate environment, conditions an indi-vidual’s expectations, attitudes, and aspirations (Bourdieu and Passeron,1977; McDonough, 1997; McDonough, Antonio, and Trent, 1997).
According to the traditional econometric perspective, the decision toinvest in higher education is influenced by expected costs and benefits,financial resources, academic ability, current and expected labor marketopportunities, personal preferences and tastes, and uncertainty (Becker,1962). Parental educational attainment is typically the sole (if any) proxyfor differences in expectations, personal preferences and tastes, and uncer-tainty that is included in traditional econometric models (for example,Schwartz, 1985; Rouse, 1994). Based on her examinations of racial and eth-nic group differences in college enrollment, however, Perna (2000a, 2000b)concludes that the explanatory power of the traditional econometricapproach to college enrollment decisions is improved when measures ofsocial and cultural capital are used as proxies for differences in expectations,preferences, tastes, and certainty about higher education investment deci-sions.
Qualitative researchers have drawn upon the sociological concepts ofsocial and cultural capital to describe the ways in which knowledge and infor-mation about college, as well as the value placed on obtaining a collegeeducation, may influence college enrollment decisions (for example, Free-man, 1997; McDonough, 1997). Like human capital and physical capital,social and cultural capital are resources that may be invested to enhance prof-itability (Bourdieu and Passeron, 1977) and productivity (Coleman, 1988)and facilitate upward mobility (DiMaggio and Mohr, 1985; Lamont andLareau, 1988). Social capital may take the form of information-sharing chan-nels and networks as well as social norms, values, and expected behaviors

74 UNDERSTANDING THE COLLEGE CHOICE OF DISADVANTAGED STUDENTS
(Coleman, 1988). Cultural capital is the system of factors derived from one’sparents that defines an individual’s class status (Bourdieu and Passeron, 1977).Members of the dominant class possess the most economically and symboli-cally valued kinds of cultural capital (Bourdieu and Passeron, 1977; Mc-Donough, 1997). Individuals who lack the required cultural capital may (1) lower their educational aspirations or self-select out of particular situ-ations (for example, not enroll in higher education) because they do not knowthe particular cultural norms, (2) overperform to compensate for their less-valued cultural resources, or (3) receive fewer rewards for their educationalinvestment (Bourdieu and Passeron, 1977; Lamont and Lareau, 1988).
Appropriateness of an Expanded Econometric Modelfor Understanding Racial and Ethnic GroupDifferences in College Enrollment
Some research has shown the value of considering social and cultural cap-ital when examining the college enrollment behavior of African Americans.Through group interviews with African American high school studentsabout the barriers they perceive to limit their participation in highereducation, Freeman (1997) has found that African American students areuncertain about their ability to pay the short-term costs of attending andabout whether the long-term economic benefits of attending would exceedthose costs. Interviewees also pointed to the potential influence of the phys-ical conditions of the schools attended by African Americans, interest andassistance from teachers and counselors, belief at an early age that pursuingpostsecondary education is a realistic option, and African American rolemodels. Many of these perceptions may be interpreted as manifestations ofsocial and cultural capital. Based on their examination of the variablesrelated to the decision of African American college freshmen to attend a his-torically black rather than a predominantly white college or university,McDonough, Antonio, and Trent (1997) conclude that traditional modelsof college-choice decision making must be modified for the African Amer-ican habitus, their race-based set of subjective views and perceptions.
Research also suggests that the amount of social and cultural capital, aswell as the strategies for converting this capital into educational attainment,differ by social class and race and ethnicity (Arnold, 1993; Lareau, 1987;Orfield, 1988). Based on her qualitative study of educational attainmentamong African American and Mexican American valedictorians, Arnold(1993) concludes that racial, class, and gendered social structures and cul-tural norms restrict educational attainment for minority students. Orfield(1988) has found that the percent of African American and Hispanic highschool graduates in the Los Angeles metropolitan area who attended four-year colleges and universities declined during the early 1980s, while the per-cent of Asian high school graduates, many of whom were first-generationcollege students, increased, suggesting cultural differences in the value of

75RACIAL AND ETHNIC GROUP DIFFERENCES IN COLLEGE ENROLLMENT
educational success across racial and ethnic groups. Stanton-Salazar (1997)hypothesizes that to be socialized successfully, minority youth must learnto decode the dominant culture and participate in multiple socioculturalvenues. This requires overcoming sociocultural, socioeconomic, linguistic,and structural barriers.
Perna (2000a, 2000b) tests the usefulness of an econometric model thathas been expanded to include measures of social and cultural capital asproxies for differences in expectations, preferences, tastes, and uncertaintyabout the higher education investment decisions for understanding racialand ethnic group differences in the choice phase of the college enrollmentprocess. Using logistic regression analyses and controlling for differences incosts, benefits, financial resources, academic ability, and social and culturalcapital, Perna (2000a) has found that African American high school gradu-ates are more likely than white and Hispanic high school graduates to attenda four-year college or university in the fall after graduating from highschool. Controlling for similar variables but using multinomial logisticregression analyses, Perna (2000b) has also found that African Americanbachelor’s degree aspirants are more likely to enroll in a four-year college oruniversity but less likely to enroll in a public two-year institution in the fallafter graduating from high school than their white, Hispanic, and Asiancounterparts.
Perna (2000a) has shown that the relative contribution of social andcultural capital to the model for four-year college enrollment is different forAfrican Americans and Hispanics than for whites. For all three groups, add-ing proxies for social and cultural capital to the traditional econometricmodel (that is, one that controls only for costs, benefits, financial resources,and academic ability) improves the fit of the model. For white high schoolgraduates, measures of academic ability contribute most to the model fit,followed by measures of social and cultural capital and then by measures ofcosts, benefits, and financial resources. For African American and Hispanichigh school graduates, however, the relative contribution of social and cul-tural capital variables is comparable to the relative contribution of academicability variables. This research suggests that including measures of socialand cultural capital as proxies for differences in expectations, preferences,tastes, and uncertainty in the traditional econometric framework is espe-cially important for understanding the college enrollment decisions of Afri-can Americans and Hispanics (Perna, 2000a).
Implications for Practice and Research
Prior research on racial and ethnic group differences in college enrollmentalso has several implications for college and university admissions officers,institutional researchers, and others interested in raising the college enroll-ment rates of African Americans and Hispanics. For college and universityadmissions officers, prior research points to several types of interventions

76 UNDERSTANDING THE COLLEGE CHOICE OF DISADVANTAGED STUDENTS
that may effectively increase college enrollment rates for underrepresentedgroups. One area for intervention pertains to the quality and intensity of theacademic preparation of African American and Hispanic high school stu-dents (Berkner and Chavez, 1997; Horn, 1997; Adelman, 1999b; Perna,2000b). Some evidence suggests that Asian and white high school gradu-ates are more likely than African American and Hispanic high school grad-uates to be at least minimally qualified to attend college, where collegequalification is an index based on high school academic grades, class rank,test scores, and rigor of the curriculum (Berkner and Chavez, 1997). Otherresearch (Perna, 2000b) shows that the likelihood of enrolling in a four-yearcollege or university is substantially higher for students who have taken atleast one advanced mathematics course. But substantially smaller propor-tions of African American and Hispanic than of white and Asian bachelor’sdegree aspirants have taken at least one advanced mathematics course(Perna, 2000b).
One reason African Americans and Hispanics may be less likely thanwhites and Asians to take advanced mathematics courses is that such classesare not offered in the high schools they attend. Although some have begunto address this issue of educational equity through the courts (Hebel, 1999),possible nonlegal remedies include allowing high school students to takecourses at local community colleges with credit awarded to the student fromboth the high school and the community college, providing additional fundsto train teachers and enhance high school course offerings, and offeringadvanced courses on-line (Adelman, 1999a; Hebel, 1999; Perna, 2000b).Improving academic opportunities, preparation, and achievement must bea central component of any attempt to increase the college enrollment ratesof underrepresented groups.
A second area for intervention that may be particularly important forraising the four-year college enrollments of Hispanics pertains to the levelof parental involvement in the student’s education. Although the likelihoodof enrolling in a four-year college or university has been shown to increasewith the level of parental involvement for both African Americans and His-panics, the average level of parental involvement has been observed to belower for Hispanics than for African Americans and whites (Perna, 2000b).The model of parental involvement proposed by Hoover-Dempsey and San-dler (1997) suggests that efforts to increase parental involvement must rec-ognize that the decision to become involved in the child’s education is likelya function of the parents’ role construction or beliefs about appropriatebehavior, the parents’ sense of efficacy or confidence for helping the studentsucceed in school, and the parents’ perception of being invited by the schooland the student to participate. Beliefs about the appropriate parental role inthe child’s education are likely influenced by their cultural capital (Lareau,1987). For Hispanics, parental involvement may be limited by a lack of rel-evant resources (for example, their own educational attainment, occupa-tional status, work schedule flexibility) or their patterns of family life (for

77RACIAL AND ETHNIC GROUP DIFFERENCES IN COLLEGE ENROLLMENT
example, kinship ties, socialization patterns, leisure activities) (Lareau,1987).
Many early intervention programs, programs that are designed toincrease awareness of and preparation for higher education among dis-advantaged students, include a parental component (Perna, Fenske, andSwail, forthcoming). For example, as part of Washington’s National EarlyIntervention Scholarship Program, parents must spend at least four hourseach month in program activities. Vermont’s National Early InterventionScholarship Program includes home visits, evening presentations, infor-mational sessions, and college and financial aid workshops. More researchis required, however, to identify the most effective ways to involve parentsin these programs as well as the relationship between parental participationin such programs and actual college enrollment.
For institutional researchers and others who are interested in devel-oping a better understanding of racial and ethnic group differences in col-lege enrollment, one set of implications pertains to the most appropriateconceptual framework for examining these differences. As concluded byPerna (2000a, 2000b), an econometric framework that has been expandedto include measures of social and cultural capital as proxies for differencesin expectations, preferences, tastes, and uncertainty appears to provideimportant insights into racial and ethnic group differences in college enroll-ment behavior. Expanding the traditional econometric model to includemeasures of social and cultural capital builds on McDonough’s conclusion(1997) that the college-choice process does not conform to the economist’srational-choice model. By incorporating measures of social and cultural cap-ital into the traditional econometric framework, the results of such analysesare also likely to be of greater use to college and university admissions offi-cers and other interested individuals. With their focus on the role of familybackground and academic ability, the results of much of the traditionaleconometric research on college enrollment are often fairly pessimisticbecause such variables as parental education and test scores have not beenamenable to public policy. In contrast, by explicitly examining the influenceof social and cultural capital on college enrollment decisions, research thatuses an expanded econometric model is more likely to point to the types ofpolicies and practices that will lead to higher college enrollment rates.
One of the biggest challenges for institutional and other educationalresearchers is to identify the most appropriate ways to operationalize socialand cultural capital. Essentially, the task is to identify variables that describethe ways in which parental education, class status, and social networksinfluence the college enrollment process. Perna (2000a, 2000b) hasattempted to operationalize the social and cultural capital constructsdescribed in the relevant qualitative research (for example, McDonough,1997) using the variables available in the National Educational Longitudi-nal Study (NELS) database. Among the proxies that Perna (2000a, 2000b)has included as measures of social and cultural capital in the form of the

78 UNDERSTANDING THE COLLEGE CHOICE OF DISADVANTAGED STUDENTS
availability of knowledge and information about college are the following:the share of high school graduates who enroll in a four-year college or uni-versity, the share of African Americans and Hispanics in the student body,high school control, high school location, and school assistance with col-lege admissions requirements. Perna (2000a, 2000b) has also tested severalmeasures of social and cultural capital in the form of the value placed onobtaining a college education including parents’ expectations for the child’seducation, parental saving for college, parental involvement in the child’seducation, share of peers planning to attend a four-year college, and partic-ipation in extracurricular activities.
Although the relationship between these variables and college enroll-ment may suggest general areas for intervention and further attention,future research should explore the appropriateness of additional or moredescriptive variables. For example, Perna (2000b) has found that four-yearcollege enrollment rates are higher for African Americans who attend highschools in which the majority of graduates attend a four-year college thanfor other African Americans after controlling for differences in costs, ben-efits, financial resources, academic ability, and social and cultural capital.But her analyses do not reveal the ways in which this supposed measure ofhigh school quality promotes college enrollment behavior. The results ofMcDonough’s qualitative study (1997) of twelve white high school girls sug-gest that schools structure postsecondary opportunity through the timing,availability, and support for college advising, organizational mission andcurriculum, assumptions of students’ cultural capital, and counselor roleexpectations and enactment. From their analyses of data from High Schooland Beyond, Falsey and Heyns (1984) hypothesize that high school seniorswho attend private high schools are more likely to enroll in college andenroll in four-year rather than two-year institutions after controlling for stu-dent achievement and aspirations, family characteristics, and school char-acteristics because of organizational policies, orientation of school support,and resources for counseling and advising. Future research should furtherexplore the ways in which these and other characteristics can be opera-tionalized.
A second challenge for institutional researchers is to identify the vari-ations in this expanded econometric conceptual framework that are requiredto more completely understand racial and ethnic group differences in two-year college enrollment. Using multinomial logistic regression analyses topredict public two-year and four-year college enrollment relative to noenrollment, Perna (2000b) concludes that her expanded econometric modelof college enrollment is substantially better for predicting four-year collegeenrollment decisions than for predicting public two-year college enrollmentdecisions. Table 5.1 shows that, among whites, African Americans, and His-panics, undergraduate enrollment increased over the past decade at a fasterrate at public two-year than at four-year colleges and universities. In 1997African Americans, Hispanics, and Asians represented a higher share of

79RACIAL AND ETHNIC GROUP DIFFERENCES IN COLLEGE ENROLLMENT
undergraduates at two-year institutions than at four-year institutions (Table5.3). Given these differential enrollment rates and the findings from researchshowing that students consider different criteria (and apply differentweights to these criteria) when considering whether to attend a two-yearrather than a four-year institution (Heller, 1997; Perna, 2000b), futureresearch should focus on developing a more complete model of two-yearcollege enrollment for students of different racial and ethnic groups.
Future research should also further explore the presence of sex differ-ences in college enrollment among students of the same racial and ethnicgroup. As evinced in part by a November 1999 conference entitled “FewerMen on Campus: A Puzzle for Liberal Arts Colleges and Universities,” col-lege leaders are becoming increasingly concerned about the growing genderimbalance in their undergraduate student bodies (Gose, 1999). Althoughthe number of male undergraduates increased by 11 percent between 1976and 1996, the number of female undergraduates increased at a faster rate(51 percent) (National Center for Education Statistics, 1999). Because ofthe differential growth rates, the representation of men among undergrad-uates has declined from 52 percent in 1976 to 48 percent in 1980 and to 44 percent in 1997. With the exception of nonresident aliens, the numberof women undergraduates exceeds the number of men undergraduatesregardless of race and ethnicity. But the magnitude of the gender gap inundergraduate enrollments varies by racial and ethnic group. In fall 1997,women represented 62 percent of African American undergraduates, com-pared with 52 percent of Asians, 56 percent of whites, 57 percent of His-panics, and 59 percent of American Indians or Alaskan Natives (Table 5.3).
Based on her analyses of race and sex differences in college attendanceamong 1972 high school seniors, Thomas (1980) has concluded that aftercontrolling for differences in socioeconomic status, academic characteristics,significant others’ influence, and educational expectations, sex differencesin the college enrollment process were greater among whites than amongblacks. White men were found to be more likely than white women toenroll in college even after controlling for other variables, but among blacks,sex was unrelated to college enrollment. Among bachelor’s degree aspirantsin the early 1990s, however, Perna (2000b) has found that both AfricanAmerican and white women were more likely than their African Americanand white male counterparts to enroll in a four-year college even after con-trolling for expected costs and benefits, financial resources, academic char-acteristics, and social and cultural capital. These findings suggest that theobserved sex differences in college enrollment may not be entirely attribut-able to differences between women and men in the variables that are relatedto college enrollment and that the relationship between sex and collegeenrollment may vary across racial and ethnic groups. Therefore, futureresearch should continue to recognize the diversity of student experiencesby exploring reasons for differences in college enrollment between womenand men of the same racial and ethnic group.

80 UNDERSTANDING THE COLLEGE CHOICE OF DISADVANTAGED STUDENTS
The NELS is a useful source for examining some of the suggested areasfor future research. Sponsored by the U.S. Department of Education’sNational Center for Education Statistics (NCES), the NELS contains datafor a cohort of students when they were in the eighth grade (1988), whenthey were high school sophomores (1990), when they were high school se-niors (1992), and two years after their scheduled high school graduation(1994). The third in the U.S. Department of Education’s series of longitudi-nal studies examining the transition from high school to education andemployment, the NELS is an invaluable source of data for those who areinterested in examining racial and ethnic group differences in college enroll-ment behavior. The usefulness of the NELS is evidenced in part by thenumber of recent studies utilizing this database (for example, Hurtado,Inkelas, Briggs, and Rhee, 1997; Perna, 2000a, 2000b).
The NELS clearly has several important strengths that are relevant toresearch on racial and ethnic group differences in college enrollment behav-ior. First, it is a longitudinal database that spans the key years of the collegeenrollment process, from the eighth grade to two years out of high school.The NELS is also characterized by high response rates, with a weightedresponse rate of 91 percent to the third (1994) follow-up (Haggerty andothers, 1996) and reasonably large sample sizes, with 14,915 completedcases for the third follow-up (Haggerty and others, 1996). Participating stu-dents attended more than one thousand public and private schools nation-wide. The NELS includes numerous variables, including measures ofbackground and demographic characteristics, achievement (for example,test scores and coursework), attitudes (for example, goals and values), plans(for example, educational expectations), and actual behaviors (for example,college enrollment). Moreover, data were collected not only from the par-ticipating students but also from their parents, teachers, school principals,and school records.
Institutional and other researchers must recognize that, like all datasources, the NELS is not perfect. One important weakness pertains to thesmall numbers of Asians and American Indians in the sample. Their smallnumbers restrict the conclusions that may be drawn about the collegeenrollment process for these groups. A second weakness is that althoughthe NELS was designed to describe critical transitions, a number of poten-tially important variables pertaining to the college enrollment process arenot available. For instance, one potentially important but unavailable mea-sure of social and cultural capital is the number of siblings in college, a var-iable that has been found to be related to college enrollment behavior byother researchers (for example, Manski and Wise, 1983; McDonough,1997).
Nonetheless, constructing the perfect, comparably large, nationally rep-resentative longitudinal database is cost prohibitive and an inefficient useof resources for most researchers. By using the NELS and noting its limita-tions, institutional and other researchers may help contribute to the devel-

81RACIAL AND ETHNIC GROUP DIFFERENCES IN COLLEGE ENROLLMENT
opment of a more perfect future NCES database. The NELS also providesan invaluable starting point from which researchers may supplement addi-tional methodologies (for example, qualitative) and additional samples.
References
Adelman, C. Answers in the Tool Box: Academic Intensity, Attendance Patterns, and Bach-elor’s Degree Attainment. Washington, D.C.: U.S. Department of Education, Office ofEducational Research and Improvement, 1999a.
Adelman, C. “The Rest of the River.” University Business, January/February, 1999b, 43–48.Arnold, K. D. “The Fulfillment of Promise: Minority Valedictorians and Salutatorians.”
Review of Higher Education, 1993, 16(3), 257–283.Becker, G. S. “Investment in Human Capital: A Theoretical Analysis.” Journal of Politi-
cal Economy, 1962, 70(supplement)(5), 9–49.Berkner, L., and Chavez, L. Access to Postsecondary Education for the 1992 High School
Graduates. Washington, D.C.: National Center for Education Statistics, U.S. Depart-ment of Education, U.S. Government Printing Office, 1997. (NCES 98–105)
Bourdieu, P., and Passeron, J. C. Reproduction in Education, Society, and Culture. BeverlyHills, Calif.: Sage, 1977.
Bowen, H. R. The Costs of Higher Education: How Much Do Colleges and Universities Spendper Student and How Much Should They Spend? San Francisco: Jossey-Bass, 1980
Bowen, H. R. Investment in Learning: The Individual and Social Value of American HigherEducation Baltimore: Johns Hopkins University Press, 1997. (Originally published 1977.)
Catsiapis, G. “A Model of Educational Investment Decisions.” Review of Economics andStatistics, 1987, 69, 33–41.
Chapman, D. “A Model of Student College Choice.” Journal of Higher Education, 1981,52(5), 490–505.
Coleman, J. S. “Social Capital in the Creation of Human Capital.” American Journal ofSociology, 1988, 94(supplement), 95–120.
DiMaggio, P., and Mohr, J. “Cultural Capital, Educational Attainment, and Marital Selec-tion.” American Journal of Sociology, 1985, 90(6), 1231–1261.
Falsey, B., and Heyns, B. “The College Channel: Private and Public Schools Reconsid-ered.” Sociology of Education, 1984, 57(2), 111–122.
Freeman, K. “Increasing African Americans’ Participation in Higher Education: AfricanAmerican High School Students’ Perspectives.” Journal of Higher Education, 1997,68(5), 523–550.
Fuller, W. C., Manski, C. F., and Wise, D. A. “New Evidence on the Economic Deter-minants of Postsecondary Schooling Choices.” The Journal of Human Resources, 1982,17(4), 477–498.
Gose, B. “Colleges Look for Ways to Reverse Decline in Enrollment of Men.” Chronicleof Higher Education, November 26, 1999, p. A73.
Haggerty, C., and others. Methodology Report: National Educational Longitudinal Study1988–1994. Washington, D.C.: National Center for Education Statistics, 1996.
Hearn, J. C. “The Relative Roles of Academic, Ascribed, and Socioeconomic Character-istics in College Destinations.” Sociology of Education, 1984, 57(1), 22–30.
Hebel, S. “A.P. Courses Are New Target in Struggle over Access to College in Califor-nia.” Chronicle of Higher Education, November 26, 1999, p. A32.
Heller, D. E. “Student Price Response in Higher Education: An Update to Leslie andBrinkman.” Journal of Higher Education, 1997, 68(6), 624–659.
Hogarth, R. M. Judgment and Choice: The Psychology of Decision. (2nd ed.) Chicago:Wiley, 1987.
Hoover-Dempsey, K., and Sandler, H. “Why Do Parents Become Involved in Their Chil-dren’s Education?” Review of Educational Research, 1997, 67(1), 3–42.

82 UNDERSTANDING THE COLLEGE CHOICE OF DISADVANTAGED STUDENTS
Hossler, D., Braxton, J., and Coopersmith, G. “Understanding Student College Choice.”In John C. Smart (ed.), Higher Education: Handbook of Theory and Research. Vol. 5.New York: Agathon Press, 1989.
Hossler, D., and Gallagher, K. S. “Studying Student College Choice: A Three-PhaseModel and the Implications for Policymakers.” College and University, 1987, 2(3),207–221.
Hossler, D., and Stage, F. “Family and High School Experience Influences on the Post-secondary Educational Plans of Ninth-Grade Students.” American Educational ResearchJournal, 1992, 29(2), 425–451.
Hossler, D., Schmit, J., and Vesper, N. Going to College: How Social, Economic, andEducational Factors Influence the Decisions Students Make. Baltimore: Johns HopkinsUniversity Press, 1999.
Hurtado, S., Inkelas, K. K., Briggs, C., and Rhee, B. S. “Differences in College Access andChoice Among Racial/Ethnic Groups: Identifying Continuing Barriers.” Research inHigher Education, 1997 38(1), 43–75.
Jackson, G. A. “Financial Aid, College Entry, and Affirmative Action.” American Journalof Education, 1990, 98(4), 523–550.
Kane, J., and Spizman, L. M. “Race, Financial Aid Awards, and College Attendance: Par-ents and Geography Matter.” American Journal of Economics and Sociology, 1994,53(1), 73–97.
Lamont, M., and Lareau, A. “Cultural Capital: Allusions, Gaps, and Glissandos in RecentTheoretical Developments.” Sociological Theory, 1988, 6(Fall), 153–168.
Lareau, A. “Social Class Differences in Family-School Relationships: The Importance ofCultural Capital.” Sociology of Education, 1987, 60(April), 73–85.
Leslie, L. L., and Brinkman, P. T. The Economic Value of Higher Education. New York:American Council on Education, Macmillan, 1988.
Manski, C. F., and Wise, D. A. College Choice in America. Cambridge: Harvard Univer-sity Press, 1983.
McDonough, P. M. Choosing Colleges: How Social Class and Schools Structure Opportunity.Albany: State University of New York Press, 1997.
McDonough, P. M., Antonio, A. L., and Trent, J. W. “Black Students, Black Colleges: AnAfrican American College-Choice Model.” Journal for a Just and Caring Education,1997, 3(1), 9–36.
McPherson, M. S. “How Can We Tell If Financial Aid Is Working?” In M. S. McPherson,M. O. Shapiro, and G. C. Winston (eds.), Paying the Piper: Productivity, Incentives, andFinancing in U.S. Higher Education. Ann Arbor: University of Michigan Press, 1993.
National Center for Education Statistics. Digest of Education Statistics. Washington, D.C.:National Center for Education Statistics, 1999.
National Center for Education Statistics (NCES). National Educational LongitudinalStudy of 1988. Restricted file. Washington, D.C.: National Center for Education Sta-tistics, U.S. Department of Education, 1996. (NCES 96–130)
Nettles, M. T., and Perna, L. W. The African American Education Data Book: The Transi-tion from School to College and School to Work. Vol. 3. Fairfax, Va.: Frederick D. Pat-terson Research Institute, 1997.
Nettles, M. T., Perna, L. W., and Freeman, K. E. Two Decades of Progress: African Amer-icans Moving Forward in Higher Education. Fairfax, Va.: Frederick D. PattersonResearch Institute, 1999.
Nolfi, G. J., and others. Experiences of Recent High School Graduates: The Transition toWork or Postsecondary Education. Lexington, Mass.: Lexington Books, 1978.
Orfield, G. “Exclusion of the Majority: Shrinking College Access and Public Policy inMetropolitan Los Angeles.” The Urban Review, 1988, 20(3), 147–183.
Perna, L. W. “Differences in College Enrollment Among African Americans, Hispanics,and Whites.” Journal of Higher Education, 2000a, 71(2), 117–141.

83RACIAL AND ETHNIC GROUP DIFFERENCES IN COLLEGE ENROLLMENT
Perna, L. W. “Racial/Ethnic Group Differences in the Realization of Educational Plans.”Paper presented at the annual meeting of the American Educational Research Associ-ation, New Orleans, Louisiana, April 2000b.
Perna, L.W., Fenske, R. H., and Swail, W. S. “An Overview of Early Intervention Pro-grams.” In Advances in Education Research, National Library of Education, forthcoming.
Rouse, C. E. “What to Do After High School: The Two-Year Versus Four-Year CollegeEnrollment Decision.” In R. G. Ehrenberg (ed.), Choices and Consequences: Contem-porary Policy Issues in Education. New York: IRL Press, 1994.
St. John, E. P. “What Really Influences Minority Attendance? Sequential Analyses of theHigh School and Beyond Sophomore Cohort.” Research in Higher Education, 1991,32(2), 141–158.
St. John, E. P., and Noell, J. “The Effects of Student Financial Aid on Access to HigherEducation: An Analysis of Progress with Special Consideration of Minority Enroll-ments.” Research in Higher Education, 1989, 30(6), 563–581.
Schwartz, J. B. “Student Financial Aid and the College Enrollment Decision: The Effectsof Public and Private Grants and Interest Subsidies.” Economics of Education Review,1985, 4(2), 129–144.
Stanton-Salazar, R. D. “A Social Capital Framework for Understanding the Socializationof Racial Minority Children and Youths.” Harvard Educational Review, 1997, 67(1),1–40.
Thomas, G. E. “Race and Sex Differences and Similarities in the Process of CollegeEntry.” Higher Education, 1980, 9(2), 179–202.
LAURA W. PERNA is assistant professor in the Department of Education Policyand Leadership at the University of Maryland.
