r graphics: what’s in it for you? - university of auckland
TRANSCRIPT

Paul Murrell R Graphics: What’s in it for You?
R Graphics:What’s in it for You?
Paul Murrell
The University of Auckland
CSIRO October 2011

Paul Murrell R Graphics: What’s in it for You?
Overview
� R can draw plots ...
� ... but so can lots of other software.
� So why use R?
� Customisable, extensible, programmable graphics

Paul Murrell R Graphics: What’s in it for You?
Overview
� R can draw plots ...
� ... but so can lots of other software.
� So why use R?
� Customisable, extensible, programmable graphics
Paul Murrell R Graphics: What’s in it for You?
Overview
� R can draw plots ...
� ... but so can lots of other software.
� So why use R?
� Customisable, extensible, programmable graphics

Paul Murrell R Graphics: What’s in it for You?
R Plots
� R can draw a wide range of plots.
Bar
ley
Yie
ld (
bush
els/
acre
)
04080
120
Svans
ota
No. 46
2
Man
chur
ia
No. 47
5
Velve
t
Peatla
nd
Glabro
n
No. 45
7
Wisc
onsin
No.
38Tr
ebi
Grand Rapids04080120
Duluth0
4080
120University Farm
04080120
Morris0
4080
120Crookston
04080120
Waseca

Paul Murrell R Graphics: What’s in it for You?
R Plots
� R can draw a wide range of plots.
disp
mpg
5
10
15
20
25
30
5
10
15
20
25
30
3
●
●●
●
●●
●
●●
●
●
●●
●
●
5
●
●
●
●
●
100 200 300 400
4
●●
●
●
●
●
●
●
●
●
●
●
100 200 300 400

Paul Murrell R Graphics: What’s in it for You?
R Plots
� R can draw a wide range of plots.
9
0
3
2
7
24
1

Paul Murrell R Graphics: What’s in it for You?
R Plots
� R can draw a wide range of plots.

Paul Murrell R Graphics: What’s in it for You?
R Plots
� We could argue about which software package has the widestrange of plots, but that’s just a spitting contest.
� A more interesting question is this:
If the software cannot already create the plot thatyou want, what are your options?
� One way to characterise R graphics is that it aims to provideyou with lots of options.
� R graphics is permissive.
Paul Murrell R Graphics: What’s in it for You?
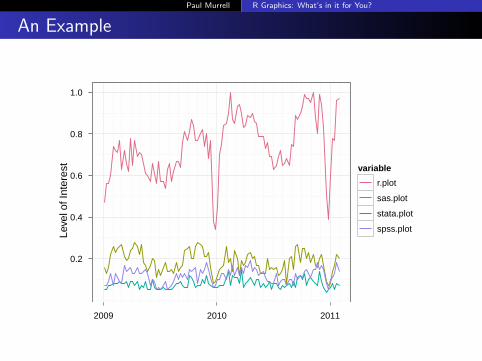
An Example
Leve
l of I
nter
est
0.2
0.4
0.6
0.8
1.0
2009 2010 2011
variable
r.plot
sas.plot
stata.plot
spss.plot

Paul Murrell R Graphics: What’s in it for You?
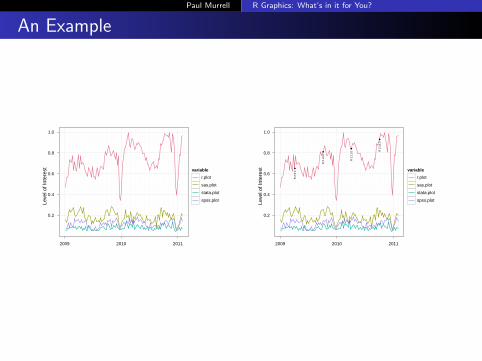
An Example
Leve
l of I
nter
est
0.2
0.4
0.6
0.8
1.0
2009 2010 2011
variable
r.plot
sas.plot
stata.plot
spss.plot
●
●
●
●
R
2.1
2.0
R
2.1
1.0
R
2.1
0.0
R
2.9
.0
Google Insights for Search 2011−10−20 14:31:04
BY−NC−SA

Paul Murrell R Graphics: What’s in it for You?
Why Use R?
� What are the features that R graphics provides that make thissort of customisation possible?
� In order to do it (in a simple, yet flexible and sophisticatedand rational and reproducible fashion) we need six importantfeatures:
1 The ability to write graphics code.2 The ability to draw simple shapes (low-level graphics).3 The ability to draw complex shapes (modern graphics).4 Access to multiple coordinate systems.5 The ability to arrange graphical components in a layout.6 The ability to query graphical objects.

Paul Murrell R Graphics: What’s in it for You?
2 Low-level Graphics
� R follows a“painters model” so that you can always add moreink to the page (on top of what is already there).
� A plot is just a whole lot of ink all at once.

Paul Murrell R Graphics: What’s in it for You?
2 Low-level Graphics
� R follows a“painters model” so that you can always add moreink to the page (on top of what is already there).
> xyplot( ... )
> grid.text( ... )
� A plot is just a starting point.

Paul Murrell R Graphics: What’s in it for You?
An ExampleLe
vel o
f Int
eres
t
0.2
0.4
0.6
0.8
1.0
2009 2010 2011
variable
r.plot
sas.plot
stata.plot
spss.plot
Leve
l of I
nter
est
0.2
0.4
0.6
0.8
1.0
2009 2010 2011
variable
r.plot
sas.plot
stata.plot
spss.plot
●
●
●
●
R
2.1
2.0
R
2.1
1.0
R
2.1
0.0
R
2.9
.0

Paul Murrell R Graphics: What’s in it for You?
An Example
Google Insights for Search 2011−10−20 14:31:05
BY−NC−SA
Leve
l of I
nter
est
0.2
0.4
0.6
0.8
1.0
2009 2010 2011
variable
r.plot
sas.plot
stata.plot
spss.plot
●
●
●
●
R
2.1
2.0
R
2.1
1.0
R
2.1
0.0
R
2.9
.0
Google Insights for Search 2011−10−20 14:31:04
BY−NC−SA

Paul Murrell R Graphics: What’s in it for You?
2 Low-level Graphics
� R provides basic drawing primitives.
A●
●
� A plot is just a whole lot of basic primitives (neatly arranged).

Paul Murrell R Graphics: What’s in it for You?
2 Low-level Graphics
� R provides basic drawing primitives.
> grid.circle(x = 0.5,
y = 0.5,
r = 0.1,
gp=gpar(col = "black",
lwd = 10,
fill = "grey"))

Paul Murrell R Graphics: What’s in it for You?
An Example
1 2
Google Insights for Search 2011−10−20 14:31:05
3
Google Insights for Search 2011−10−20 14:31:05
BY−NC−SA
4

Paul Murrell R Graphics: What’s in it for You?
3 Modern Graphics
� R provides features for general graphics (not just for plots)like alpha channels, complex paths, and raster images.

Paul Murrell R Graphics: What’s in it for You?
3 Modern Graphics
� R provides features for general graphics (not just for plots)like alpha channels, complex paths, and raster images.
> grid.circle(x = 0.5,
y = 0.6,
r = 0.2,
gp=gpar(lwd = 10,
rgb(red = 1, green = 0, blue = 0,
alpha = 0.5)))

Paul Murrell R Graphics: What’s in it for You?
3 Modern Graphics
� R provides features for general graphics (not just for plots)like alpha channels, complex paths, and raster images.

Paul Murrell R Graphics: What’s in it for You?
3 Modern Graphics
� R provides features for general graphics (not just for plots)like alpha channels, complex paths, and raster images.
> library("png")
> Rlogo <- readPNG(system.file("img", "Rlogo.png",
package = "png"))
> grid.raster(Rlogo,
x = 0.5, y = 0.5,
width = 0.8)

Paul Murrell R Graphics: What’s in it for You?
An Example
1
2
3 4
●
●
● ●
BY−NC−SA

Paul Murrell R Graphics: What’s in it for You?
4 Coordinate Systems
� Drawing a plot requires working in multiple coordinatesystems.
1:3
1:3
1.0
1.5
2.0
2.5
3.0
1.0 1.5 2.0 2.5 3.0
●
●
●
1

Paul Murrell R Graphics: What’s in it for You?
4 Coordinate Systems
� Drawing a plot requires working in multiple coordinatesystems.
1:3
1:3
1.0
1.5
2.0
2.5
3.0
1.0 1.5 2.0 2.5 3.0
●
●
●
1
1 3
1
3

Paul Murrell R Graphics: What’s in it for You?
4 Coordinate Systems
� Drawing a plot requires working in multiple coordinatesystems.
1:3
1:3
1.0
1.5
2.0
2.5
3.0
1.0 1.5 2.0 2.5 3.0
●
●
●
1
0 1
0
1

Paul Murrell R Graphics: What’s in it for You?
4 Coordinate Systems
� Drawing a plot requires working in multiple coordinatesystems.
1:3
1:3
1.0
1.5
2.0
2.5
3.0
1.0 1.5 2.0 2.5 3.0
●
●
●
1
0mm 10mm
0mm
10mm

Paul Murrell R Graphics: What’s in it for You?
4 Coordinate Systems
� Drawing a plot requires working in multiple coordinatesystems.
1:3
1:3
1.0
1.5
2.0
2.5
3.0
1.0 1.5 2.0 2.5 3.0
●
●
●
11mm below and right fromtop−left corner
2mm above and right from (1, 1)

Paul Murrell R Graphics: What’s in it for You?
4 Coordinate Systems
� Drawing a plot requires working in multiple coordinatesystems.
> grid.text("1mm below and right from top-left corner",
x = unit(0, "npc") + unit(1, "mm"),
y = unit(1, "npc") - unit(1, "mm"),
just = c("left", "top"))
> grid.text("2mm above and right from (1, 1)",
x = unit(1, "native") + unit(2, "mm"),
y = unit(1, "native") + unit(2, "mm"),
just = c("left", "bottom"))
Paul Murrell R Graphics: What’s in it for You?
An ExampleLe
vel o
f Int
eres
t
0.2
0.4
0.6
0.8
1.0
2009 2010 2011
variable
r.plot
sas.plot
stata.plot
spss.plot
Leve
l of I
nter
est
0.2
0.4
0.6
0.8
1.0
2009 2010 2011
variable
r.plot
sas.plot
stata.plot
spss.plot
●
●
●
●
R
2.1
2.0
R
2.1
1.0
R
2.1
0.0
R
2.9
.0

Paul Murrell R Graphics: What’s in it for You?
5 Layout
� Drawing a plot requires being able to arrange multiplecoordinate systems.
1:3
1:3
1.0
1.5
2.0
2.5
3.0
1.0 1.5 2.0 2.5 3.0
●
●
●
1

Paul Murrell R Graphics: What’s in it for You?
5 Layout
� Drawing a plot requires being able to arrange multiplecoordinate systems.

Paul Murrell R Graphics: What’s in it for You?
5 Layout
� Drawing a plot requires being able to arrange multiplecoordinate systems.
1:3
1:3
1.0
1.5
2.0
2.5
3.0
1.0 1.5 2.0 2.5 3.0
●
●
●
1

Paul Murrell R Graphics: What’s in it for You?
5 Layout
� Drawing a plot requires being able to arrange multiplecoordinate systems.
> pushViewport(viewport(width = 0.5, height = 0.5,
name = "plotvp"))
> upViewport(1)
> downViewport("plotvp")

Paul Murrell R Graphics: What’s in it for You?
An Example
Leve
l of I
nter
est
0.2
0.4
0.6
0.8
1.0
2009 2010 2011
variable
r.plot
sas.plot
stata.plot
spss.plot
●
●
●
●
R
2.1
2.0
R
2.1
1.0
R
2.1
0.0
R
2.9
.0
Leve
l of I
nter
est
0.2
0.4
0.6
0.8
1.0
2009 2010 2011
variable
r.plot
sas.plot
stata.plot
spss.plot
●
●
●
●
R
2.1
2.0
R
2.1
1.0
R
2.1
0.0
R
2.9
.0
Google Insights for Search 2011−10−20 14:31:09
Leve
l of I
nter
est
0.2
0.4
0.6
0.8
1.0
2009 2010 2011
variable
r.plot
sas.plot
stata.plot
spss.plot
●
●
●
●
R
2.1
2.0
R
2.1
1.0
R
2.1
0.0
R
2.9
.0
Google Insights for Search 2011−10−20 14:31:10
BY−NC−SA

Paul Murrell R Graphics: What’s in it for You?
6 Graphical Objects
� In R graphics, it is possible to access, query and modifycomponents of a plot.
plot_01.background
plot_01.xlab
plot_01.ylab
plot_01.ticks.top.panel.1.1
plot_01.ticks.left.panel.1.1
plot_01.ticklabels.left.panel.1.1
plot_01.ticks.bottom.panel.1.1
plot_01.ticklabels.bottom.panel.1.1
plot_01.ticks.right.panel.1.1
plot_01.xyplot.points.panel.1.1
plot_01.border.panel.1.1
plot_01.bg.strip.1.1
plot_01.fg.strip.1.1
plot_01.textl.strip.1.1
plot_01.border.strip.1.1 1:3
1:3
1.0
1.5
2.0
2.5
3.0
1.0 1.5 2.0 2.5 3.0
●
●
●
1

Paul Murrell R Graphics: What’s in it for You?
6 Graphical Objects
� In R graphics, it is possible to access, query and modifycomponents of a plot.
> grid.text("BY-NC-SA",
x = unit(1, "npc") - unit(1, "mm"),
just = c("right"),
name = "cclabel")
> ccx <- unit(1, "npc") - unit(1, "mm") -
grobWidth("cclabel")
> grid.edit("cclabel", gp=gpar(fontface="bold"))

Paul Murrell R Graphics: What’s in it for You?
An Example
BY−NC−SA
BY−NC−SA
BY−NC−SA

Paul Murrell R Graphics: What’s in it for You?
A Bit of Razzmatazz
Dynamic and Interactive Demo

Paul Murrell R Graphics: What’s in it for You?
1 Code for Graphics
� We create an image in R using code.

Paul Murrell R Graphics: What’s in it for You?
1 Code for Graphics
� We create an image in R using code.
library(EBImage)trim <− function(col) {
if (any(col < 0 | col > 1)) {col[col < 0] <− 0col[col > 1] <− 1
}col
}as.raster.Image <− function(x) {
# For now, bail if there is more than one imageif (getNumberOfFrames(x, "render") > 1)
stop("Cannot handle multiple frames")image <− imageData(x)# Either a grey scale or a color imageif (colorMode(x) == 0) { # Grayscale
r <− grey(image)dim(r) <− dim(image)
} else { # Colorr <− rgb(aperm(trim(image[,,1])),
aperm(trim(image[,,2])),aperm(trim(image[,,3])))
dim(r) <− dim(image)[2:1]}r
}tree <− as.raster(readImage("/scratch/TealBay/tree.jpg"))rock <− as.raster(readImage("/scratch/TealBay/rock.jpg"))rope <− as.raster(readImage("/scratch/TealBay/rope.jpg"))sand <− as.raster(readImage("/scratch/TealBay/sand.jpg"))gull <− as.raster(readImage("/scratch/TealBay/gull.jpg"))hill <− as.raster(readImage("/scratch/TealBay/hill.jpg"))sign <− as.raster(readImage("/scratch/TealBay/sign.jpg"))pohu <− as.raster(readImage("/scratch/TealBay/pohu.jpg"))
library(grid)imageLayout <− grid.layout(4, 5,
widths=c(2, 1.5, 2, 1, 2.5),heights=c(2.5, .5, 2, 1),respect=TRUE)
margin <− unit(20, "mm")drawImage <− function(c, r, img=NULL, rot=FALSE, width=NULL, height=NULL,
...) {pushViewport(viewport(layout.pos.col=c,
layout.pos.row=r),viewport(width=unit(1, "npc") − margin,
height=unit(1, "npc") − margin))if (is.null(img)) {
grid.rect()} else {
if (rot) {pushViewport(viewport(width=convertUnit(unit(1, "npc"),
"npc", "y", "dimension", "x", "dimension"),height=convertUnit(unit(1, "npc"),
"npc", "x", "dimension", "y", "dimension"),angle=90,clip=TRUE))
} else {pushViewport(viewport(clip=TRUE))
}grid.raster(img, width=width, height=height, ...)# grid.rect()popViewport()
}popViewport(2)
}
jpeg("tealbay.jpg", width=3600, height=2400)grid.newpage()grid.rect(gp=gpar(col=NA, fill="white"))pushViewport(viewport(width=unit(1, "npc") − margin,
height=unit(1, "npc") − margin,layout=imageLayout))
pushViewport(viewport(layout.pos.col=1:4))grid.rect(width=unit(1, "npc") + margin,
height=unit(1, "npc") + margin,gp=gpar(col=NA, fill="white"))
popViewport()drawImage(1, 1, tree, width=2)drawImage(1, 2:3, rock, height=1, y=1, just="top")drawImage(2, 1:3, rope, TRUE, width=1, y=.45)drawImage(1:3, 4, sand, width=1, height=1.5, y=0, just="bottom")drawImage(3, 2:3, gull, width=2, y=0, just="bottom")drawImage(3:5, 1, hill, width=1.5, y=1, vjust=.85)drawImage(4:5, 2, sign, width=2, vjust=.605)drawImage(4:5, 3:4, pohu, height=1, x=1, just="right")popViewport()dev.off()

Paul Murrell R Graphics: What’s in it for You?
1 Code for Graphics
� This means that ...� we have a record of what we did.� we can easily repeat what we did.� we can create a similar image by slightly modifying what we
did.� we can create lots of images easily (batch jobs).� we can easily and accurately show someone else what we did
(and they can do exactly what we did, or something similar).� we can generate plot content on-the-fly (e.g., time stamps).� we can express complex ideas (edit all graphical objects that
match a pattern).

Paul Murrell R Graphics: What’s in it for You?
1 Code for Graphics
� Because R is a programming language, we can encapsulatecode in functions or even packages.
� It also doesn’t hurt that R is a statistical programminglanguage.
� We can add a least-squares line to a plot.
� It hurts even less that R is open source.� We can easily share and build on each other’s code.

Paul Murrell R Graphics: What’s in it for You?
An Example
> plotframe("Title goes here")
Title goes here 2011−10−20 14:31:11
BY−NC−SA

Paul Murrell R Graphics: What’s in it for You?
An Example
> plotframe("Google Insights for Search")
> ggplot( ... )Le
vel o
f Int
eres
t
0.2
0.4
0.6
0.8
1.0
2009 2010 2011
variable
r.plot
sas.plot
stata.plot
spss.plot
●
●
●
●
R
2.1
2.0
R
2.1
1.0
R
2.1
0.0
R
2.9
.0
Google Insights for Search 2011−10−20 14:31:04
BY−NC−SA

Paul Murrell R Graphics: What’s in it for You?
An Example
> plotframe("Lattice Multipanel Conditioning")
> xyplot( ... )
Lattice Multipanel Conditioning 2011−10−20 14:31:11
BY−NC−SA
Bar
ley
Yie
ld (
bush
els/
acre
)
04080
120
Svans
ota
No. 46
2
Man
chur
ia
No. 47
5
Velve
t
Peatla
nd
Glabro
n
No. 45
7
Wisc
onsin
No.
38Tr
ebi
Grand Rapids04080120
Duluth0
4080
120University Farm
04080120
Morris0
4080
120Crookston
04080120
Waseca

Paul Murrell R Graphics: What’s in it for You?
An Example
> plotframe("Australian Population Density")
> oz( ... )
Australian Population Density 2011−10−20 14:31:11
BY−NC−SA
9
0
3
2
7
24
1

Paul Murrell R Graphics: What’s in it for You?
Summary
� Why use R?� Because if R can’t already do what you want, it gives you lots
of tools so you can do it yourself.� Customisability:
� Because of the painters model.� Because you can draw basic shapes.� Because you have access to coordinate systems.� Because you have access to graphical objects.
� Extensibility:� Because you can write code.� Because you can see others’ code.� Because you have access to the same tools that others use.
� Programmability:� Because you write code to draw stuff.� Because R is a programming language.� Because R is a graphics language.
Paul Murrell R Graphics: What’s in it for You?
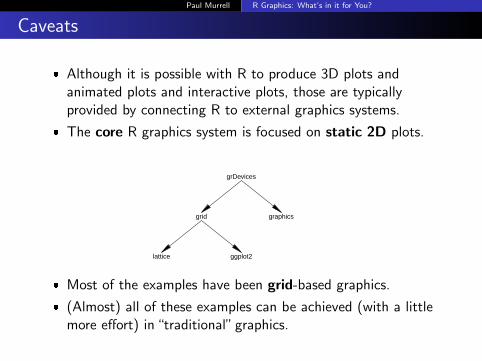
Caveats
� Although it is possible with R to produce 3D plots andanimated plots and interactive plots, those are typicallyprovided by connecting R to external graphics systems.
� The core R graphics system is focused on static 2D plots.
grDevices
grid graphics
lattice ggplot2
� Most of the examples have been grid-based graphics.
� (Almost) all of these examples can be achieved (with a littlemore effort) in“traditional”graphics.
Paul Murrell R Graphics: What’s in it for You?
Further Reading
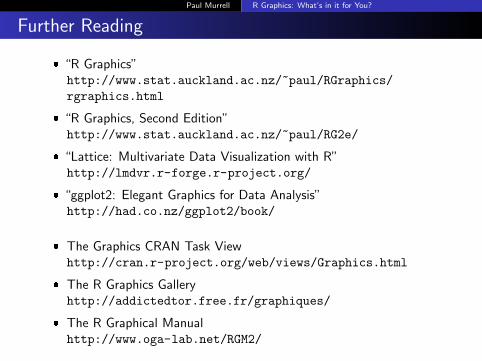
� “R Graphics”http://www.stat.auckland.ac.nz/~paul/RGraphics/rgraphics.html
� “R Graphics, Second Edition”http://www.stat.auckland.ac.nz/~paul/RG2e/
� “Lattice: Multivariate Data Visualization with R”http://lmdvr.r-forge.r-project.org/
� “ggplot2: Elegant Graphics for Data Analysis”http://had.co.nz/ggplot2/book/
� The Graphics CRAN Task Viewhttp://cran.r-project.org/web/views/Graphics.html
� The R Graphics Galleryhttp://addictedtor.free.fr/graphiques/
� The R Graphical Manualhttp://www.oga-lab.net/RGM2/

Paul Murrell R Graphics: What’s in it for You?
Acknowledgements
� The Creative Commons logo is available fromhttp://creativecommons.org/about/downloads under aCreative Commons Attribution license.
� The GNU logo is by Aurelio A. Heckert and is available fromhttp://commons.wikimedia.org/wiki/Image:Heckert_GNU_white.svg under a Free Art Licence.
� The Google Search data are fromhttp://www.google.com/insights/search/

Paul Murrell R Graphics: What’s in it for You?
Acknowledgements
The following R packages were used in the production of theseslides:
� ggplot2 by Hadley Wickham.
� graph (maintained) by Seth Falcon (Bioconductor).
� gridBase by Paul Murrell.
� gridSVG by Paul Murrell and Simon Potter.
� grImport by Paul Murrell and Richard Walton.
� lattice by Deepayan Sarkar.
� maps (maintained) by Ray Brownrigg.
� oz (maintained) by Kurt Hornik.
� png by Simon Urbanek.
� reshape by Haldey Wickham.
� Rgraphviz (maintained) by Kasper Hansen (Bioconductor).