questionnaire - shodhgangashodhganga.inflibnet.ac.in/bitstream/10603/10353/16/16_appendix.pdf ·...
TRANSCRIPT

i
QUESTIONNAIRE
1. Name of the Firm ………………………………………….
2. Year of Start up …………………………………………….
3. Location of Management Capital City ( )
Large City ( )
Small City or Country Side ( )
4. Does your Firm Export ? Yes ( ) No( )
5. Does your firm have Internet Access ? Yes ( ) No ( )
6. Does your firm have own generator because of unreliable or fluctuating power
supply?
Yes( ) No( )
7. Please judge how problematic are these areas for the operation and growth of
your business.
Major Obstacle Minor Obstacle
Labor regulation as a growth bottleneck
Skill shortage as a growth bottleneck
Bank services as a growth bottleneck
8. Please judge about quality of infrastructure
Good Bad
Postal services
Infrastructure facilities
Electric services

ii
9. Please judge how problematic are these different regulatory areas for the
operation and growth of your business.
Major Obstacle Minor Obstacle
Custom services as a growth bottleneck
Corruption as a growth bottleneck
Business licensing as a growth bottleneck
Tax regulation as a growth bottleneck
Days to get a power connection
Days to get a fixed line connection
Percentage of time spent with senior management
10. Does your firm believe that tax policy of the government is favorable?
Yes( ) No( )
11. What percentage of senior management's time per year is spent in dealing
with government officials about the application and interpretation of laws and
regulations? ---------%
12. Does your firm believe that the tax policy of the government is favorable?
Yes ( ) No( )
Thank you very much for having taken time to complete this questionnaire
and for your corporation.
Seema Saini

iii
APPENDIX
'A'
S.No. Name of Firms (Punjab)
1. Aarti Drugs Ltd.
2. Aarti Industries ltd.
3. Agro Chemicals Ltd.
4. Apollo Tyres Ltd.
5. IOL Chemicals Ltd.
6. Golden Laminates ltd.
7. Ind- Swift Ltd.
8. Max India ltd.
9. Oswal Chemicals ltd.
10. Panacea Biotech Ltd.
11. Punjab Alkalies Ltd.
12. Punjab Chemicals ltd
13. Ranbaxy Laboratory Ltd.
14. Adarsh Derivates Ltd.
15. Agro Ducth Ltd.
16. Agro Tech Ltd.
17. Amrit Corp Ltd.
18. Indian Sucrose Ltd.
19. Milk Specilalities Ltd.
20. Milk food Ltd.
21. Oswal Overseas Ltd.
22. PiccadlyAllied Industries Ltd.

iv
23. Rana Sugars Ltd.
24. Sukhjit starch Ltd.
25. Hawkins Cookers Ltd.
26. Industrial Cables Ltd.
27. JCT Electronics Ltd.
28. Kirloskar Brothers Ltd.
29. Kirloskar Electricals Ltd.
30. Kirloskar Oil Engines Ltd.
31. Kirloskar Pneumatic Ltd.
32. Lakshmi Machine Works Ltd.
33. Mazda Ltd.
34. Opal Industries Ltd.
35. Precision Electronics Ltd.
36. Precision Wires Ltd.
37. Punjab Communications Ltd.
38. Punjab Tractors Ltd.
39. Swaraj Engines Ltd.
40. Aarti Steels Ltd.
41. Bhushan Steels Ltd.
42. Essar Steels Ltd.
43. JMP Castings Ltd.
44. Modern steels Ltd.
45. Mukesh Steels Ltd.
46. Pioneer Alloy Castings Ltd.
47. Steel Strips Ltd.
48. Stelco Strips Ltd.

v
49. Tata steels Ltd.
50. Upper steels Ltd.
51. Vallabh steels ltd.
52. Vardhman Industries Ltd.
53. Abhisheek Industries Ltd.
54. Adinath Industries Ltd.
55. Bhandari Industries Ltd.
56. Girnar Fibres Ltd.
57. Gupta Synthetics Ltd.
58. JCT Ltd.
59. Jyoti Overseas Ltd.
60. Kuvam International Ltd.
61. Malwa industries Ltd.
62. Nahar Investments Ltd.
63. Nahar Spinning Ltd.
64. Oswal spinning Mills Ltd.
65. Overseas synthecis Ltd.
66. Punjab Fibres Ltd.
67. Punjab Woolcombers Ltd.
68. SR Industries Ltd.
69. Vardhman Polytex Ltd.
70. Vardhman Textiles Ltd.
71. Winsome Textiles Ltd.
72. Winsome Yarns Ltd.
73. Clucth Auto Ltd.
74. Venus Industries Ltd.

vi
75. XLO India Ltd.
76. Accurate Transformers Ltd.
77. Swaraj Mazda Ltd.
78. Mount Shivalik Ltd.
79. G.S Auto Ltd
80. Jagatjit Industries Ltd.
81. Hero Cycles ltd.
82. Prime Industries Ltd.
83. Krishna Engineering Ltd.
84. Indian Acrylics Ltd.
85. Jai Parabolic Ltd.
86. Steel strips Ltd.
87. HFCL Ltd.
88. Atlas Cycles Ltd.
89. Gammon Industries Ltd.
90. Gobind Sugar Mills Ltd.

vii
'B'
S.No. Name of Firms (Haryana)
1. Arcee Industries Ltd.
2. Bhagawati Gases Ltd.
3. Bharat Rasayan Ltd.
4. Capsugel Healthcare Ltd.
5. Dabur India Ltd.
6. Dhanuka Agritech Ltd.
7. Goodyear India Ltd.
8. Haryana Leather Chemicals Ltd.
9. I C I India Ltd.
10. Indian Oil Corporation Ltd.
11. Indo Borax & Chemicals Ltd.
12. Indo Gulf Industries Ltd.
13. Indo Vanillion Chemicals Ltd.
14. Innovative Tech Pack Ltd.
15. J M G Corporation Ltd.
16. Jindal Poly Films Ltd.
17. Laurel Organics Ltd.
18. Machino Plastics Ltd.
19. Milton Plastics Ltd.
20. National Fertilizers Ltd.
21. R T Packaging Ltd.
22. Anant Raj Industries. Ltd.
23. D L F Ltd.

viii
24. Jindal Drilling & Industries. Ltd.
25. Raunaq International Ltd.
26. A N S Agro Industries. Ltd.
27. Bambino Agro Industries. Ltd.
28. Doon Valley Rice Ltd.
29. Haryana Milk Foods Ltd.
30. Haryana Suraj Malting Ltd.
31. Industrial Progressive (India) Ltd.
32. Innovative Foods Ltd.
33. K M G Milk Food Ltd.
34. Kwality Dairy (India) Ltd.
35. Modern Dairies Ltd.
36. Nestle India Ltd.
37. Piccadilly Agro Industries Ltd.
38. Saraswati Industrial Syndicate Ltd.
39. Vikas W S P Ltd.
40. Hartron Networks Ltd.
41. Jost's Engineering Co. Ltd.
42. Mitsubishi Heavy Industries Ltd.
43. Coventry Coil-O-Matic (Haryana) Ltd.
44. Haryana Ship Breakers Ltd.
45. Haryana Steel & Alloys Ltd.
46. Hindustan Wires Ltd.
47. Jindal Industries Ltd.
48. Jindal Saw Ltd.
49. Jotindra Steel & Tubes Ltd.

ix
50. Lakshmi Precision Screws Ltd.
51. Mukand Ltd.
52. Ravindra Tubes Ltd.
53. Oriental Carbon & Chemicals Ltd.
54. Aggarsain Spinners Ltd.
55. Ashnoor Textile Mills Ltd.
56. H P Cotton Textile Mills Ltd.
57. Haryana Petrochemicals Ltd.
58. Haryana Texprints (Overseas) Ltd.
59. Hisar Spinning Mills Ltd.
60. Indo Count Industries. Ltd.
61. Indo Rama Synthetics (India) Ltd.
62. Jai Mata Industries. Ltd.
63. Jasch Industries Ltd.
64. Pasupati Spinning & Weaving. Mills Ltd.
65. R L F Ltd.
66. Super Sales India Ltd.
67. Bhagwati Industries Ltd.
68. Gabriel Industries Ltd.
69. Bharat Industries ltd.
70. Eicher Tractors Ltd.
71. GKN Driveline Ltd.
72. Hero Honda Motors Ltd.
73. India forge and Drop Stampings Ltd.
74. Jay Bharat Maruti Ltd.
75. Jotindra Tubes Ltd.

x
76. Atlas Cycles Ltd.
77. Amtek Auto Ltd.
78. Jamna Auto Ltd.
79. Maruti Suzuki Ltd.
80. LML Ltd.
81. Munjal Auto Ltd.
82. Milton Cycles ltd.
83. Talbros Automotive Ltd.
84. Munjal showa ltd.
85. Omax Auto Ltd.
86. Raunaq Auto Ltd.
87. Rasandik Engineering ltd.
88. Rico auto Ltd.
89. Pasupati Acrylon Ltd.
90. Milton Cycles Ltd.

xi
'C'
Sample Firms of Punjab Considered for Primary Survey
1. Hero cycles Ltd.
2. Majestic Auto Ltd.
3. Vardhman Textile Ltd.
4. Nahar Spinning Mills Ltd.
5. Sukhjit Starch and Chemicals Ltd.
6. Oswal Chemicals and Fertilizers Ltd.
7. Girnar Fibres Ltd.
8. Mukesh Strips Ltd.
9. Bhatia Chemicals Ltd.
10. Abhisheek Industries Ltd.
11. Aarti Drugs Ltd.
12. Aarti Industries Ltd.
13. Kuvam International Fashions Ltd.
14. ADDI Industries Ltd.
15. JCT Ltd.
16. Vardhman Polytex Ltd.
17. Nahar Investment and Holdings Ltd.
18. G.S. Auto International Ltd.
19. Malwa Cotton and Spinning Mills Ltd.
20. Aarti Steels Ltd.

xii
'D'
Sample Firms of Punjab Considered for Primary Survey
1. DLF Ltd.
2. Bharat Gears Ltd.
3. Omax Auto Ltd.
4. Atlas Cycles Ltd.
5. Haryana Milk Foods Ltd.
6. Jasch Industries Ltd.
7. ANS Agro Industries Ltd.
8. Haryana Steel and Alloys Ltd.
9. Hartron Communications Ltd.
10. Haryana Leather and Chemical Ltd.
11. Haryana Text Prints Overseas Ltd.
12. H.P. Cotton Textiles Mills Ltd.
13. Hisar Metal Industries Ltd.
14. Frick India Ltd.
15. Goodyear India Ltd.
16. Machino Plastics Ltd.
17. Rollatainers Ltd.
18. Kwality Dairy Ltd.
19. Jindal Drilling Industries Ltd.
20. Milton Cycles Ltd.

xiii
Investment Climate Indicators of Punjab : Results of Factor Analysis (1994)
variables F1 F2 F3 F4 Communities Weights Percentage of
weights
X9 Power expenses 0.964 0.149 -0.039 0.102 0.964 44.86 16.00
X4 Borrowing 0.960 0.021 -0.032 0.127 0.939 44.69 15.93
X2 Gross fixed assets 0.953 0.066 -0.059 0.122 0.932 44.37 15.81
X7 Interest 0.873 0.330 -0.003 -0.015 0.871 40.64 14.48
X3 Depreciation 0.746 0.624 -0.038 0.065 0.953 34.73 12.38
X6 Tax 0.099 0.863 -0.004 0.098 0.765 19.51 6.955
X10 Advertisement and marketing
0.339 0.721 0.003 -0.035 0.637 16.30 5.811
X8 Raw material expenses 0.652 0.683 0.118 -0.09 0.904 15.44 5.504
X1 Gross sales 0.056 0.019 0.996 0.017 0.996 10.10 3.600
X5 Net profits 0.156 0.056 0.017 0.976 0.980 9.84 3.508
Percentage of variance explained 46.56 22.61 10.14 10.09 Total 280.50 100
Percentage of cumulative variance explained
46.56 69.18 79.32 89.41

xiv
Investment Climate Indicators of Punjab : Results of Factor Analysis (1995)
variables F1 F2 F3 F4 Communities Weights Percentage of
weights
X9 Power expenses 0.948 0.204 0.193 -0.038 0.979 41.24 14.71
X4 Borrowing 0.926 0.045 0.316 -0.024 0.959 40.29 14.37
X2 Gross fixed assets 0.926 0.068 0.302 -0.033 0.954 40.29 14.37
X7 Interest 0.831 0.400 0.024 -0.049 0.854 36.15 12.89
X3 Depreciation 0.689 0.621 0.152 -0.052 0.887 29.98 10.69
X6 Tax -0.066 0.964 0.092 -0.018 0.943 27.53 9.82
X10 Advertisement and marketing
0.263 0.909 0.055 -0.022 0.898 25.96 9.26
X8 Raw material expenses 0.537 0.705 -0.609 0.011 0.791 20.13 7.18
X5 Net profits 0.456 0.098 0.863 -0.032 0.964 8.74 3.48
X1 Gross sales -0.054 -0.025 -0.024 0.998 1.000 10.03 3.58
Percentage of variance explained 43.51 28.56 10.13 10.05 Total 280.34 100
Percentage of cumulative variance
explained
43.51 72.08 82.21 92.27

xv
Investment Climate Indicators of Punjab : Results of Factor Analysis (1996)
variables F1 F2 F3 F4 Communities Weights Percentage of
weights
X2 Gross fixed assets 0.972 0.055 0.123 -0.014 0.963 39.10 14.23
X4 Borrowing 0.965 0.032 0.136 -0.080 0.952 38.82 14.13
X9 Power expenses 0.957 0.223 0.120 -0.020 0.981 38.50 14.02
X7 Interest 0.808 0.444 0.034 -0.006 0.852 32.50 11.84
X10 Advertisement and
marketing
0.190 0.948 0.103 0.001 0.945 29.89 10.88
X6 Tax -0.046 0.933 0.151 -0.034 0.896 29.41 10.71
X8 Raw material expenses 0.316 0.851 -0.067 0.040 0.830 26.83 9.77
X3 Depreciation 0.626 0.628 0.064 -0.030 0.791 19.80 7.21
X5 Net profits 0.216 0.121 0.960 0.014 0.984 9.73 3.54
X1 Gross sales -0.028 -0.03 0.13 0.999 0.999 10 0.04
Percentage of variance explained 40.23 31.53 10.14 10.03 Total 274.58 100
Percentage of cumulative variance
explained
40.23 71.76 81.90 91.92

xvi
Investment Climate Indicators of Punjab : Results of Factor Analysis (1997)
variables F1 F2 F3 F4 Communities Weights Percentage of
weights
X4 Borrowings 0.904 0.005 -0.034 0.094 0.828 35.92 15.15
X7 Interest 0.902 -0.018 -0.050 0.060 0.620 35.84 15.11
X3 Depreciation 0.818 0.143 -0.053 0.145 0.713 29.36 13.70
X8 Raw material expenses 0.739 0.173 -0.091 -0.217 0.631 27.82 12.38
X9 Power expenses 0.700 -0.078 0.255 0.063 0.565 22.37 11.73
X6 Tax 0.563 0.449 -0.090 -0.122 0.542 22.37 9.43
X10 Advertisement and
marketing expenses
0.563 0.349 -0.256 -0.154 0.529 11.07 9.66
X5 Net profits 0.001 0.909 0.076 0.108 0.873 9.92 4.18
X2 Gross fixed assets 0.028 0.049 0.99 -0.055 0.900 9.88 4.16
X1 Gross sales 0.054 0.061 0.49 0.950 0.912
Percentage of variance explained 39.74 12.11 10.56 10.40 Total 237.06 100
Percentage of cumulative variance
explained
39.74 51.85 62.41 72.81

xvii
Investment Climate Indicators of Punjab : Results of Factor Analysis (1998)
variables F1 F2 F3 F4 Communities Weights Percentage of
weights
X4 Borrowings 0.942 0.170 0.223 0.003 0.965 44.04 15.80
X3 Depreciation 0.935 0.237 0.196 0.013 0.969 43.71 15.68
X9 Power expenses 0.907 0.380 0.140 0.007 0.986 42.40 15.21
X7 Interest 0.849 0.515 -0.076 -0.005 0.991 39.69 14.24
X1 Gross sales 0.165 0.917 -0.029 -0.070 0.870 26.47 9.49
X8 Raw material expenses 0.620 0.747 -0.062 0.016 0.947 21.56 7.73
X6 Tax 0.669 0.704 -0.033 0.030 0.946 20.32 7.29
X10 Advertisement and
marketing expenses
0.681 0.702 -0.014 0.026 0.957 20.26 7.26
X2 Gross fixed assets 0.222 -0.065 0.969 0.015 0.992 10.25 3.67
X5 Net profits 0.009 0.009 0.019 1.000 1.000 10.02 3.59
Percentage of variance explained 46.75 28.87 10.58 10.02 Total 278.72 100
Percentage of cumulative variance
explained
46.75 75.63 86.21 96.23

xviii
Investment Climate Indicators of Punjab : Results of Factor Analysis (1999)
variables F1 F2 F3 F4 Communities Weights Percentage of
weights
X7 Interest 0.910 -0.040 -0.048 -0.174 0.862 26.11 17.40
X4 Borrowings 0.890 -0.021 -0.092 -0.119 0.816 25.61 17.07
X3 Depreciation 0.779 0.063 0.346 -0.181 0.763 22.42 14.94
X9 Power expenses 0.647 0.241 0.005 0.267 0.548 18.62 12.41
X8 Raw material expenses 0.444 0.724 -0.054 -0.162 0.751 11.30 7.53
X6 Tax -0.028 0.704 0.392 -0.211 0.695 10.99 73.21
X5 Net profits -0.128 0.632 -0.108 0.241 0.486 9.86 6.57
X10 Advertisement and marketing expenses
0.129 0.272 0.020 -0.032 0.183 4.24 2.82
X1 Gross sales 0.024 0.016 0.937 0.27 0.879 11.02 7.34
X2 Gross fixed assets -0.042 0.041 0.008 0.871 0.762 9.82 6.54
Percentage of variance explained 28.78 15.16 11.77 11.28 Total 150.01 100
Percentage of cumulative variance
explained
28.78 44.39 56.16 67.45

xix
Investment Climate Indicators of Punjab : Results of Factor Analysis (2001)
variables F1 F2 F3 F4 Communities Weights Percentage of
weights
X7 Interest 0.985 0.004 -0.066 -0.002 0.975 59.86 14.13
X4 Borrowings 0.983 -0.034 -0.021 -0.014 0.968 59.73 14.10
X8 Raw material expenses 0.972 0.114 0.022 -0.008 0.959 59.66 14.09
X9 Power expenses 0.971 -0.054 0.026 -0.011 0.946 59.00 13.93
X3 Depreciation 0.968 -0.005 -0.020 -0.023 0.938 58.82 13.89
X10 Advertisement and
marketing expenses
0.951 0.138 0.012 -0.009 0.924 57.79 13.64
X1 Gross sales 0.640 -0.099 0.159 -0.076 0.450 38.89 9.18
X6 Tax 0.010 0.938 0.102 -0.007 0.986 9.68 2.28
X5 Net profits 0.026 0.104 0.985 0.020 0.982 9.98 2.35
X2 Gross fixed assets -0.036 -0.007 -0.021 0.998 0.998 10 0.02
Percentage of variance explained 60.77 10.32 10.13 10.03 Total 423.42 100
Percentage of cumulative variance
explained
60.77

xx
Investment Climate Indicators of Punjab : Results of Factor Analysis (2002)
variables F1 F2 F3 F4 Communities Weights Percentage of
weights
X8 Raw material expenses 0.975 0.221 -0.006 0.004 0.999 63.51 13.68
X7 Interest 0.970 0.237 -0.015 0.006 0.997 63.18 13.61
X4 Borrowings 0.961 0.256 -0.015 0.010 0.989 62.59 13.40
X3 Depreciation 0.960 0.259 -0.016 0.013 0.988 62.53 13.47
X9 Power expenses 0.960 0.260 -0.012 0.014 0.989 62.53 13.47
X6 Tax 0.952 0.268 -0.007 0.010 0.977 62.01 13.35
X10 Advertisement and
marketing expenses
0.879 0.014 0.017 -0.008 0.773 57.26 12.33
X2 Gross fixed assets 0.424 0.895 0.002 -0.027 0.981 10.54 2.27
X5 Net profits -0.011 0.001 1.000 0.020 1.000 10.01 2.15
X1 Gross sales 0.012 -0.018 0.020 0.999 1.000 9.99 2.15
Percentage of variance explained 65.14 11.78 10.01 10.00 Total 464.15 100
Percentage of cumulative variance
explained
65.14 76.92 86.93 96.94
xxi
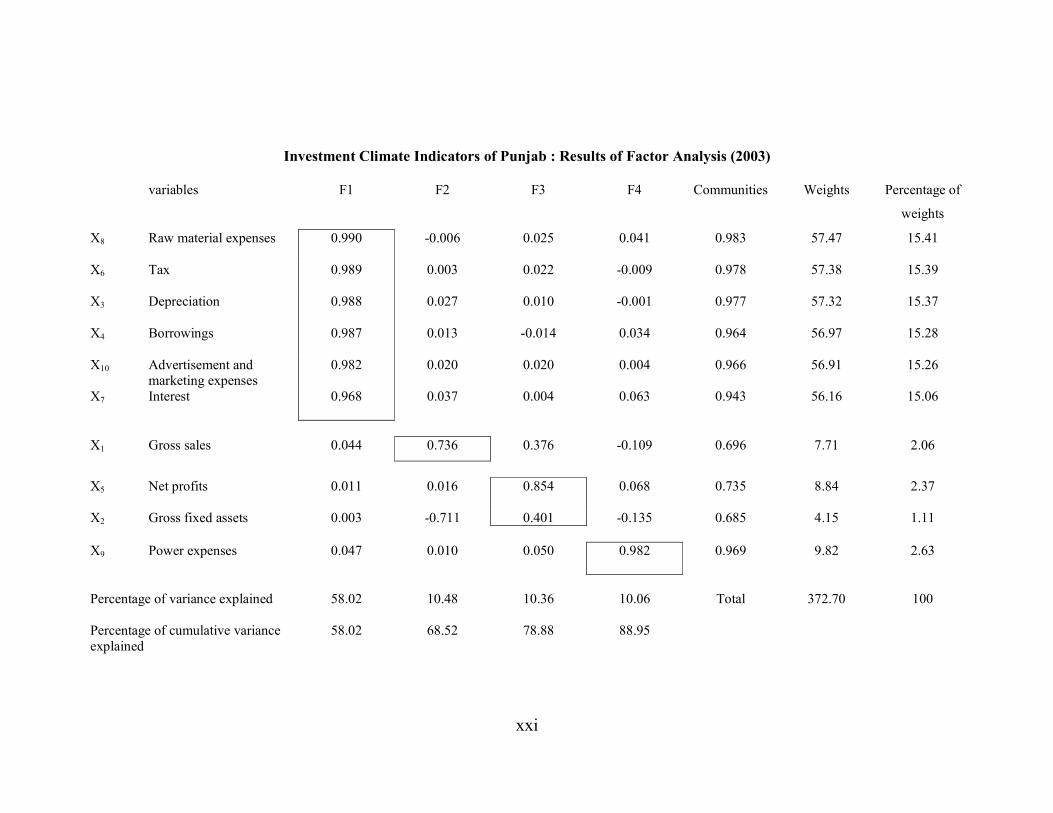
Investment Climate Indicators of Punjab : Results of Factor Analysis (2003)
variables F1 F2 F3 F4 Communities Weights Percentage of
weights
X8 Raw material expenses 0.990 -0.006 0.025 0.041 0.983 57.47 15.41
X6 Tax 0.989 0.003 0.022 -0.009 0.978 57.38 15.39
X3 Depreciation 0.988 0.027 0.010 -0.001 0.977 57.32 15.37
X4 Borrowings 0.987 0.013 -0.014 0.034 0.964 56.97 15.28
X10 Advertisement and marketing expenses
0.982 0.020 0.020 0.004 0.966 56.91 15.26
X7 Interest 0.968 0.037 0.004 0.063 0.943 56.16 15.06
X1 Gross sales 0.044 0.736 0.376 -0.109 0.696 7.71 2.06
X5 Net profits 0.011 0.016 0.854 0.068 0.735 8.84 2.37
X2 Gross fixed assets 0.003 -0.711 0.401 -0.135 0.685 4.15 1.11
X9 Power expenses 0.047 0.010 0.050 0.982 0.969 9.82 2.63
Percentage of variance explained 58.02 10.48 10.36 10.06 Total 372.70 100
Percentage of cumulative variance
explained
58.02 68.52 78.88 88.95

xxii
Investment Climate Indicators of Punjab : Results of Factor Analysis (2004)
variables F1 F2 F3 F4 Communities Weights Percentage of
weights
X8 Raw material expenses 0.998 0.006 0.002 0.053 1.000 77.13 13.75
X9 Power expenses 0.998 0.005 0.002 0.056 0.999 77.13 13.75
X7 Interest 0.998 0.006 0.003 0.052 0.999 77.13 13.75
X3 Depreciation 0.998 0.005 0.001 0.056 0.999 77.13 13.75
X6 Tax 0.998 0.002 0.002 0.056 1.000 77.13 13.75
X4 Borrowings 0.998 0.007 0.001 0.056 0.999 77.13 13.75
X10 Advertisement and
marketing expenses
0.991 0.001 0.007 0.029 0.983 76.59 13.66
X1 Gross sales -0.008 1.000 0.005 0.005 1.000 10.01 1.785
X5 Net profits 0.002 0.005 1.00 0.001 1.000 10.01 0.017
X2 Gross fixed assets 0.078 0.032 0 0.478 1.000 1.18 0.210
Percentage of variance explained 77.29 10.01 10.00 2.47 Total 560.65 100
Percentage of cumulative variance
explained
77.29 87.31 97.31 99.78

xxiii
Investment Climate Indicators of Punjab : Results of Factor Analysis (2005)
variables F1 F2 F3 F4 Communities Weights Percentage of
weights
X4 Borrowings 0.990 0.024 0.097 -0.008 0.989 61.22 14.08
X3 Depreciation 0.988 0.046 0.086 0.008 0.985 61.09 14.05
X9 Power expenses 0.987 0.069 0.092 0.010 0.987 61.03 14.04
X7 Interest 0.986 0.084 0.072 0.002 0.984 60.97 14.03
X8 Raw material expenses 0.981 0.157 0.083 0.007 0.993 60.66 13.95
X6 Tax 0.956 0.019 0.125 0.013 0.929 59.12 13.60
X10 Advertisement and
marketing expenses
0.619 0.543 -0.014 -0.004 0.679 38.73 8.91
X1 Gross sales 0.04 0.945 -0.073 0.025 1.00 11.67 2.68
X2 Gross fixed assets 0.163 -0.079 0.983 0.010 0.999 10.07 2.31
X5 Net profits 0.009 0.023 0.010 1.000 1.000 10.00 0.02
Percentage of variance explained 61.84 12.35 10.25 10.00 Total 434.56 100
Percentage of cumulative variance
explained
61.84 74.20 84.45 94.45

xxiv
Investment Climate Indicators of Punjab : Results of Factor Analysis (2006)
variables F1 F2 F3 F4 Communities Weights Percentage of
weights
X8 Raw material expenses 0.979 0.155 -0.056 0.072 0.991 62.17 15.51
X9 Power expenses 0.968 0.211 -0.049 0.022 0.984 61.47 15.34
X4 Borrowings 0.966 0.230 0.004 0.001 0.987 61.35 15.31
X3 Depreciation 0.963 0.185 0.174 0.044 0.994 61.16 15.26
X7 Interest 0.957 0.212 0.163 0.013 0.987 60.78 15.14
X6 Tax 0.922 0.275 0.002 -0.020 0.927 58.55 14.61
X10 Advertisement and
marketing expenses
0.853 -0.071 -0.091 0.225 0.792 54.17 13.51
X2 Gross fixed assets 0.306 0.938 0.032 -0.041 0.976 10.91 2.72
X5 Net profits 0.028 -0.028 0.997 -0.013 0.996 10.02 2.50
X1 Gross sales 0.083 -0.034 0.012 0.991 0.990 9.98 2.49
Percentage of variance explained 63.51 11.03 10.66 10.42 Total 400.71 100
Percentage of cumulative variance
explained
63.51 75.14 85.81 96.23

xxv
Investment Climate Indicators of Haryana : Results of Factor Analysis (1994)
variables F1 F2 F3 F4 Communities Weights Percentage of
weights
X1 Gross sales 0.908 0.152 0.048 0.063 0.853 20.75 15.76
X6 Tax 0.907 0.106 0.151 0.069 0.863 20.73 15.79
X10 Advertisement and
marketing
0.739 0.220 0.202 0.053 0.638 16.89 12.83
X2 Gross fixed assets 0.241 0.905 0.226 0.143 0.948 15.26 11.59
X8 Raw material expenses 0.002 0.859 0.446 0.145 0.957 14.49 11.00
X4 Borrowing 0.141 0.130 0.769 0.195 0.667 11.50 8.73
X7 Interest 0.038 0.124 0.679 0.139 0.497 10.15 7.71
X5 Net profits 0.109 0.102 0.346 0.238 0.198 5.17 3.92
X9 Power expenses 0.018 0.058 0.091 0.762 0.593 8.97 6.81
X3 Depreciation 0.040 0.051 0.003 0.656 0.434 7.72 5.86
Percentage of variance explained 22.86 16.87 14.96 11.78 Total 131.63 100
Percentage of cumulative variance
explained
22.86 39.74 54.70 66.47

xxvi
Investment Climate Indicators of Haryana : Results of Factor Analysis (1995)
variables F1 F2 F3 F4 Communities Weights Percentage of
weights
X8 Raw material expenses 0.873 0.325 0.115 0.010 0.881 21.23 15.08
X2 Gross fixed assets 0.856 0.289 0.112 0.036 0.830 20.81 14.79
X1 Gross sales 0.763 0.053 0.142 0.032 0.606 18.85 13.39
X7 Interest 0.052 0.841 0.185 0.015 0.745 15.67 11.13
X4 Borrowing -0.245 0.805 0.319 0.027 0.810 15.00 10.66
X3 Depreciation 0.134 0.231 0.794 0.155 0.726 12.92 9.18
X6 Tax 0.380 0.188 0.676 0.025 0.637 11.00 7.81
X9 Power expenses 0.050 0.077 0.595 0.181 0.395 9.68 6.88
X5 Net profits 0.048 0.009 0.075 0.908 0.837 10.26 7.29
X10 Advertisement and
marketing
0.350 0.466 0.013 0.495 0.589 5.59 3.97
Percentage of variance explained 24.32 18.64 16.28 11.30 Total 140.71 100
Percentage of cumulative variance
explained
24.32 42.96 59.29 70.55

xxvii
Investment Climate Indicators of Haryana : Results of Factor Analysis (1996)
variables F1 F2 F3 F4 Communities Weights Percentage of
weights
X8 Raw material expenses 0.906 0.055 0.313 0.174 0.952 23.25 16.05
X2 Gross fixed assets 0.901 0.169 0.246 0.049 0.902 23.13 15.97
X1 Gross sales 0.875 0.099 0.007 0.042 0.778 22.46 15.51
X6 Tax 0.081 0.874 0.010 0.109 0.783 17.51 12.09
X3 Depreciation 0.266 0.772 0.158 0.077 0.698 15.47 10.68
X7 Interest 0.072 0.089 0.866 0.095 0.773 13.44 9.28
X4 Borrowing 0.224 0.600 0.637 0.154 0.840 9.88 6.82
X10 Advertisement and
marketing
0.024 0.141 0.173 0.847 0.769 9.94 6.86
X9 Power expenses 0.051 0.426 0.426 0.530 0.647 6.22 4.29
X5 Net profits 0.183 0.183 0.039 0.300 0.158 3.52 2.43
Percentage of variance explained 25.67 20.04 15.52 11.74 Total 144.82 100
Percentage of cumulative variance
explained
25.67 45.72 61.25 72.99

xxviii
Investment Climate Indicators of Haryana : Results of Factor Analysis (1997)
variables F1 F2 F3 F4 Communities Weights Percentage of
weights
X2 Gross fixed assets 0.907 0.070 0.106 0.029 0.839 20.09 16.18
X1 Gross sales 0.744 0.116 0.011 0.123 0.582 16.48 13.27
X8 Raw material expenses 0.730 0.290 0.496 0.096 0.873 16.17 13.02
X7 Interest 0.288 0.749 0.251 0.071 0.712 11.61 9.35
X5 Net profits 0.050 0.636 0.073 0.142 0.432 9.86 7.94
X3 Depreciation 0.382 0.525 0.224 0.519 0.741 8.13 6.54
X4 Borrowing 0.077 0.281 0.822 0.203 0.802 12.67 10.20
X9 Power expenses 0.059 0.245 0.675 0.190 0.557 10.41 8.38
X10 Advertisement and
marketing
0.051 0.045 0.123 0.733 0.558 9.94 8.00
X6 Tax 0.253 0.256 0.139 0.648 0.569 8.79 7.08
Percentage of variance explained 22.16 15.50 15.42 13.57 Total 124.15 100
Percentage of cumulative variance explained
22.16 37.66 53.08 66.05

xxix
Investment Climate Indicators of Haryana : Results of Factor Analysis (1998)
variables F1 F2 F3 F4 Communities Weights Percentage of
weights
X2 Gross fixed assets 0.879 0.130 0.219 0.058 0.840 21.23 15.13
X8 Raw material expenses 0.794 0.502 0.014 0.042 0.884 19.13 13.64
X3 Depreciation 0.709 0.053 0.353 0.084 0.037 17.13 12.21
X5 Net profits 0.385 0.180 0.219 0.058 0.840 9.30 6.63
X4 Borrowing 0.153 0.881 0.114 0.137 0.831 16.14 11.51
X7 Interest 0.009 0.827 0.091 0.034 0.694 15.15 10.80
X6 Tax 0.053 0.026 0.899 0.008 0.812 14.86 10.59
X1 Gross sales 0.577 0.077 0.673 0.081 0.800 11.12 7.92
X9 Power expenses 0.018 0.205 0.195 0.805 0.728 8.96 6.38
X10 Advertisement and
marketing
0.044 0.142 0.391 0.650 0.597 7.23 5.15
Percentage of variance explained 24.16 18.32 16.53 11.13 Total 140.25 100
Percentage of cumulative variance
explained
24.16 42.48 59.02 70.15

xxx
Investment Climate Indicators of Haryana : Results of Factor Analysis (1999)
variables F1 F2 F3 F4 Communities Weights Percentage of
weights
X8 Raw material expenses 0.898 0.139 0.262 0.063 0.898 18.64 13.60
X2 Gross fixed assets 0.817 0.285 0.159 0.217 0.822 16.96 12.38
X5 Net profits 0.536 0.075 0.106 0.219 0.352 11.12 8.11
X9 Power expenses 0.102 0.898 0.075 0.032 0.823 17.05 12.44
X1 Gross sales 0.132 0.895 0.042 0.047 0.823 16.99 12.40
X7 Interest 0.146 0.068 0.923 0.230 0.931 15.71 11.46
X3 Depreciation 0.063 0.110 0.844 0.298 0.817 14.37 10.48
X6 Tax 0.154 0.167 0.018 0.743 0.603 10.49 7.65
X4 Borrowing 0.452 0.281 0.132 0.587 0.646 8.29 6.05
X10 Advertisement and
marketing
0.180 0.249 0.088 0.523 0.378 7.39 5.39
Percentage of variance explained 20.76 18.99 17.03 14.13 Total 137.01 100
Percentage of cumulative variance explained
20.76 39.79 56.78 70.92

xxxi
Investment Climate Indicators of Haryana : Results of Factor Analysis (2001)
variables F1 F2 F3 F4 Communities Weights Percentage of
weights
X1 Gross sales 0.863 -0.031 -0.248 0.002 0.806 18.46 12.38
X10 Advertisement and
marketing
0.816 -0.05 -0.137 0.136 0.702 17.45 11.70
X6 Tax 0.698 -0.042 0.305 -0.086 0.629 14.93 10.01
X7 Interest 0.088 0.893 0.102 0.118 0.830 18.16 12.18
X4 Borrowing -0.347 0.674 0.194 -0.372 0.751 13.71 9.19
X5 Net profits 0.003 0.684 0.072 0.055 0.457 13.91 9.33
X8 Raw material expenses 0.122 -0.523 0.811 -0.075 0.952 15.41 10.33
X3 Depreciation 0.176 -0.172 0.584 -0.266 0.471 11.10 7.44
X2 Gross fixed assets -0.259 0.057 0.798 -0.173 0.737 15.17 10.17
X9 Power expenses 0.052 0.063 0.034 0.933 0.877 10.75 7.21
Percentage of variance explained 21.39 20.34 19.01 11.57 Total 149.09 100
Percentage of cumulative variance explained
21.39 41.74 60.75 72.32

xxxii
Investment Climate Indicators of Haryana : Results of Factor Analysis (2002) variables F1 F2 F3 F4 Communities Weights Percentage of
weights
X9 Power expenses 0.931 0.103 0.124 0.046 0.894 18.35 14.58
X10 Advertisement and
marketing
0.930 0.057 0.060 0.105 0.882 18.33 14.56
X2 Gross fixed assets 0.260 0.671 0.040 0.513 0.782 11.54 9.17
X3 Depreciation 0.060 0.663 0.112 0.066 0.460 11.40 9.06
X5 Net profits 0.039 0.402 0.038 0.006 0.105 6.91 5.49
X7 Interest 0.076 0.190 0.831 0.219 0.780 14.26 11.33
X4 Borrowing 0.188 0.318 0.812 0.028 0.796 13.93 11.07
X1 Gross sales 0.159 0.131 0.099 0.834 0.747 14.31 11.37
X6 Tax 0.168 0.088 0.116 0.777 0.653 12.97 10.30
X8 Raw material expenses 0.271 0.702 0.556 0.228 0.928 3.83 3.04
Percentage of variance explained 19.71 17.20 17.16 16.80 Total 125.83 100
Percentage of cumulative variance
explained
19.71 36.92 54.08 70.88

xxxiii
Investment Climate Indicators of Haryana : Results of Factor Analysis (2003) variables F1 F2 F3 F4 Communities Weights Percentage of
weights
X2 Gross fixed assets 0.837 0.009 0.294 0.312 0.885 17.00 12.11
X3 Depreciation 0.794 0.022 0.148 0.252 0.716 16.12 11.48
X8 Raw material expenses 0.771 0.571 0.002 0.156 0.945 15.66 11.16
X4 Borrowing 0.146 0.895 0.167 0.038 0.852 17.25 12.29
X7 Interest 0.034 0.852 0.124 0.063 0.747 16.42 11.70
X6 Tax 0.070 0.015 0.802 0.255 0.714 14.76 10.51
X5 Net profits 0.181 0.052 0.784 0.013 0.650 14.43 10.28
X9 Power expenses 0.110 0.197 0.596 0.452 0.610 10.97 7.81
X1 Gross sales 0.123 0.021 0.058 0.734 0.557 9.85 7.02
X10 Advertisement and marketing
0.138 0.178 0.271 0.587 0.465 7.88 5.61
Percentage of variance explained 20.31 19.28 18.41 13.43 Total 140.34 100
Percentage of cumulative variance
explained
20.31 39.59 58.01 71.44

xxxiv
Investment Climate Indicators of Haryana : Results of Factor Analysis (2004)
variables F1 F2 F3 F4 Communities Weights Percentage of
weights
X2 Gross fixed assets 0.894 0.079 0.007 0.123 0.820 19.01 15.88
X8 Raw material expenses 0.744 0.568 0.042 0.083 0.885 15.82 13.22
X1 Gross sales 0.676 0.018 0.402 0.059 0.623 14.38 12.01
X3 Depreciation 0.555 0.006 0.212 0.218 0.401 11.80 9.86
X4 Borrowing 0.035 0.912 0.103 0.180 0.870 18.61 15.55
X7 Interest 0.033 0.855 0.072 0.230 0.791 17.45 14.58
X6 Tax 0.022 0.179 0.056 0.051 0.405 3.65 3.05
X9 Power expenses 0.086 0.271 0.672 0.280 0.611 8.71 7.27
X10 Advertisement and
marketing
0.025 0.197 0.436 0.278 0.308 5.65 4.72
X5 Net profits 0.003 0.061 0.001 0.905 0.823 4.60 3.84
Percentage of variance explained 21.27 20.41 12.96 11.36 Total 119.68 100
Percentage of cumulative variance
explained
21.27 41.68 54.05 66.02

xxxv
Investment Climate Indicators of Haryana : Results of Factor Analysis (2005)
variables F1 F2 F3 F4 Communities Weights Percentage of
weights
X2 Gross fixed assets 0.926 0.145 0.099 0.006 0.889 18.91 14.23
X3 Depreciation 0.885 0.059 0.009 0.023 0.787 18.07 13.59
X9 Power expenses 0.015 0.935 0.009 0.002 0.874 18.81 14.00
X1 Gross sales 0.170 0.895 0.089 0.019 0.838 17.82 13.41
X7 Interest 0.061 0.317 0.586 0.030 0.498 6.31 4.74
X8 Raw material expenses 0.363 0.242 0.775 0.033 0.792 14.38 10.82
X4 Borrowing 0.451 0.343 0.702 0.051 0.904 14.14 10.64
X6 Tax 0.177 0.116 0.407 0.134 0.228 7.55 5.68
X10 Advertisement and
marketing
0.025 0.035 0.385 0.060 0.154 7.14 5.37
X5 Net profits 0.034 0.022 0.030 0.989 0.982 9.95 7.48
Percentage of variance explained 20.42 19.91 18.56 10.06 Total 132.88 100
Percentage of cumulative variance
explained
20.42 40.33 58.90 68.96

xxxvi
Investment Climate Indicators of Haryana : Results of Factor Analysis (2006)
variables F1 F2 F3 F4 Communities Weights Percentage of
weights
X4 Borrowing 0.776 0.347 0.335 0.287 0.916 14.67 12.74
X9 Power expenses 0.693 0.158 0.355 0.293 0.717 13.01 11.38
X8 Raw material expenses 0.689 0.492 0.212 0.178 0.793 12.94 11.32
X5 Net profits 0.437 0.036 0.286 0.066 0.279 8.20 7.17
X2 Gross fixed assets 0.259 0.819 0.091 0.188 0.779 15.28 13.36
X1 Gross sales 0.054 0.707 0.229 0.110 0.567 13.19 11.54
X6 Tax 0.069 0.090 0.793 0.106 0.654 12.50 10.93
X10 Advertisement and
marketing
0.159 0.124 0.672 0.021 0.493 10.59 9.26
X7 Interest 0.174 0.520 0.260 -0.303 0.461 4.10 3.58
X3 Depreciation 0.060 0.114 0.056 0.880 0.799 9.93 8.68
Percentage of variance explained 18.78 18.66 15.77 11.29 Total 114.31 100
Percentage of cumulative variance
explained
18.78 37.45 53.22 64.52